|
||||||||||||||||||||
| |
| Phenotypic Information (metabolism pathway, cancer, disease, phenome) |
| |
| |
| Gene-Gene Network Information: Co-Expression Network, Interacting Genes & KEGG |
| |
|


| Gene Summary for G6PD |
| Basic gene info. | Gene symbol | G6PD |
| Gene name | glucose-6-phosphate dehydrogenase | |
| Synonyms | G6PD1 | |
| Cytomap | UCSC genome browser: Xq28 | |
| Genomic location | chrX :153759605-153775787 | |
| Type of gene | protein-coding | |
| RefGenes | NM_000402.4, NM_001042351.2, | |
| Ensembl id | ENSG00000269087 | |
| Description | glucose-6-phosphate 1-dehydrogenase | |
| Modification date | 20141222 | |
| dbXrefs | MIM : 305900 | |
| HGNC : HGNC | ||
| Ensembl : ENSG00000160211 | ||
| HPRD : 02377 | ||
| Vega : OTTHUMG00000024237 | ||
| Protein | UniProt: P11413 go to UniProt's Cross Reference DB Table | |
| Expression | CleanEX: HS_G6PD | |
| BioGPS: 2539 | ||
| Gene Expression Atlas: ENSG00000269087 | ||
| The Human Protein Atlas: ENSG00000269087 | ||
| Pathway | NCI Pathway Interaction Database: G6PD | |
| KEGG: G6PD | ||
| REACTOME: G6PD | ||
| ConsensusPathDB | ||
| Pathway Commons: G6PD | ||
| Metabolism | MetaCyc: G6PD | |
| HUMANCyc: G6PD | ||
| Regulation | Ensembl's Regulation: ENSG00000269087 | |
| miRBase: chrX :153,759,605-153,775,787 | ||
| TargetScan: NM_000402 | ||
| cisRED: ENSG00000269087 | ||
| Context | iHOP: G6PD | |
| cancer metabolism search in PubMed: G6PD | ||
| UCL Cancer Institute: G6PD | ||
| Assigned class in ccmGDB | A - This gene has a literature evidence and it belongs to cancer gene. | |
| References showing role of G6PD in cancer cell metabolism | 1. Martin-Bernabe A, Cortes R, Lehmann SG, Seve M, Cascante M, et al. (2014) Quantitative proteomic approach to understand metabolic adaptation in non-small cell lung cancer. J Proteome Res 13: 4695-4704. doi: 10.1021/pr500327v. go to article 2. D'Alessandro A, Amelio I, Berkers CR, Antonov A, Vousden KH, et al. (2014) Metabolic effect of TAp63alpha: enhanced glycolysis and pentose phosphate pathway, resulting in increased antioxidant defense. Oncotarget 5: 7722-7733. pmid: 4202156. go to article 3. Cai T, Kuang Y, Zhang C, Zhang Z, Chen L, et al. (2015) Glucose-6-phosphate dehydrogenase and NADPH oxidase 4 control STAT3 activity in melanoma cells through a pathway involving reactive oxygen species, c-SRC and SHP2. Am J Cancer Res 5: 1610-1620. pmid: 4497430. go to article 4. Coda DM, Lingua MF, Morena D, Foglizzo V, Bersani F, et al. (2015) SMYD1 and G6PD modulation are critical events for miR-206-mediated differentiation of rhabdomyosarcoma. Cell Cycle 14: 1389-1402. doi: 10.1080/15384101.2015.1005993. go to article 5. Aird KM, Worth AJ, Snyder NW, Lee JV, Sivanand S, et al. (2015) ATM couples replication stress and metabolic reprogramming during cellular senescence. Cell Rep 11: 893-901. doi: 10.1016/j.celrep.2015.04.014. pmid: 4431925. go to article | |
| Top |
| Phenotypic Information for G6PD(metabolism pathway, cancer, disease, phenome) |
| Cancer | CGAP: G6PD |
| Familial Cancer Database: G6PD | |
| * This gene is included in those cancer gene databases. |
|
|
|
|
|
| . | ||||||||||||||
Oncogene 1 | Significant driver gene in | |||||||||||||||||||
| cf) number; DB name 1 Oncogene; http://nar.oxfordjournals.org/content/35/suppl_1/D721.long, 2 Tumor Suppressor gene; https://bioinfo.uth.edu/TSGene/, 3 Cancer Gene Census; http://www.nature.com/nrc/journal/v4/n3/abs/nrc1299.html, 4 CancerGenes; http://nar.oxfordjournals.org/content/35/suppl_1/D721.long, 5 Network of Cancer Gene; http://ncg.kcl.ac.uk/index.php, 1Therapeutic Vulnerabilities in Cancer; http://cbio.mskcc.org/cancergenomics/statius/ |
| KEGG_GLUTATHIONE_METABOLISM REACTOME_METABOLISM_OF_CARBOHYDRATES | |
| OMIM | 300908; phenotype. 305900; gene. |
| Orphanet | 362; Glucose-6-phosphate-dehydrogenase deficiency. |
| Disease | KEGG Disease: G6PD |
| MedGen: G6PD (Human Medical Genetics with Condition) | |
| ClinVar: G6PD | |
| Phenotype | MGI: G6PD (International Mouse Phenotyping Consortium) |
| PhenomicDB: G6PD | |
| Mutations for G6PD |
| * Under tables are showing count per each tissue to give us broad intuition about tissue specific mutation patterns.You can go to the detailed page for each mutation database's web site. |
| There's no structural variation information in COSMIC data for this gene. |
| * From mRNA Sanger sequences, Chitars2.0 arranged chimeric transcripts. This table shows G6PD related fusion information. |
| ID | Head Gene | Tail Gene | Accession | Gene_a | qStart_a | qEnd_a | Chromosome_a | tStart_a | tEnd_a | Gene_a | qStart_a | qEnd_a | Chromosome_a | tStart_a | tEnd_a |
| BQ352059 | G6PD | 1 | 68 | X | 153760922 | 153761445 | G6PD | 64 | 426 | X | 153761161 | 153762335 | |
| CA419747 | ANAPC5 | 18 | 105 | 12 | 121746160 | 121746247 | G6PD | 105 | 789 | X | 153760136 | 153761273 | |
| M12996 | G6PD | 1 | 1671 | X | 153759627 | 153763408 | PRKCA | 1664 | 2439 | 17 | 64806066 | 64806841 | |
| BE816962 | G6PD | 8 | 152 | X | 153761181 | 153761325 | G6PD | 145 | 294 | X | 153761805 | 153762319 | |
| BM688674 | G6PD | 19 | 72 | X | 153759606 | 153759659 | G6PD | 64 | 236 | X | 153759955 | 153760127 | |
| Top |
| There's no copy number variation information in COSMIC data for this gene. |
| Top |
|
 |
| Top |
| Stat. for Non-Synonymous SNVs (# total SNVs=45) | (# total SNVs=9) |
 |  |
(# total SNVs=1) | (# total SNVs=0) |
 |
| Top |
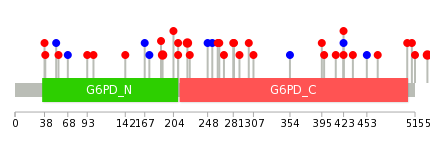
| * When you move the cursor on each content, you can see more deailed mutation information on the Tooltip. Those are primary_site,primary_histology,mutation(aa),pubmedID. |
| GRCh37 position | Mutation(aa) | Unique sampleID count |
| chr23:153761236-153761236 | p.D324D | 3 |
| chr23:153762623-153762623 | p.R192C | 2 |
| chr23:153760891-153760891 | p.R393L | 2 |
| chr23:153760654-153760654 | p.Y437Y | 2 |
| chr23:153760228-153760228 | p.P512H | 2 |
| chr23:153760229-153760229 | p.P512S | 2 |
| chr23:153760854-153760854 | p.M405I | 1 |
| chr23:153761231-153761231 | p.P326L | 1 |
| chr23:153763502-153763502 | p.N122K | 1 |
| chr23:153760236-153760236 | p.W509* | 1 |
| Top |
|
 |
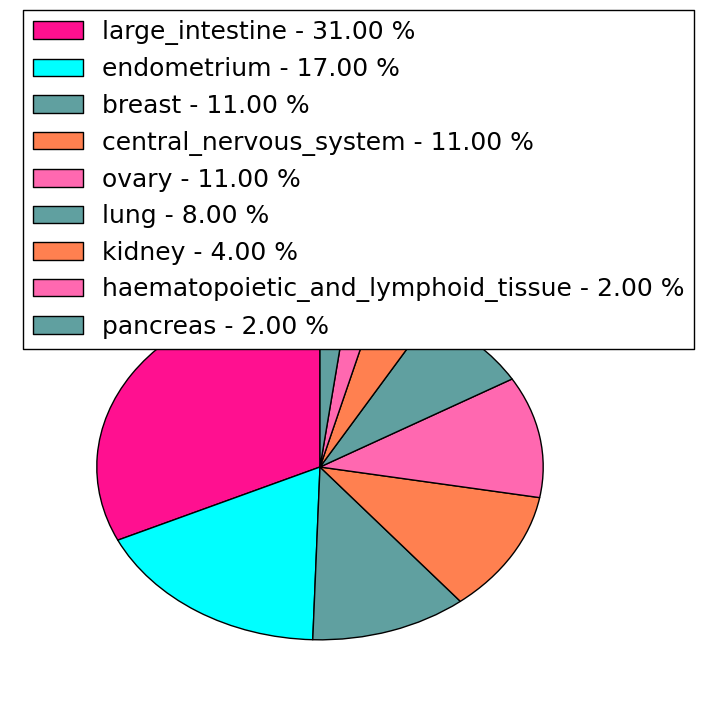
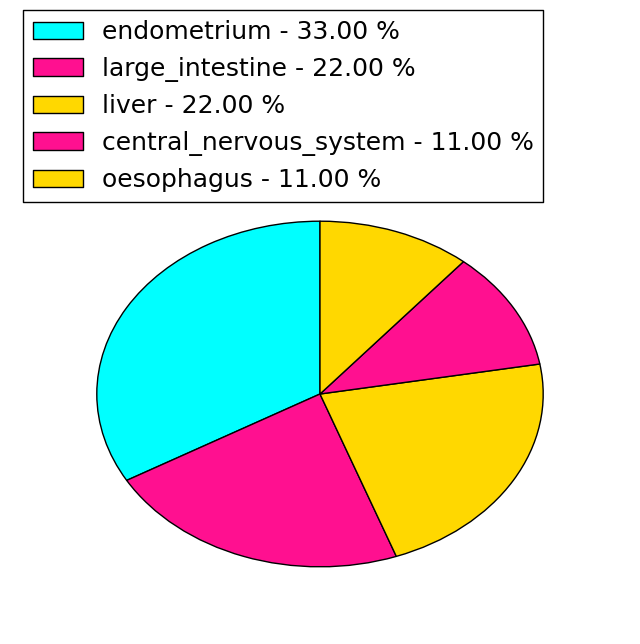
| Point Mutation/ Tissue ID | 1 | 2 | 3 | 4 | 5 | 6 | 7 | 8 | 9 | 10 | 11 | 12 | 13 | 14 | 15 | 16 | 17 | 18 | 19 | 20 |
| # sample | 1 | 1 | 13 | 1 | 2 | 2 | 2 | 1 | 4 | 5 | 2 | 1 | 8 | |||||||
| # mutation | 1 | 1 | 12 | 1 | 2 | 2 | 2 | 1 | 5 | 5 | 2 | 1 | 10 | |||||||
| nonsynonymous SNV | 1 | 12 | 1 | 1 | 2 | 2 | 1 | 5 | 4 | 1 | 7 | |||||||||
| synonymous SNV | 1 | 1 | 1 | 1 | 1 | 3 |
| cf) Tissue ID; Tissue type (1; BLCA[Bladder Urothelial Carcinoma], 2; BRCA[Breast invasive carcinoma], 3; CESC[Cervical squamous cell carcinoma and endocervical adenocarcinoma], 4; COAD[Colon adenocarcinoma], 5; GBM[Glioblastoma multiforme], 6; Glioma Low Grade, 7; HNSC[Head and Neck squamous cell carcinoma], 8; KICH[Kidney Chromophobe], 9; KIRC[Kidney renal clear cell carcinoma], 10; KIRP[Kidney renal papillary cell carcinoma], 11; LAML[Acute Myeloid Leukemia], 12; LUAD[Lung adenocarcinoma], 13; LUSC[Lung squamous cell carcinoma], 14; OV[Ovarian serous cystadenocarcinoma ], 15; PAAD[Pancreatic adenocarcinoma], 16; PRAD[Prostate adenocarcinoma], 17; SKCM[Skin Cutaneous Melanoma], 18:STAD[Stomach adenocarcinoma], 19:THCA[Thyroid carcinoma], 20:UCEC[Uterine Corpus Endometrial Carcinoma]) |
| Top |
| * We represented just top 10 SNVs. When you move the cursor on each content, you can see more deailed mutation information on the Tooltip. Those are primary_site, primary_histology, mutation(aa), pubmedID. |
| Genomic Position | Mutation(aa) | Unique sampleID count |
| chrX:153760891 | p.R423H,G6PD | 2 |
| chrX:153762623 | p.R222C,G6PD | 2 |
| chrX:153760228 | p.P542H,G6PD | 2 |
| chrX:153760229 | p.P542T,G6PD | 2 |
| chrX:153774349 | p.F531L,G6PD | 1 |
| chrX:153762323 | p.V289M,G6PD | 1 |
| chrX:153760233 | p.P173P,G6PD | 1 |
| chrX:153763395 | p.F531L,G6PD | 1 |
| chrX:153760920 | p.E282Q,G6PD | 1 |
| chrX:153762329 | p.L167L,G6PD | 1 |
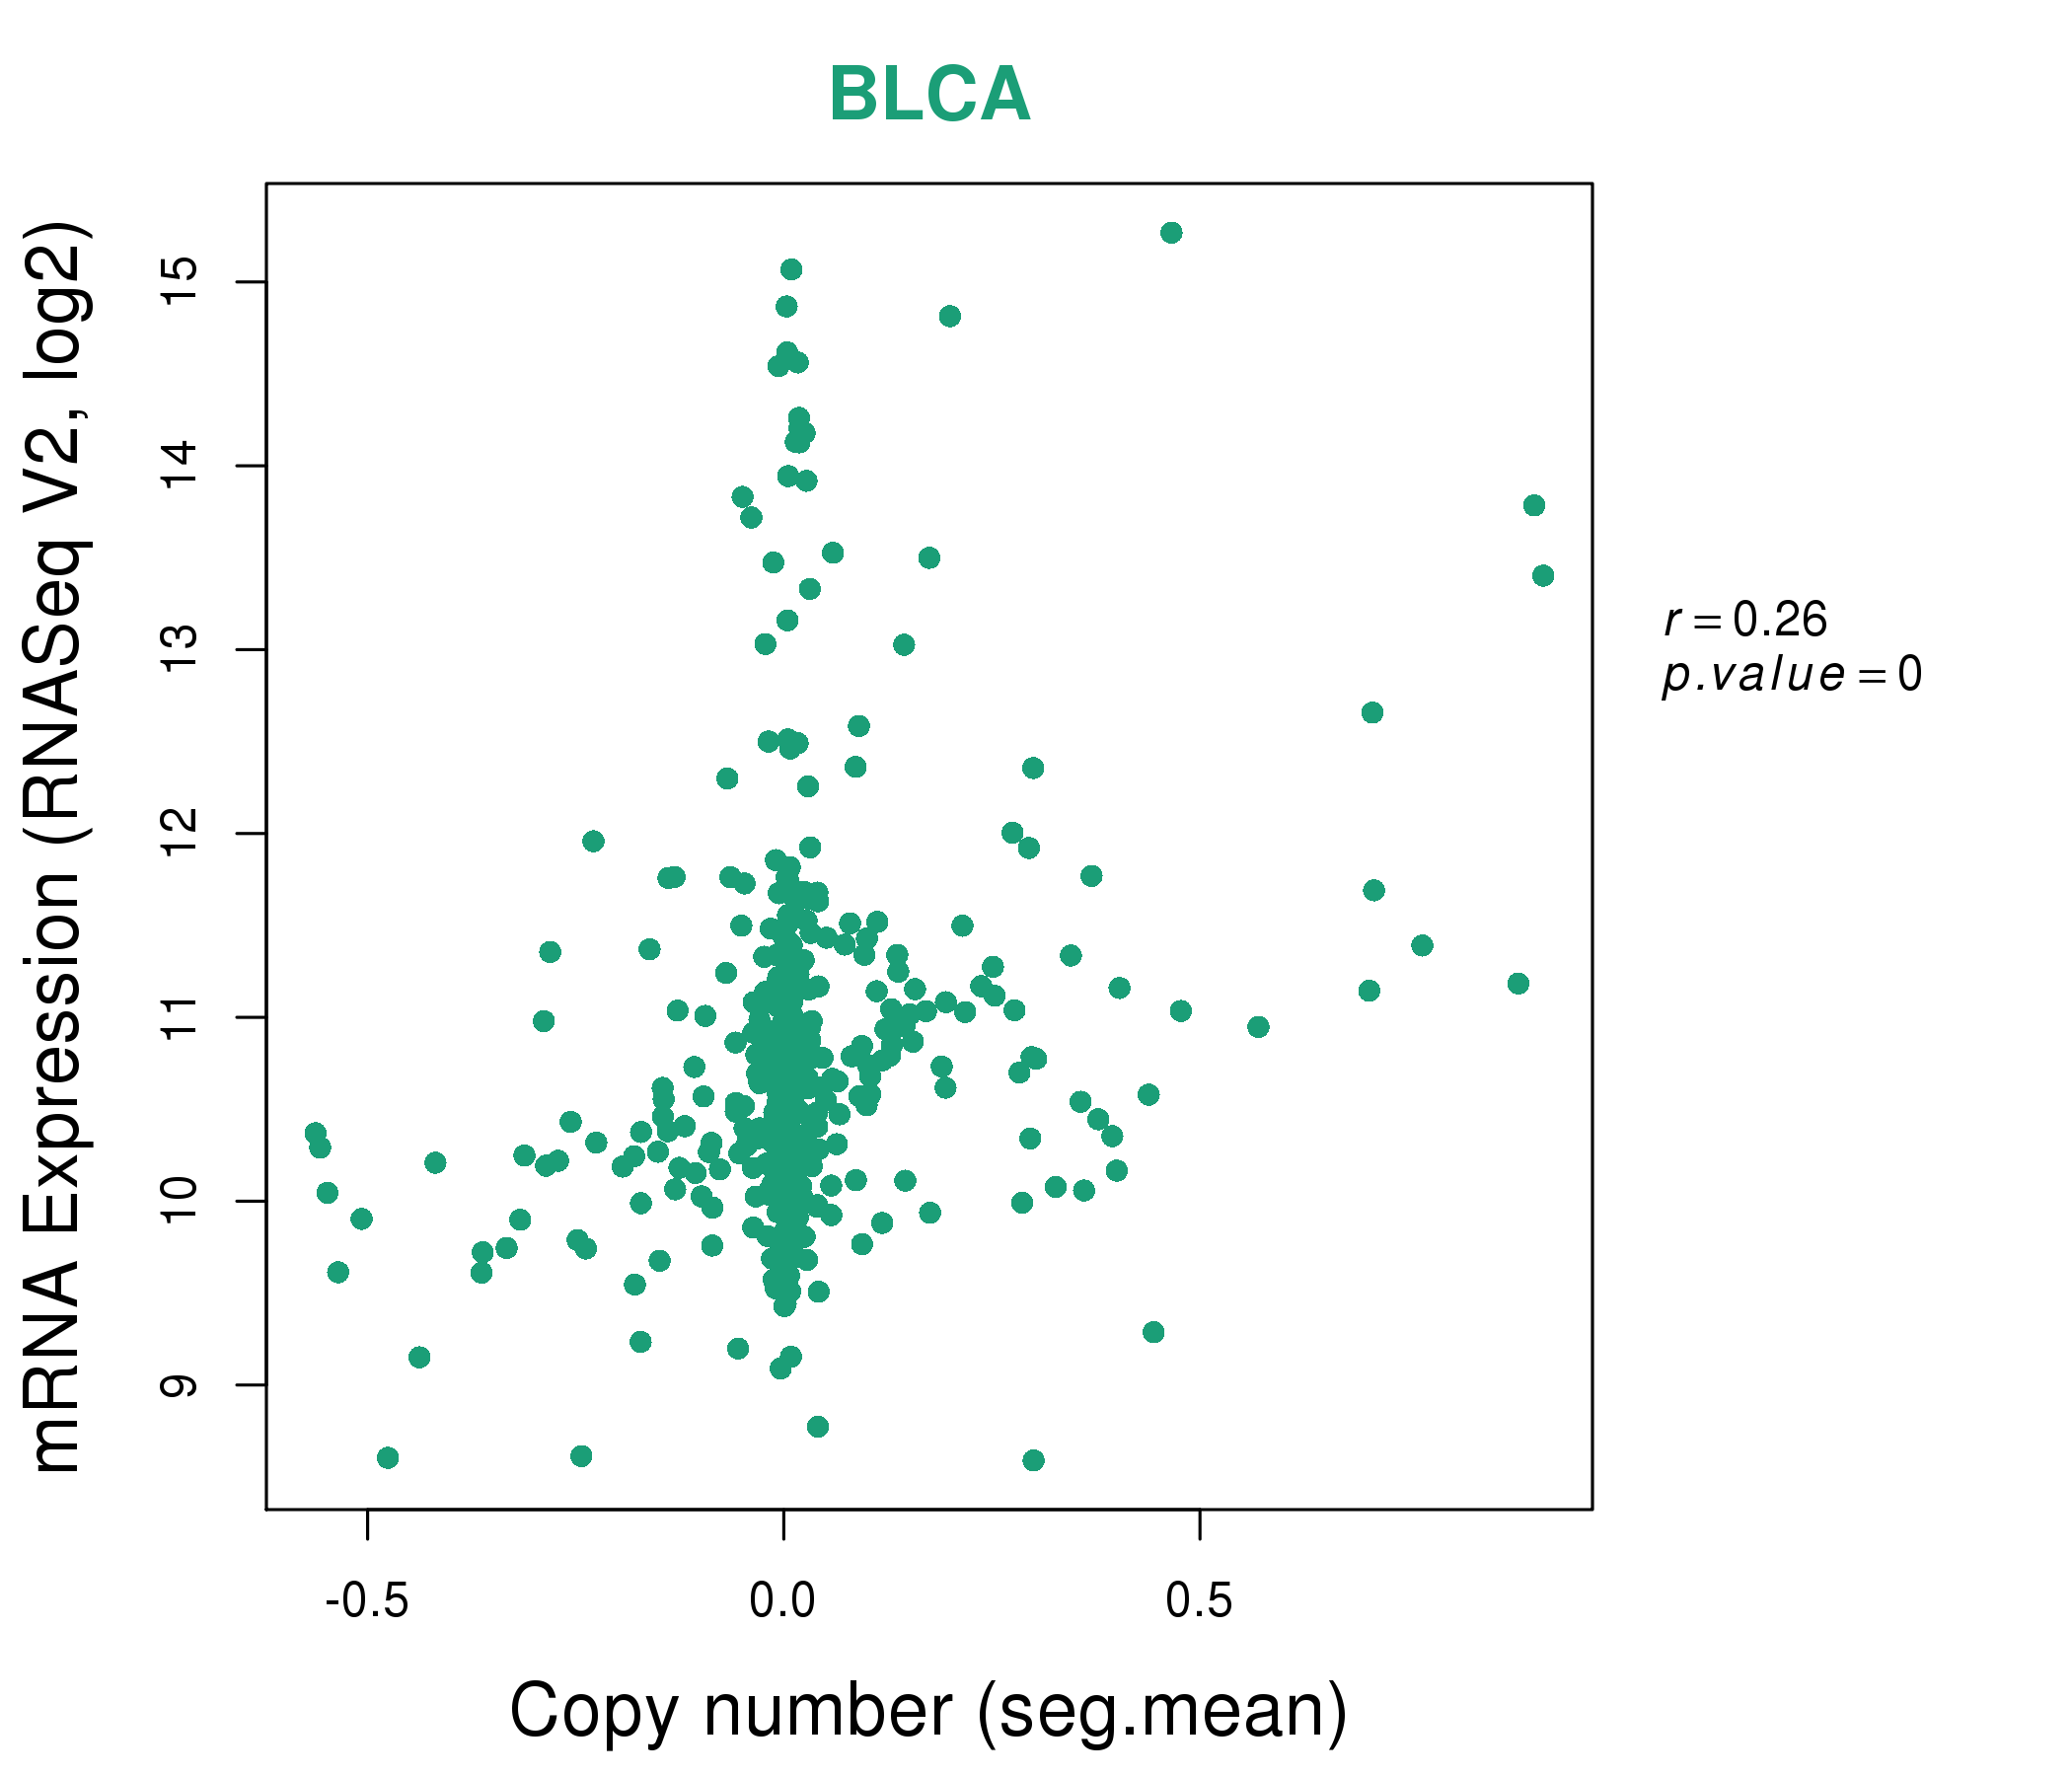
| * Copy number data were extracted from TCGA using R package TCGA-Assembler. The URLs of all public data files on TCGA DCC data server were gathered on Jan-05-2015. Function ProcessCNAData in TCGA-Assembler package was used to obtain gene-level copy number value which is calculated as the average copy number of the genomic region of a gene. |
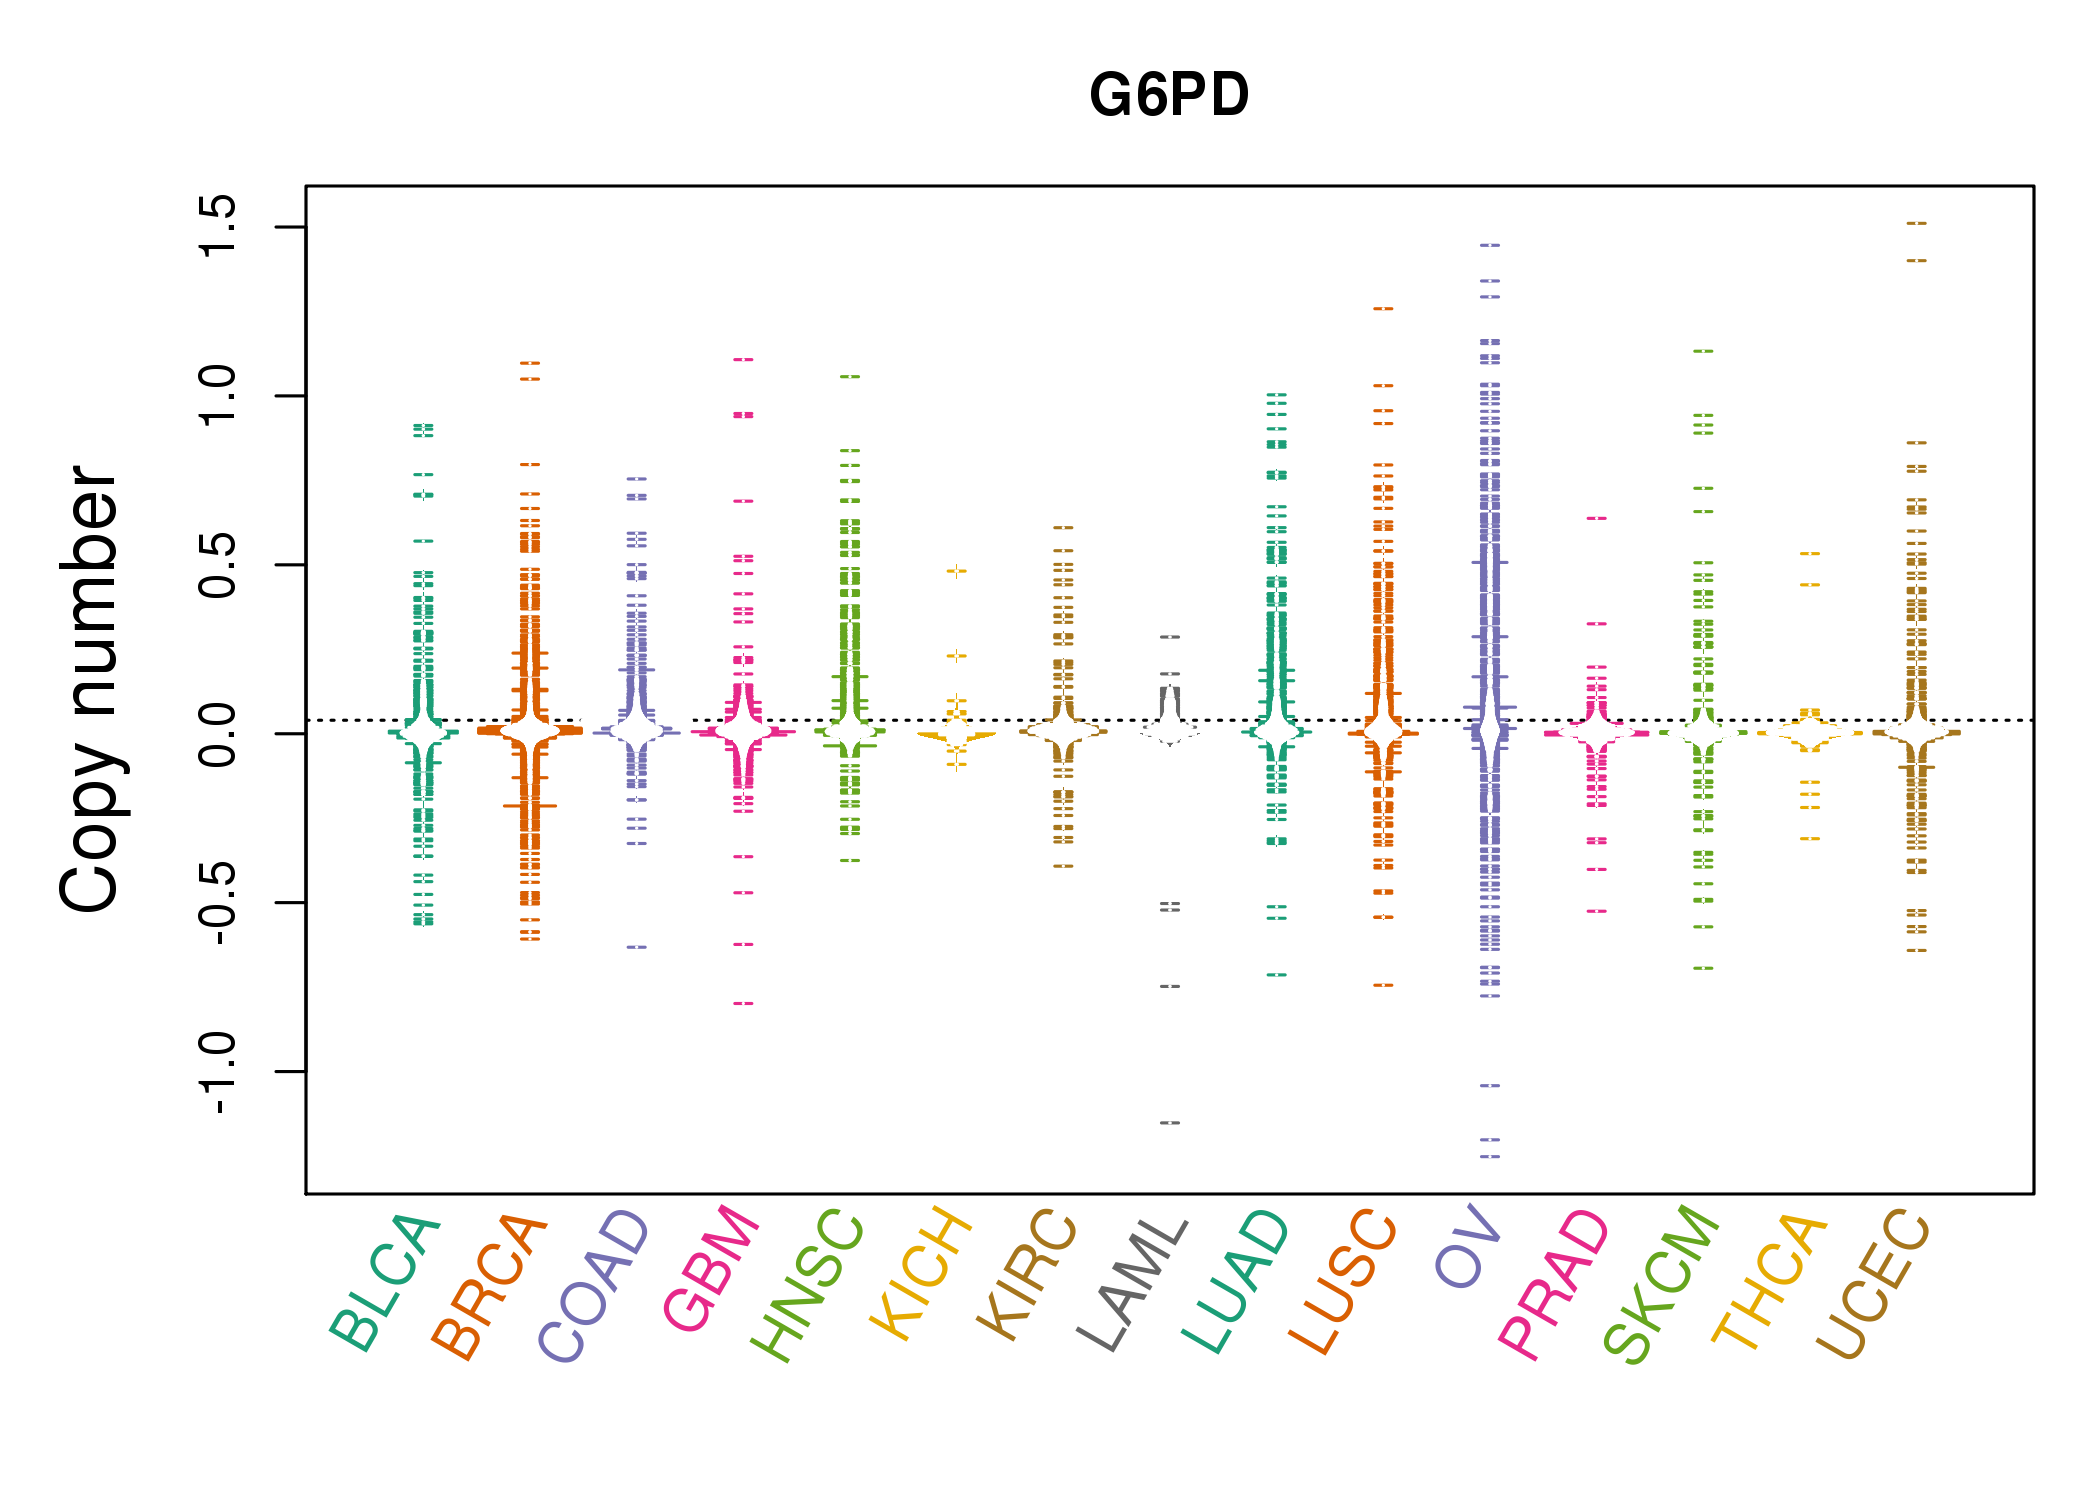 |
| cf) Tissue ID[Tissue type]: BLCA[Bladder Urothelial Carcinoma], BRCA[Breast invasive carcinoma], CESC[Cervical squamous cell carcinoma and endocervical adenocarcinoma], COAD[Colon adenocarcinoma], GBM[Glioblastoma multiforme], Glioma Low Grade, HNSC[Head and Neck squamous cell carcinoma], KICH[Kidney Chromophobe], KIRC[Kidney renal clear cell carcinoma], KIRP[Kidney renal papillary cell carcinoma], LAML[Acute Myeloid Leukemia], LUAD[Lung adenocarcinoma], LUSC[Lung squamous cell carcinoma], OV[Ovarian serous cystadenocarcinoma ], PAAD[Pancreatic adenocarcinoma], PRAD[Prostate adenocarcinoma], SKCM[Skin Cutaneous Melanoma], STAD[Stomach adenocarcinoma], THCA[Thyroid carcinoma], UCEC[Uterine Corpus Endometrial Carcinoma] |
| Top |
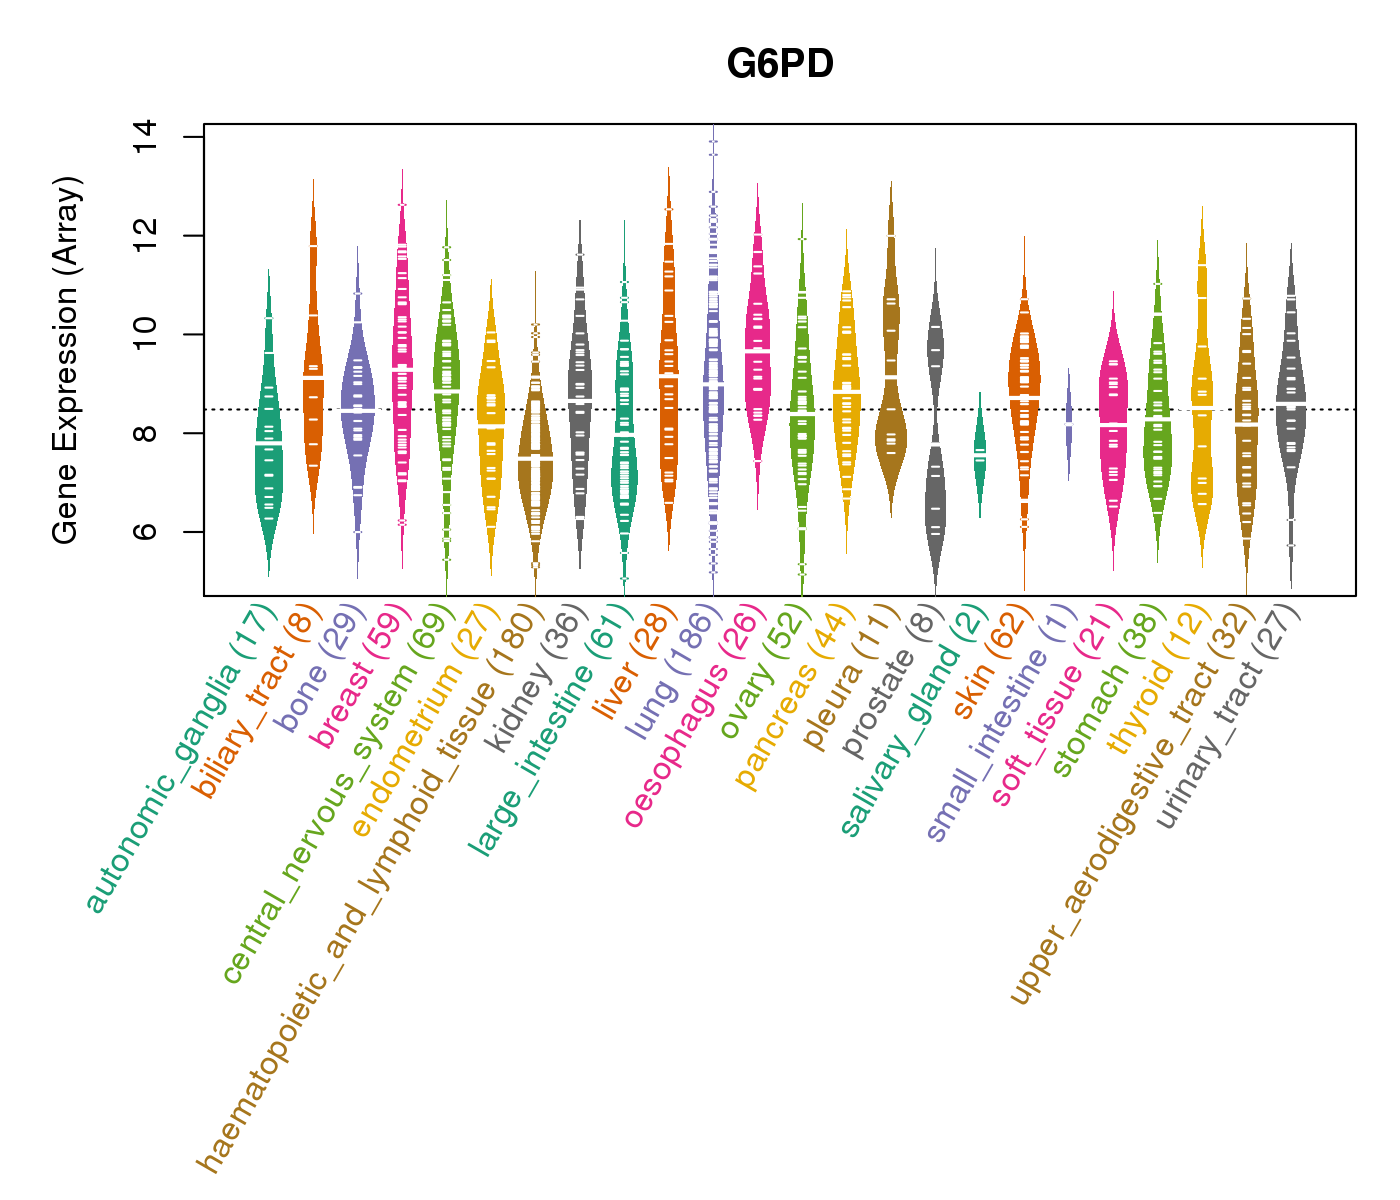
| Gene Expression for G6PD |
| * CCLE gene expression data were extracted from CCLE_Expression_Entrez_2012-10-18.res: Gene-centric RMA-normalized mRNA expression data. |
 |
| Top |
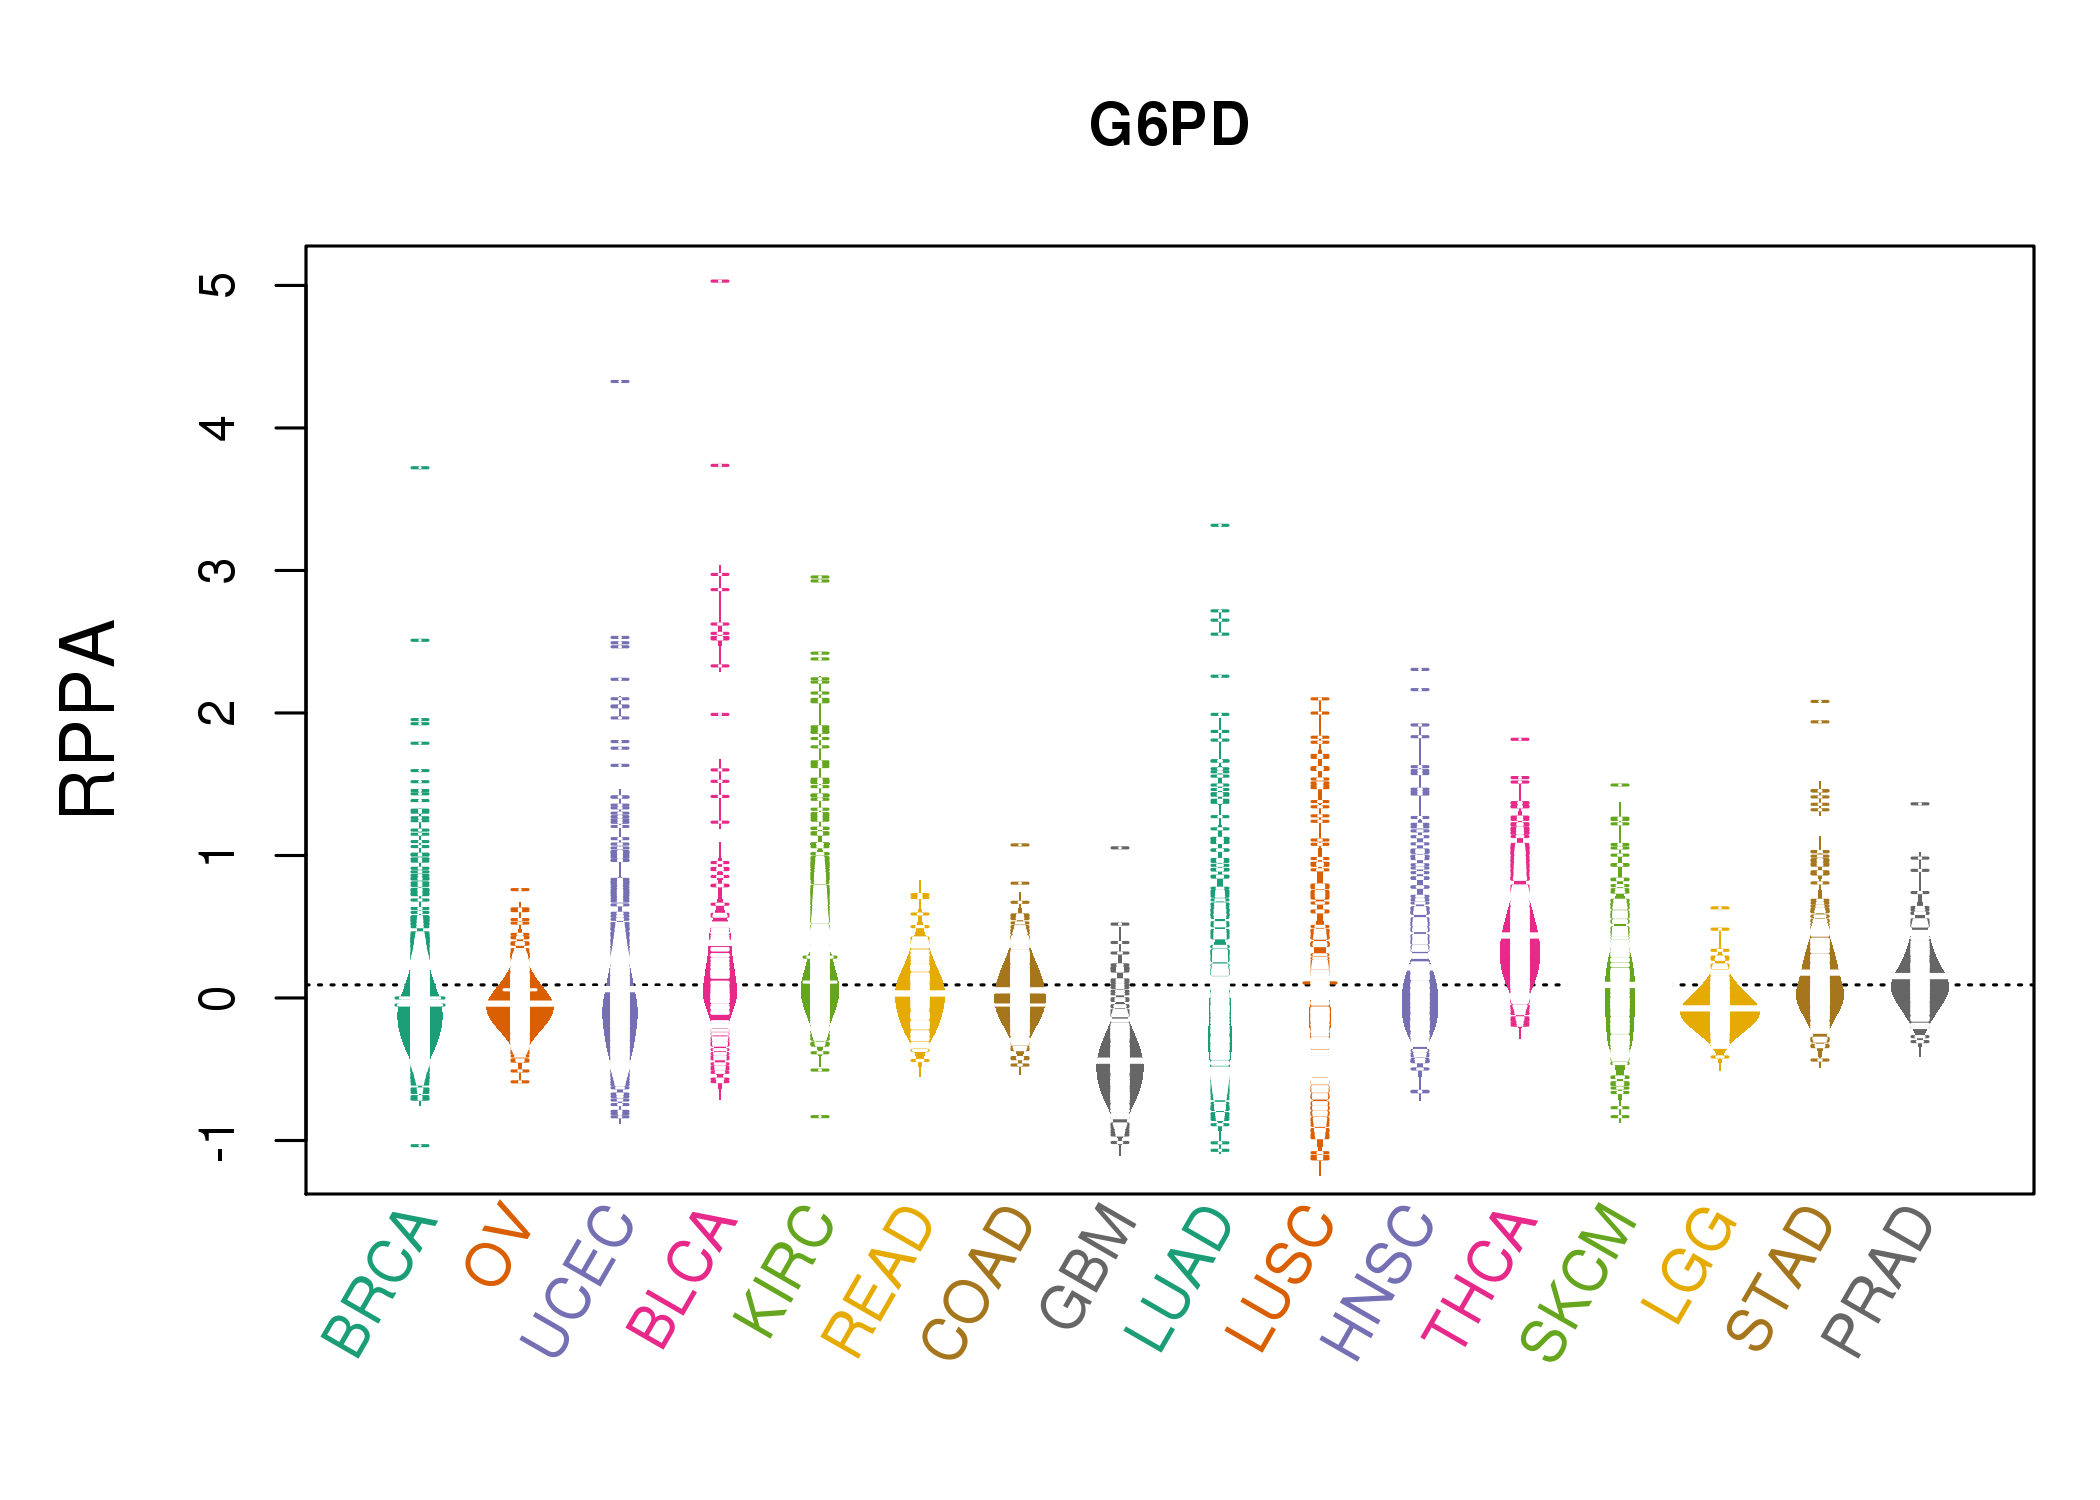
| *RPPA protein expression data were extracted from TCPA (The Cancer Proteome Atlas). Normalized data based on replicated based normalization (RBN) was used to draw following figures. |
 |
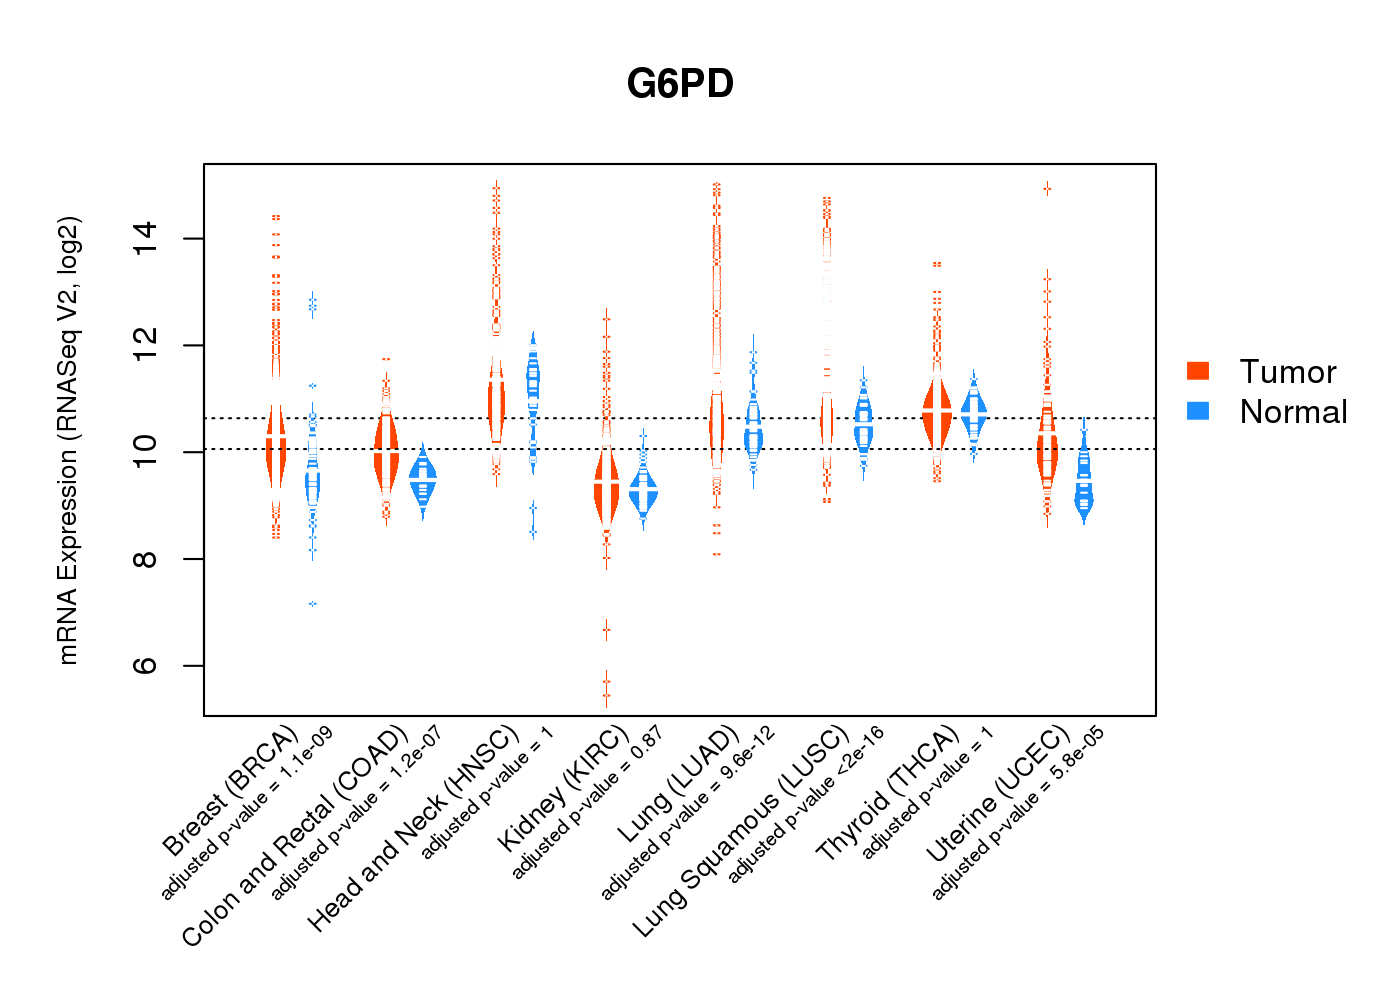
| * Normalized gene expression data of RNASeqV2 was extracted from TCGA using R package TCGA-Assembler. The URLs of all public data files on TCGA DCC data server were gathered at Jan-05-2015. Only eight cancer types have enough normal control samples for differential expression analysis. (t test, adjusted p<0.05 (using Benjamini-Hochberg FDR)) |
 |
| Top |
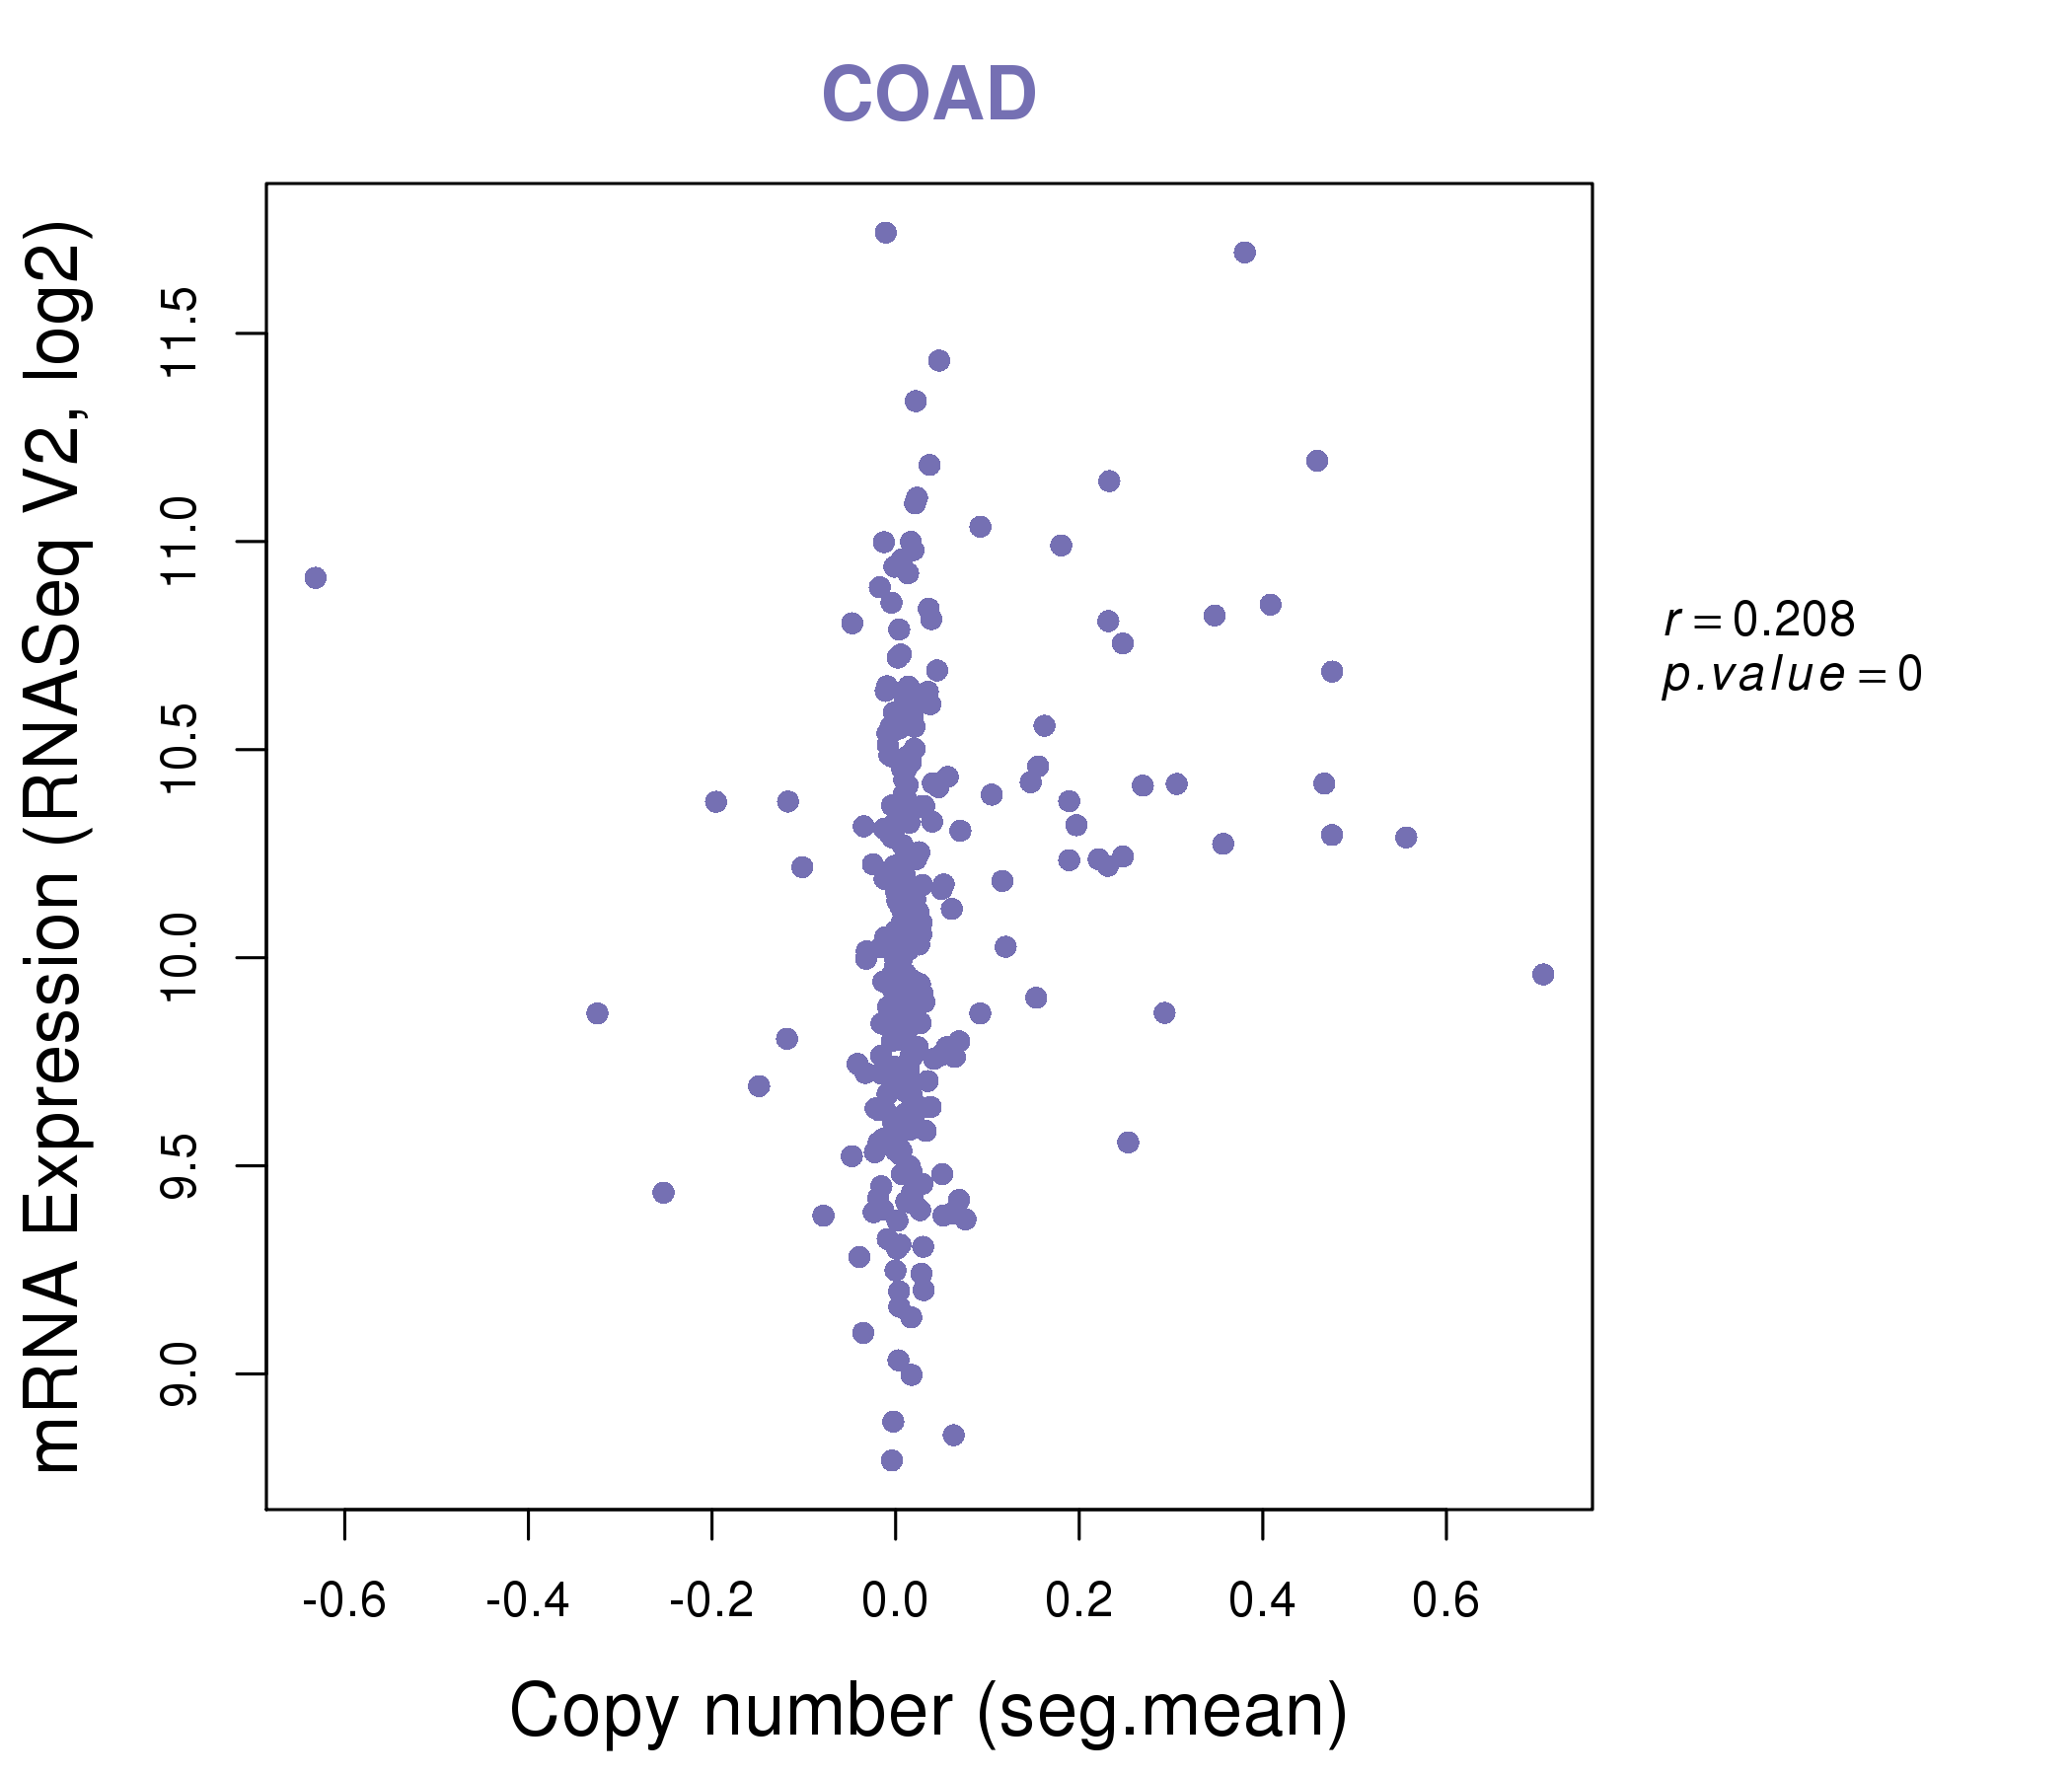
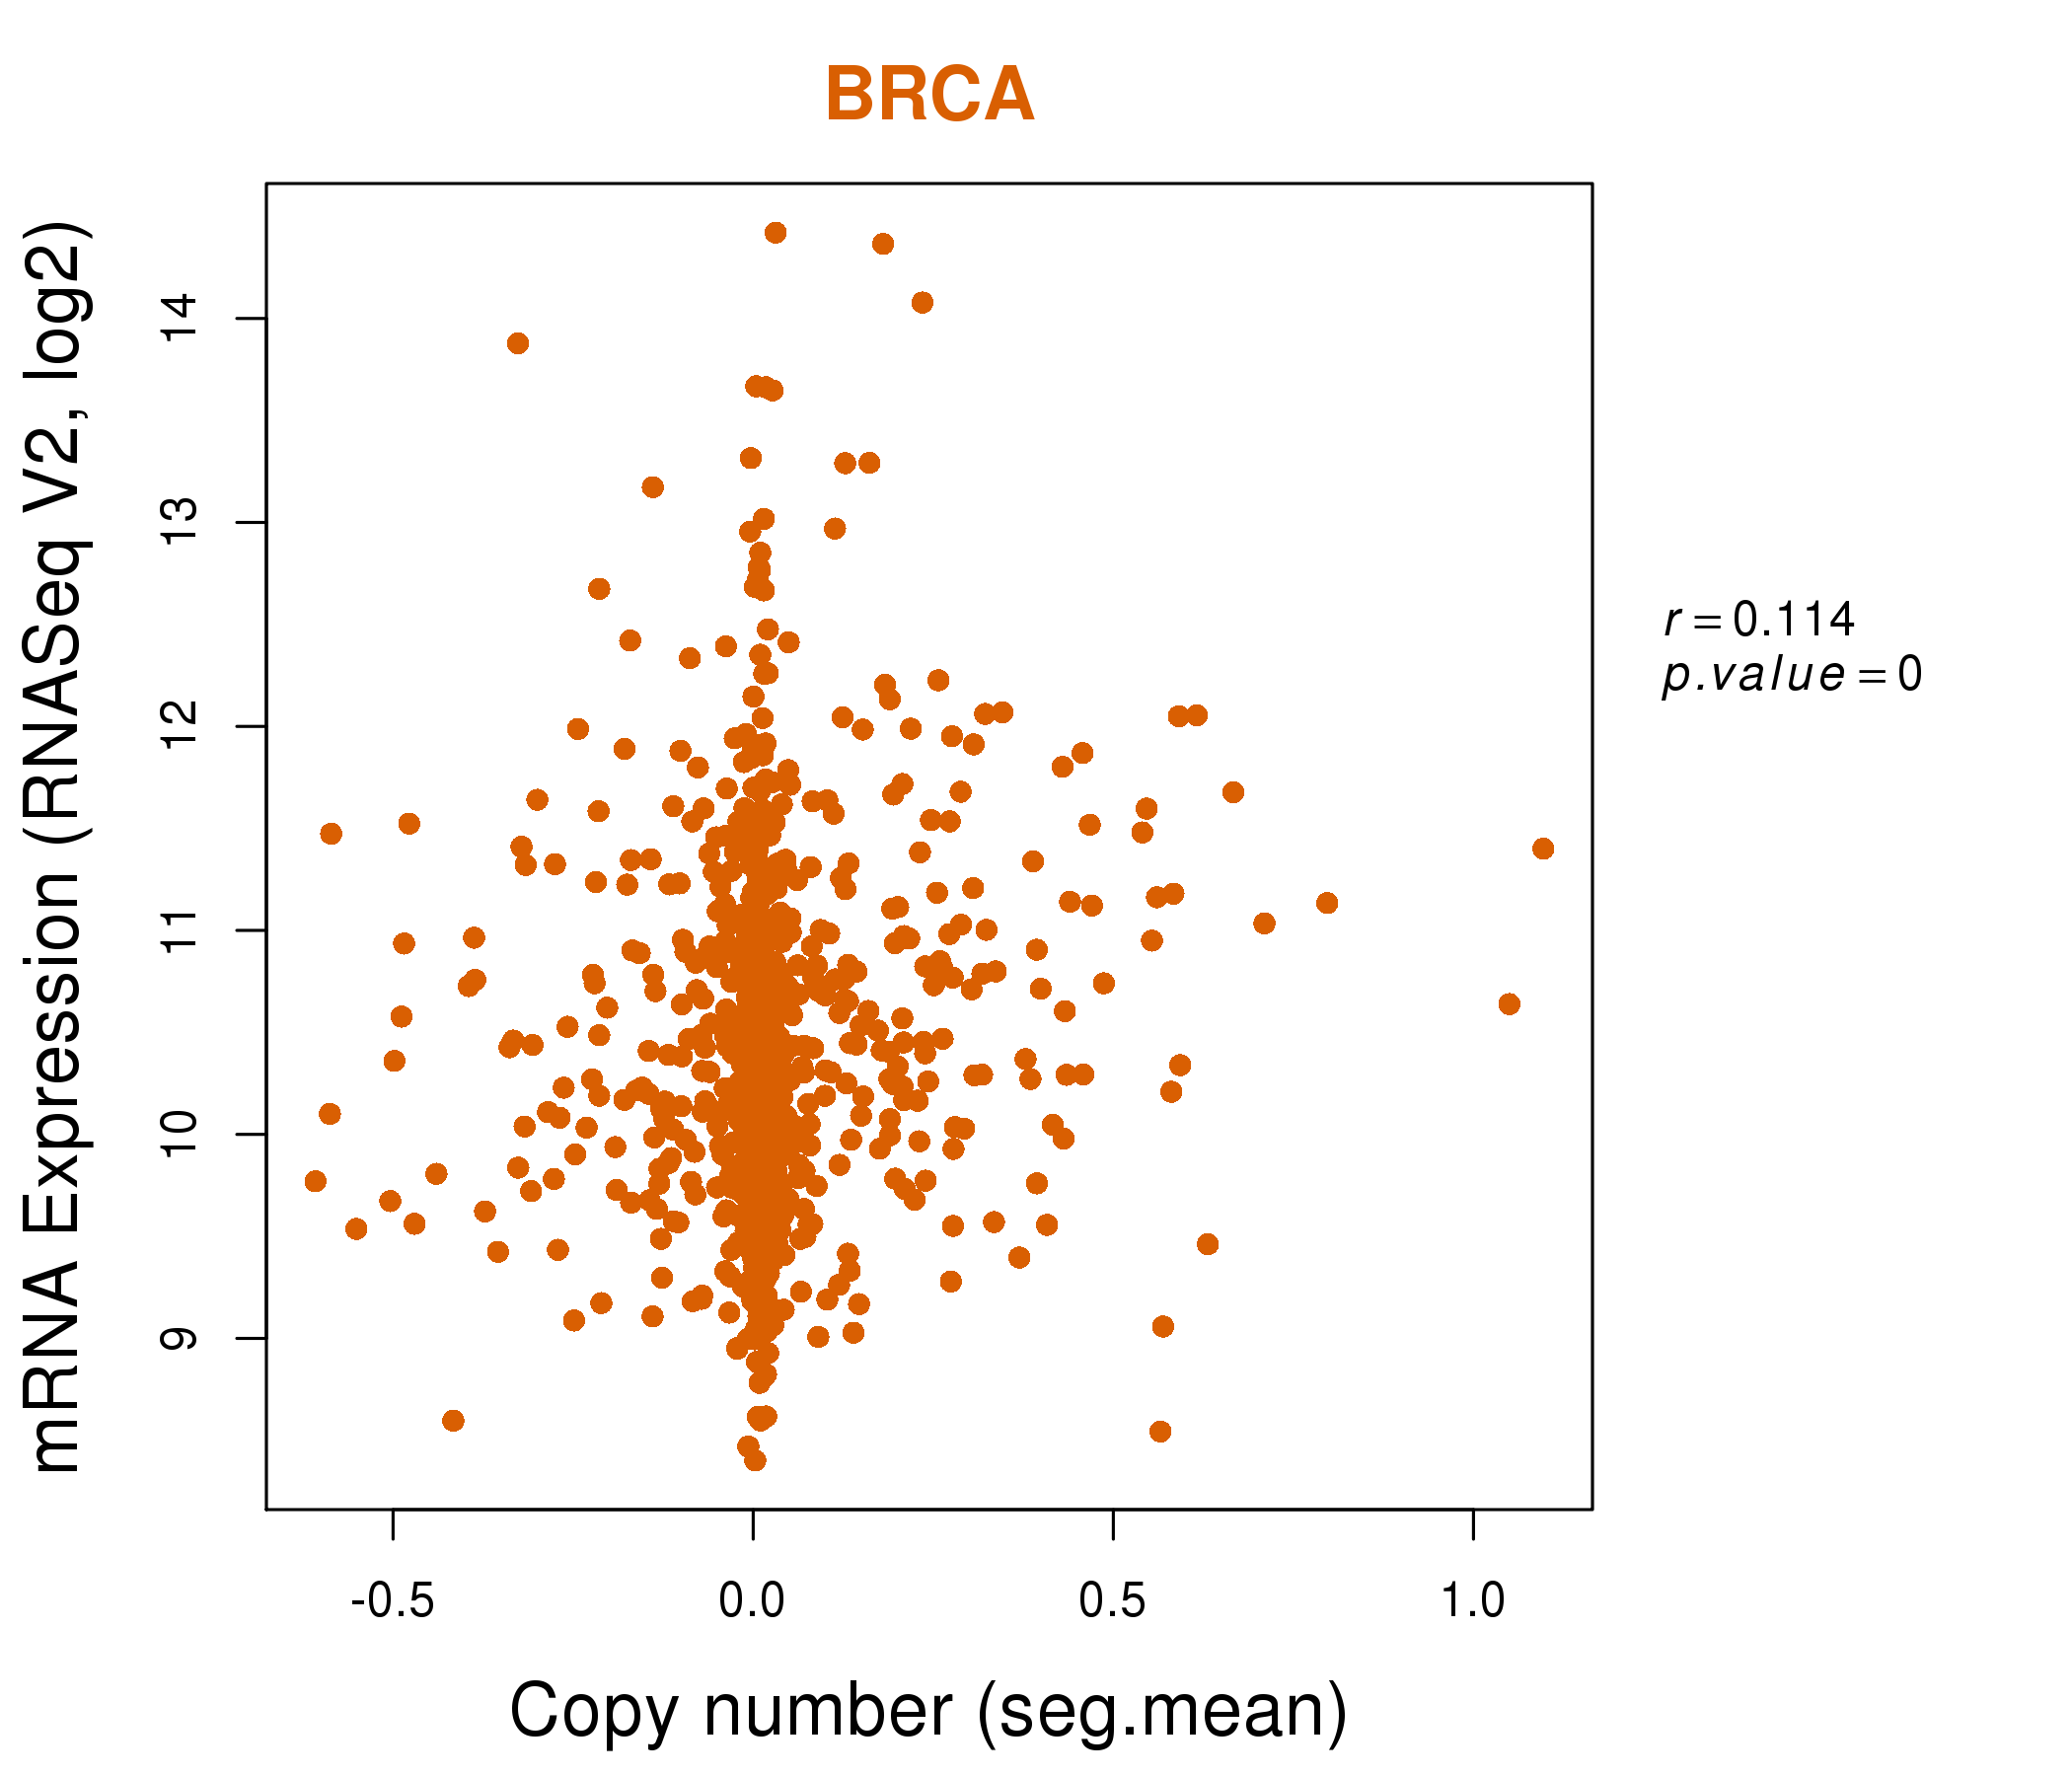
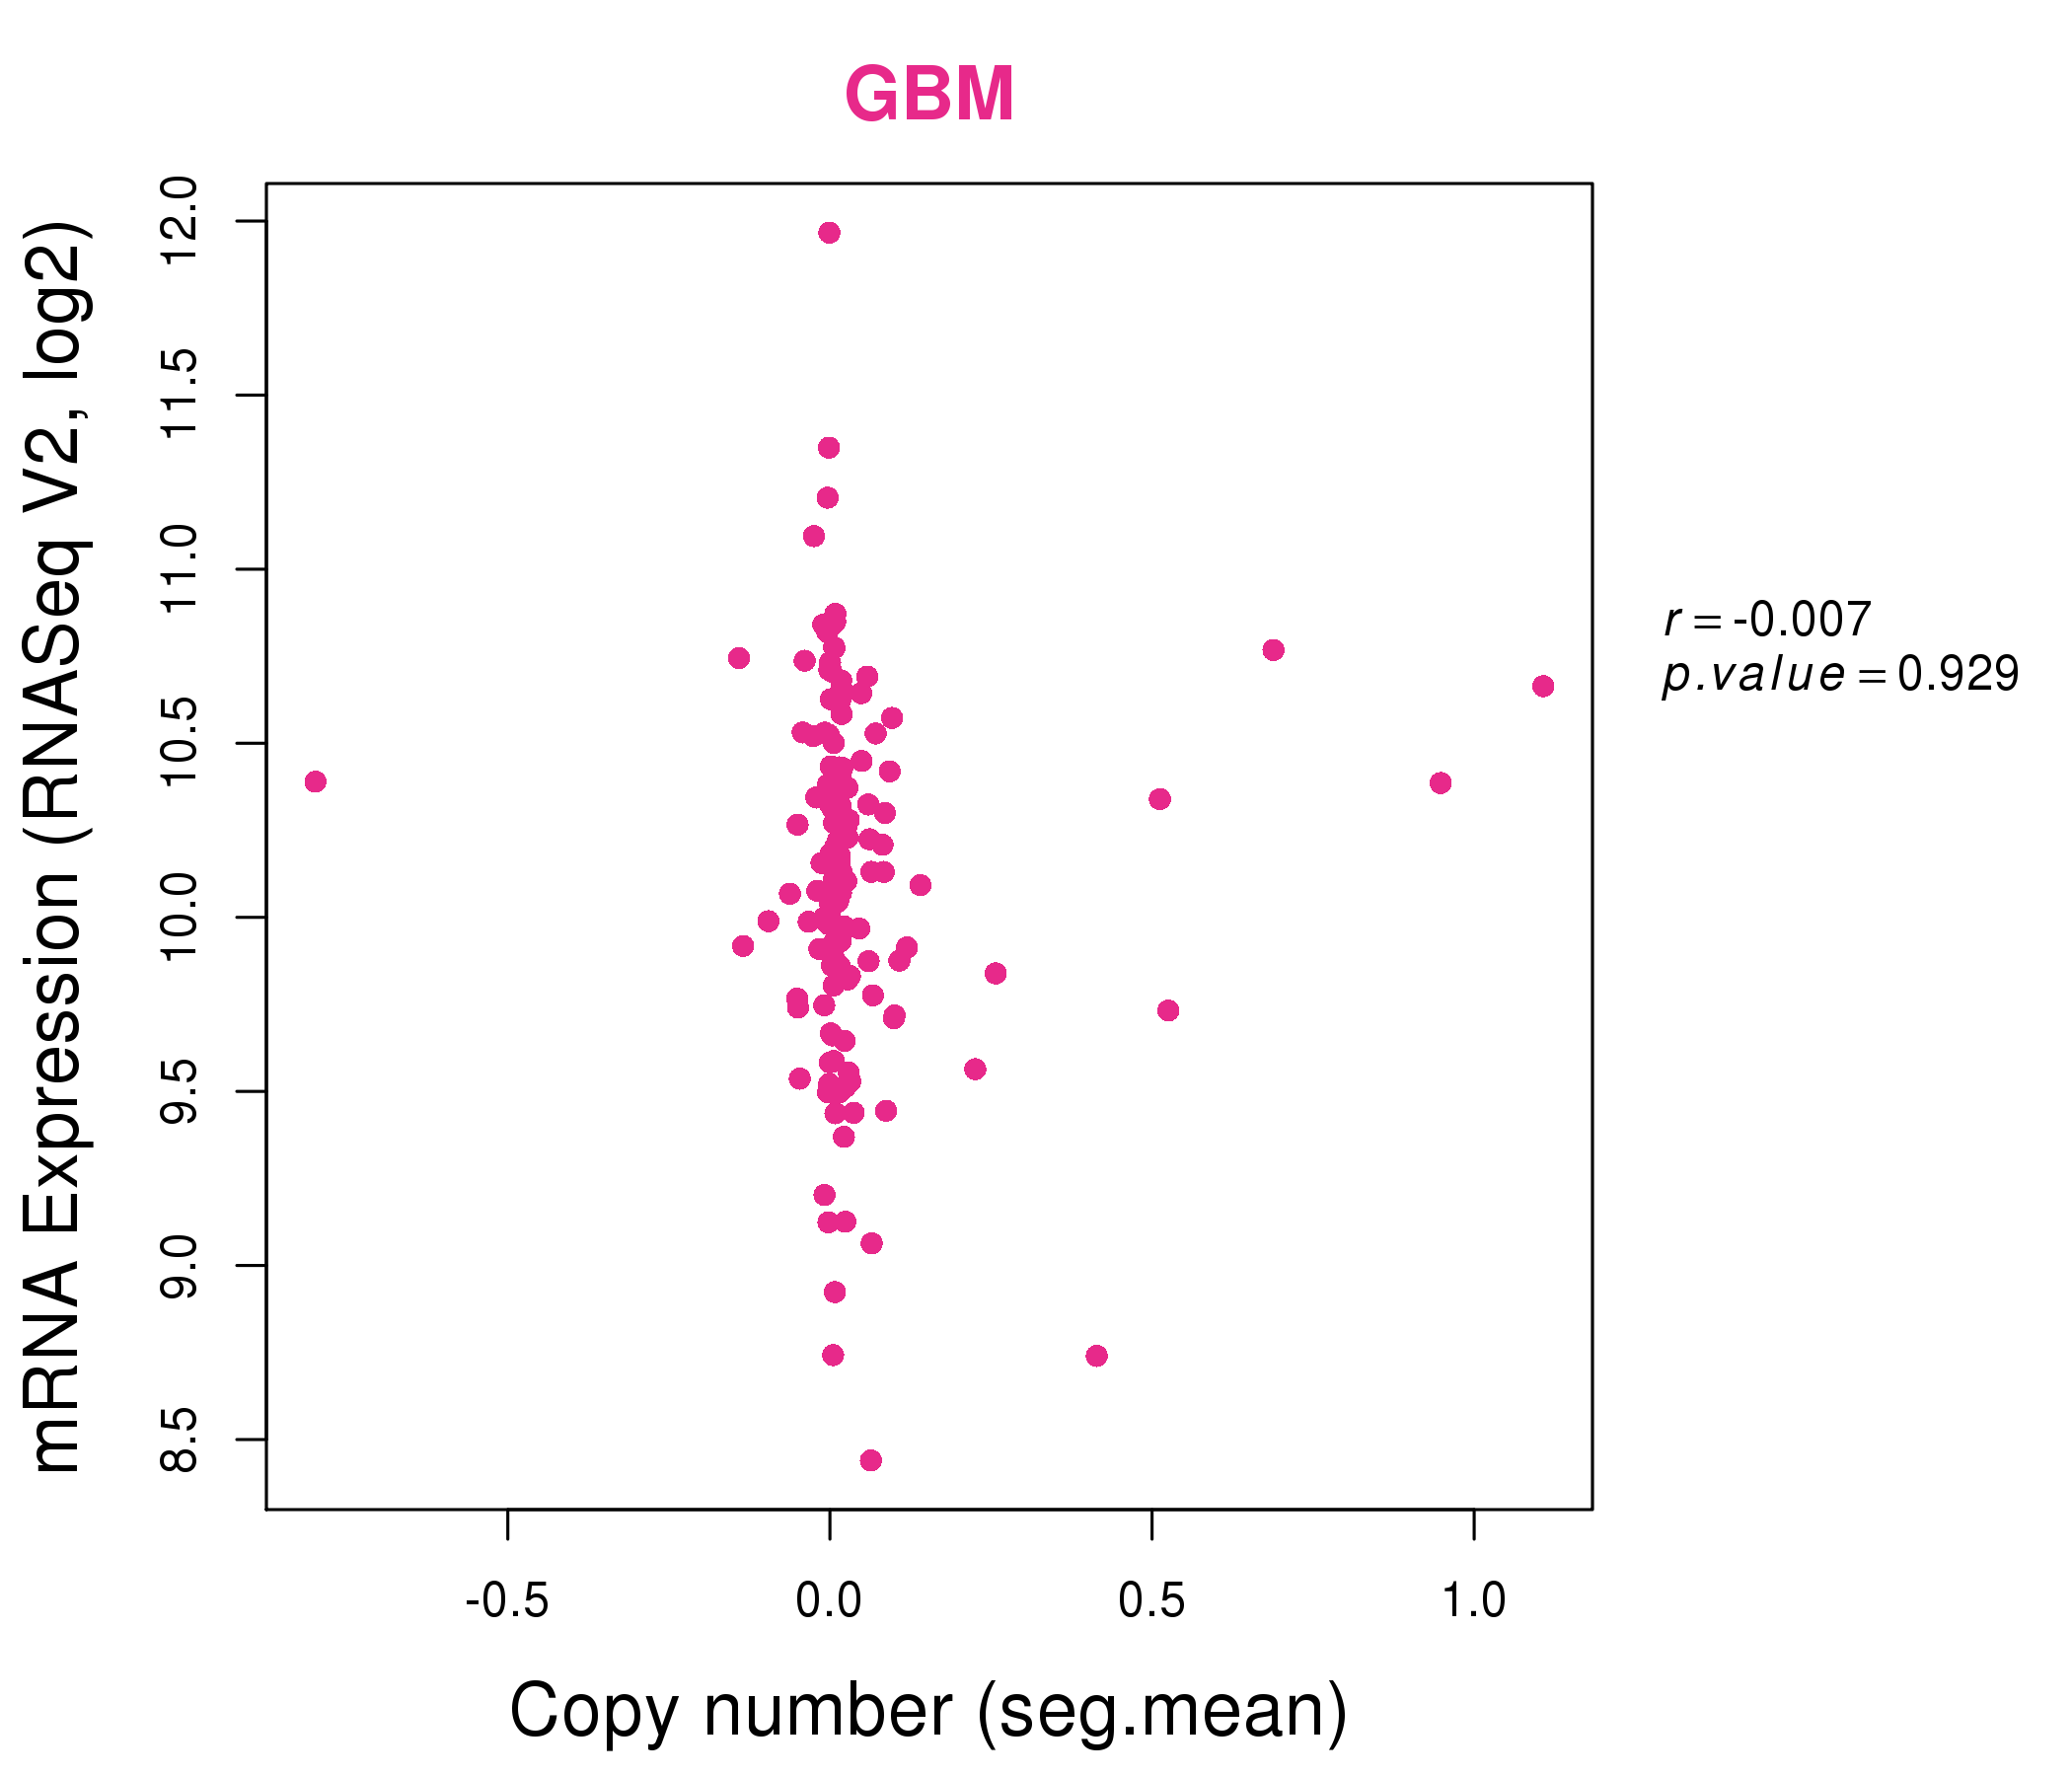
| * This plots show the correlation between CNV and gene expression. |
: Open all plots for all cancer types
 |
|
 |
|
| Top |
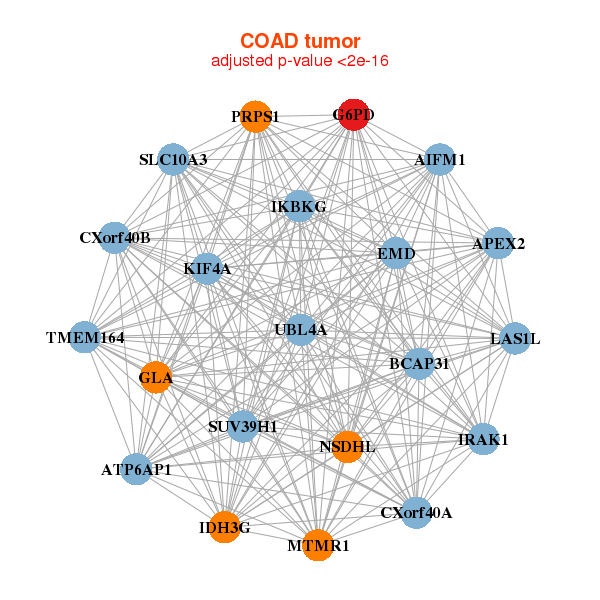
| Gene-Gene Network Information |
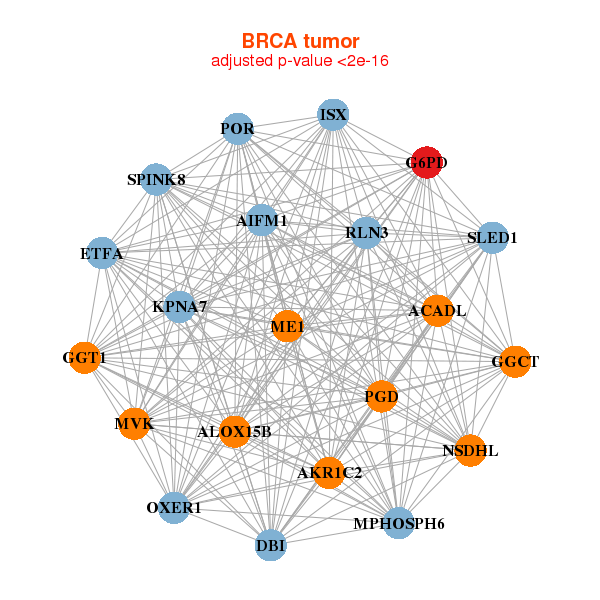
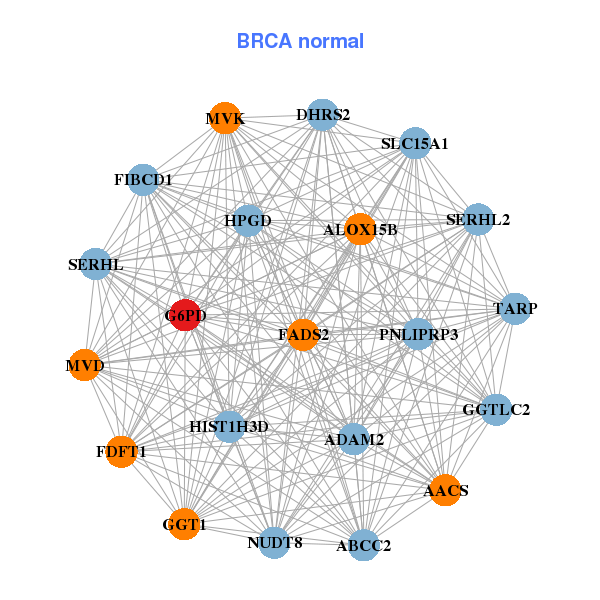
| * Co-Expression network figures were drawn using R package igraph. Only the top 20 genes with the highest correlations were shown. Red circle: input gene, orange circle: cell metabolism gene, sky circle: other gene |
: Open all plots for all cancer types
 |
| ||||
| ACADL,AIFM1,AKR1C2,ALOX15B,DBI,ETFA,G6PD, GGCT,GGT1,ISX,KPNA7,ME1,MPHOSPH6,MVK, NSDHL,OXER1,PGD,POR,RLN3,SLED1,SPINK8 | AACS,ABCC2,ADAM2,ALOX15B,DHRS2,FADS2,FDFT1, FIBCD1,G6PD,GGT1,GGTLC2,HIST1H3D,HPGD,MVD, MVK,NUDT8,PNLIPRP3,SERHL2,SERHL,SLC15A1,TARP | ||||
 |
| ||||
| AIFM1,APEX2,ATP6AP1,BCAP31,CXorf40A,CXorf40B,EMD, G6PD,GLA,IDH3G,IKBKG,IRAK1,KIF4A,LAS1L, MTMR1,NSDHL,PRPS1,SLC10A3,SUV39H1,TMEM164,UBL4A | AP3D1,CARM1,CCNF,DPP9,FBXL19,G6PD,INCENP, LIMK1,MAD1L1,MTA2,NACC1,RANGAP1,RPS6KA4,SART1, SEC24C,TAPBP,TBC1D10B,TMEM104,TMEM214,TRIM56,VCP |
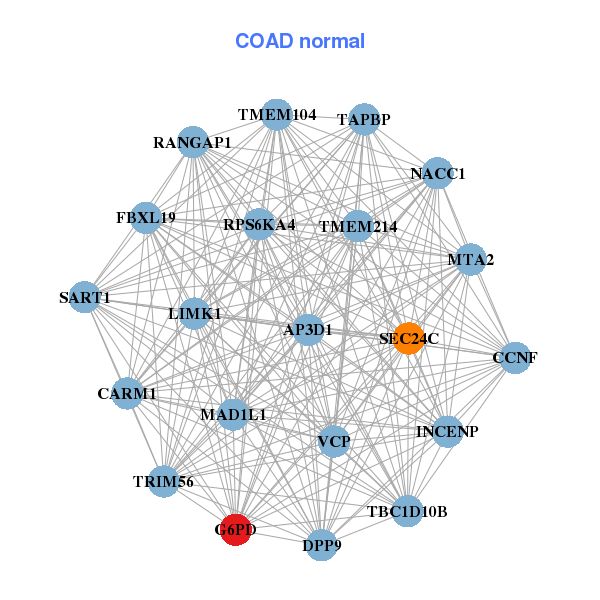
| * Co-Expression network figures were drawn using R package igraph. Only the top 20 genes with the highest correlations were shown. Red circle: input gene, orange circle: cell metabolism gene, sky circle: other gene |
: Open all plots for all cancer types
| Top |
: Open all interacting genes' information including KEGG pathway for all interacting genes from DAVID
| Top |
| Pharmacological Information for G6PD |
| DB Category | DB Name | DB's ID and Url link |
| Chemistry | BindingDB | P11413; -. |
| Chemistry | ChEMBL | CHEMBL5347; -. |
| Organism-specific databases | PharmGKB | PA28469; -. |
| Organism-specific databases | CTD | 2539; -. |
| * Gene Centered Interaction Network. |
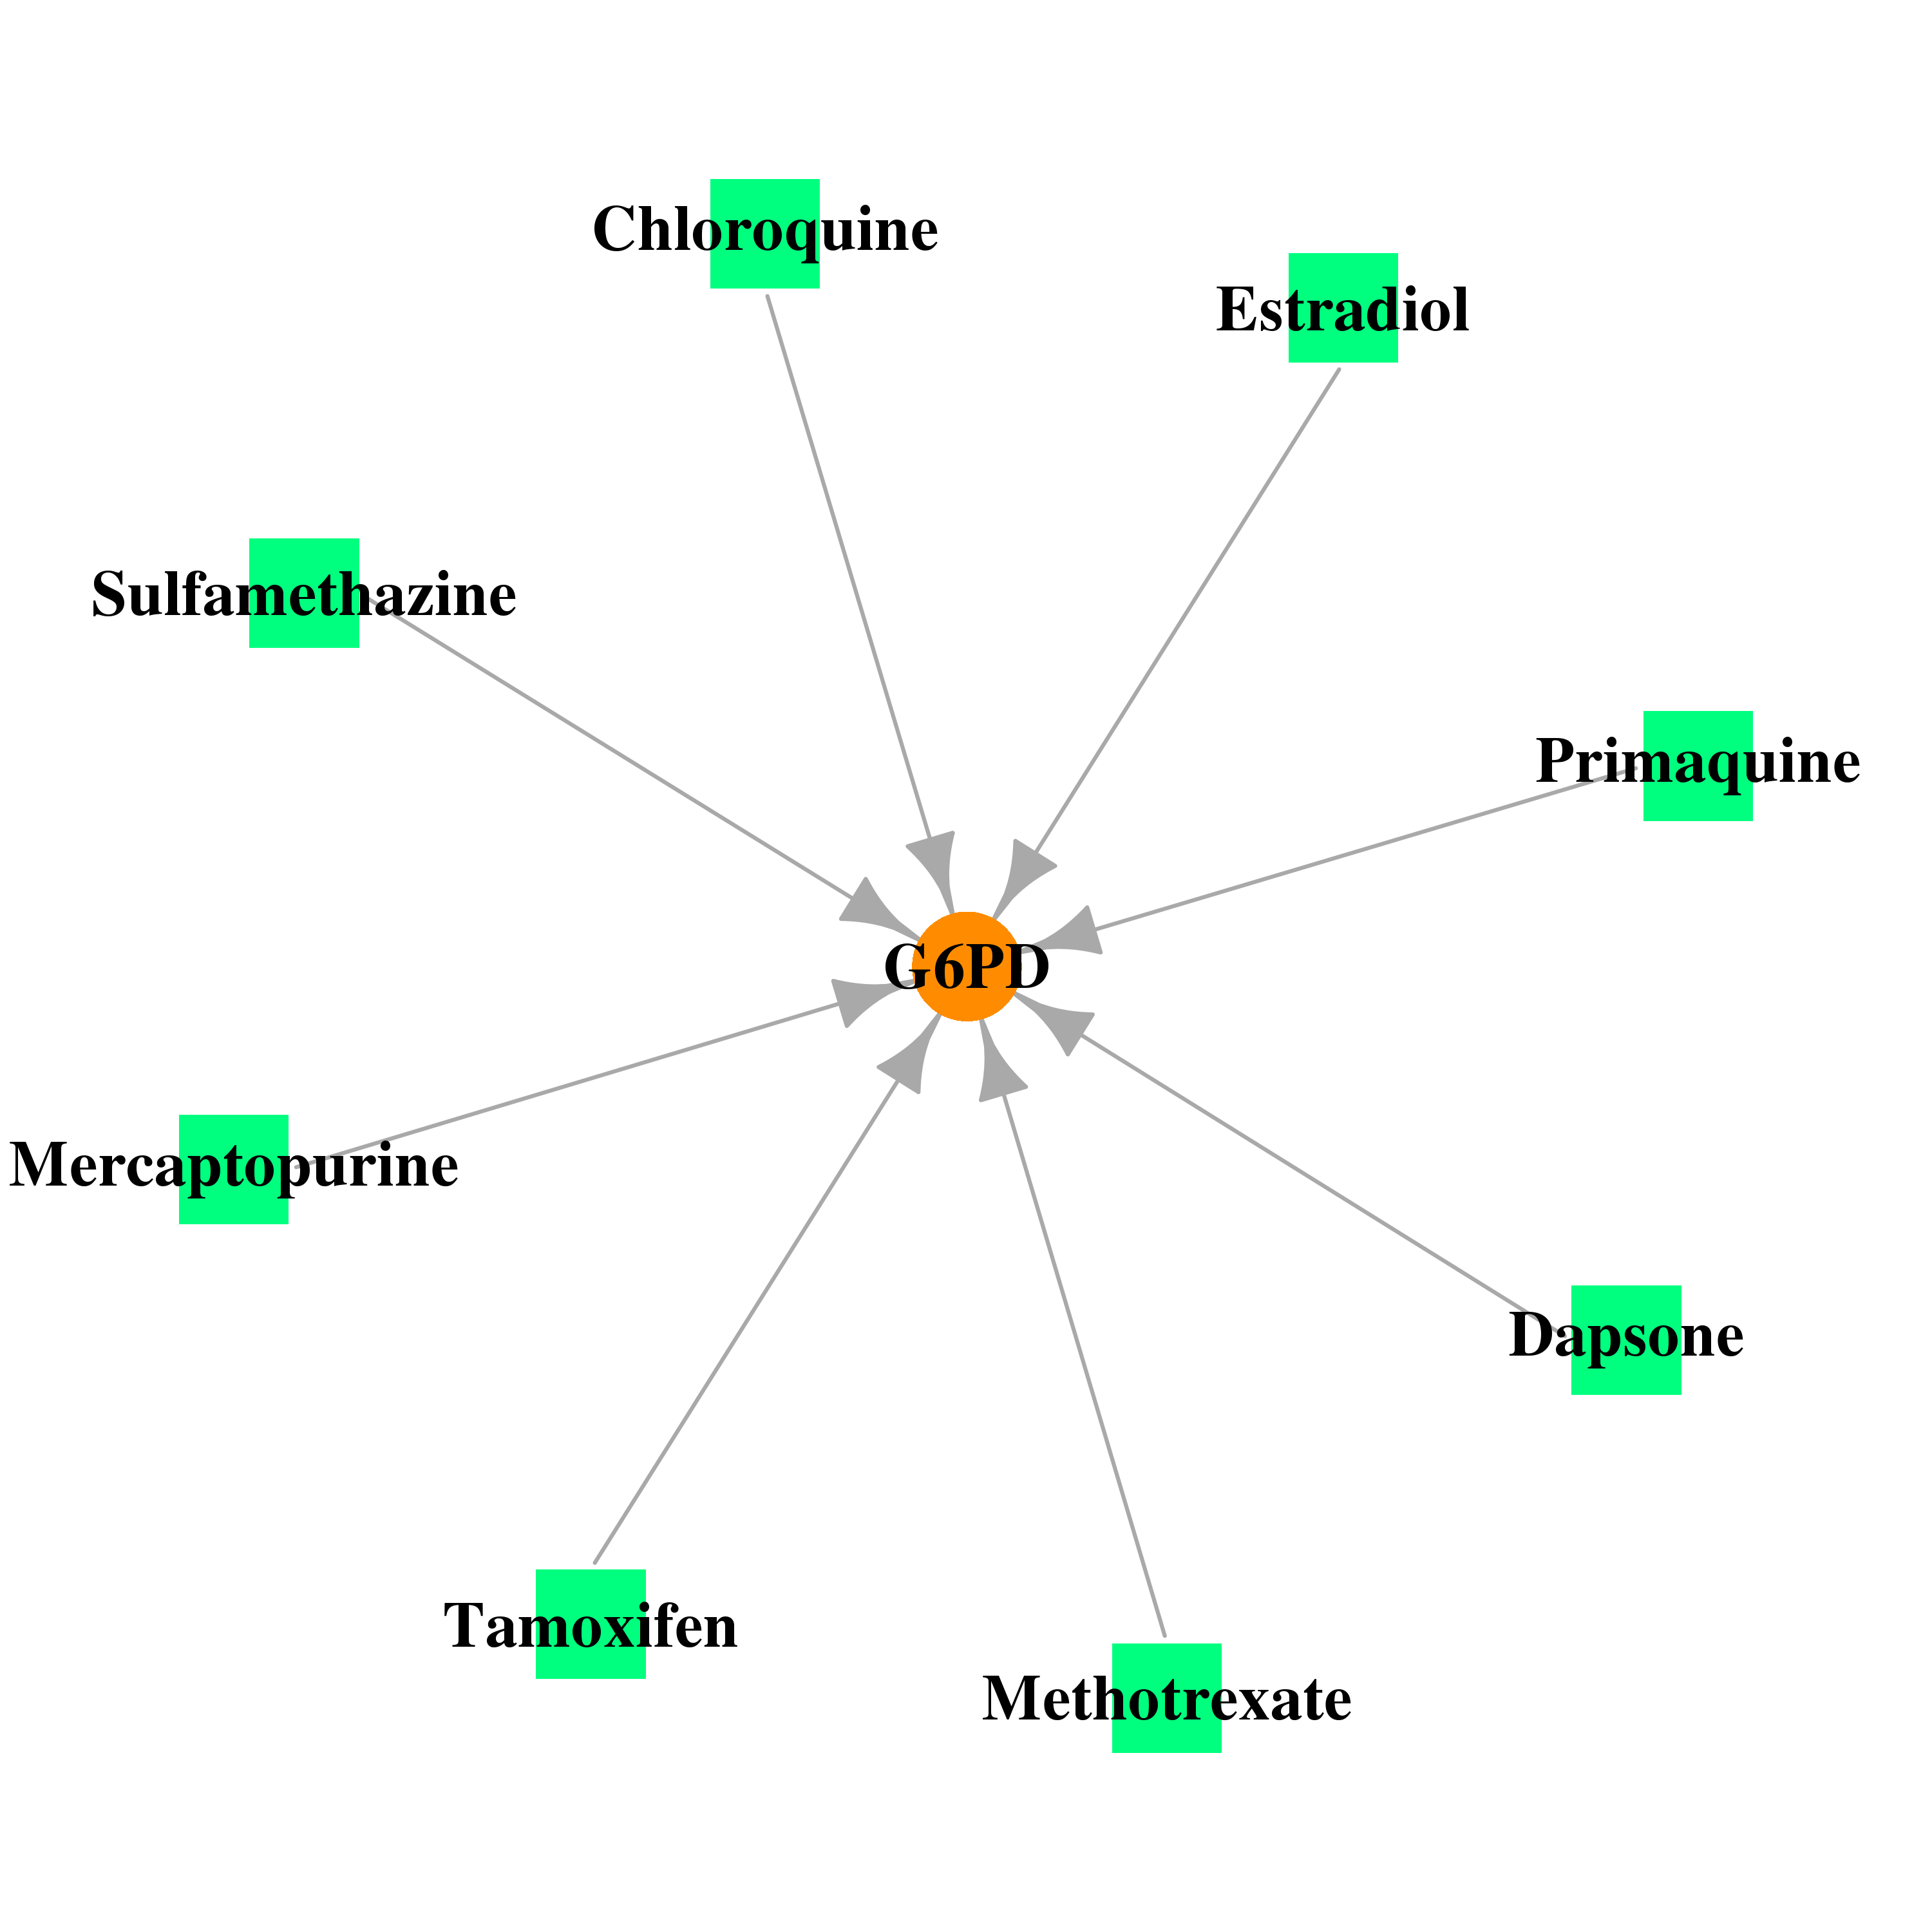 |
| * Drug Centered Interaction Network. |
| DrugBank ID | Target Name | Drug Groups | Generic Name | Drug Centered Network | Drug Structure |
| DB01582 | glucose-6-phosphate dehydrogenase | approved | Sulfamethazine | 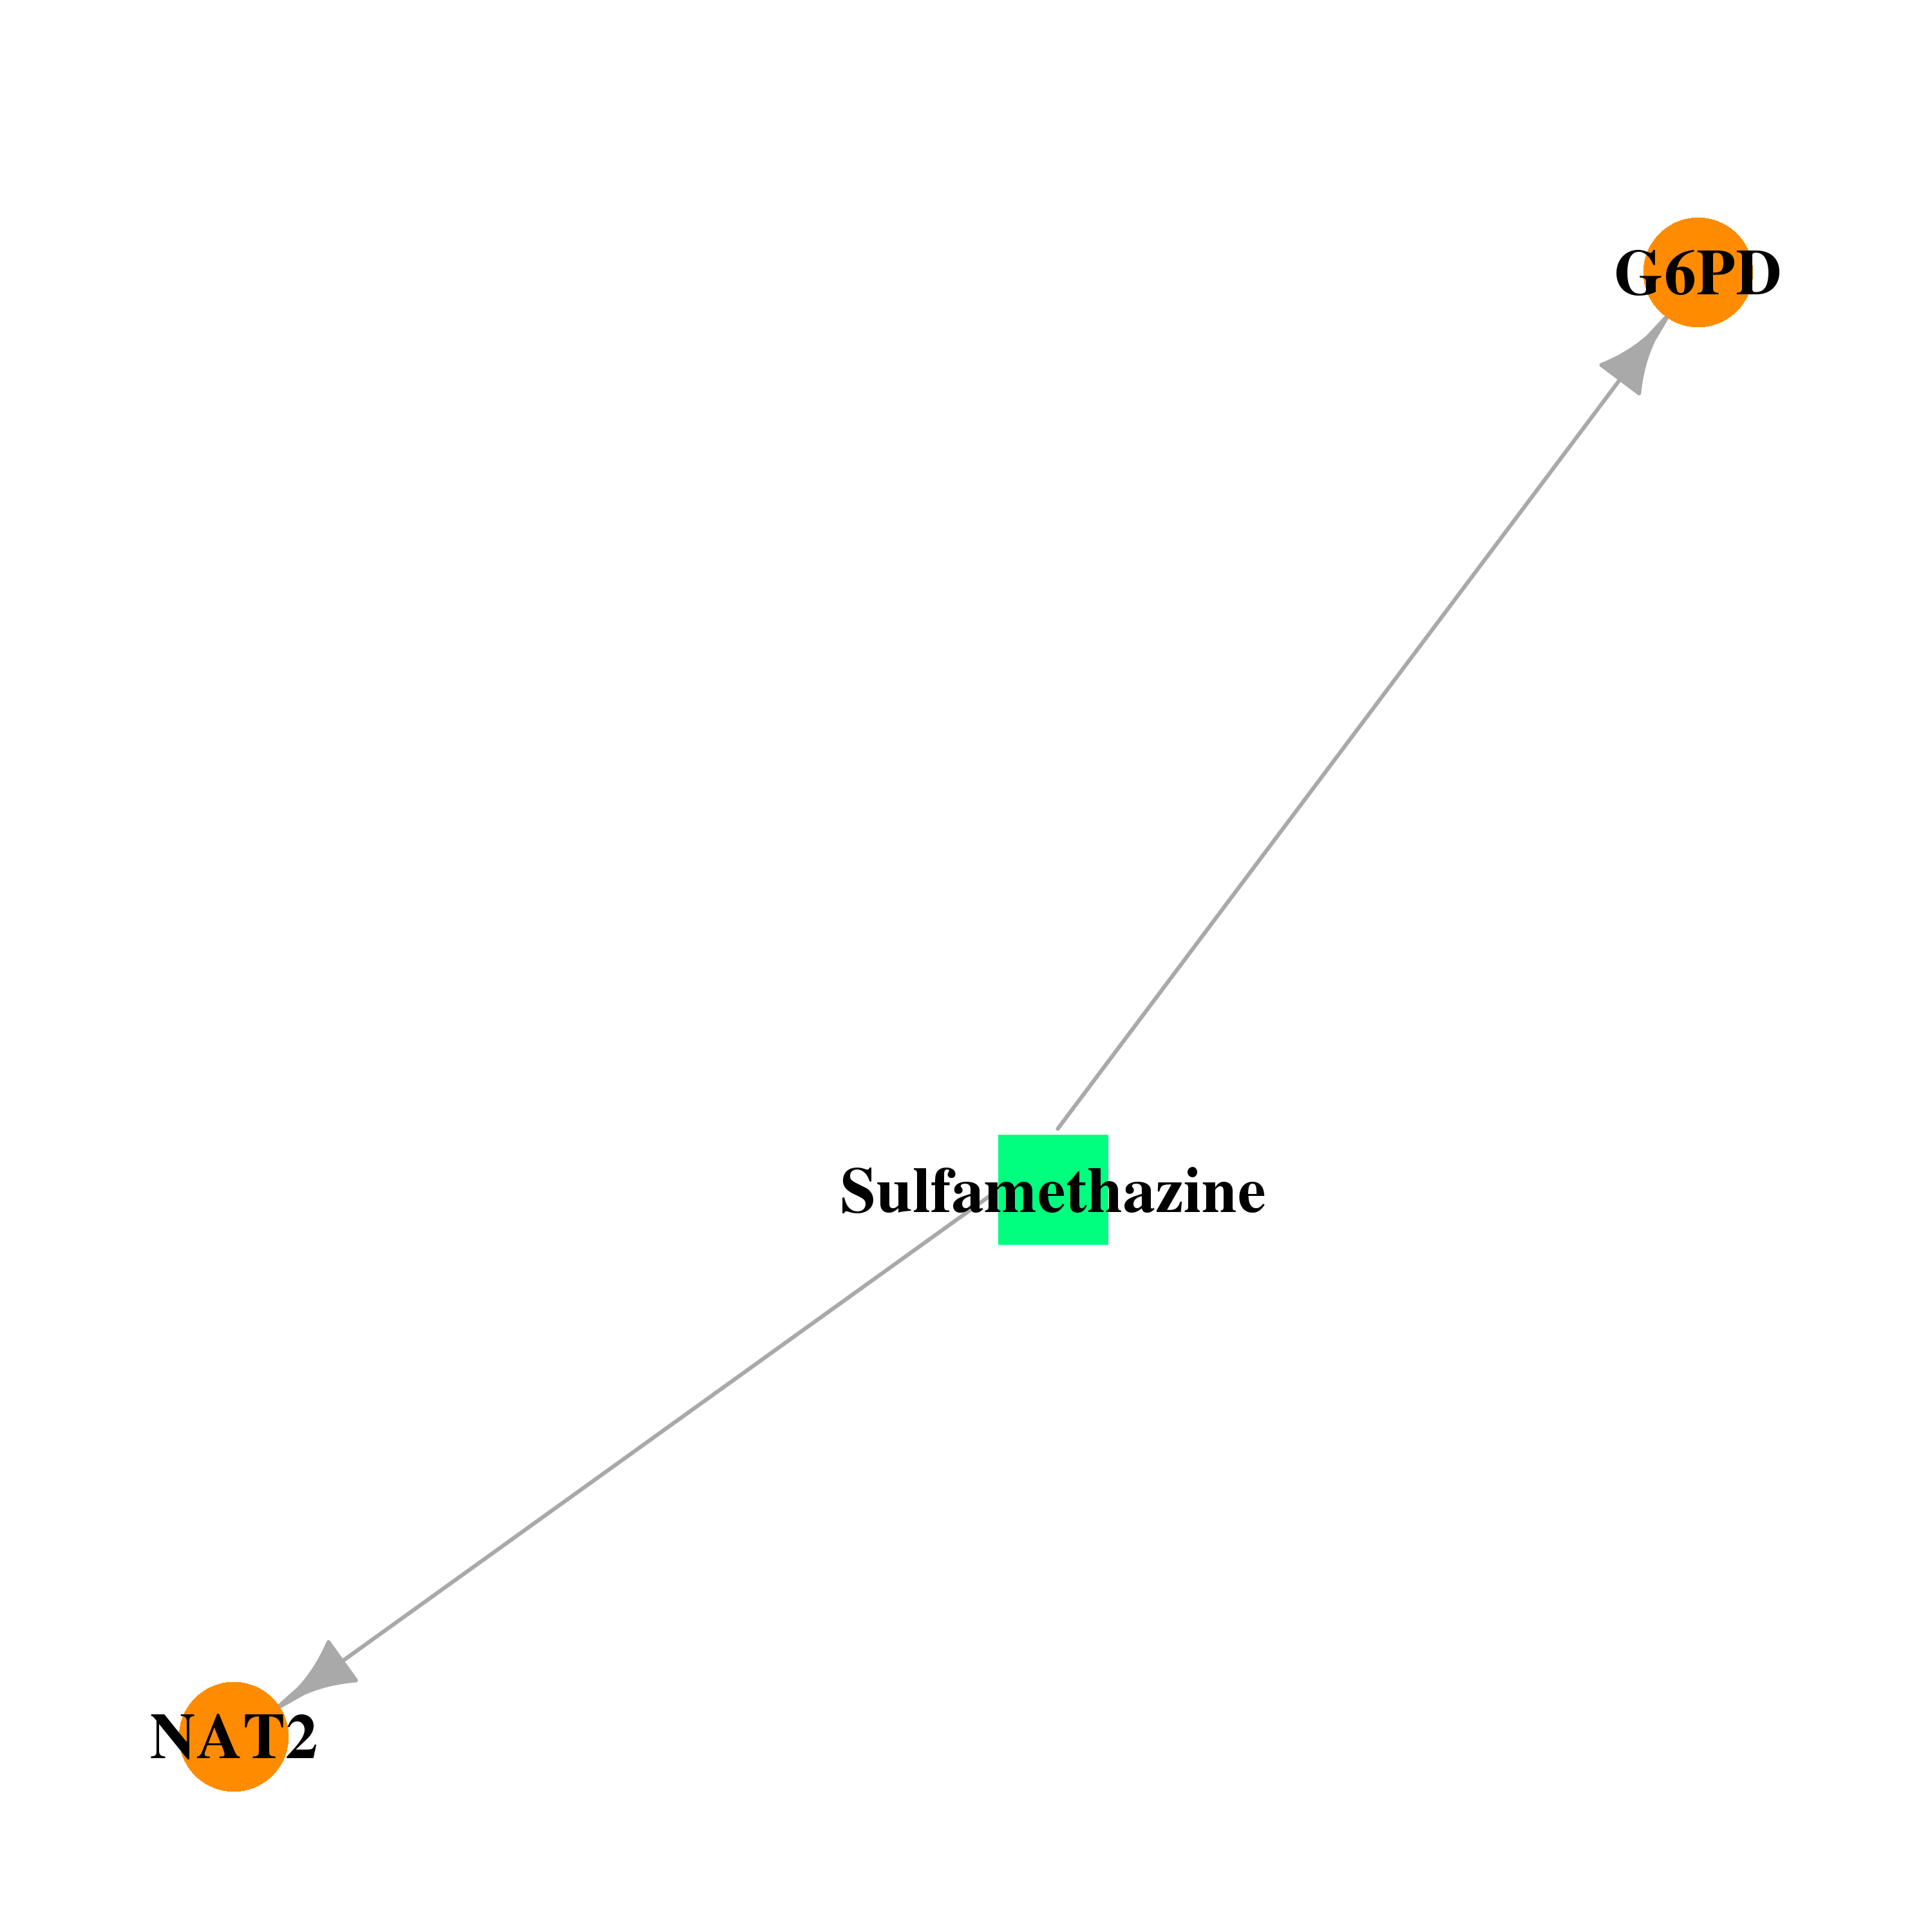 | 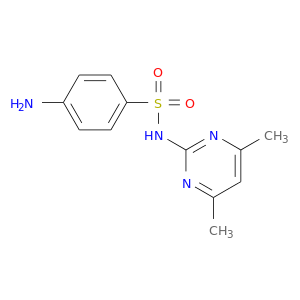 |
| DB00608 | glucose-6-phosphate dehydrogenase | approved | Chloroquine |  | 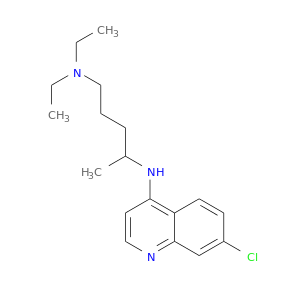 |
| DB00250 | glucose-6-phosphate dehydrogenase | approved; investigational | Dapsone | 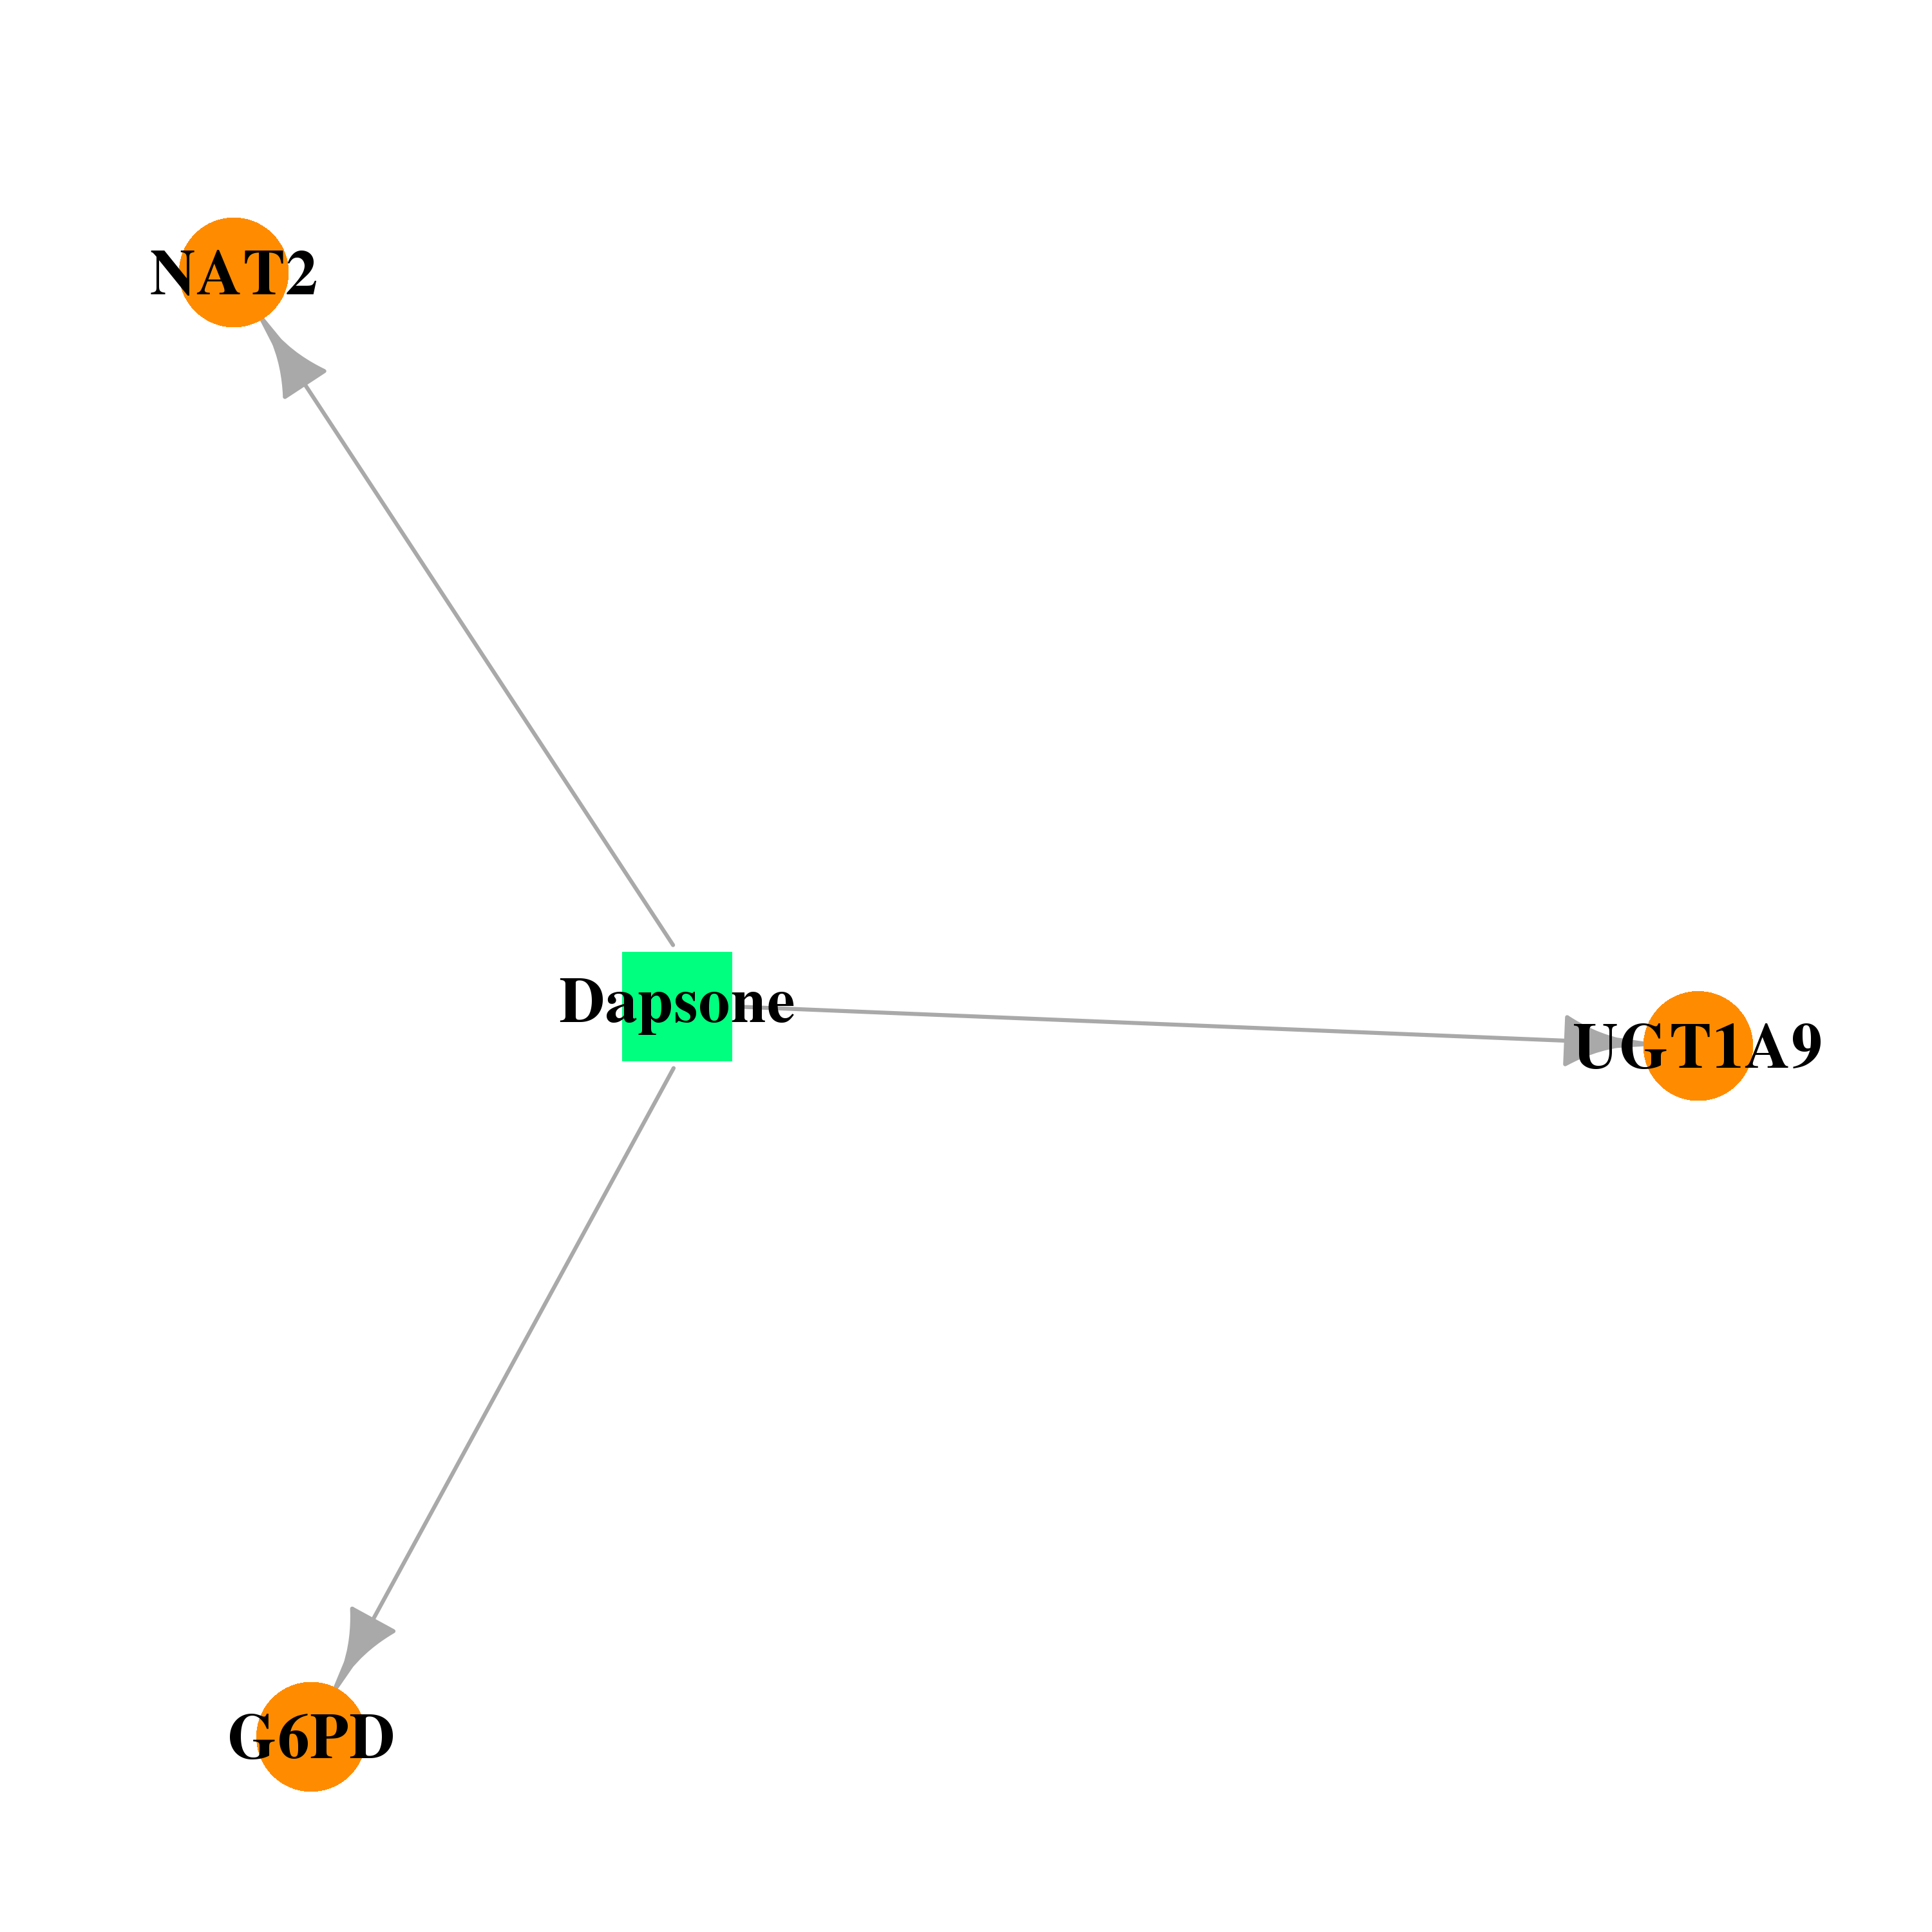 |  |
| DB01033 | glucose-6-phosphate dehydrogenase | approved | Mercaptopurine | 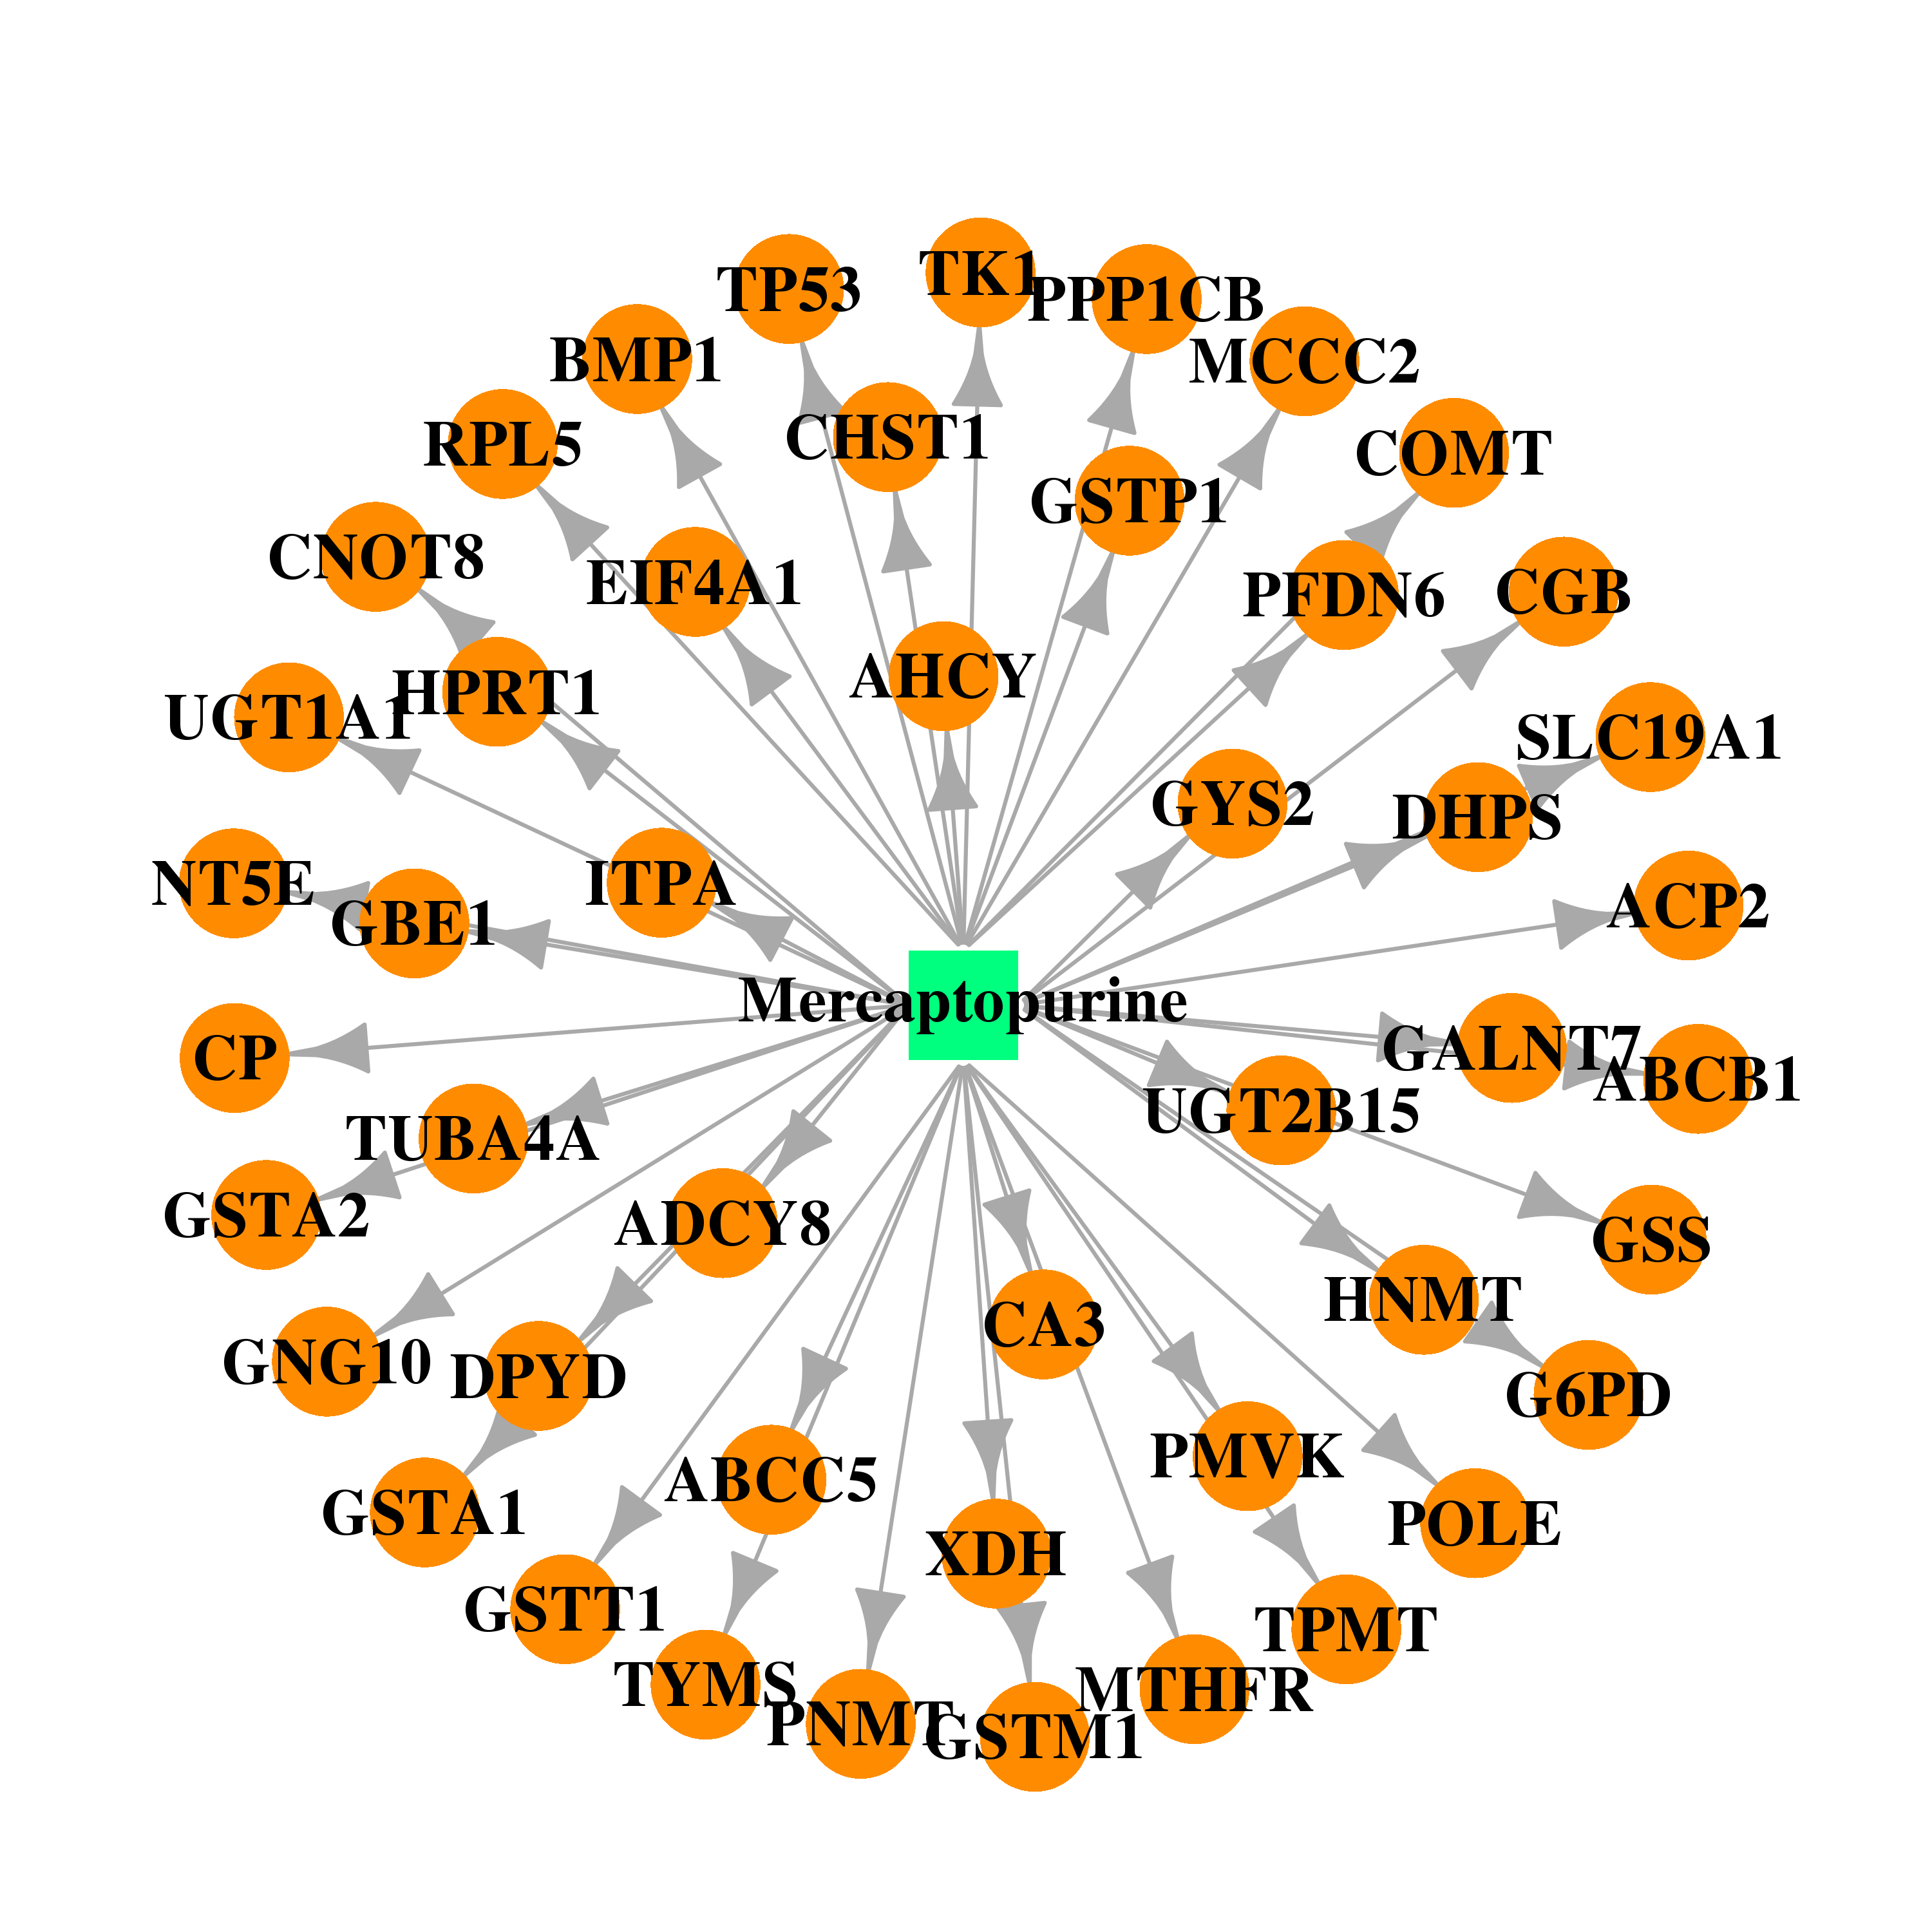 |  |
| DB00563 | glucose-6-phosphate dehydrogenase | approved | Methotrexate |  |  |
| DB00783 | glucose-6-phosphate dehydrogenase | approved; investigational | Estradiol | 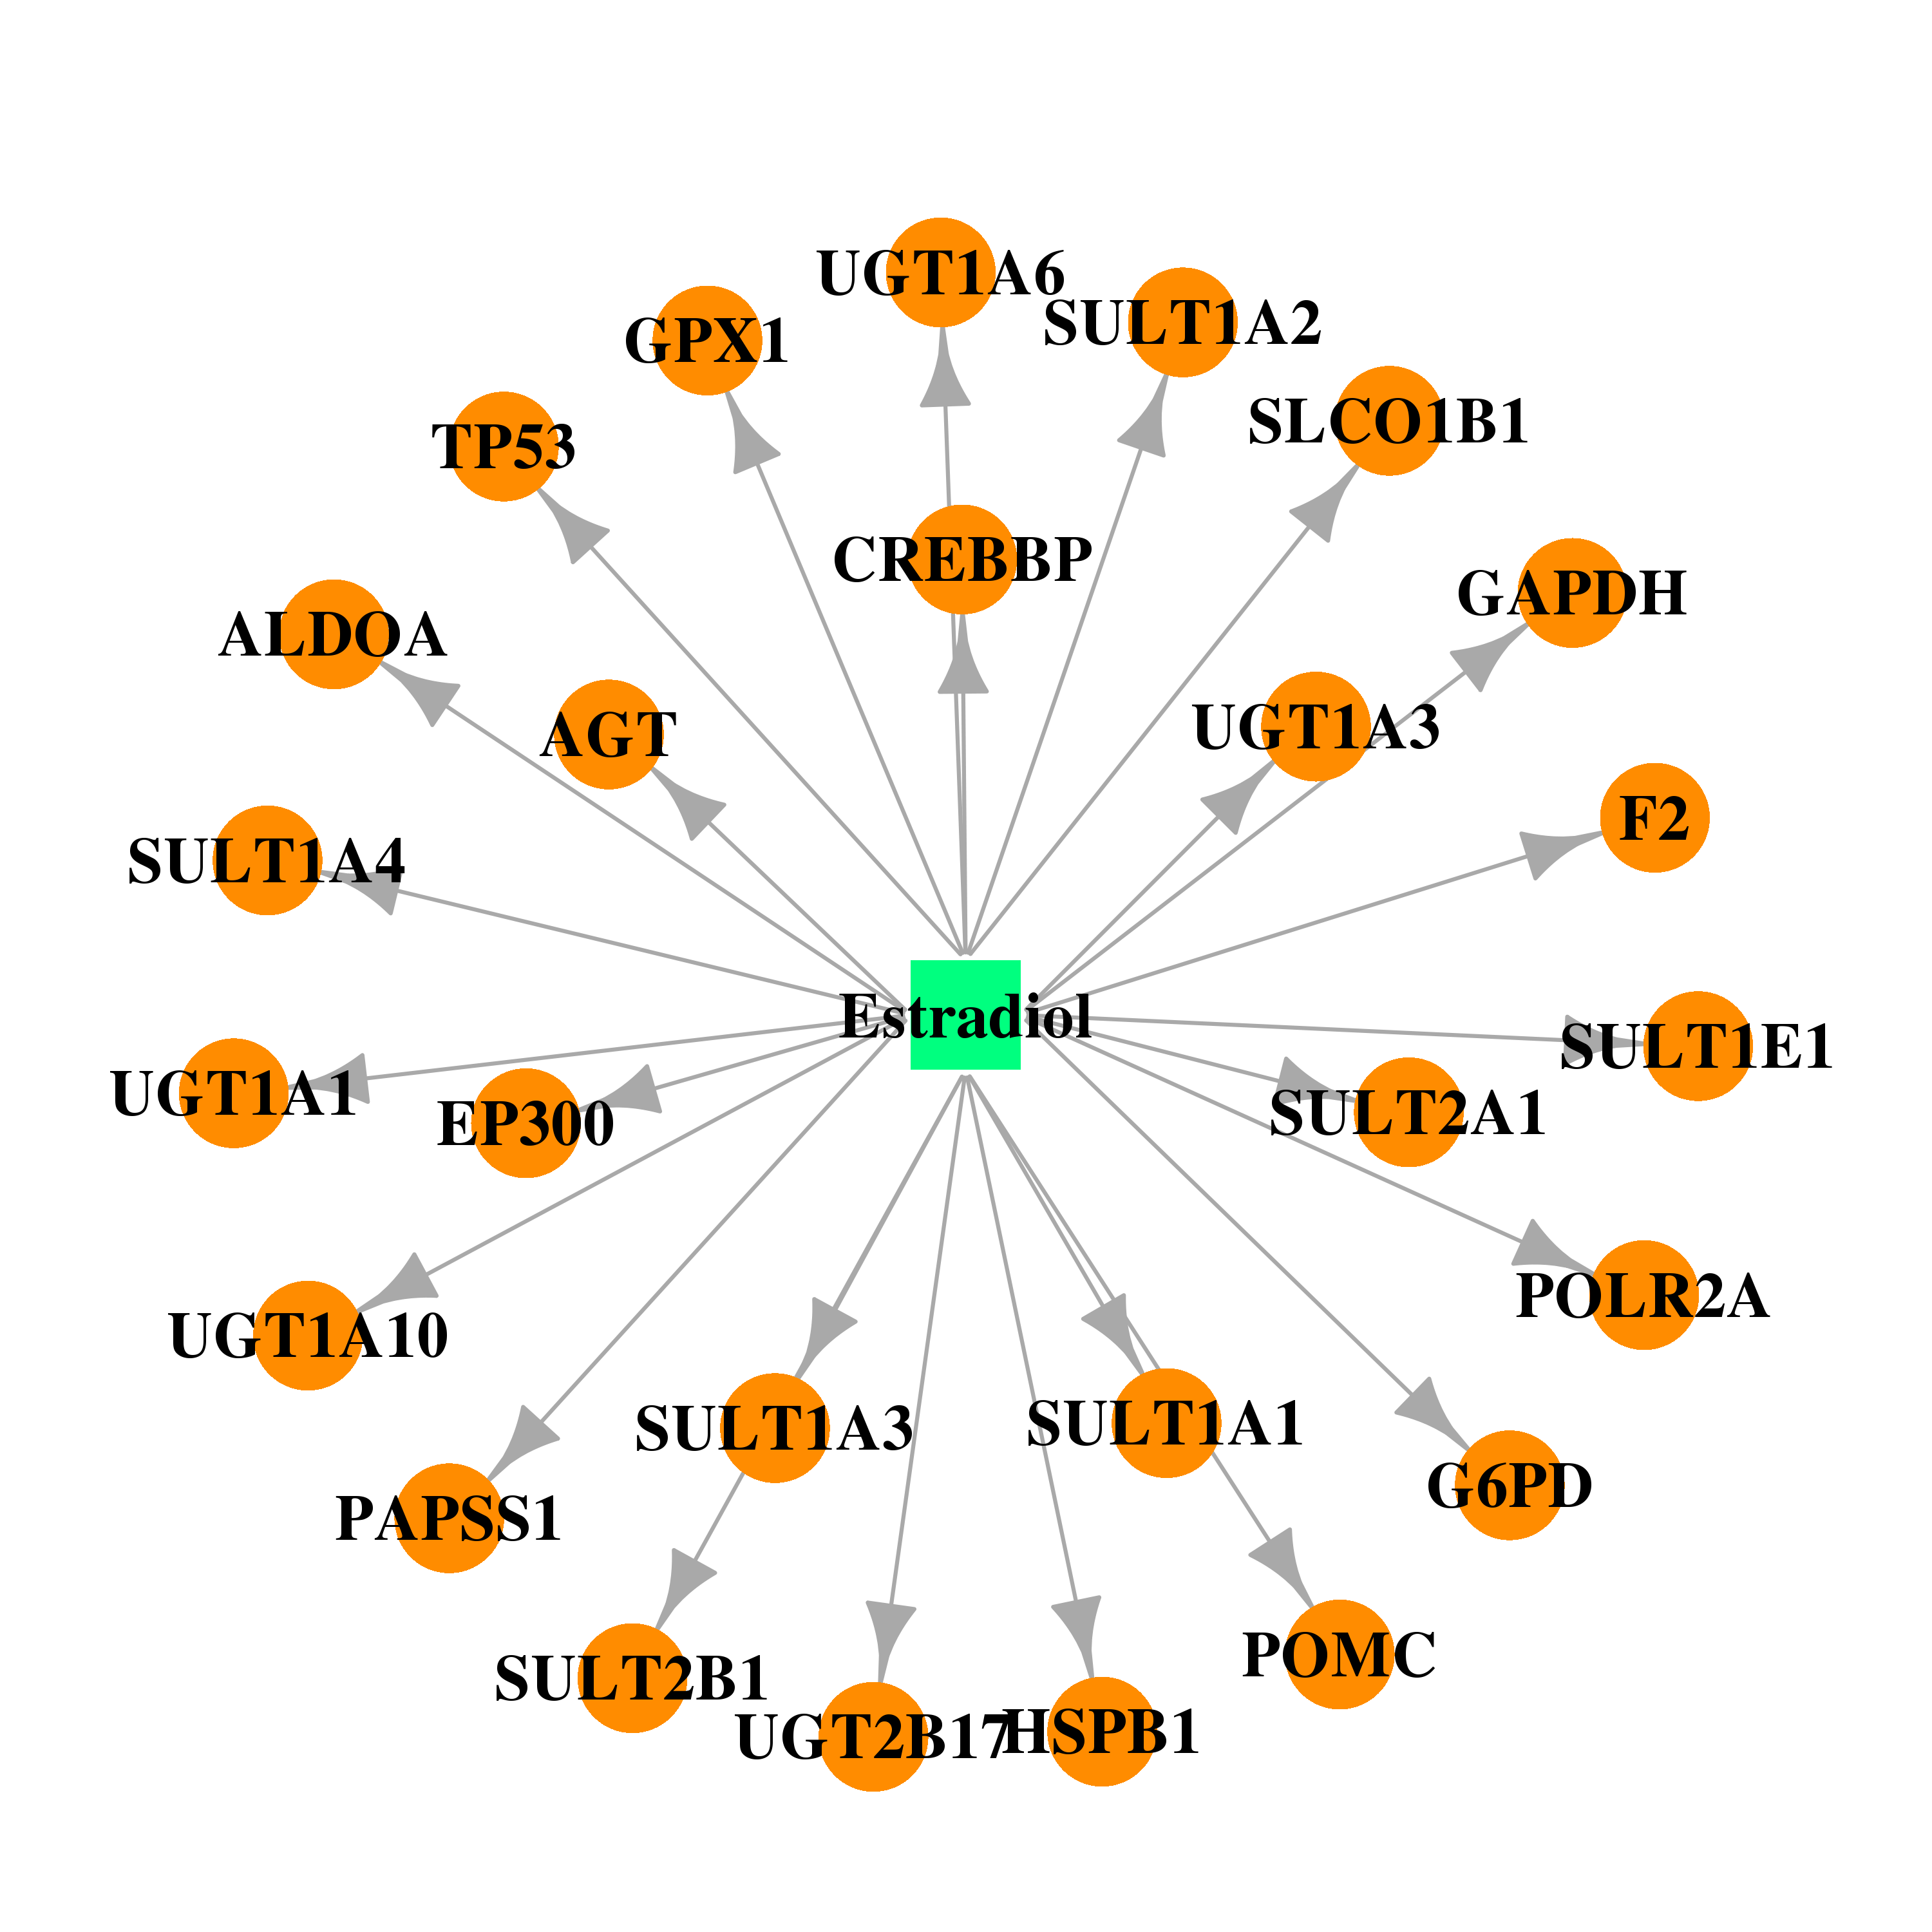 |  |
| DB00675 | glucose-6-phosphate dehydrogenase | approved | Tamoxifen |  |  |
| DB01087 | glucose-6-phosphate dehydrogenase | approved | Primaquine |  |  |
| Top |
| Cross referenced IDs for G6PD |
| * We obtained these cross-references from Uniprot database. It covers 150 different DBs, 18 categories. http://www.uniprot.org/help/cross_references_section |
: Open all cross reference information
|
Copyright © 2016-Present - The Univsersity of Texas Health Science Center at Houston @ |