|
||||||||||||||||||||||||||||||||||||||||||||||||||||||||||||||||||||||||||||||||||||||||||||||||||||||||||||||||||||||||||||||||||||||||||||||||||||||||||||||||||||||||||||||||||||||||||||||||||||||||||||||||||||||||||||||||||||||||||||||||||||||||||||||||||||||||||||||||||||||||||||||||||||||||||||||||||||||||||
| |
| Phenotypic Information (metabolism pathway, cancer, disease, phenome) |
| |
| |
| Gene-Gene Network Information: Co-Expression Network, Interacting Genes & KEGG |
| |
|


| Gene Summary for LPCAT4 |
| Basic gene info. | Gene symbol | LPCAT4 |
| Gene name | lysophosphatidylcholine acyltransferase 4 | |
| Synonyms | AGPAT7|AYTL3|LPAAT-eta|LPEAT2 | |
| Cytomap | UCSC genome browser: 15q14 | |
| Genomic location | chr15 :34651088-34659395 | |
| Type of gene | protein-coding | |
| RefGenes | NM_153613.2, | |
| Ensembl id | ENSG00000176454 | |
| Description | 1-AGP acyltransferase 71-AGPAT 71-acylglycerol-3-phosphate O-acyltransferase 7 (lysophosphatidic acid acyltransferase, eta)1-acylglycerophosphocholine O-acyltransferase1-acylglycerophosphoserine O-acyltransferase1-alkenylglycerophosphoethanolamine O- | |
| Modification date | 20141207 | |
| dbXrefs | MIM : 612039 | |
| HGNC : HGNC | ||
| Ensembl : ENSG00000176454 | ||
| HPRD : 08315 | ||
| Vega : OTTHUMG00000172349 | ||
| Protein | UniProt: go to UniProt's Cross Reference DB Table | |
| Expression | CleanEX: HS_LPCAT4 | |
| BioGPS: 254531 | ||
| Gene Expression Atlas: ENSG00000176454 | ||
| The Human Protein Atlas: ENSG00000176454 | ||
| Pathway | NCI Pathway Interaction Database: LPCAT4 | |
| KEGG: LPCAT4 | ||
| REACTOME: LPCAT4 | ||
| ConsensusPathDB | ||
| Pathway Commons: LPCAT4 | ||
| Metabolism | MetaCyc: LPCAT4 | |
| HUMANCyc: LPCAT4 | ||
| Regulation | Ensembl's Regulation: ENSG00000176454 | |
| miRBase: chr15 :34,651,088-34,659,395 | ||
| TargetScan: NM_153613 | ||
| cisRED: ENSG00000176454 | ||
| Context | iHOP: LPCAT4 | |
| cancer metabolism search in PubMed: LPCAT4 | ||
| UCL Cancer Institute: LPCAT4 | ||
| Assigned class in ccmGDB | C | |
| Top |
| Phenotypic Information for LPCAT4(metabolism pathway, cancer, disease, phenome) |
| Cancer | CGAP: LPCAT4 |
| Familial Cancer Database: LPCAT4 | |
| * This gene is included in those cancer gene databases. |
|
|
|
|
|
|
| ||||||||||||||||||||||||||||||||||||||||||||||||||||||||||||||||||||||||||||||||||||||||||||||||||||||||||||||||||||||||||||||||||||||||||||||||||||||||||||||||||||||||||||||||||||||||||||||||||||||||||||||||||||||||||||||||||||||||||||||||||||||||||||||||||||||||||||||||||||||||||||||||||||||||||||||||||||
Oncogene 1 | Significant driver gene in | |||||||||||||||||||||||||||||||||||||||||||||||||||||||||||||||||||||||||||||||||||||||||||||||||||||||||||||||||||||||||||||||||||||||||||||||||||||||||||||||||||||||||||||||||||||||||||||||||||||||||||||||||||||||||||||||||||||||||||||||||||||||||||||||||||||||||||||||||||||||||||||||||||||||||||||||||||||||||
| cf) number; DB name 1 Oncogene; http://nar.oxfordjournals.org/content/35/suppl_1/D721.long, 2 Tumor Suppressor gene; https://bioinfo.uth.edu/TSGene/, 3 Cancer Gene Census; http://www.nature.com/nrc/journal/v4/n3/abs/nrc1299.html, 4 CancerGenes; http://nar.oxfordjournals.org/content/35/suppl_1/D721.long, 5 Network of Cancer Gene; http://ncg.kcl.ac.uk/index.php, 1Therapeutic Vulnerabilities in Cancer; http://cbio.mskcc.org/cancergenomics/statius/ |
| KEGG_GLYCEROPHOSPHOLIPID_METABOLISM REACTOME_PHOSPHOLIPID_METABOLISM REACTOME_METABOLISM_OF_LIPIDS_AND_LIPOPROTEINS | |
| OMIM | |
| Orphanet | |
| Disease | KEGG Disease: LPCAT4 |
| MedGen: LPCAT4 (Human Medical Genetics with Condition) | |
| ClinVar: LPCAT4 | |
| Phenotype | MGI: LPCAT4 (International Mouse Phenotyping Consortium) |
| PhenomicDB: LPCAT4 | |
| Mutations for LPCAT4 |
| * Under tables are showing count per each tissue to give us broad intuition about tissue specific mutation patterns.You can go to the detailed page for each mutation database's web site. |
| There's no structural variation information in COSMIC data for this gene. |
| * From mRNA Sanger sequences, Chitars2.0 arranged chimeric transcripts. This table shows LPCAT4 related fusion information. |
| ID | Head Gene | Tail Gene | Accession | Gene_a | qStart_a | qEnd_a | Chromosome_a | tStart_a | tEnd_a | Gene_a | qStart_a | qEnd_a | Chromosome_a | tStart_a | tEnd_a |
| Top |
| Mutation type/ Tissue ID | brca | cns | cerv | endome | haematopo | kidn | Lintest | liver | lung | ns | ovary | pancre | prost | skin | stoma | thyro | urina | |||
| Total # sample | 1 | |||||||||||||||||||
| GAIN (# sample) | ||||||||||||||||||||
| LOSS (# sample) | 1 |
| cf) Tissue ID; Tissue type (1; Breast, 2; Central_nervous_system, 3; Cervix, 4; Endometrium, 5; Haematopoietic_and_lymphoid_tissue, 6; Kidney, 7; Large_intestine, 8; Liver, 9; Lung, 10; NS, 11; Ovary, 12; Pancreas, 13; Prostate, 14; Skin, 15; Stomach, 16; Thyroid, 17; Urinary_tract) |
| Top |
|
 |
| Top |
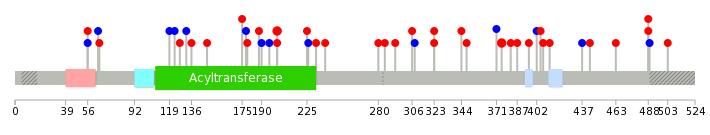
| Stat. for Non-Synonymous SNVs (# total SNVs=27) | (# total SNVs=9) |
 |  |
(# total SNVs=1) | (# total SNVs=0) |
 |
| Top |
| * When you move the cursor on each content, you can see more deailed mutation information on the Tooltip. Those are primary_site,primary_histology,mutation(aa),pubmedID. |
| GRCh37 position | Mutation(aa) | Unique sampleID count |
| chr15:34654982-34654982 | p.? | 3 |
| chr15:34652411-34652411 | p.? | 2 |
| chr15:34656262-34656262 | p.P202S | 2 |
| chr15:34653621-34653621 | p.A375T | 2 |
| chr15:34651436-34651436 | p.P489P | 1 |
| chr15:34655895-34655895 | p.V226V | 1 |
| chr15:34652394-34652394 | p.V387G | 1 |
| chr15:34657242-34657242 | p.R149* | 1 |
| chr15:34654491-34654491 | p.F306L | 1 |
| chr15:34657849-34657849 | p.I56I | 1 |
| Top |
|
 |
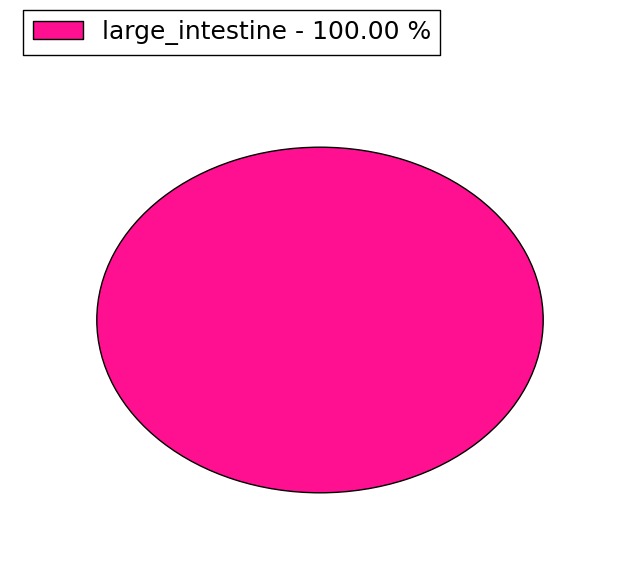
| Point Mutation/ Tissue ID | 1 | 2 | 3 | 4 | 5 | 6 | 7 | 8 | 9 | 10 | 11 | 12 | 13 | 14 | 15 | 16 | 17 | 18 | 19 | 20 |
| # sample | 5 | 1 | 1 | 5 | 1 | 9 | 3 | 3 | ||||||||||||
| # mutation | 5 | 1 | 1 | 5 | 1 | 10 | 3 | 4 | ||||||||||||
| nonsynonymous SNV | 4 | 1 | 3 | 6 | 3 | 3 | ||||||||||||||
| synonymous SNV | 1 | 1 | 2 | 1 | 4 | 1 |
| cf) Tissue ID; Tissue type (1; BLCA[Bladder Urothelial Carcinoma], 2; BRCA[Breast invasive carcinoma], 3; CESC[Cervical squamous cell carcinoma and endocervical adenocarcinoma], 4; COAD[Colon adenocarcinoma], 5; GBM[Glioblastoma multiforme], 6; Glioma Low Grade, 7; HNSC[Head and Neck squamous cell carcinoma], 8; KICH[Kidney Chromophobe], 9; KIRC[Kidney renal clear cell carcinoma], 10; KIRP[Kidney renal papillary cell carcinoma], 11; LAML[Acute Myeloid Leukemia], 12; LUAD[Lung adenocarcinoma], 13; LUSC[Lung squamous cell carcinoma], 14; OV[Ovarian serous cystadenocarcinoma ], 15; PAAD[Pancreatic adenocarcinoma], 16; PRAD[Prostate adenocarcinoma], 17; SKCM[Skin Cutaneous Melanoma], 18:STAD[Stomach adenocarcinoma], 19:THCA[Thyroid carcinoma], 20:UCEC[Uterine Corpus Endometrial Carcinoma]) |
| Top |
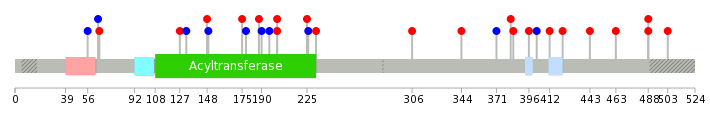
| * We represented just top 10 SNVs. When you move the cursor on each content, you can see more deailed mutation information on the Tooltip. Those are primary_site, primary_histology, mutation(aa), pubmedID. |
| Genomic Position | Mutation(aa) | Unique sampleID count |
| chr15:34651441 | p.S443L | 1 |
| chr15:34654491 | p.T190T | 1 |
| chr15:34657242 | p.E422D | 1 |
| chr15:34651801 | p.R188L | 1 |
| chr15:34655878 | p.A412V | 1 |
| chr15:34657245 | p.R178R | 1 |
| chr15:34651861 | p.G402G | 1 |
| chr15:34655895 | p.P175S | 1 |
| chr15:34657291 | p.L396V | 1 |
| chr15:34651923 | p.R149R | 1 |
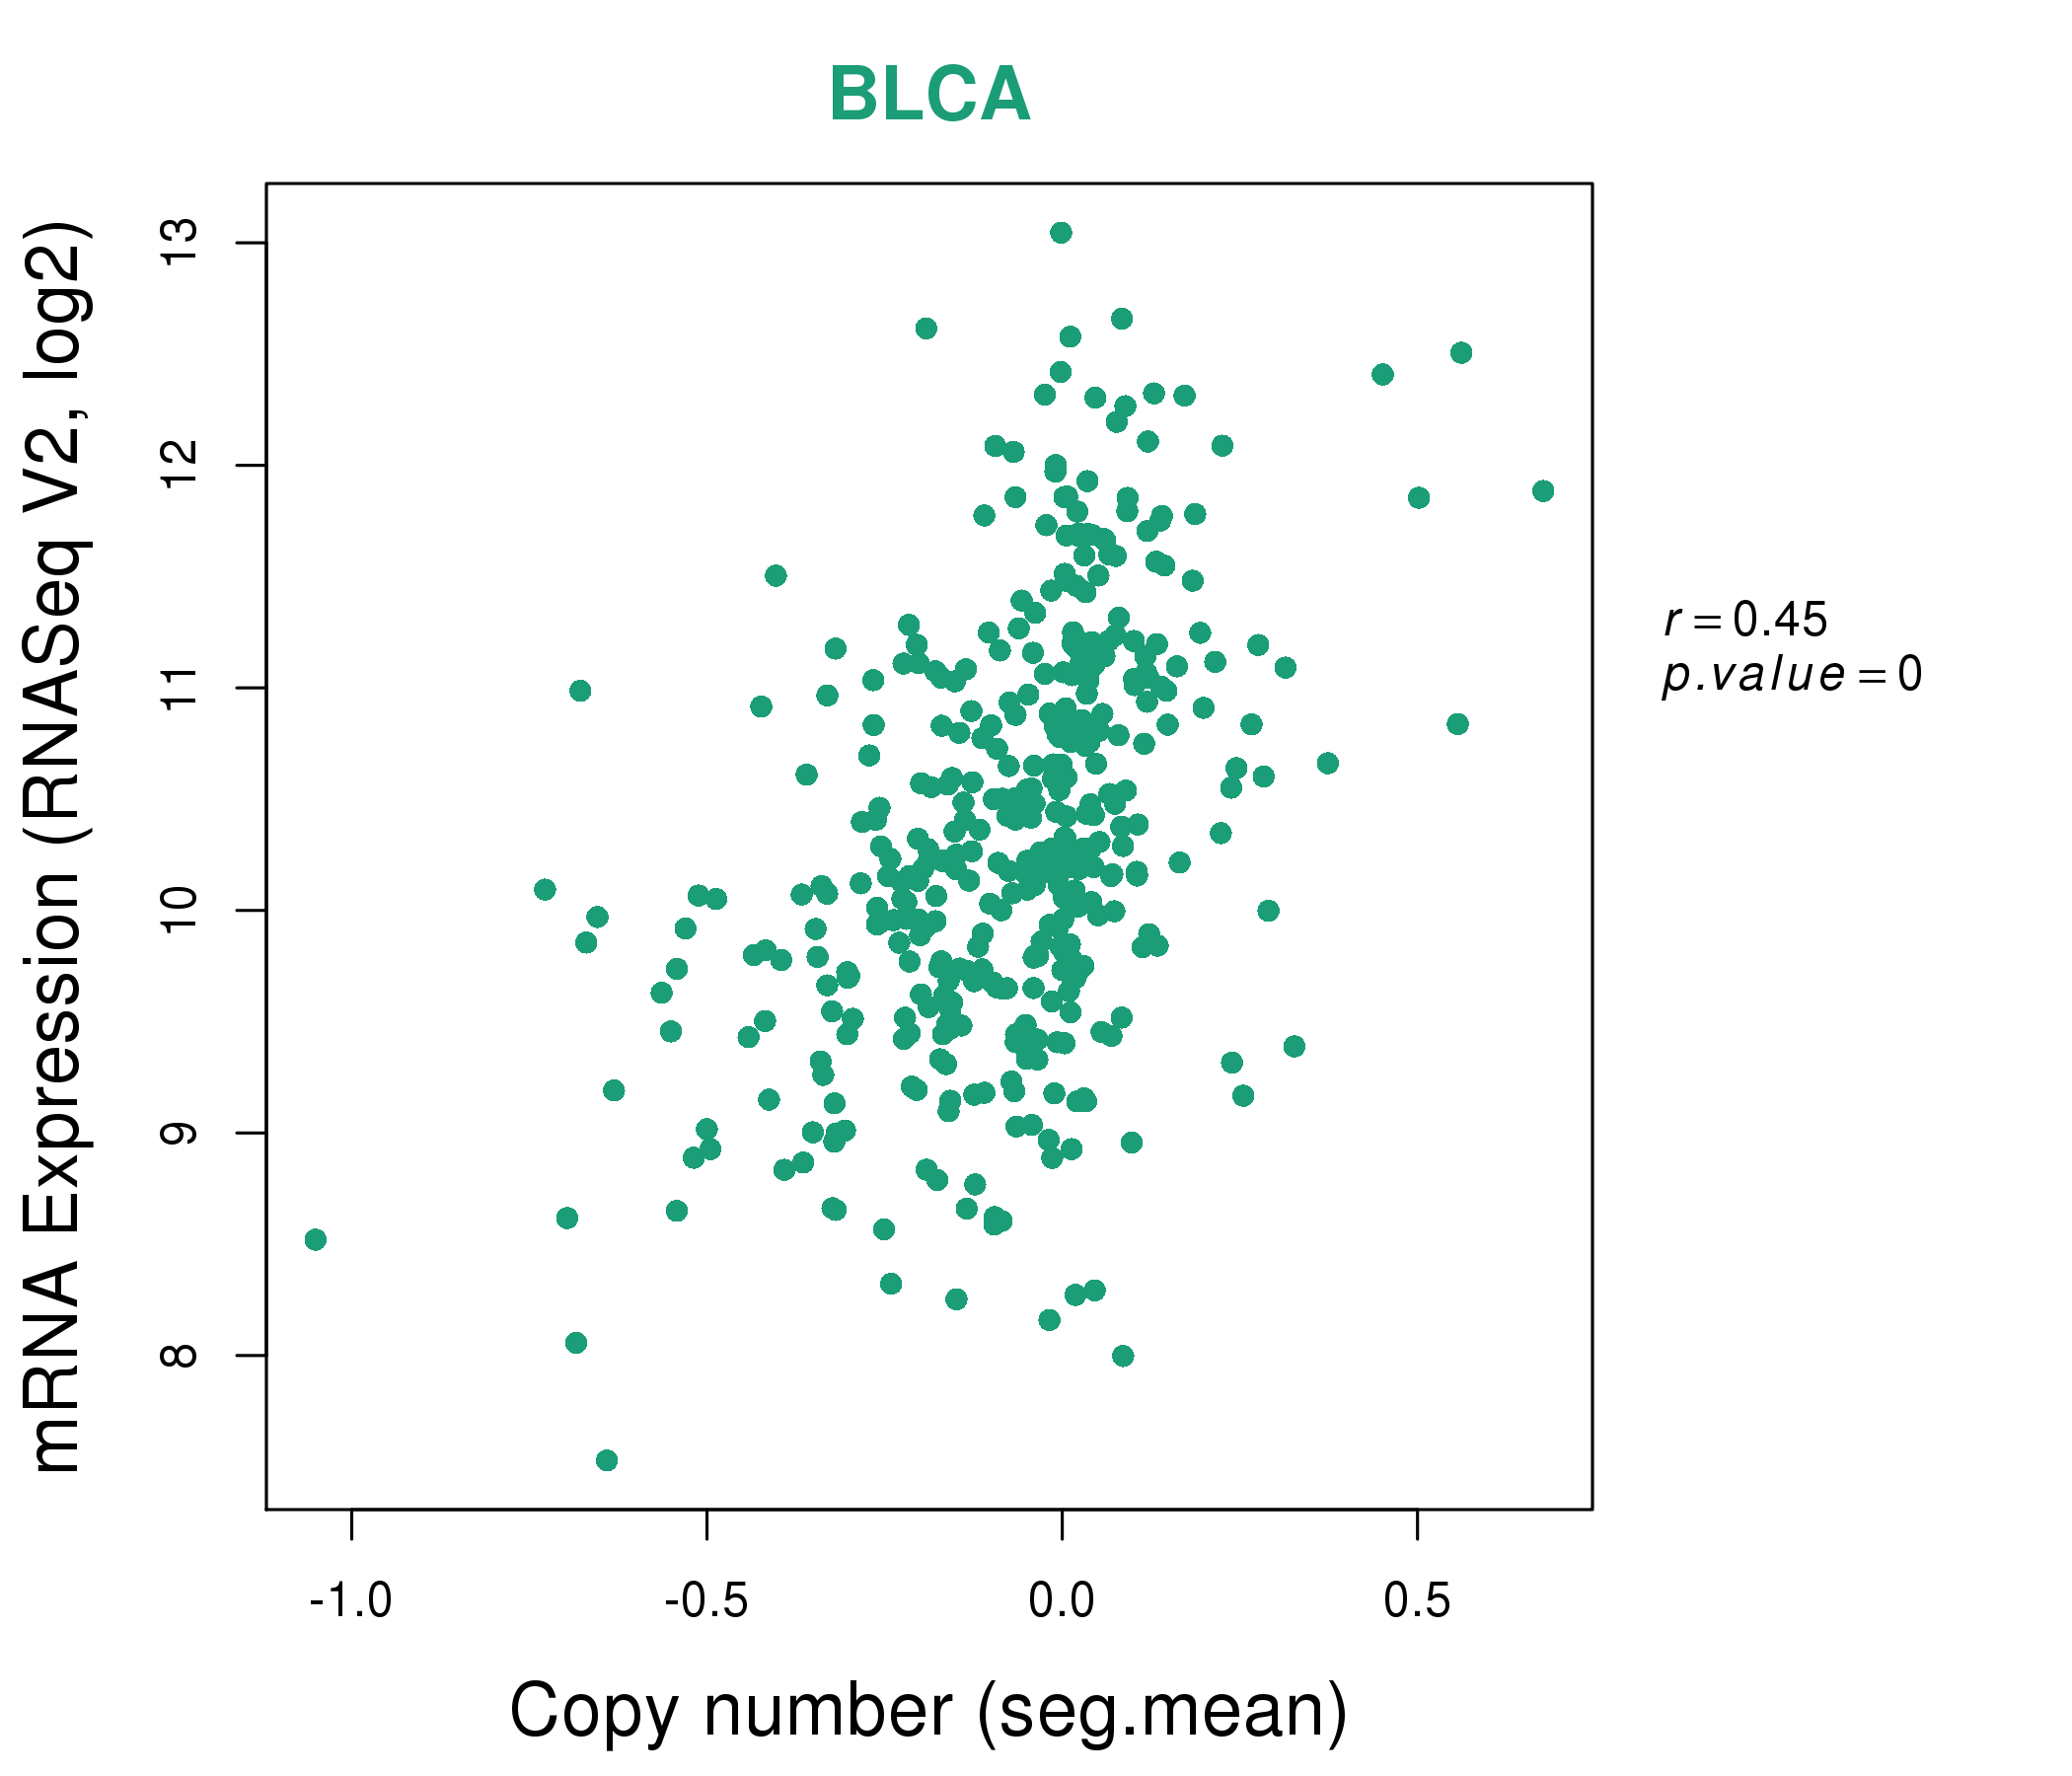
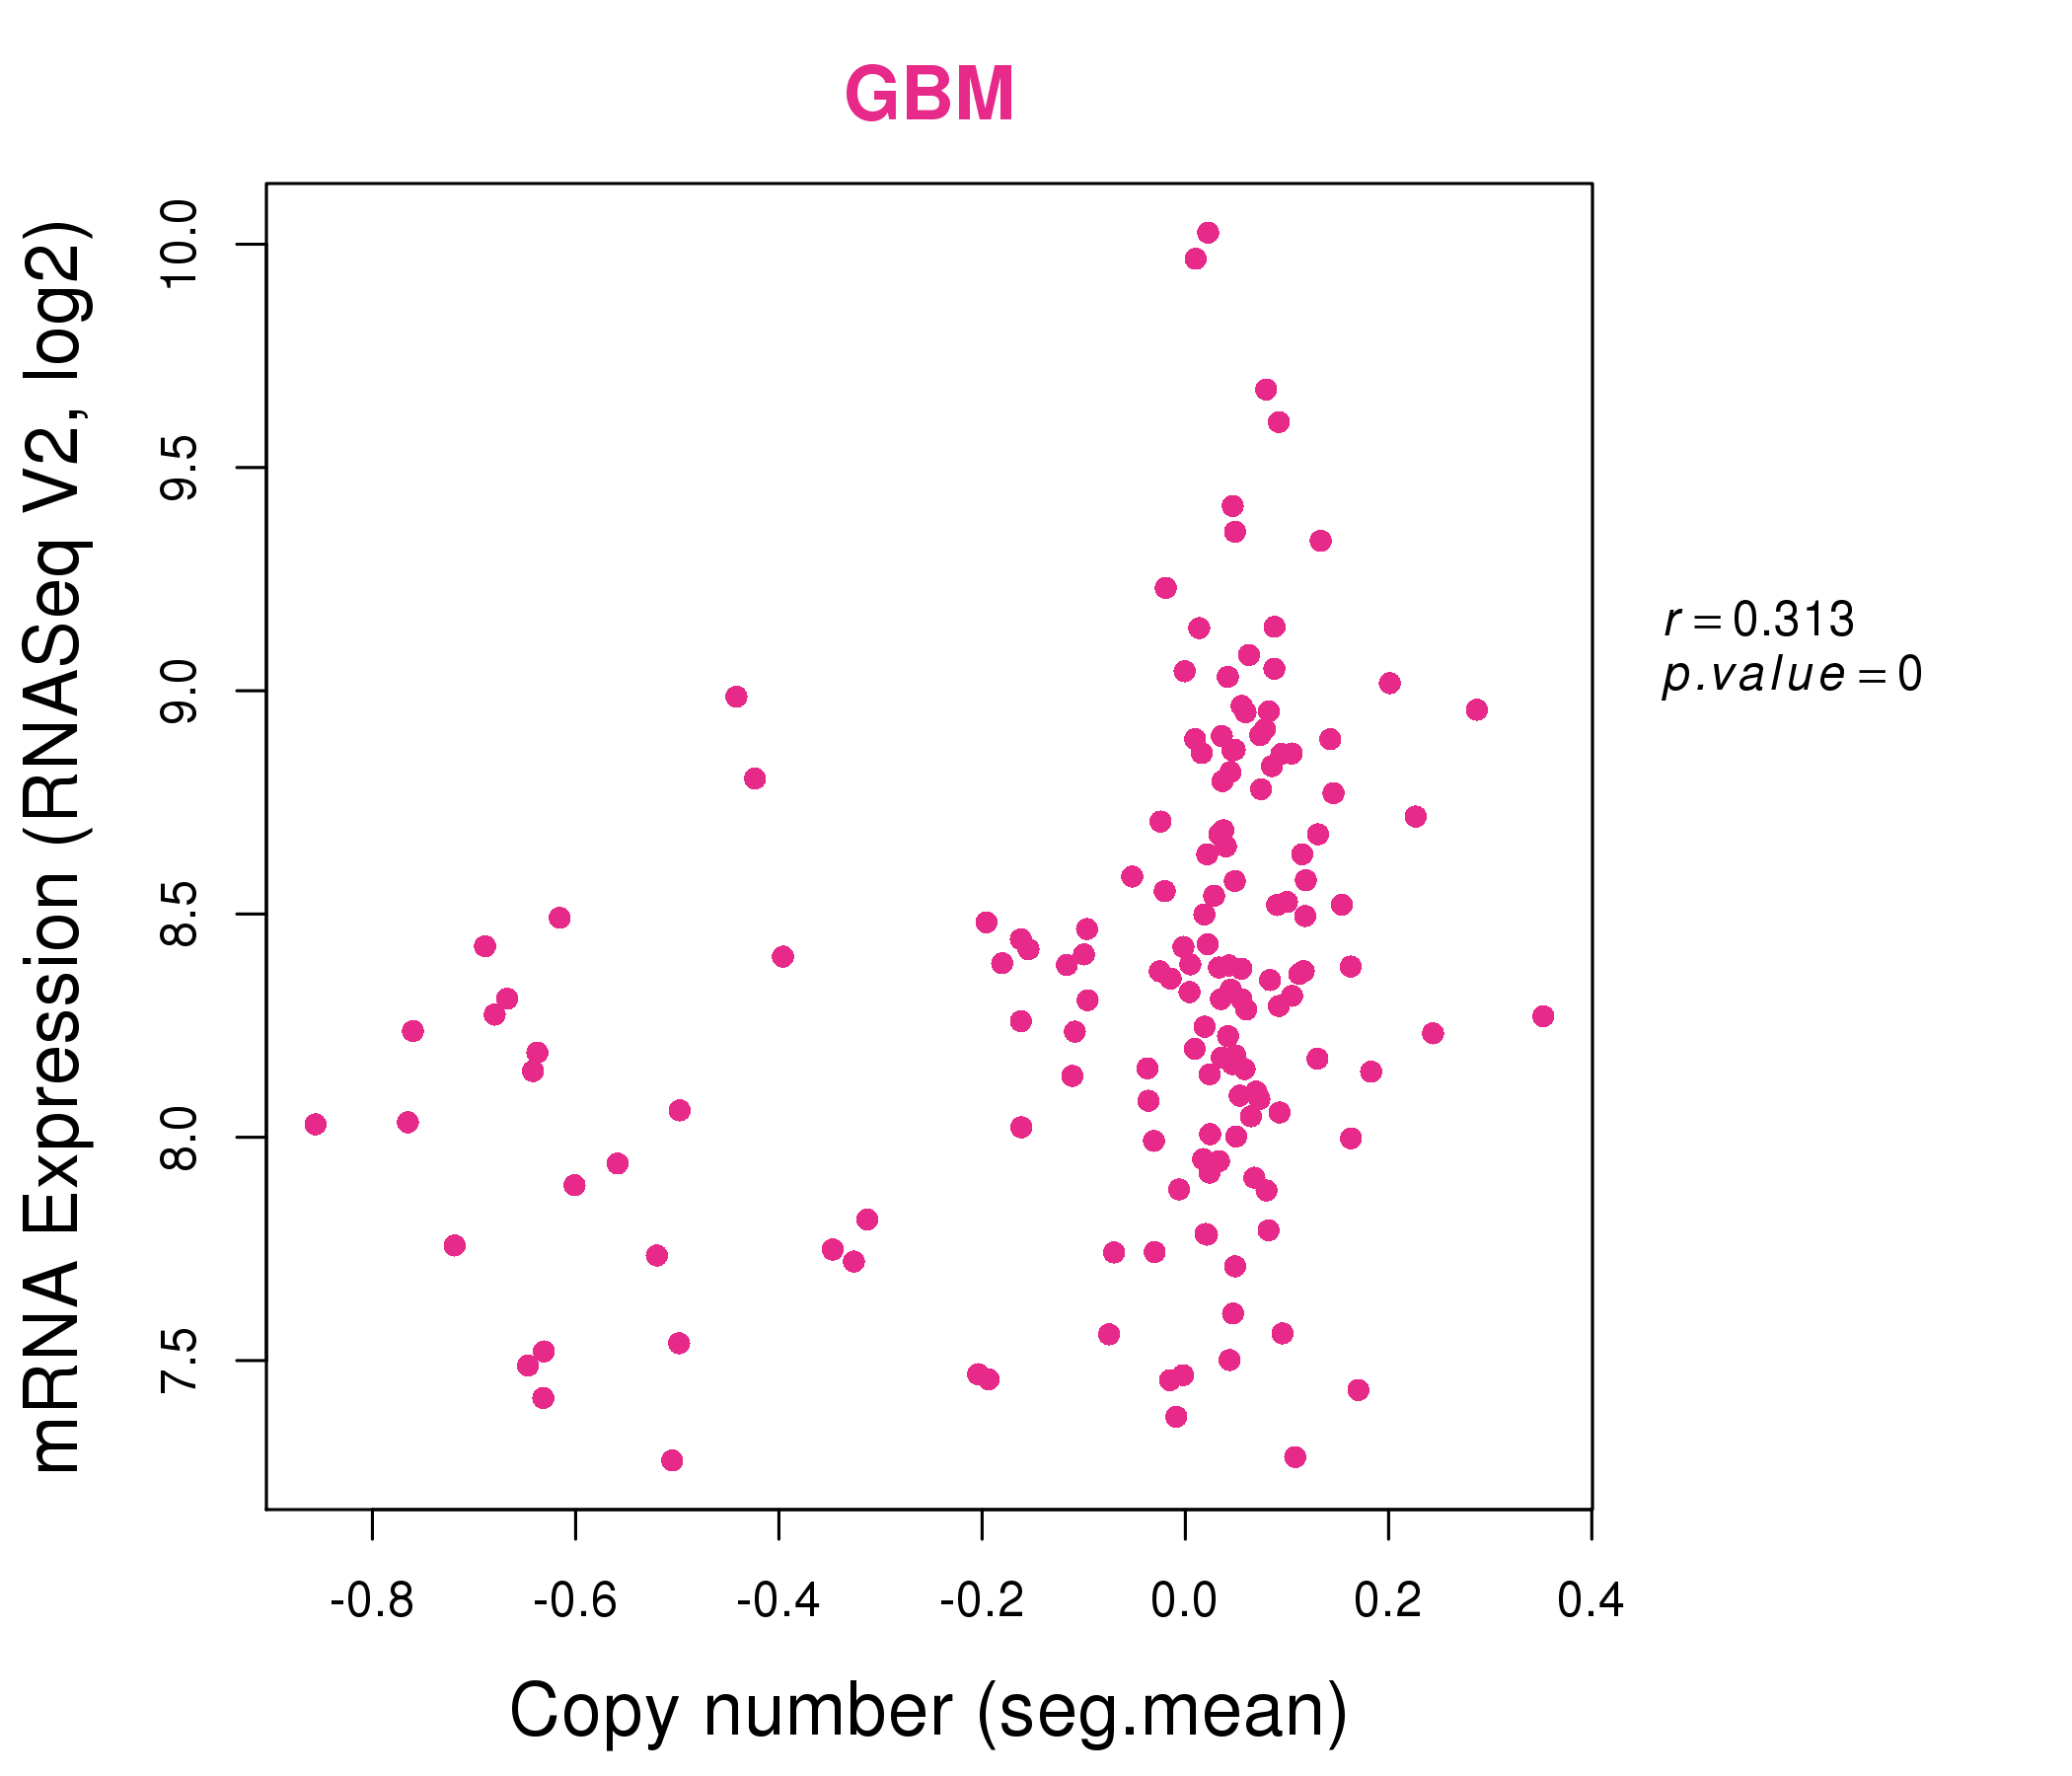
| * Copy number data were extracted from TCGA using R package TCGA-Assembler. The URLs of all public data files on TCGA DCC data server were gathered on Jan-05-2015. Function ProcessCNAData in TCGA-Assembler package was used to obtain gene-level copy number value which is calculated as the average copy number of the genomic region of a gene. |
 |
| cf) Tissue ID[Tissue type]: BLCA[Bladder Urothelial Carcinoma], BRCA[Breast invasive carcinoma], CESC[Cervical squamous cell carcinoma and endocervical adenocarcinoma], COAD[Colon adenocarcinoma], GBM[Glioblastoma multiforme], Glioma Low Grade, HNSC[Head and Neck squamous cell carcinoma], KICH[Kidney Chromophobe], KIRC[Kidney renal clear cell carcinoma], KIRP[Kidney renal papillary cell carcinoma], LAML[Acute Myeloid Leukemia], LUAD[Lung adenocarcinoma], LUSC[Lung squamous cell carcinoma], OV[Ovarian serous cystadenocarcinoma ], PAAD[Pancreatic adenocarcinoma], PRAD[Prostate adenocarcinoma], SKCM[Skin Cutaneous Melanoma], STAD[Stomach adenocarcinoma], THCA[Thyroid carcinoma], UCEC[Uterine Corpus Endometrial Carcinoma] |
| Top |
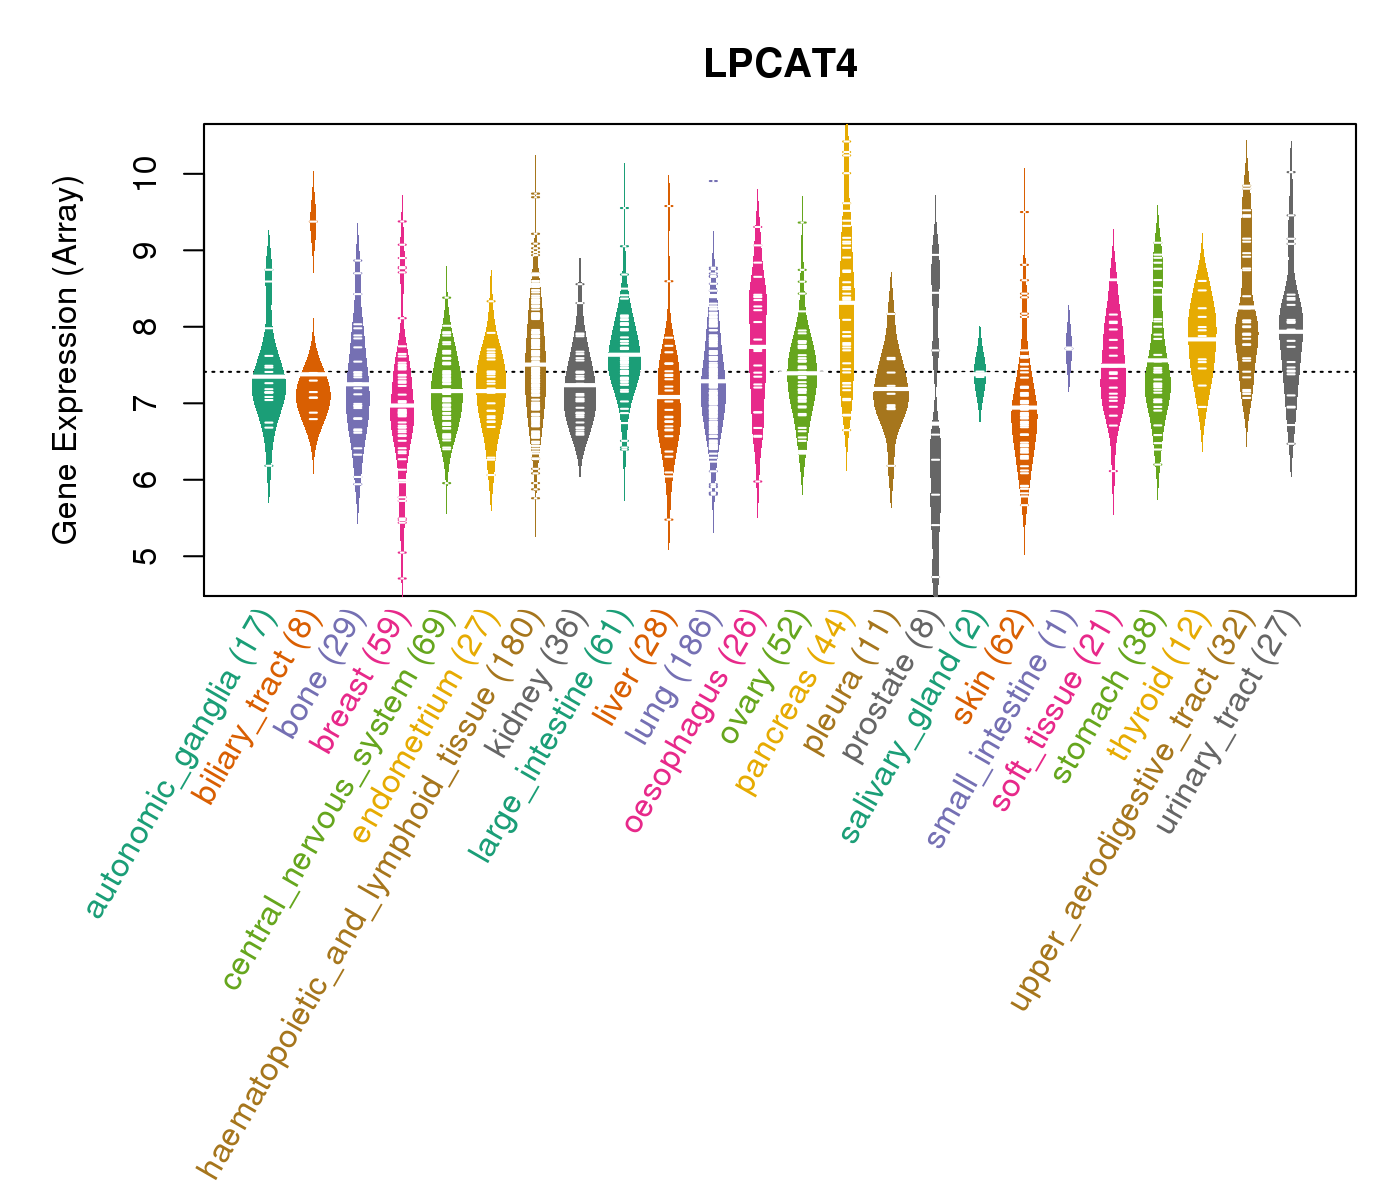
| Gene Expression for LPCAT4 |
| * CCLE gene expression data were extracted from CCLE_Expression_Entrez_2012-10-18.res: Gene-centric RMA-normalized mRNA expression data. |
 |
| * Normalized gene expression data of RNASeqV2 was extracted from TCGA using R package TCGA-Assembler. The URLs of all public data files on TCGA DCC data server were gathered at Jan-05-2015. Only eight cancer types have enough normal control samples for differential expression analysis. (t test, adjusted p<0.05 (using Benjamini-Hochberg FDR)) |
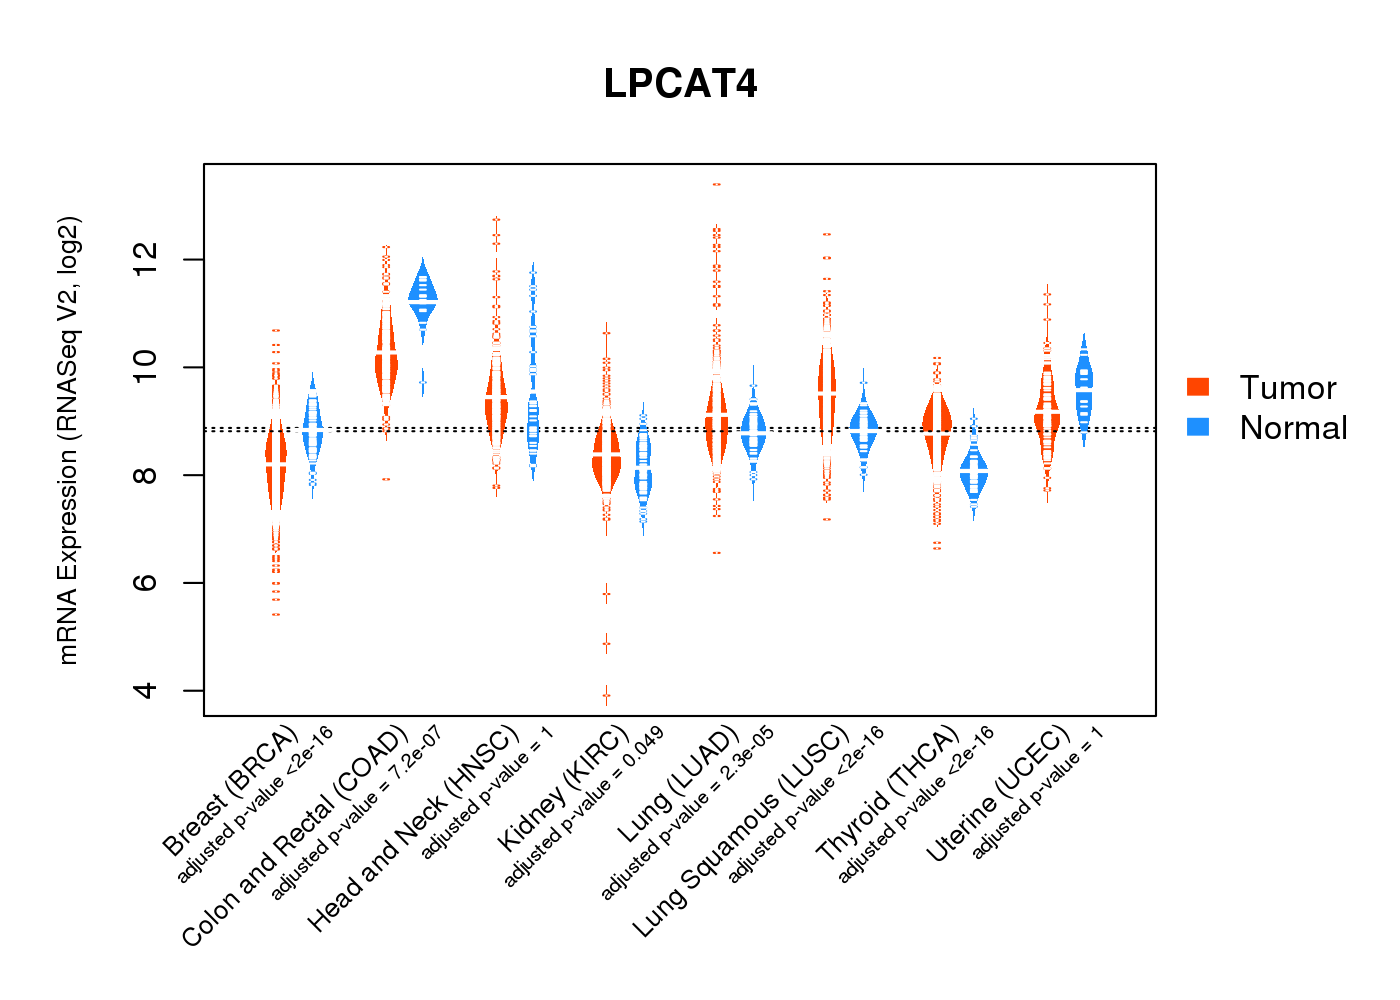 |
| Top |
| * This plots show the correlation between CNV and gene expression. |
: Open all plots for all cancer types
 |
|
 |
|

| Top |
| Gene-Gene Network Information |
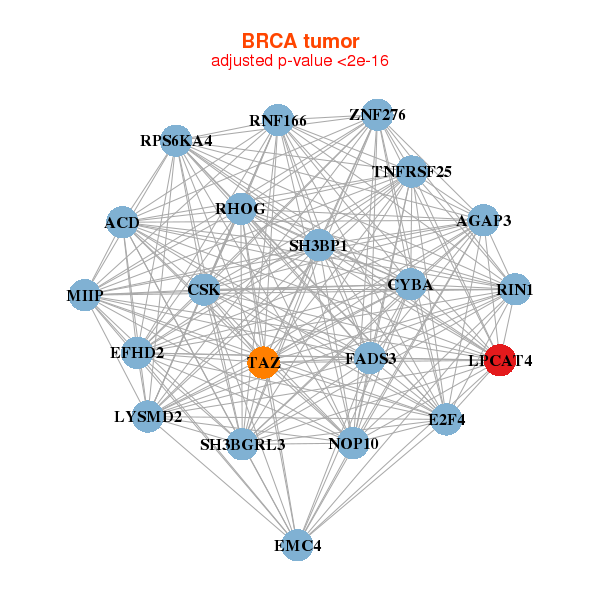
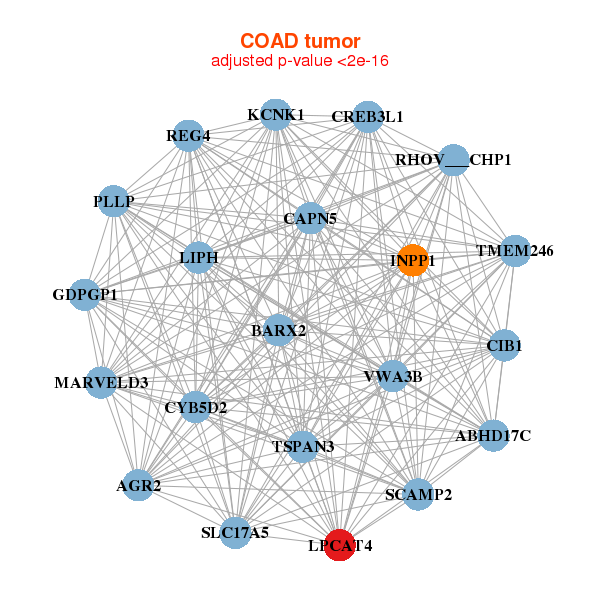
| * Co-Expression network figures were drawn using R package igraph. Only the top 20 genes with the highest correlations were shown. Red circle: input gene, orange circle: cell metabolism gene, sky circle: other gene |
: Open all plots for all cancer types
 |
|
| ACD,AGAP3,CSK,CYBA,E2F4,EFHD2,FADS3, LPCAT4,LYSMD2,MIIP,NOP10,RHOG,RIN1,RNF166, RPS6KA4,SH3BGRL3,SH3BP1,TAZ,EMC4,TNFRSF25,ZNF276 | ADM5,CALHM2,CLDN15,CYP21A2,ACKR1,FAM167B,TMEM255B, FLT3LG,FXYD5,IFI27L2,IFITM2,IFITM3,LPCAT4,LYL1, MFNG,RASIP1,RHOG,SECTM1,SPNS2,TMEM173,TMEM39B |
 |
|
| AGR2,BARX2,GDPGP1,TMEM246,CAPN5,RHOV___CHP1,CIB1, CREB3L1,CYB5D2,ABHD17C,INPP1,KCNK1,LIPH,LPCAT4, MARVELD3,PLLP,REG4,SCAMP2,SLC17A5,TSPAN3,VWA3B | AP1G2,ARHGEF10L,PROSER2,C10orf95,TMEM246,C9orf152,SPECC1, ESRP2,FLJ32063,FOXD2,FUK,GOLM1,HOXB9,ILDR1, LIMK2,LPAR5,LPCAT4,PPFIA3,PWWP2B,TMEM44,ZBTB7C |
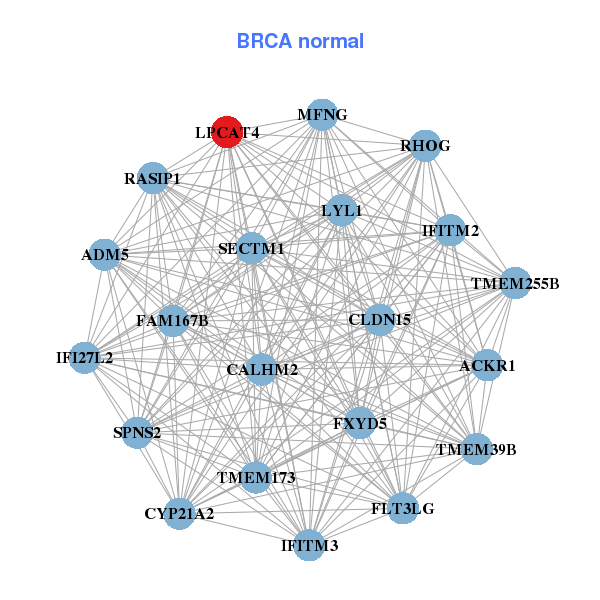
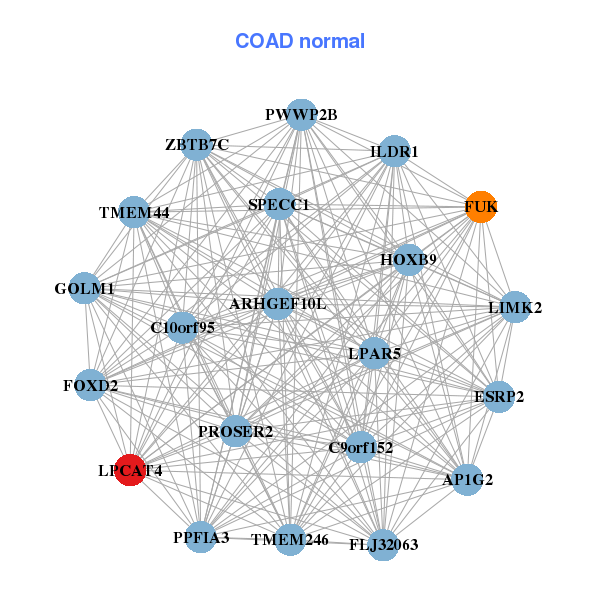
| * Co-Expression network figures were drawn using R package igraph. Only the top 20 genes with the highest correlations were shown. Red circle: input gene, orange circle: cell metabolism gene, sky circle: other gene |
: Open all plots for all cancer types
| Top |
: Open all interacting genes' information including KEGG pathway for all interacting genes from DAVID
| Top |
| Pharmacological Information for LPCAT4 |
| There's no related Drug. |
| Top |
| Cross referenced IDs for LPCAT4 |
| * We obtained these cross-references from Uniprot database. It covers 150 different DBs, 18 categories. http://www.uniprot.org/help/cross_references_section |
: Open all cross reference information
|
Copyright © 2016-Present - The Univsersity of Texas Health Science Center at Houston @ |