|
|||||||||||||||||||||||||||||||||||||||||||||||||||||||||||||||||||||||||||||||||||||||||||||||||||||||||||||||||||||||||||||||||||||||||||||||||||||||||||||||||||||||||||||||||||||||||||||||||||||||||||||||||||||||||||||||||||||||||||||||||||||||||||||||||||||||||||||||||||||||||||||||||||||||||||||||||||||||||||||||||||||||||||||||||||
| |
| Phenotypic Information (metabolism pathway, cancer, disease, phenome) |
| |
| |
| Gene-Gene Network Information: Co-Expression Network, Interacting Genes & KEGG |
| |
|


| Gene Summary for GAA |
| Basic gene info. | Gene symbol | GAA |
| Gene name | glucosidase, alpha; acid | |
| Synonyms | LYAG | |
| Cytomap | UCSC genome browser: 17q25.2-q25.3 | |
| Genomic location | chr17 :78075354-78093679 | |
| Type of gene | protein-coding | |
| RefGenes | NM_000152.3, NM_001079803.1,NM_001079804.1, | |
| Ensembl id | ENSG00000171298 | |
| Description | acid maltaseaglucosidase alfalysosomal alpha-glucosidase | |
| Modification date | 20141219 | |
| dbXrefs | MIM : 606800 | |
| HGNC : HGNC | ||
| Ensembl : ENSG00000171298 | ||
| HPRD : 06006 | ||
| Vega : OTTHUMG00000177537 | ||
| Protein | UniProt: go to UniProt's Cross Reference DB Table | |
| Expression | CleanEX: HS_GAA | |
| BioGPS: 2548 | ||
| Gene Expression Atlas: ENSG00000171298 | ||
| The Human Protein Atlas: ENSG00000171298 | ||
| Pathway | NCI Pathway Interaction Database: GAA | |
| KEGG: GAA | ||
| REACTOME: GAA | ||
| ConsensusPathDB | ||
| Pathway Commons: GAA | ||
| Metabolism | MetaCyc: GAA | |
| HUMANCyc: GAA | ||
| Regulation | Ensembl's Regulation: ENSG00000171298 | |
| miRBase: chr17 :78,075,354-78,093,679 | ||
| TargetScan: NM_000152 | ||
| cisRED: ENSG00000171298 | ||
| Context | iHOP: GAA | |
| cancer metabolism search in PubMed: GAA | ||
| UCL Cancer Institute: GAA | ||
| Assigned class in ccmGDB | C | |
| Top |
| Phenotypic Information for GAA(metabolism pathway, cancer, disease, phenome) |
| Cancer | CGAP: GAA |
| Familial Cancer Database: GAA | |
| * This gene is included in those cancer gene databases. |
|
|
|
|
|
|
| |||||||||||||||||||||||||||||||||||||||||||||||||||||||||||||||||||||||||||||||||||||||||||||||||||||||||||||||||||||||||||||||||||||||||||||||||||||||||||||||||||||||||||||||||||||||||||||||||||||||||||||||||||||||||||||||||||||||||||||||||||||||||||||||||||||||||||||||||||||||||||||||||||||||||||||||||||||||||||||||||||||||||||||
Oncogene 1 | Significant driver gene in | ||||||||||||||||||||||||||||||||||||||||||||||||||||||||||||||||||||||||||||||||||||||||||||||||||||||||||||||||||||||||||||||||||||||||||||||||||||||||||||||||||||||||||||||||||||||||||||||||||||||||||||||||||||||||||||||||||||||||||||||||||||||||||||||||||||||||||||||||||||||||||||||||||||||||||||||||||||||||||||||||||||||||||||||||||
| cf) number; DB name 1 Oncogene; http://nar.oxfordjournals.org/content/35/suppl_1/D721.long, 2 Tumor Suppressor gene; https://bioinfo.uth.edu/TSGene/, 3 Cancer Gene Census; http://www.nature.com/nrc/journal/v4/n3/abs/nrc1299.html, 4 CancerGenes; http://nar.oxfordjournals.org/content/35/suppl_1/D721.long, 5 Network of Cancer Gene; http://ncg.kcl.ac.uk/index.php, 1Therapeutic Vulnerabilities in Cancer; http://cbio.mskcc.org/cancergenomics/statius/ |
| KEGG_GALACTOSE_METABOLISM KEGG_STARCH_AND_SUCROSE_METABOLISM | |
| OMIM | |
| Orphanet | |
| Disease | KEGG Disease: GAA |
| MedGen: GAA (Human Medical Genetics with Condition) | |
| ClinVar: GAA | |
| Phenotype | MGI: GAA (International Mouse Phenotyping Consortium) |
| PhenomicDB: GAA | |
| Mutations for GAA |
| * Under tables are showing count per each tissue to give us broad intuition about tissue specific mutation patterns.You can go to the detailed page for each mutation database's web site. |
| - Statistics for Tissue and Mutation type | Top |
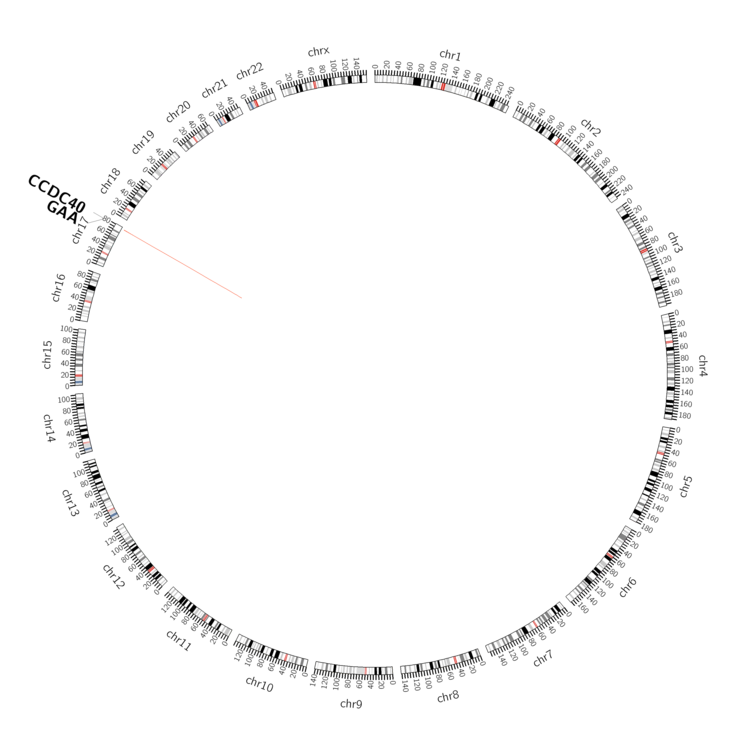 |
| - For Inter-chromosomal Variations |
| There's no inter-chromosomal structural variation. |
| - For Intra-chromosomal Variations |
| * Intra-chromosomal variantions includes 'intrachromosomal amplicon to amplicon', 'intrachromosomal amplicon to non-amplified dna', 'intrachromosomal deletion', 'intrachromosomal fold-back inversion', 'intrachromosomal inversion', 'intrachromosomal tandem duplication', 'Intrachromosomal unknown type', 'intrachromosomal with inverted orientation', 'intrachromosomal with non-inverted orientation'. |
 |
| Sample | Symbol_a | Chr_a | Start_a | End_a | Symbol_b | Chr_b | Start_b | End_b |
| pancreas | GAA | chr17 | 78083258 | 78083278 | CCDC40 | chr17 | 78071945 | 78071965 |
| cf) Tissue number; Tissue name (1;Breast, 2;Central_nervous_system, 3;Haematopoietic_and_lymphoid_tissue, 4;Large_intestine, 5;Liver, 6;Lung, 7;Ovary, 8;Pancreas, 9;Prostate, 10;Skin, 11;Soft_tissue, 12;Upper_aerodigestive_tract) |
| * From mRNA Sanger sequences, Chitars2.0 arranged chimeric transcripts. This table shows GAA related fusion information. |
| ID | Head Gene | Tail Gene | Accession | Gene_a | qStart_a | qEnd_a | Chromosome_a | tStart_a | tEnd_a | Gene_a | qStart_a | qEnd_a | Chromosome_a | tStart_a | tEnd_a |
| Top |
| Mutation type/ Tissue ID | brca | cns | cerv | endome | haematopo | kidn | Lintest | liver | lung | ns | ovary | pancre | prost | skin | stoma | thyro | urina | |||
| Total # sample | 2 | 1 | 3 | 1 | 1 | |||||||||||||||
| GAIN (# sample) | 2 | 1 | 1 | 1 | ||||||||||||||||
| LOSS (# sample) | 3 |
| cf) Tissue ID; Tissue type (1; Breast, 2; Central_nervous_system, 3; Cervix, 4; Endometrium, 5; Haematopoietic_and_lymphoid_tissue, 6; Kidney, 7; Large_intestine, 8; Liver, 9; Lung, 10; NS, 11; Ovary, 12; Pancreas, 13; Prostate, 14; Skin, 15; Stomach, 16; Thyroid, 17; Urinary_tract) |
| Top |
|
 |
| Top |
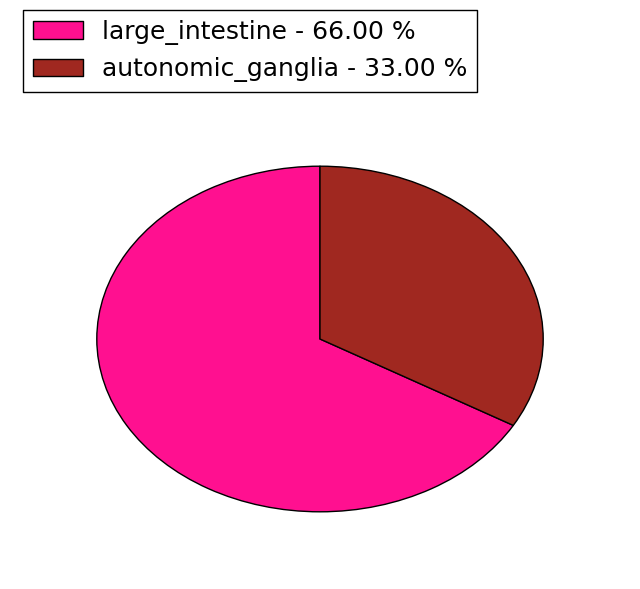
| Stat. for Non-Synonymous SNVs (# total SNVs=57) | (# total SNVs=32) |
 |  |
(# total SNVs=3) | (# total SNVs=2) |
 | 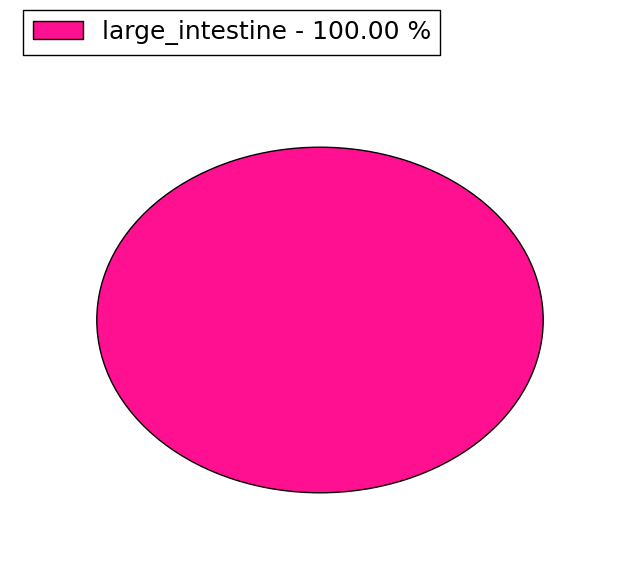 |
| Top |
| * When you move the cursor on each content, you can see more deailed mutation information on the Tooltip. Those are primary_site,primary_histology,mutation(aa),pubmedID. |
| GRCh37 position | Mutation(aa) | Unique sampleID count |
| chr17:78081655-78081655 | p.G305G | 4 |
| chr17:78091405-78091405 | p.V780I | 4 |
| chr17:78079669-78079669 | p.R223H | 3 |
| chr17:78087109-78087109 | p.T711T | 3 |
| chr17:78078709-78078709 | p.C108C | 3 |
| chr17:78090819-78090819 | p.E748Q | 3 |
| chr17:78081640-78081640 | p.A300A | 2 |
| chr17:78091999-78091999 | p.G830V | 2 |
| chr17:78078636-78078637 | p.N87fs*9 | 2 |
| chr17:78081661-78081661 | p.A307A | 2 |
| Top |
|
 |
| Point Mutation/ Tissue ID | 1 | 2 | 3 | 4 | 5 | 6 | 7 | 8 | 9 | 10 | 11 | 12 | 13 | 14 | 15 | 16 | 17 | 18 | 19 | 20 |
| # sample | 2 | 9 | 3 | 3 | 2 | 4 | 1 | 1 | 1 | 1 | 9 | 5 | 1 | 7 | ||||||
| # mutation | 2 | 10 | 3 | 3 | 2 | 4 | 1 | 1 | 1 | 1 | 12 | 5 | 1 | 7 | ||||||
| nonsynonymous SNV | 2 | 9 | 1 | 3 | 1 | 4 | 1 | 1 | 5 | 2 | 4 | |||||||||
| synonymous SNV | 1 | 2 | 1 | 1 | 1 | 7 | 3 | 1 | 3 |
| cf) Tissue ID; Tissue type (1; BLCA[Bladder Urothelial Carcinoma], 2; BRCA[Breast invasive carcinoma], 3; CESC[Cervical squamous cell carcinoma and endocervical adenocarcinoma], 4; COAD[Colon adenocarcinoma], 5; GBM[Glioblastoma multiforme], 6; Glioma Low Grade, 7; HNSC[Head and Neck squamous cell carcinoma], 8; KICH[Kidney Chromophobe], 9; KIRC[Kidney renal clear cell carcinoma], 10; KIRP[Kidney renal papillary cell carcinoma], 11; LAML[Acute Myeloid Leukemia], 12; LUAD[Lung adenocarcinoma], 13; LUSC[Lung squamous cell carcinoma], 14; OV[Ovarian serous cystadenocarcinoma ], 15; PAAD[Pancreatic adenocarcinoma], 16; PRAD[Prostate adenocarcinoma], 17; SKCM[Skin Cutaneous Melanoma], 18:STAD[Stomach adenocarcinoma], 19:THCA[Thyroid carcinoma], 20:UCEC[Uterine Corpus Endometrial Carcinoma]) |
| Top |
| * We represented just top 10 SNVs. When you move the cursor on each content, you can see more deailed mutation information on the Tooltip. Those are primary_site, primary_histology, mutation(aa), pubmedID. |
| Genomic Position | Mutation(aa) | Unique sampleID count |
| chr17:78091451 | p.E795G,GAA | 2 |
| chr17:78083851 | p.F245F,GAA | 1 |
| chr17:78092558 | p.E521K,GAA | 1 |
| chr17:78078786 | p.T777M,GAA | 1 |
| chr17:78086728 | p.A261A,GAA | 1 |
| chr17:78081639 | p.F525F,GAA | 1 |
| chr17:78084546 | p.V778M,GAA | 1 |
| chr17:78078846 | p.A300V,GAA | 1 |
| chr17:78087028 | p.A554V,GAA | 1 |
| chr17:78081640 | p.F35V,GAA | 1 |
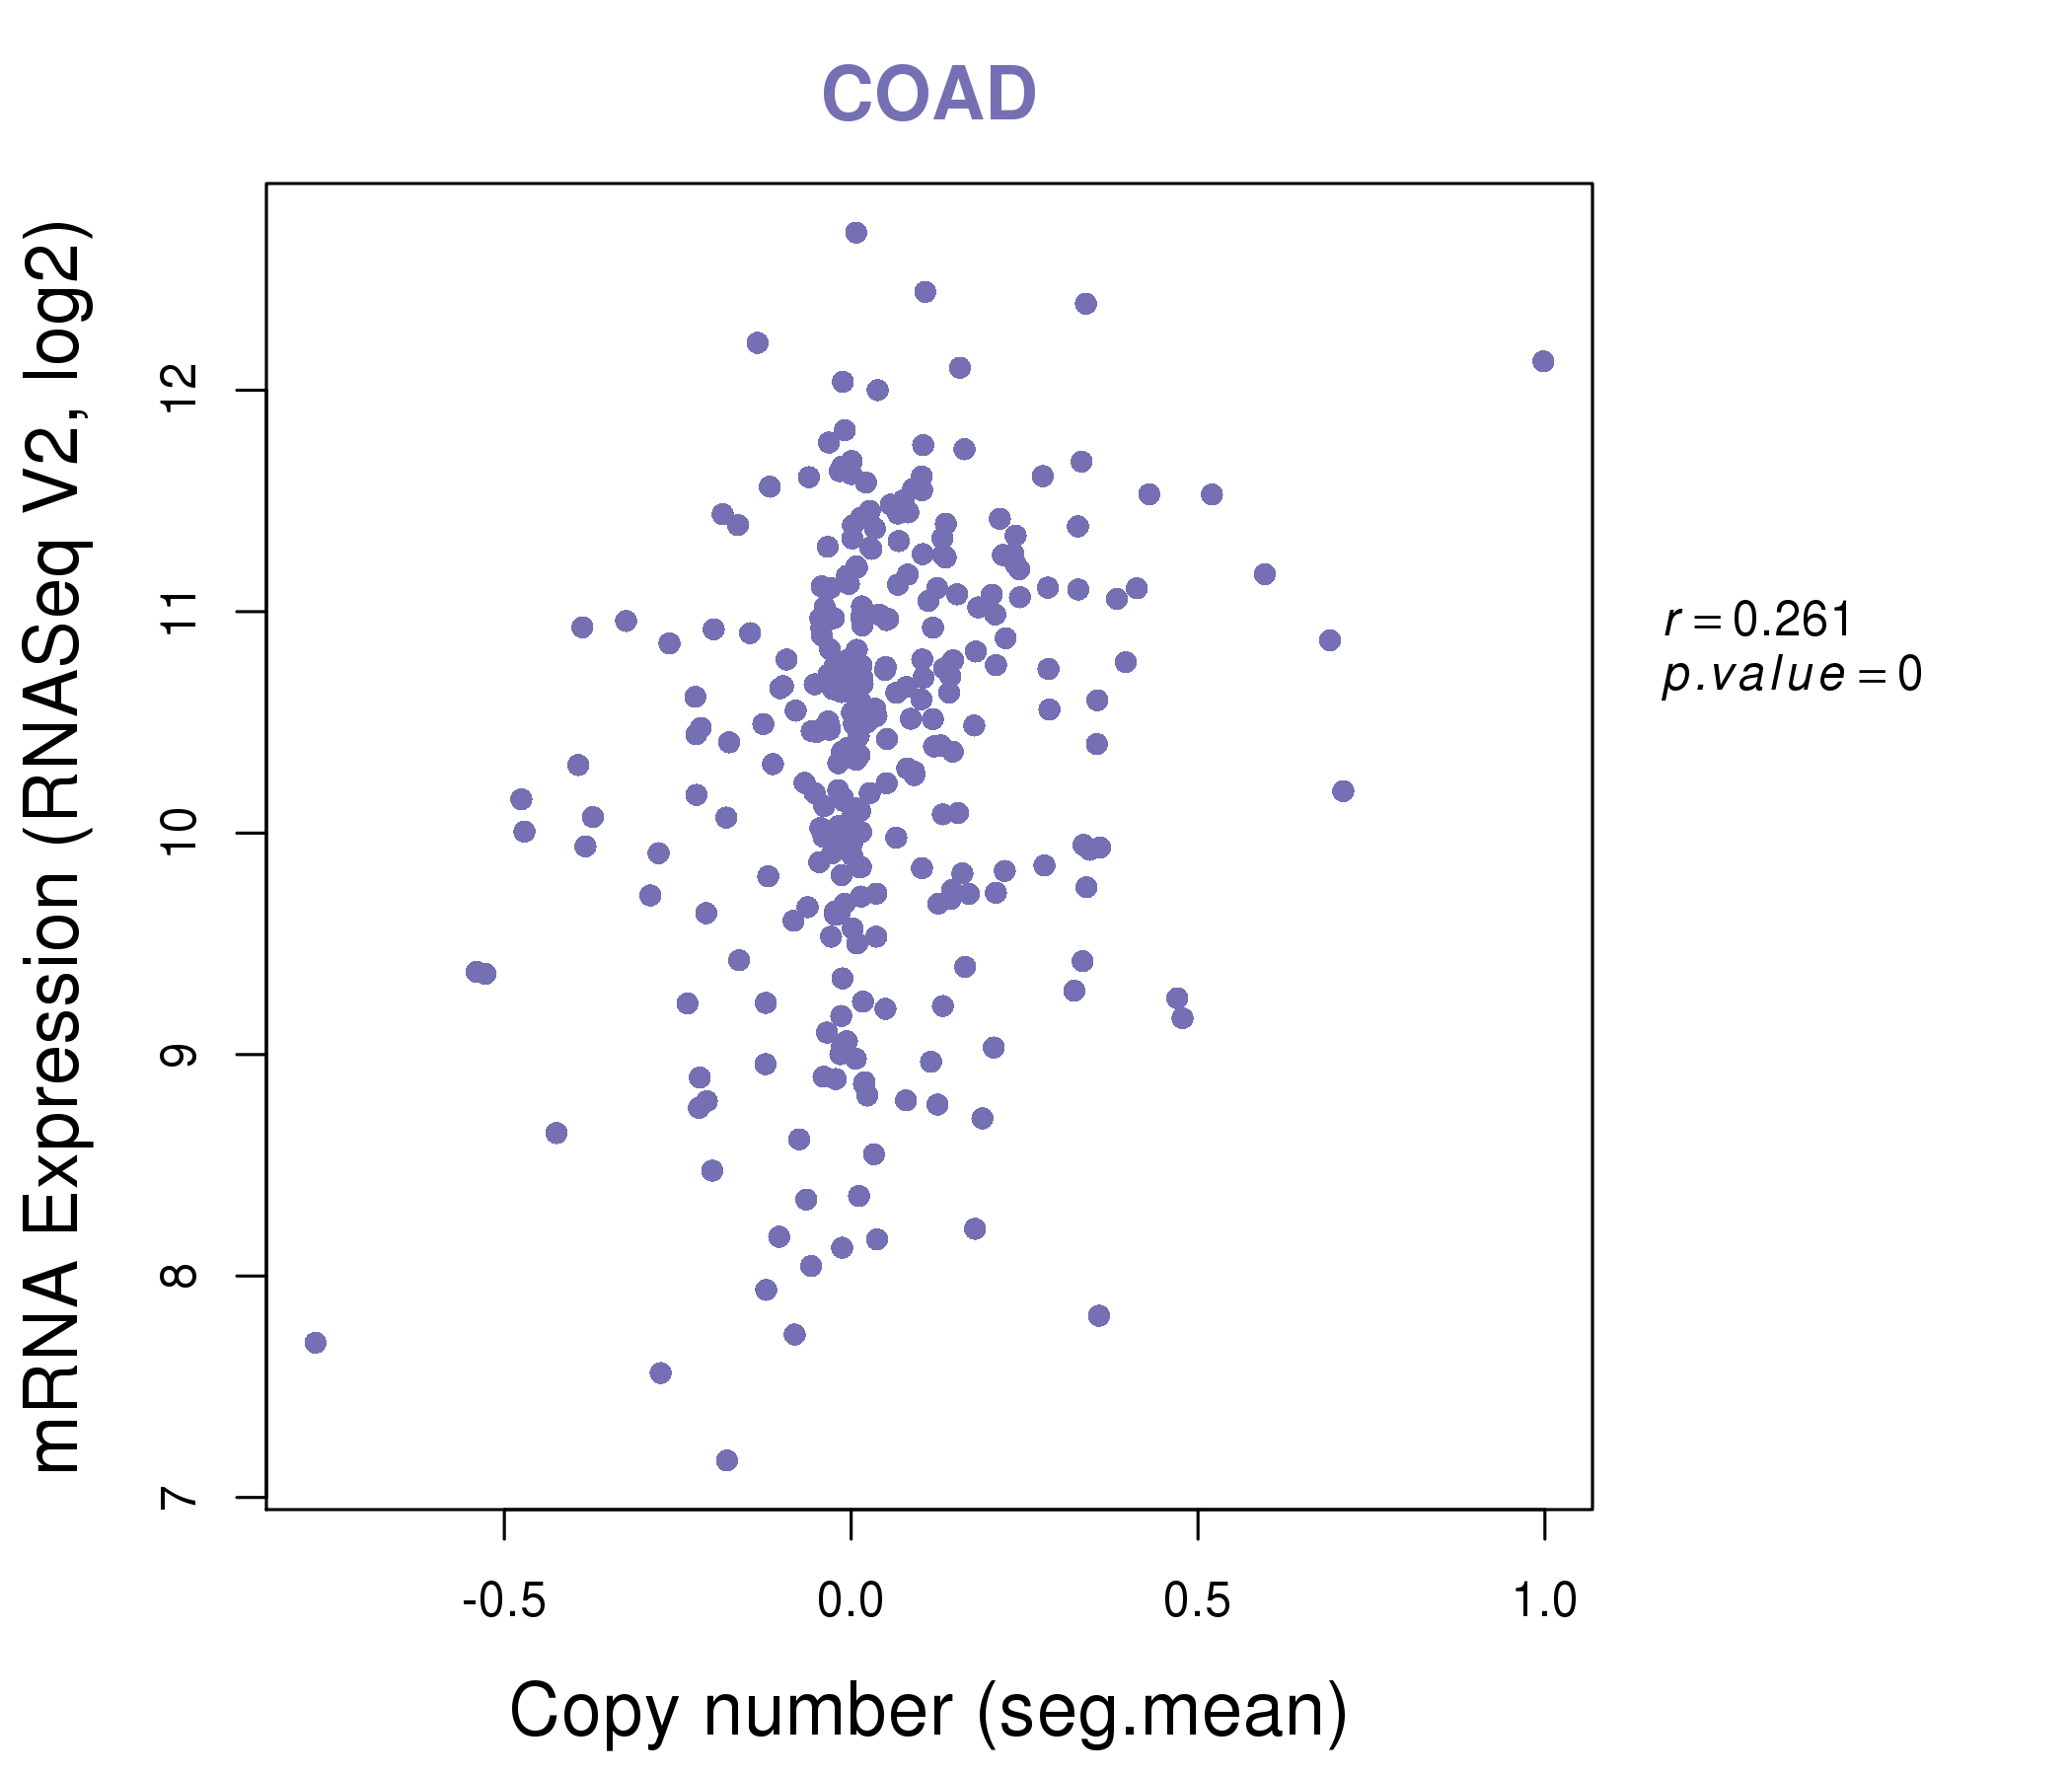
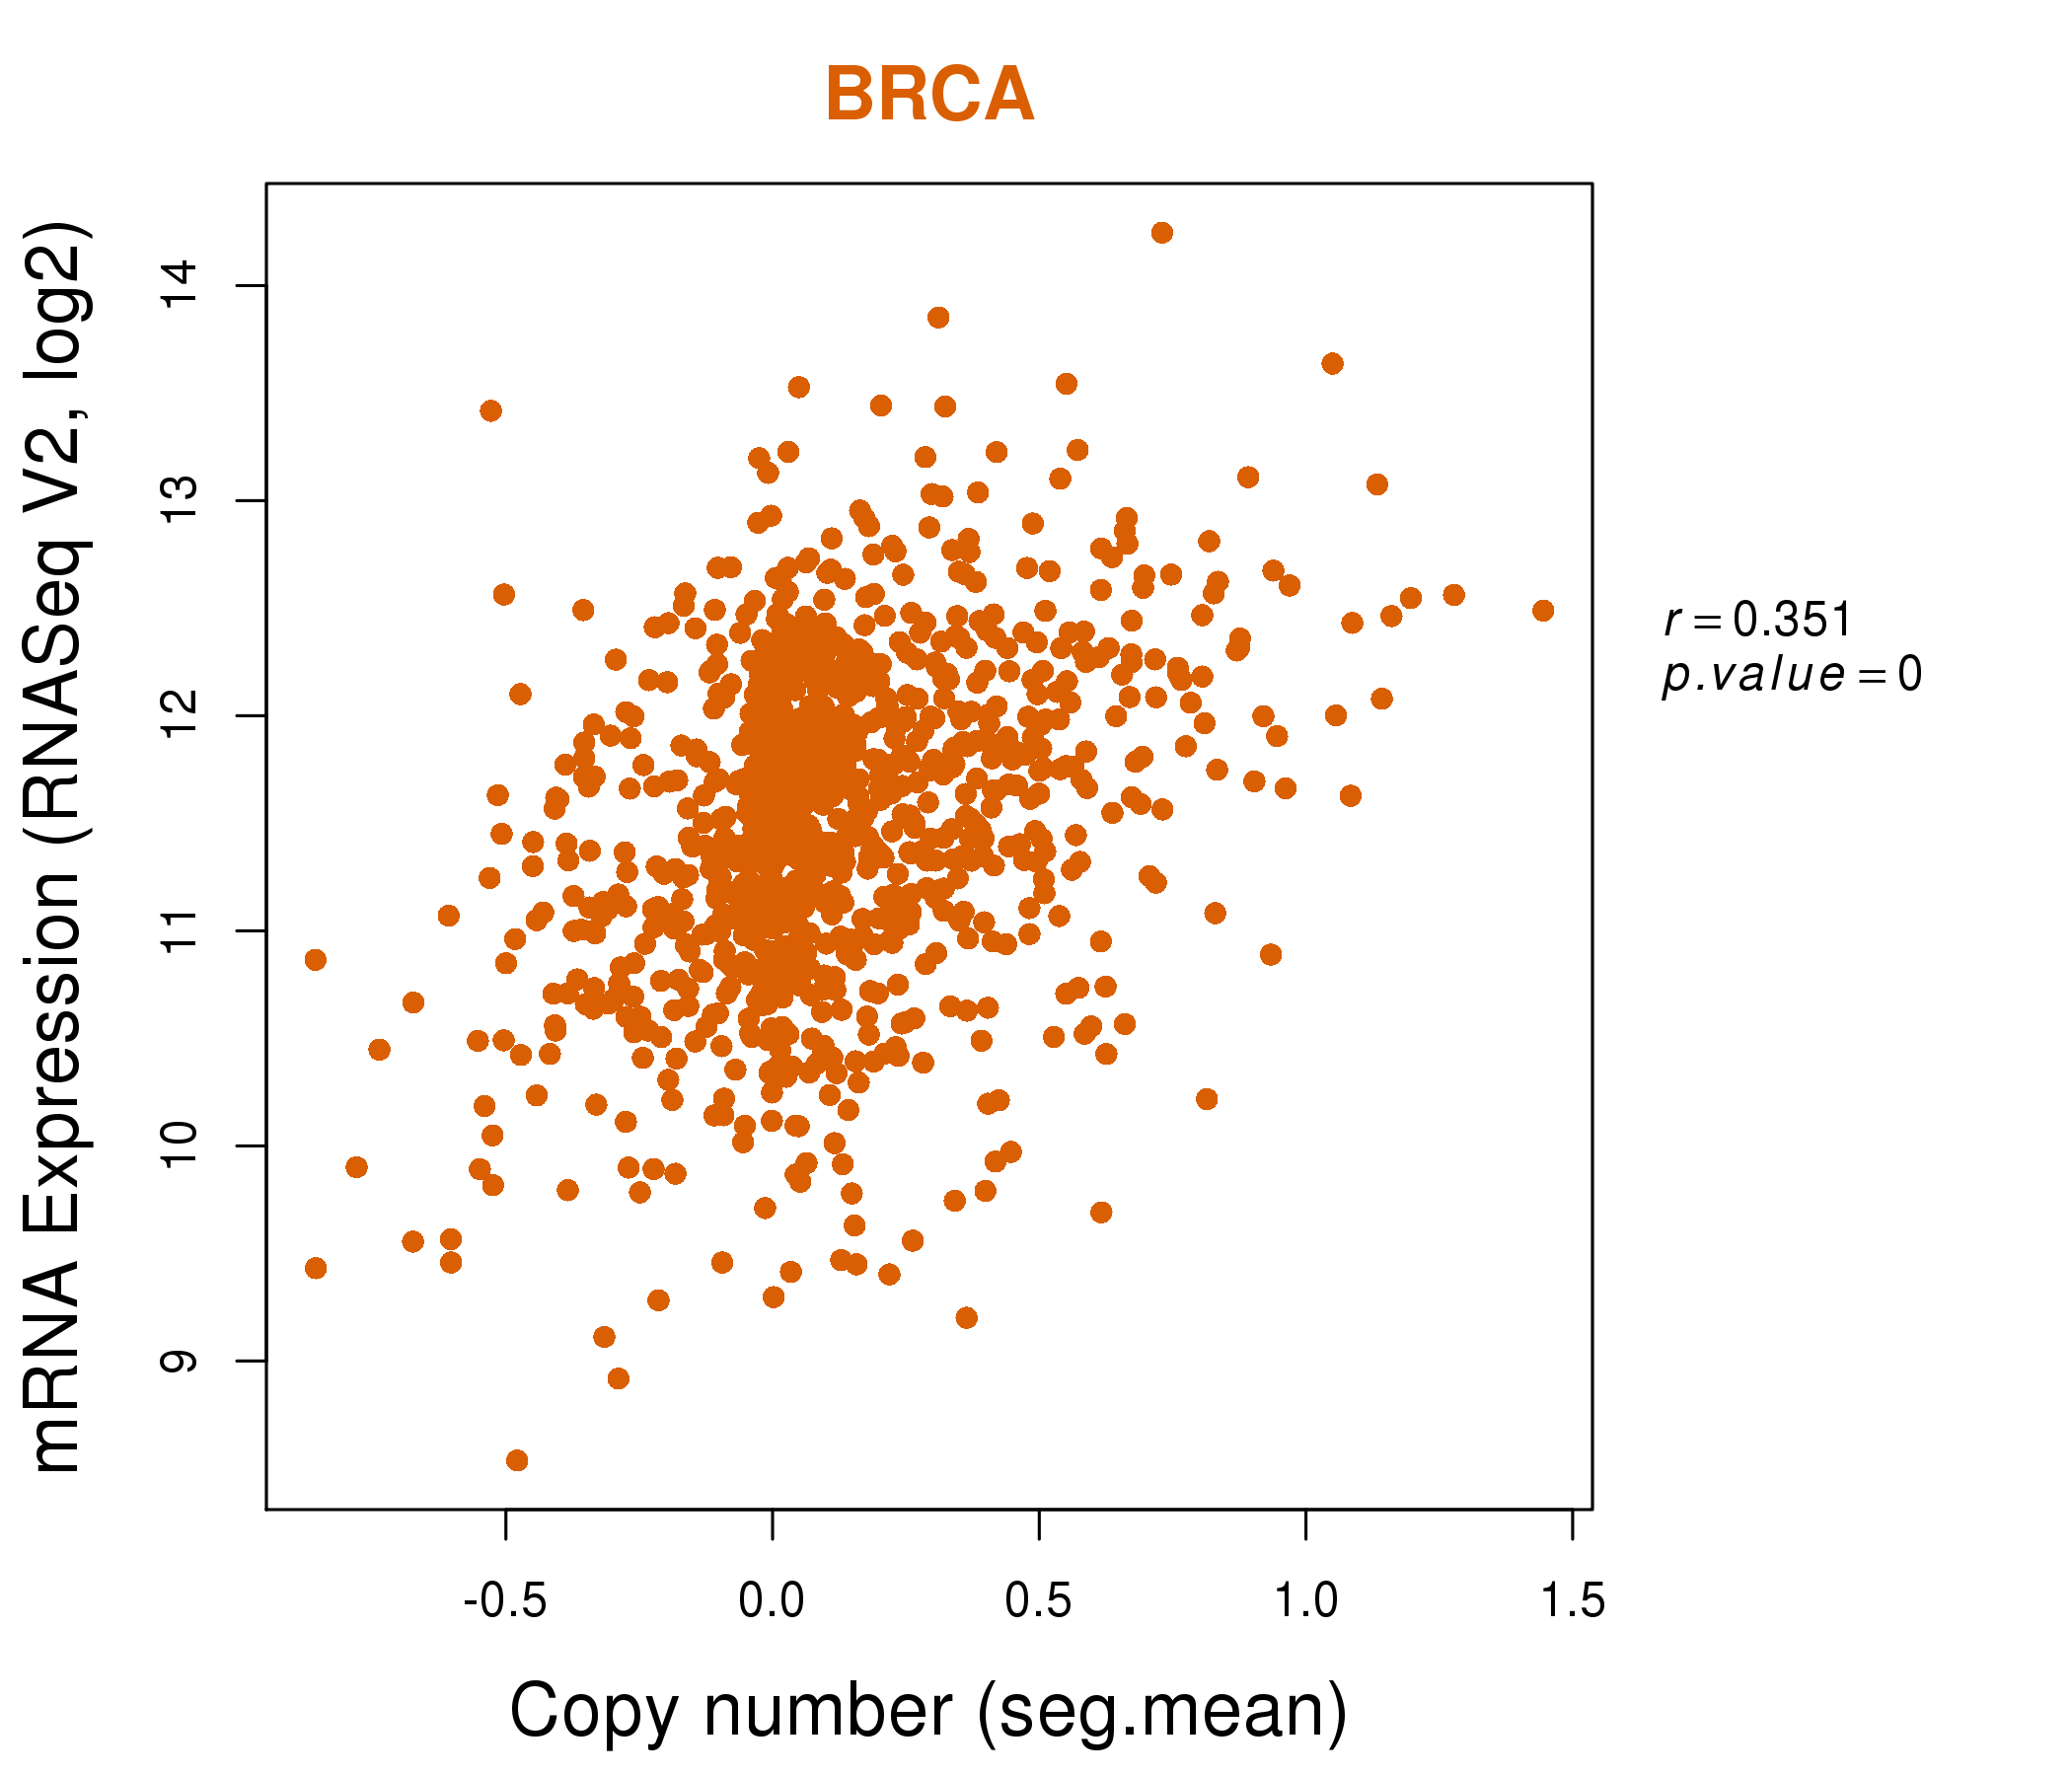
| * Copy number data were extracted from TCGA using R package TCGA-Assembler. The URLs of all public data files on TCGA DCC data server were gathered on Jan-05-2015. Function ProcessCNAData in TCGA-Assembler package was used to obtain gene-level copy number value which is calculated as the average copy number of the genomic region of a gene. |
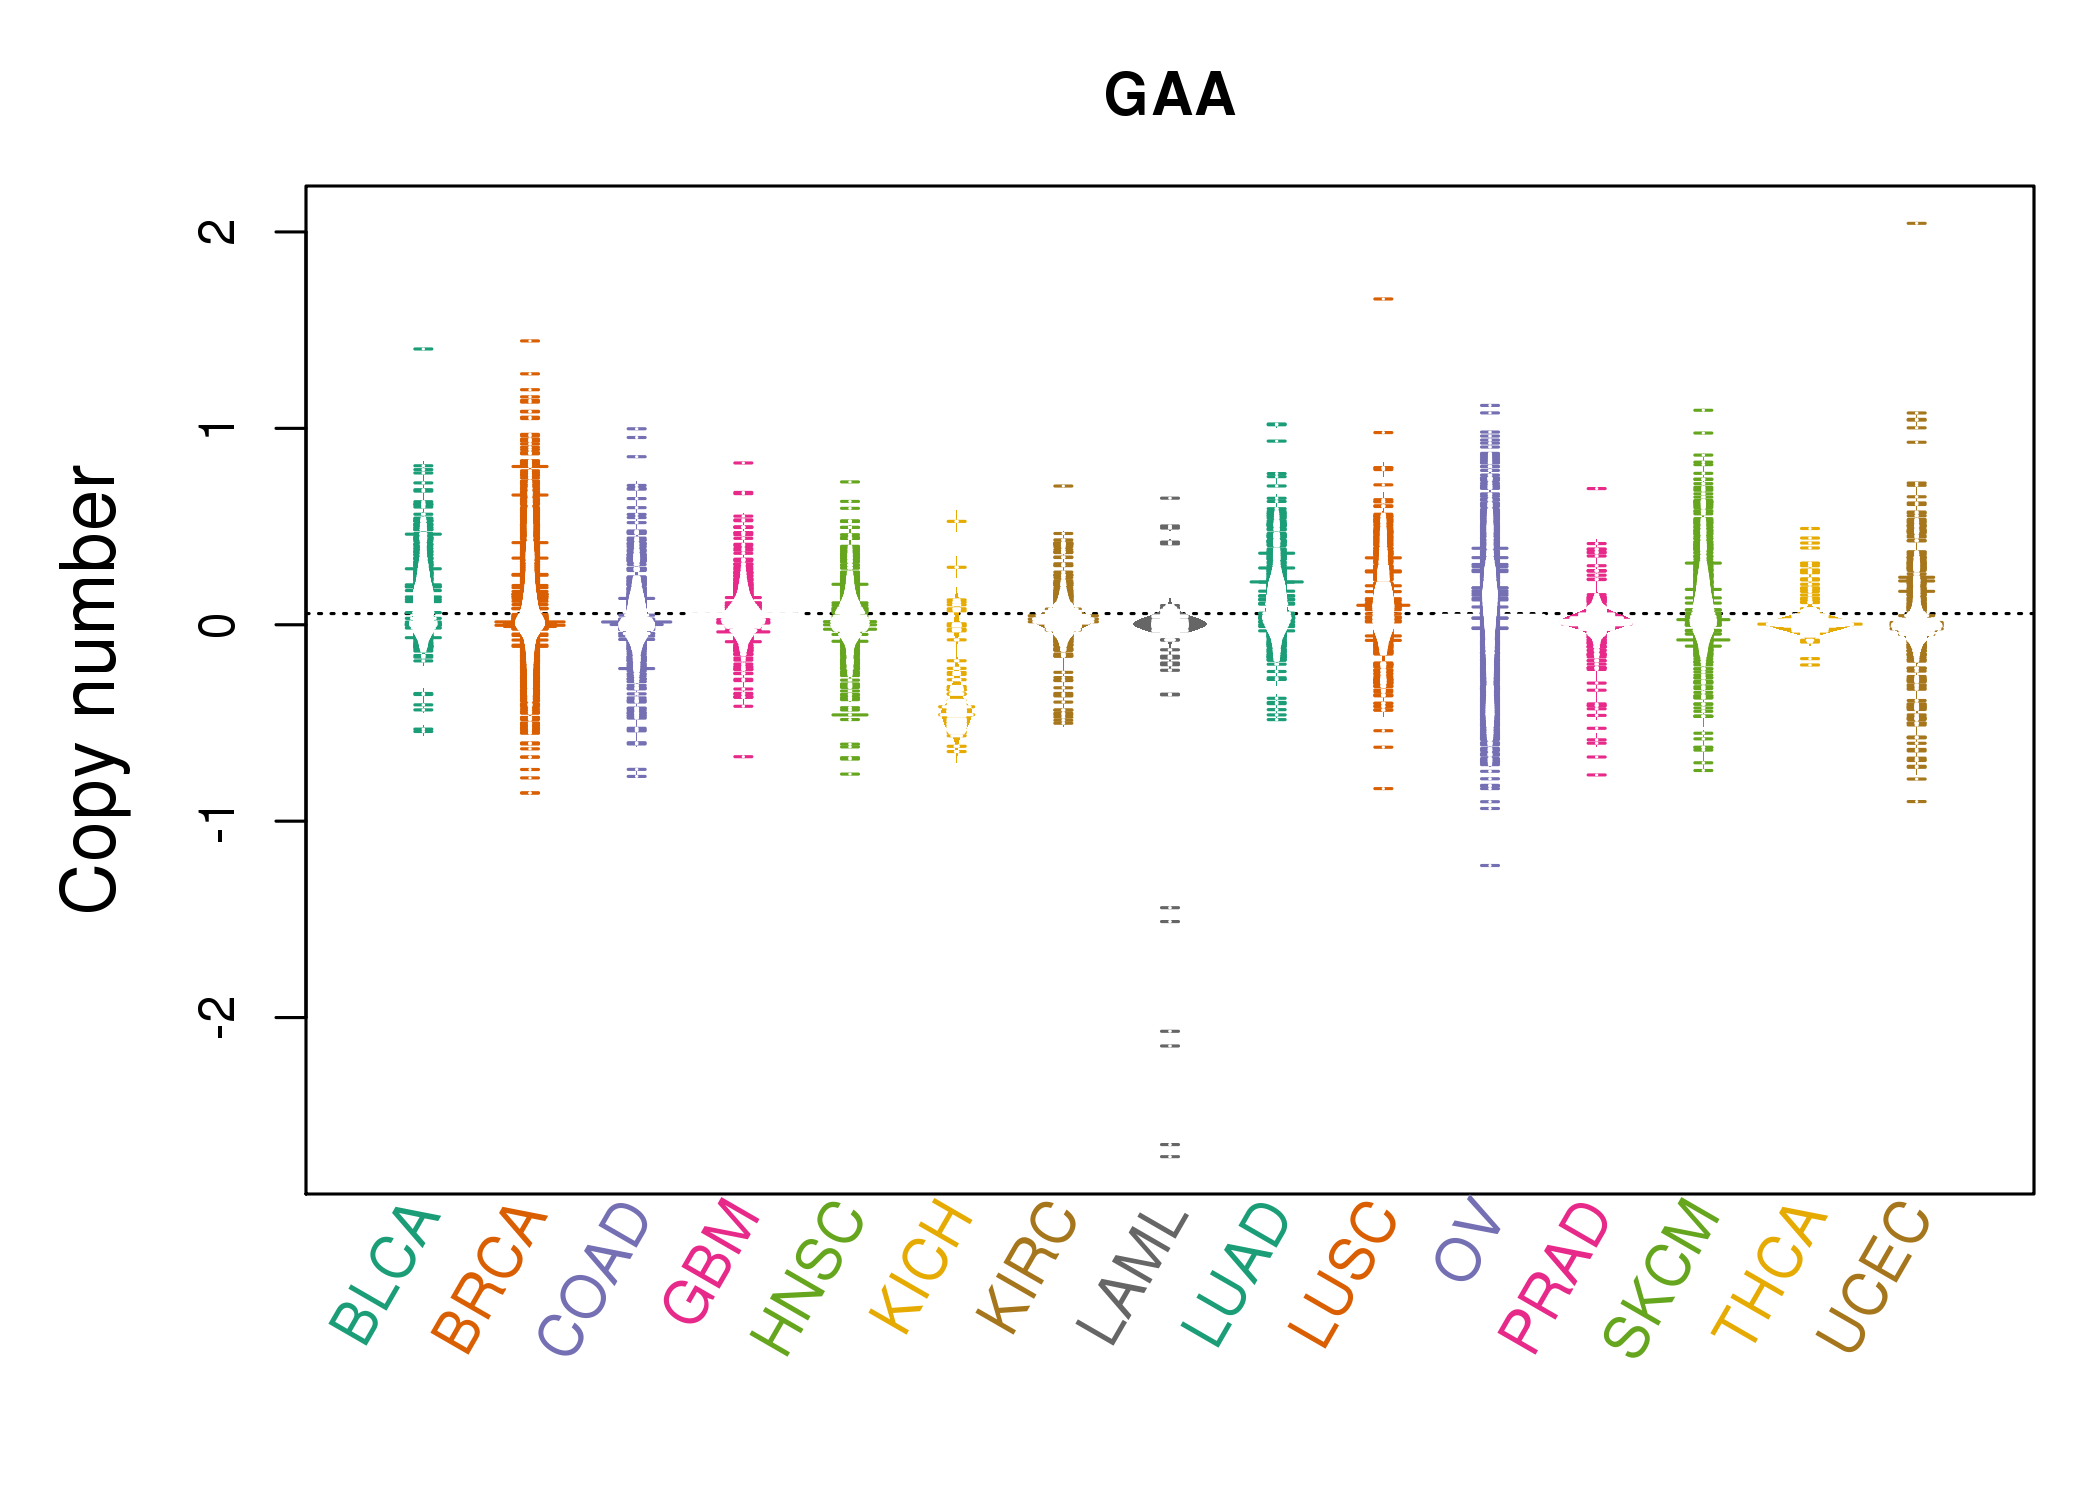 |
| cf) Tissue ID[Tissue type]: BLCA[Bladder Urothelial Carcinoma], BRCA[Breast invasive carcinoma], CESC[Cervical squamous cell carcinoma and endocervical adenocarcinoma], COAD[Colon adenocarcinoma], GBM[Glioblastoma multiforme], Glioma Low Grade, HNSC[Head and Neck squamous cell carcinoma], KICH[Kidney Chromophobe], KIRC[Kidney renal clear cell carcinoma], KIRP[Kidney renal papillary cell carcinoma], LAML[Acute Myeloid Leukemia], LUAD[Lung adenocarcinoma], LUSC[Lung squamous cell carcinoma], OV[Ovarian serous cystadenocarcinoma ], PAAD[Pancreatic adenocarcinoma], PRAD[Prostate adenocarcinoma], SKCM[Skin Cutaneous Melanoma], STAD[Stomach adenocarcinoma], THCA[Thyroid carcinoma], UCEC[Uterine Corpus Endometrial Carcinoma] |
| Top |
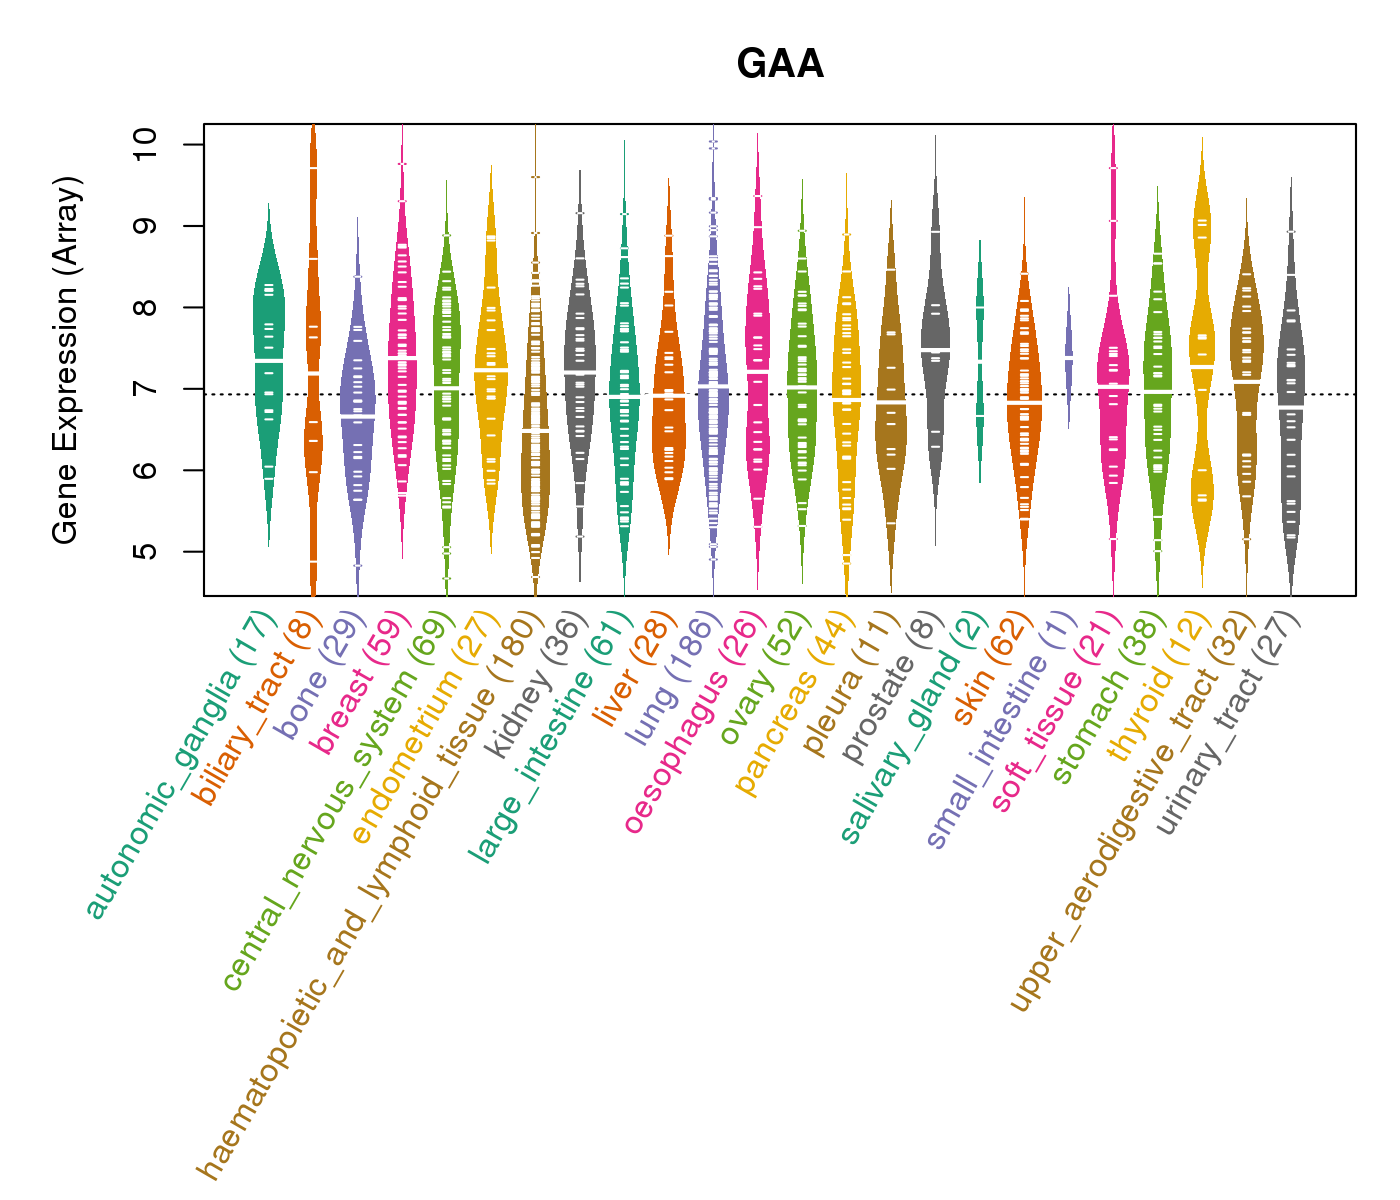
| Gene Expression for GAA |
| * CCLE gene expression data were extracted from CCLE_Expression_Entrez_2012-10-18.res: Gene-centric RMA-normalized mRNA expression data. |
 |
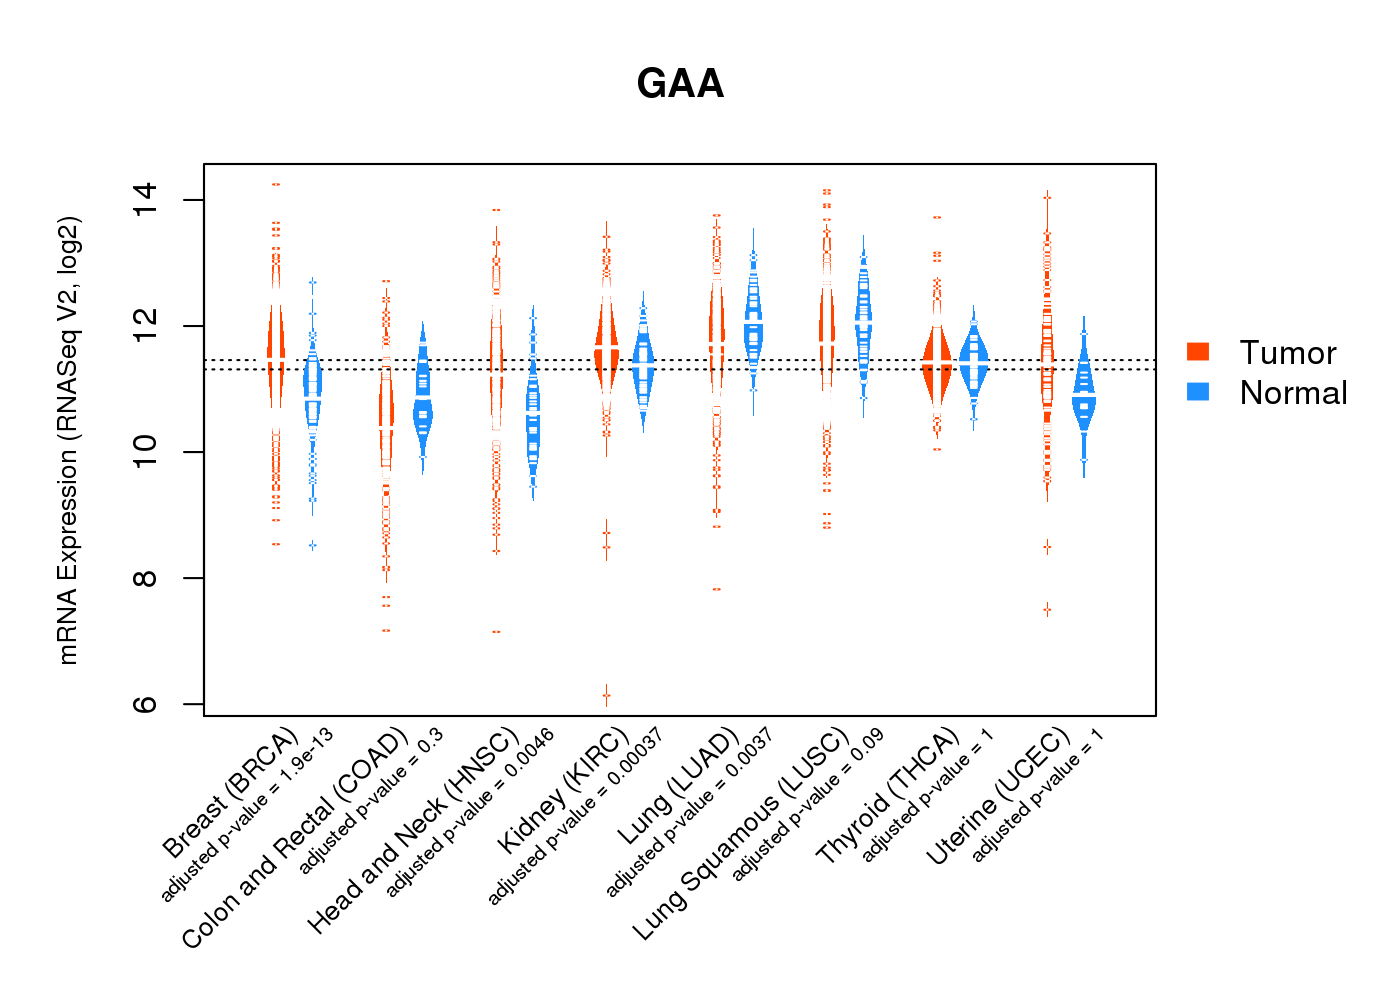
| * Normalized gene expression data of RNASeqV2 was extracted from TCGA using R package TCGA-Assembler. The URLs of all public data files on TCGA DCC data server were gathered at Jan-05-2015. Only eight cancer types have enough normal control samples for differential expression analysis. (t test, adjusted p<0.05 (using Benjamini-Hochberg FDR)) |
 |
| Top |
| * This plots show the correlation between CNV and gene expression. |
: Open all plots for all cancer types
 |
|
 |
|

| Top |
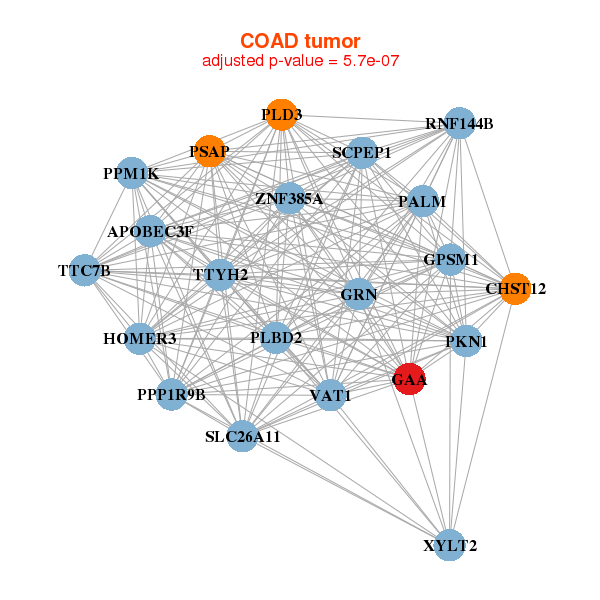
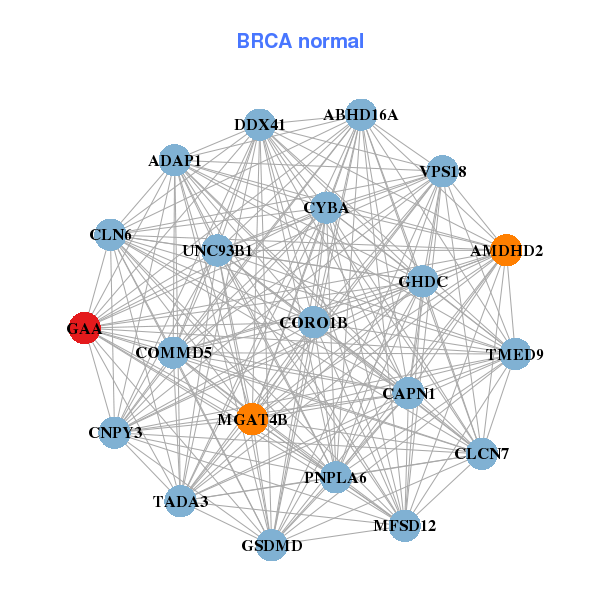
| Gene-Gene Network Information |
| * Co-Expression network figures were drawn using R package igraph. Only the top 20 genes with the highest correlations were shown. Red circle: input gene, orange circle: cell metabolism gene, sky circle: other gene |
: Open all plots for all cancer types
 |
| ||||
| ANAPC11,ARHGDIA,ASPSCR1,OGFOD3,C17orf62,C17orf70,OXLD1, CHMP6,GAA,GPS1,GRN,HGS,LRPAP1,MAN1B1, MRPL12,NAGLU,P4HB,RFNG,SDF4,SGSH,SLC38A10 | ADAP1,AMDHD2,ABHD16A,MFSD12,CAPN1,CLCN7,CLN6, CNPY3,COMMD5,CORO1B,CYBA,DDX41,GAA,GHDC, GSDMD,MGAT4B,PNPLA6,TADA3,TMED9,UNC93B1,VPS18 | ||||
 |
| ||||
| APOBEC3F,CHST12,GAA,GPSM1,GRN,HOMER3,PALM, PKN1,PLBD2,PLD3,PPM1K,PPP1R9B,PSAP,RNF144B, SCPEP1,SLC26A11,TTC7B,TTYH2,VAT1,XYLT2,ZNF385A | AKAP8L,ATP2C2,COX19,DPH1,EML3,FGFRL1,GAA, GAS6,HPS4,IFT122,IFT140,ING5,CCDC183,LINC00174, RIN1,SNAPC4,TOP1MT,TSC2,NELFA,ZNF446,ZNF497 |

| * Co-Expression network figures were drawn using R package igraph. Only the top 20 genes with the highest correlations were shown. Red circle: input gene, orange circle: cell metabolism gene, sky circle: other gene |
: Open all plots for all cancer types
| Top |
: Open all interacting genes' information including KEGG pathway for all interacting genes from DAVID
| Top |
| Pharmacological Information for GAA |
| DB Category | DB Name | DB's ID and Url link |
| * Gene Centered Interaction Network. |
 |
| * Drug Centered Interaction Network. |
| DrugBank ID | Target Name | Drug Groups | Generic Name | Drug Centered Network | Drug Structure |
| DB00284 | glucosidase, alpha; acid | approved; investigational | Acarbose |  |  |
| DB00491 | glucosidase, alpha; acid | approved | Miglitol | 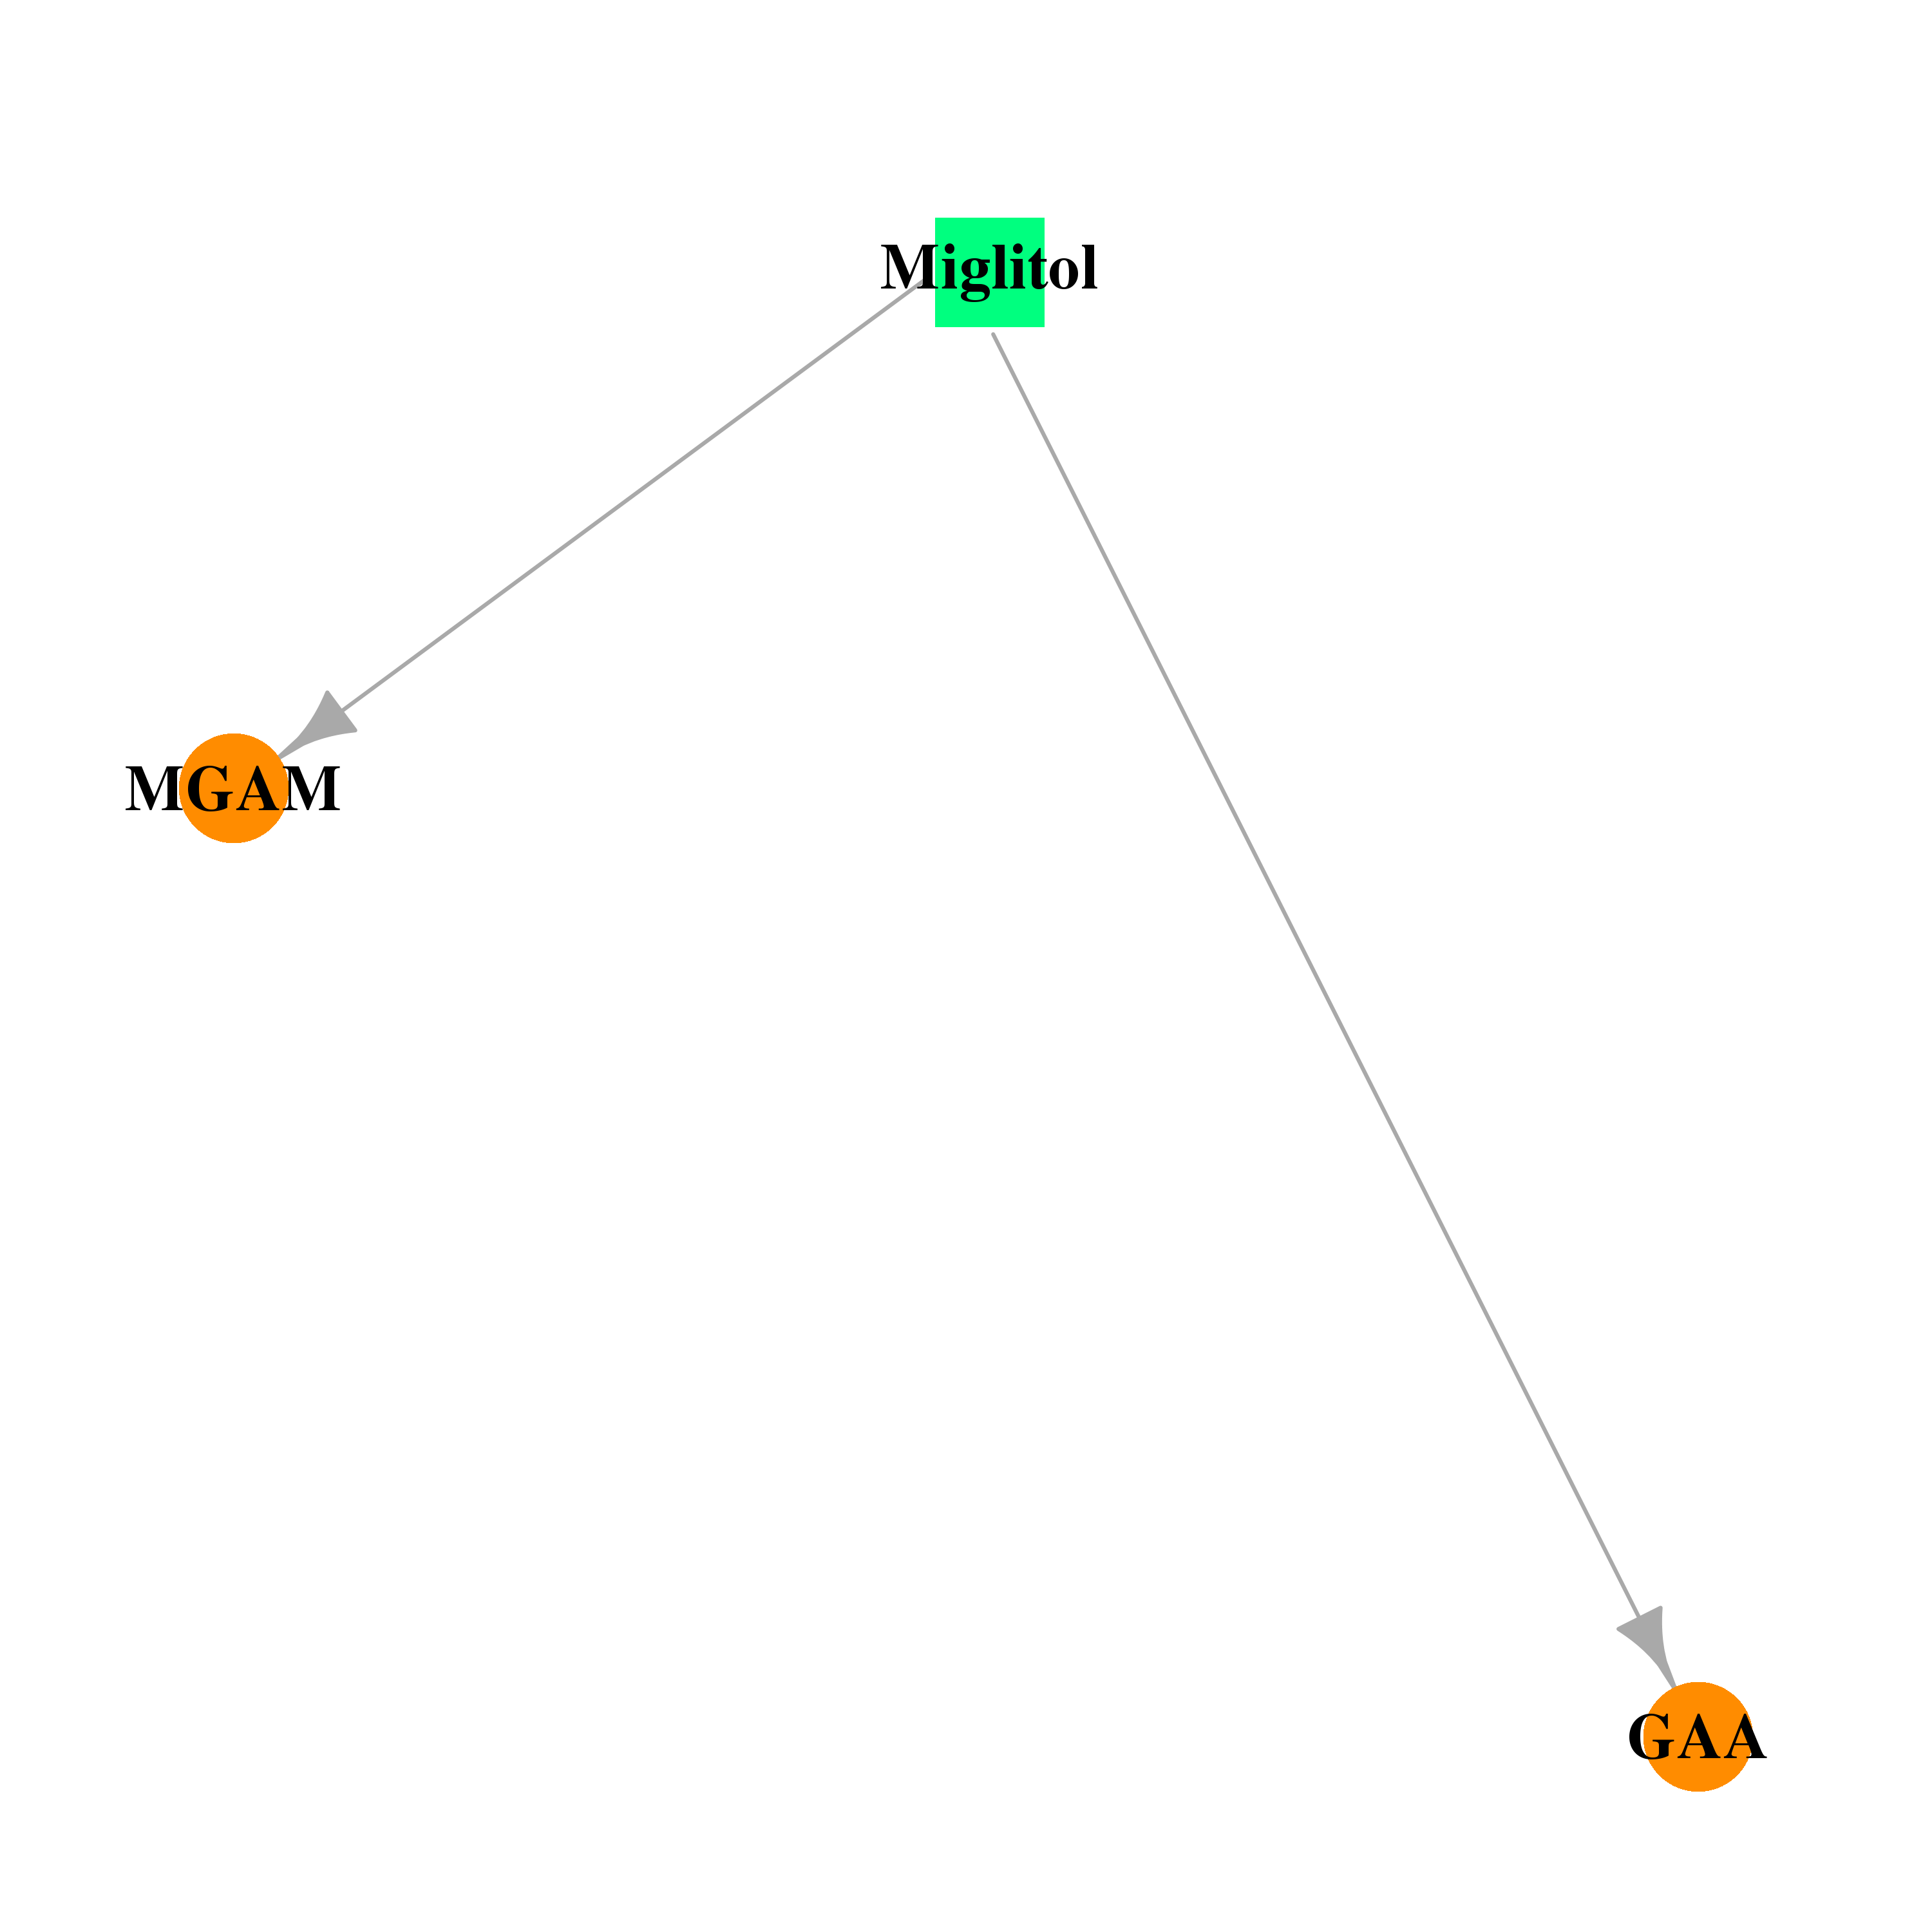 | 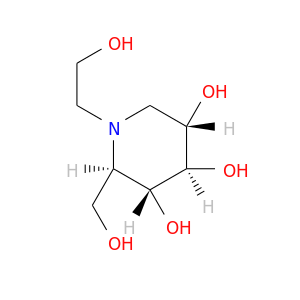 |
| Top |
| Cross referenced IDs for GAA |
| * We obtained these cross-references from Uniprot database. It covers 150 different DBs, 18 categories. http://www.uniprot.org/help/cross_references_section |
: Open all cross reference information
|
Copyright © 2016-Present - The Univsersity of Texas Health Science Center at Houston @ |