|
||||||||||||||||||||
| |
| Phenotypic Information (metabolism pathway, cancer, disease, phenome) |
| |
| |
| Gene-Gene Network Information: Co-Expression Network, Interacting Genes & KEGG |
| |
|


| Gene Summary for GAD1 |
| Top |
| Phenotypic Information for GAD1(metabolism pathway, cancer, disease, phenome) |
| Cancer | CGAP: GAD1 |
| Familial Cancer Database: GAD1 | |
| * This gene is included in those cancer gene databases. |
|
|
|
|
|
|
| ||||||||||||||
Oncogene 1 | Significant driver gene in | |||||||||||||||||||
| cf) number; DB name 1 Oncogene; http://nar.oxfordjournals.org/content/35/suppl_1/D721.long, 2 Tumor Suppressor gene; https://bioinfo.uth.edu/TSGene/, 3 Cancer Gene Census; http://www.nature.com/nrc/journal/v4/n3/abs/nrc1299.html, 4 CancerGenes; http://nar.oxfordjournals.org/content/35/suppl_1/D721.long, 5 Network of Cancer Gene; http://ncg.kcl.ac.uk/index.php, 1Therapeutic Vulnerabilities in Cancer; http://cbio.mskcc.org/cancergenomics/statius/ |
| KEGG_ALANINE_ASPARTATE_AND_GLUTAMATE_METABOLISM KEGG_BETA_ALANINE_METABOLISM KEGG_TAURINE_AND_HYPOTAURINE_METABOLISM KEGG_BUTANOATE_METABOLISM | |
| OMIM | |
| Orphanet | |
| Disease | KEGG Disease: GAD1 |
| MedGen: GAD1 (Human Medical Genetics with Condition) | |
| ClinVar: GAD1 | |
| Phenotype | MGI: GAD1 (International Mouse Phenotyping Consortium) |
| PhenomicDB: GAD1 | |
| Mutations for GAD1 |
| * Under tables are showing count per each tissue to give us broad intuition about tissue specific mutation patterns.You can go to the detailed page for each mutation database's web site. |
| There's no structural variation information in COSMIC data for this gene. |
| * From mRNA Sanger sequences, Chitars2.0 arranged chimeric transcripts. This table shows GAD1 related fusion information. |
| ID | Head Gene | Tail Gene | Accession | Gene_a | qStart_a | qEnd_a | Chromosome_a | tStart_a | tEnd_a | Gene_a | qStart_a | qEnd_a | Chromosome_a | tStart_a | tEnd_a |
| AW162120 | SGSM2 | 8 | 148 | 17 | 2284208 | 2284348 | GAD1 | 144 | 670 | 2 | 171705814 | 171716272 | |
| DA078791 | GAD1 | 1 | 274 | 2 | 171673400 | 171675153 | ALDOC | 274 | 581 | 17 | 26901972 | 26902481 | |
| AW609892 | GAD1 | 4 | 24 | 2 | 171690266 | 171690286 | PARD3 | 22 | 470 | 10 | 34606035 | 34620262 | |
| M85674 | GAD1 | 1 | 268 | 2 | 171715328 | 171716410 | RUNX1T1 | 268 | 382 | 8 | 93030731 | 93030844 | |
| Top |
| There's no copy number variation information in COSMIC data for this gene. |
| Top |
|
 |
| Top |
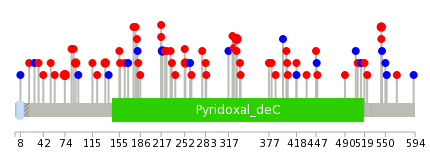
| Stat. for Non-Synonymous SNVs (# total SNVs=59) | (# total SNVs=13) |
 |  |
(# total SNVs=1) | (# total SNVs=0) |
 |
| Top |
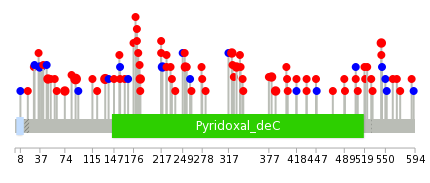
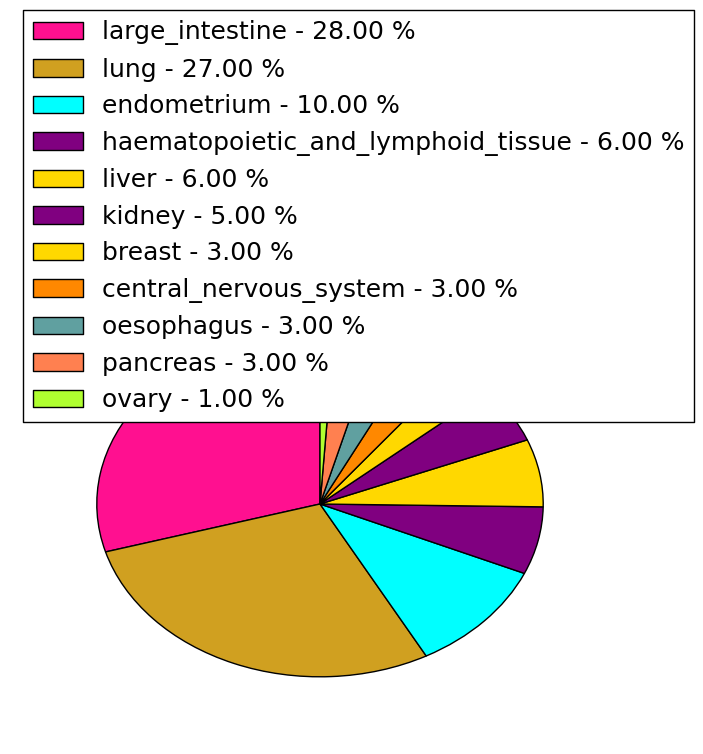
| * When you move the cursor on each content, you can see more deailed mutation information on the Tooltip. Those are primary_site,primary_histology,mutation(aa),pubmedID. |
| GRCh37 position | Mutation(aa) | Unique sampleID count |
| chr2:171686107-171686107 | p.R90C | 4 |
| chr2:171687555-171687555 | p.R134C | 3 |
| chr2:171693312-171693312 | p.R186L | 3 |
| chr2:171702536-171702536 | p.A322D | 2 |
| chr2:171705836-171705836 | p.R387H | 2 |
| chr2:171678625-171678625 | p.H37H | 2 |
| chr2:171700573-171700573 | p.A219A | 2 |
| chr2:171702021-171702021 | p.A253T | 2 |
| chr2:171716238-171716238 | p.A544G | 2 |
| chr2:171702556-171702556 | p.L329I | 2 |
| Top |
|
 |
| Point Mutation/ Tissue ID | 1 | 2 | 3 | 4 | 5 | 6 | 7 | 8 | 9 | 10 | 11 | 12 | 13 | 14 | 15 | 16 | 17 | 18 | 19 | 20 |
| # sample | 4 | 2 | 14 | 1 | 1 | 1 | 1 | 1 | 8 | 5 | 1 | 14 | 10 | 8 | ||||||
| # mutation | 4 | 2 | 15 | 1 | 1 | 1 | 1 | 1 | 9 | 6 | 1 | 16 | 10 | 9 | ||||||
| nonsynonymous SNV | 4 | 2 | 13 | 1 | 1 | 1 | 7 | 5 | 1 | 12 | 6 | 6 | ||||||||
| synonymous SNV | 2 | 1 | 1 | 2 | 1 | 4 | 4 | 3 |
| cf) Tissue ID; Tissue type (1; BLCA[Bladder Urothelial Carcinoma], 2; BRCA[Breast invasive carcinoma], 3; CESC[Cervical squamous cell carcinoma and endocervical adenocarcinoma], 4; COAD[Colon adenocarcinoma], 5; GBM[Glioblastoma multiforme], 6; Glioma Low Grade, 7; HNSC[Head and Neck squamous cell carcinoma], 8; KICH[Kidney Chromophobe], 9; KIRC[Kidney renal clear cell carcinoma], 10; KIRP[Kidney renal papillary cell carcinoma], 11; LAML[Acute Myeloid Leukemia], 12; LUAD[Lung adenocarcinoma], 13; LUSC[Lung squamous cell carcinoma], 14; OV[Ovarian serous cystadenocarcinoma ], 15; PAAD[Pancreatic adenocarcinoma], 16; PRAD[Prostate adenocarcinoma], 17; SKCM[Skin Cutaneous Melanoma], 18:STAD[Stomach adenocarcinoma], 19:THCA[Thyroid carcinoma], 20:UCEC[Uterine Corpus Endometrial Carcinoma]) |
| Top |
| * We represented just top 10 SNVs. When you move the cursor on each content, you can see more deailed mutation information on the Tooltip. Those are primary_site, primary_histology, mutation(aa), pubmedID. |
| Genomic Position | Mutation(aa) | Unique sampleID count |
| chr2:171686061 | p.K74N,GAD1 | 3 |
| chr2:171702556 | p.L329I | 3 |
| chr2:171700573 | p.A544G | 2 |
| chr2:171686107 | p.A253T | 2 |
| chr2:171716238 | p.R90C,GAD1 | 2 |
| chr2:171702021 | p.A219A | 2 |
| chr2:171687555 | p.R134C,GAD1 | 2 |
| chr2:171699107 | p.R387H | 1 |
| chr2:171710463 | p.R523W | 1 |
| chr2:171716257 | p.T21I,GAD1 | 1 |
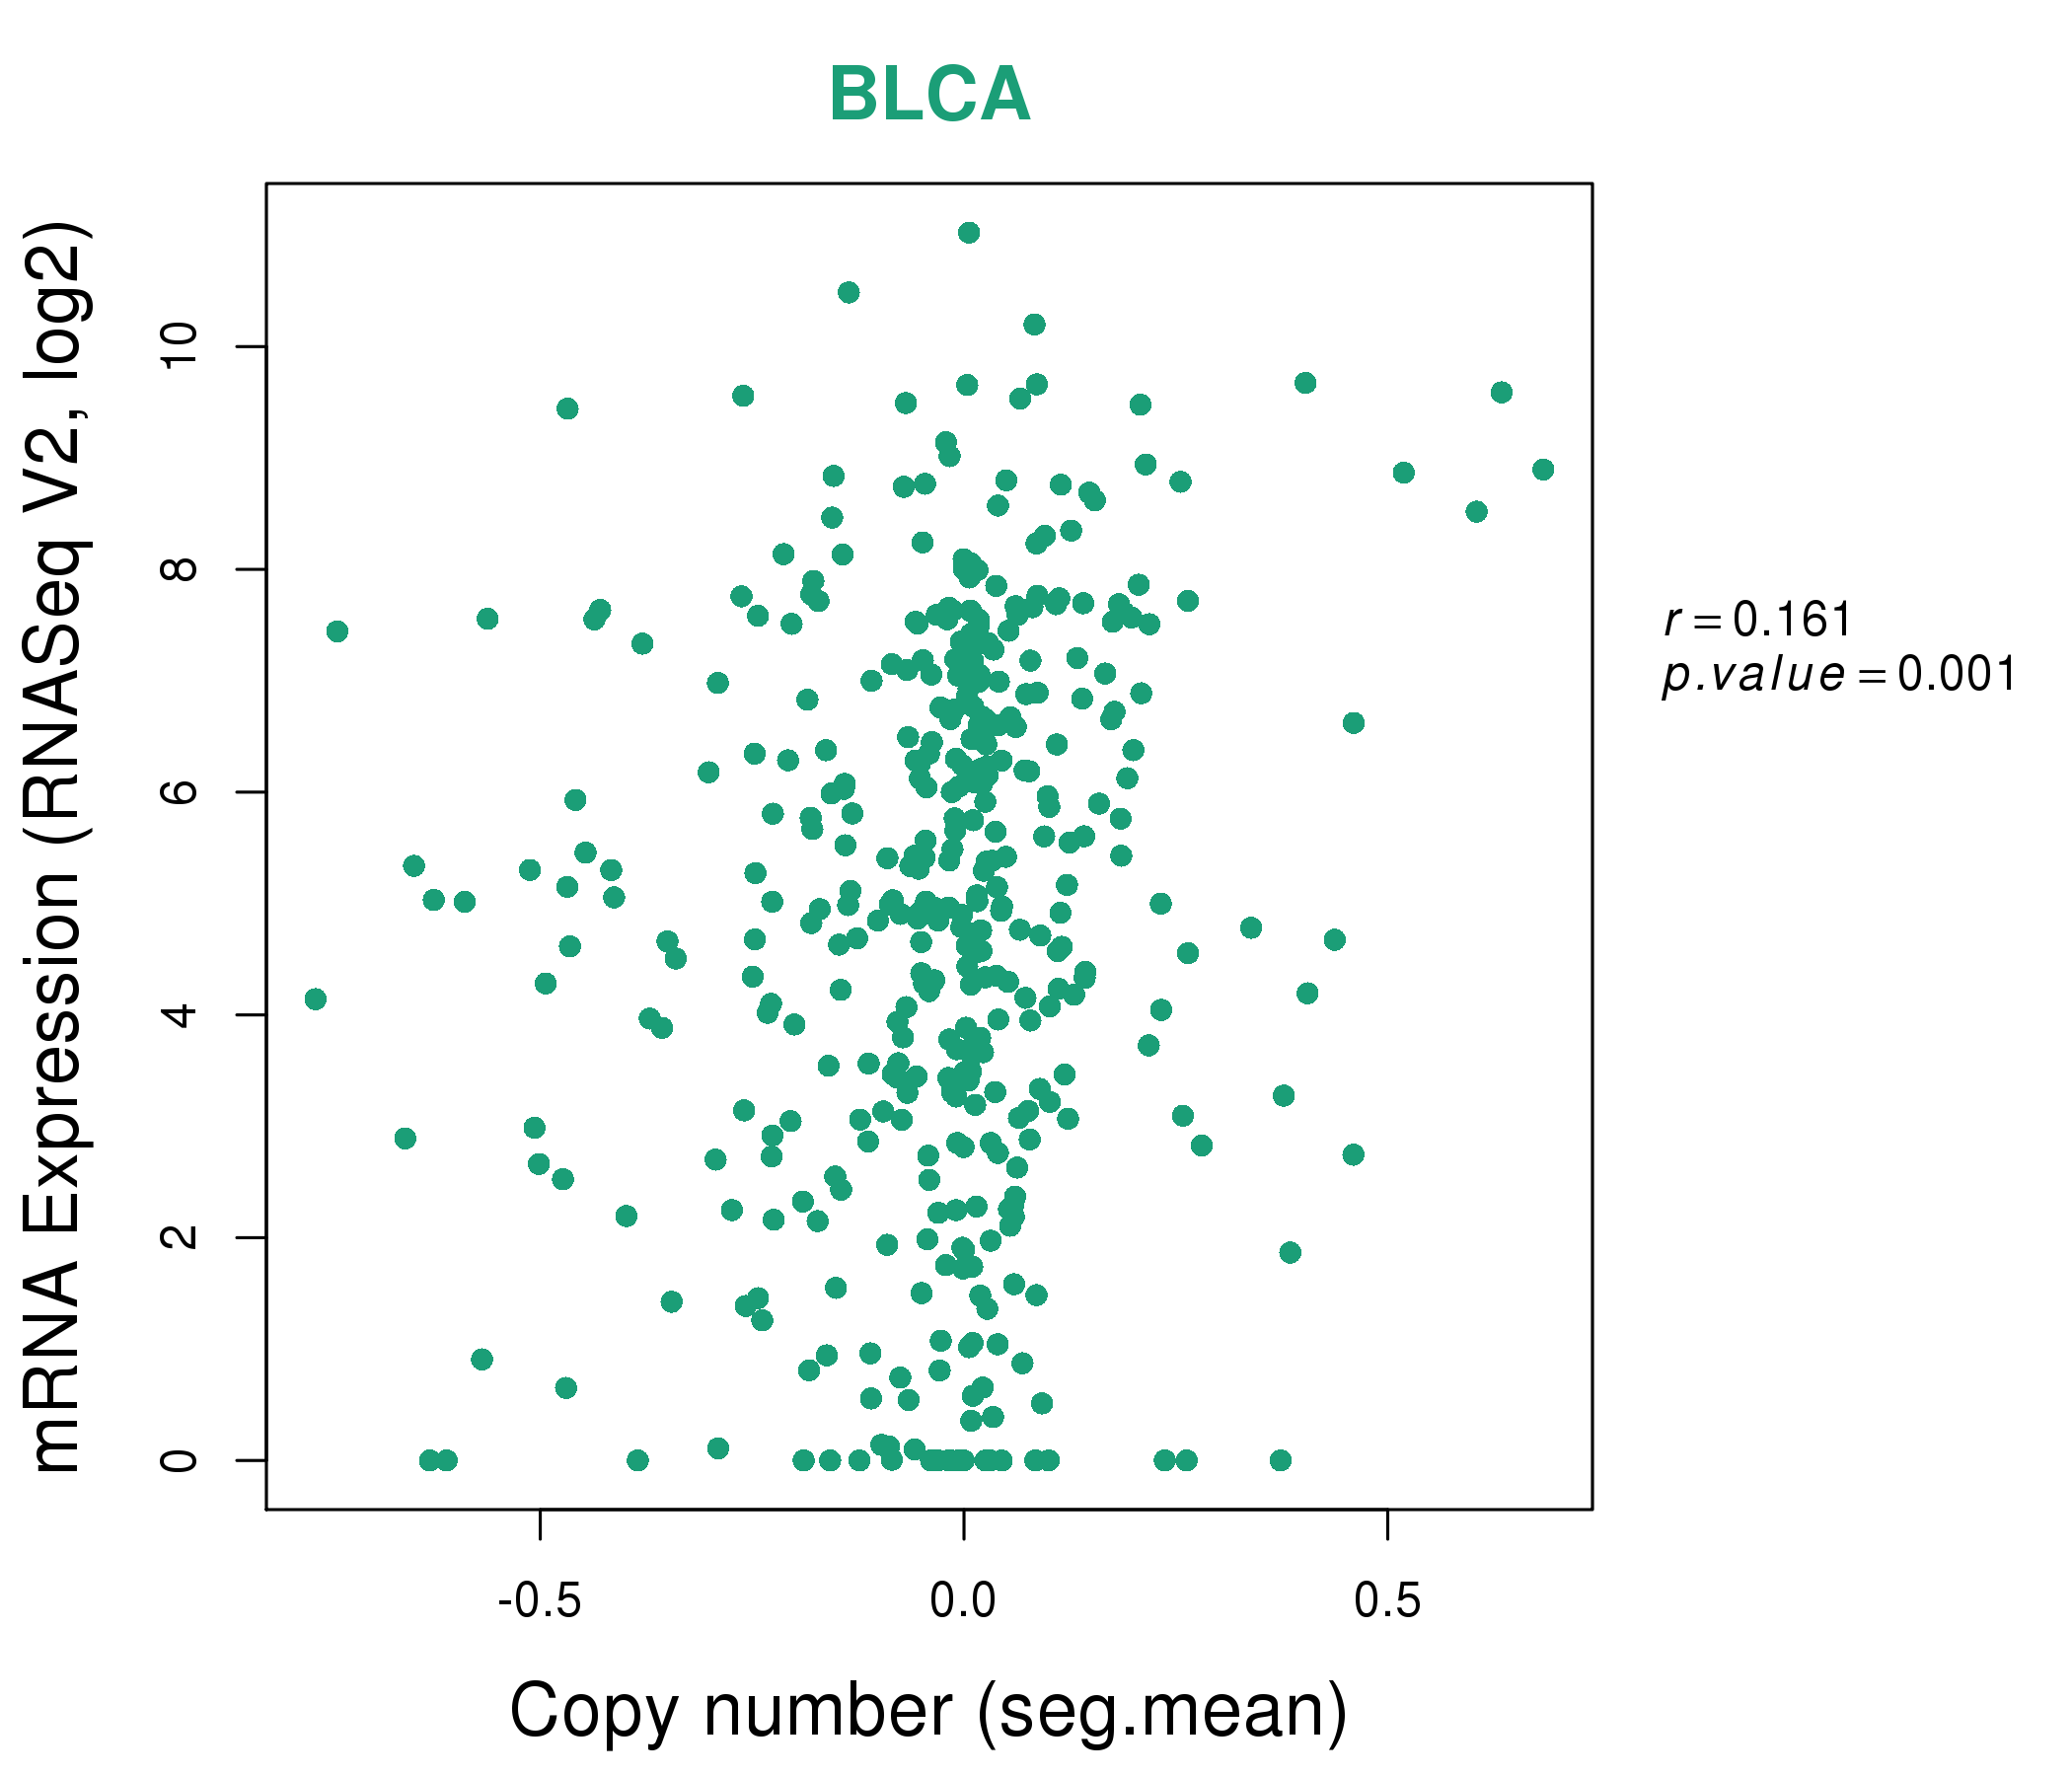
| * Copy number data were extracted from TCGA using R package TCGA-Assembler. The URLs of all public data files on TCGA DCC data server were gathered on Jan-05-2015. Function ProcessCNAData in TCGA-Assembler package was used to obtain gene-level copy number value which is calculated as the average copy number of the genomic region of a gene. |
 |
| cf) Tissue ID[Tissue type]: BLCA[Bladder Urothelial Carcinoma], BRCA[Breast invasive carcinoma], CESC[Cervical squamous cell carcinoma and endocervical adenocarcinoma], COAD[Colon adenocarcinoma], GBM[Glioblastoma multiforme], Glioma Low Grade, HNSC[Head and Neck squamous cell carcinoma], KICH[Kidney Chromophobe], KIRC[Kidney renal clear cell carcinoma], KIRP[Kidney renal papillary cell carcinoma], LAML[Acute Myeloid Leukemia], LUAD[Lung adenocarcinoma], LUSC[Lung squamous cell carcinoma], OV[Ovarian serous cystadenocarcinoma ], PAAD[Pancreatic adenocarcinoma], PRAD[Prostate adenocarcinoma], SKCM[Skin Cutaneous Melanoma], STAD[Stomach adenocarcinoma], THCA[Thyroid carcinoma], UCEC[Uterine Corpus Endometrial Carcinoma] |
| Top |
| Gene Expression for GAD1 |
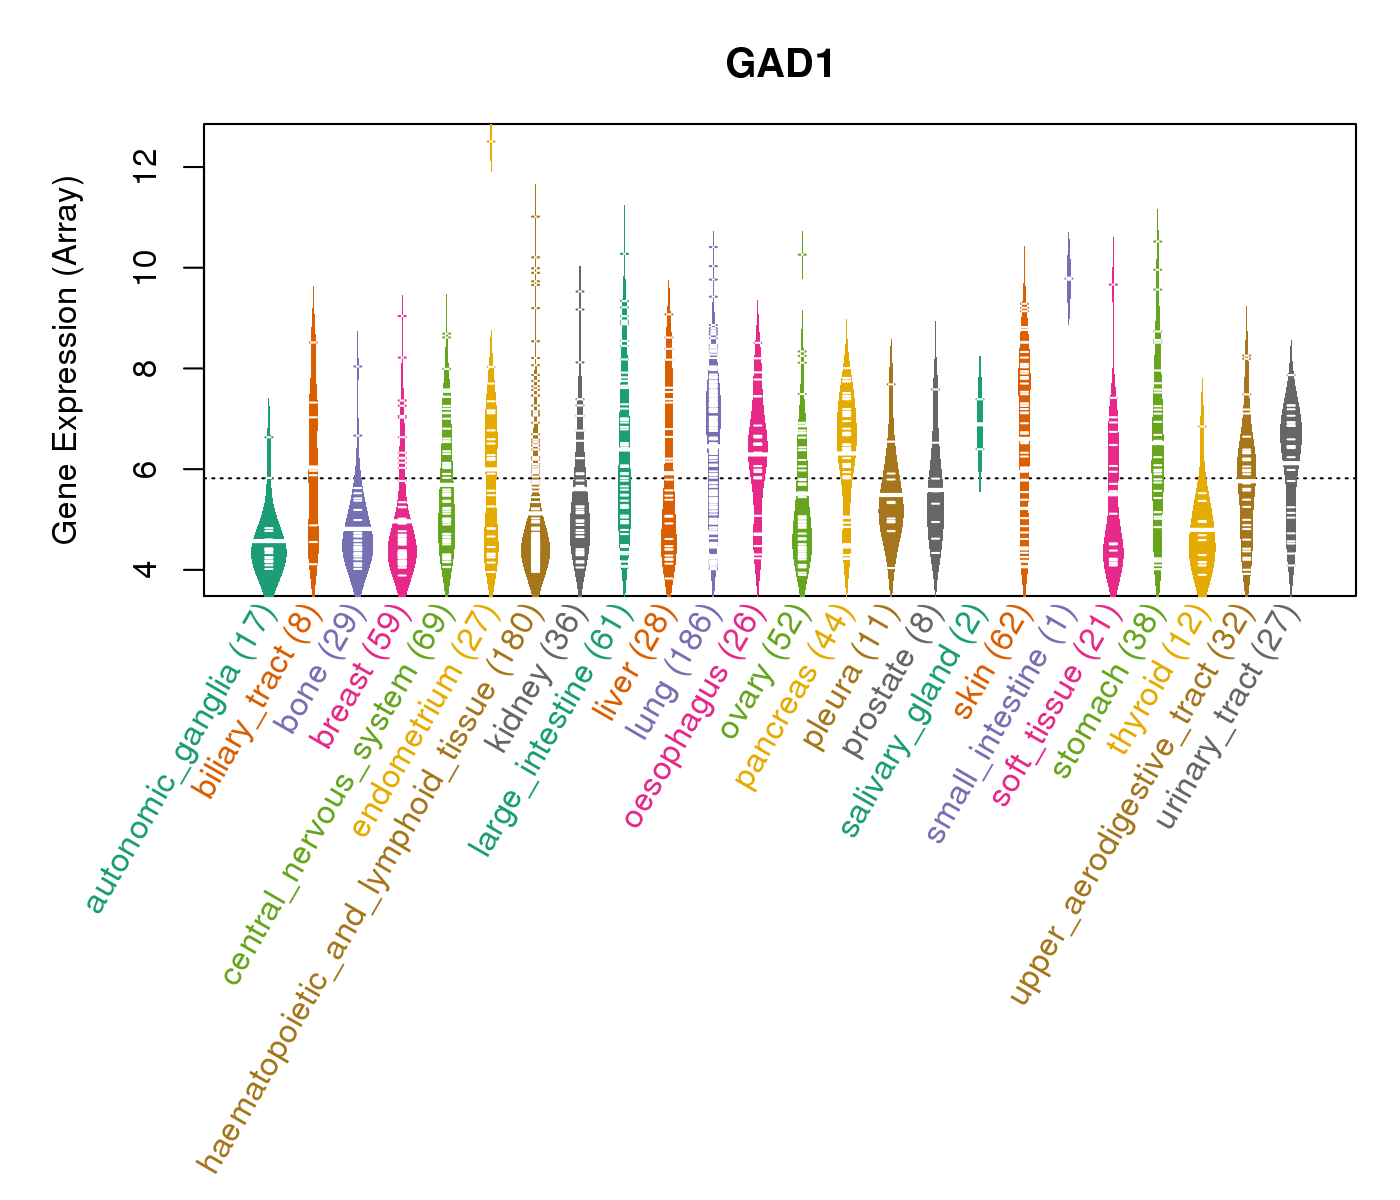
| * CCLE gene expression data were extracted from CCLE_Expression_Entrez_2012-10-18.res: Gene-centric RMA-normalized mRNA expression data. |
 |
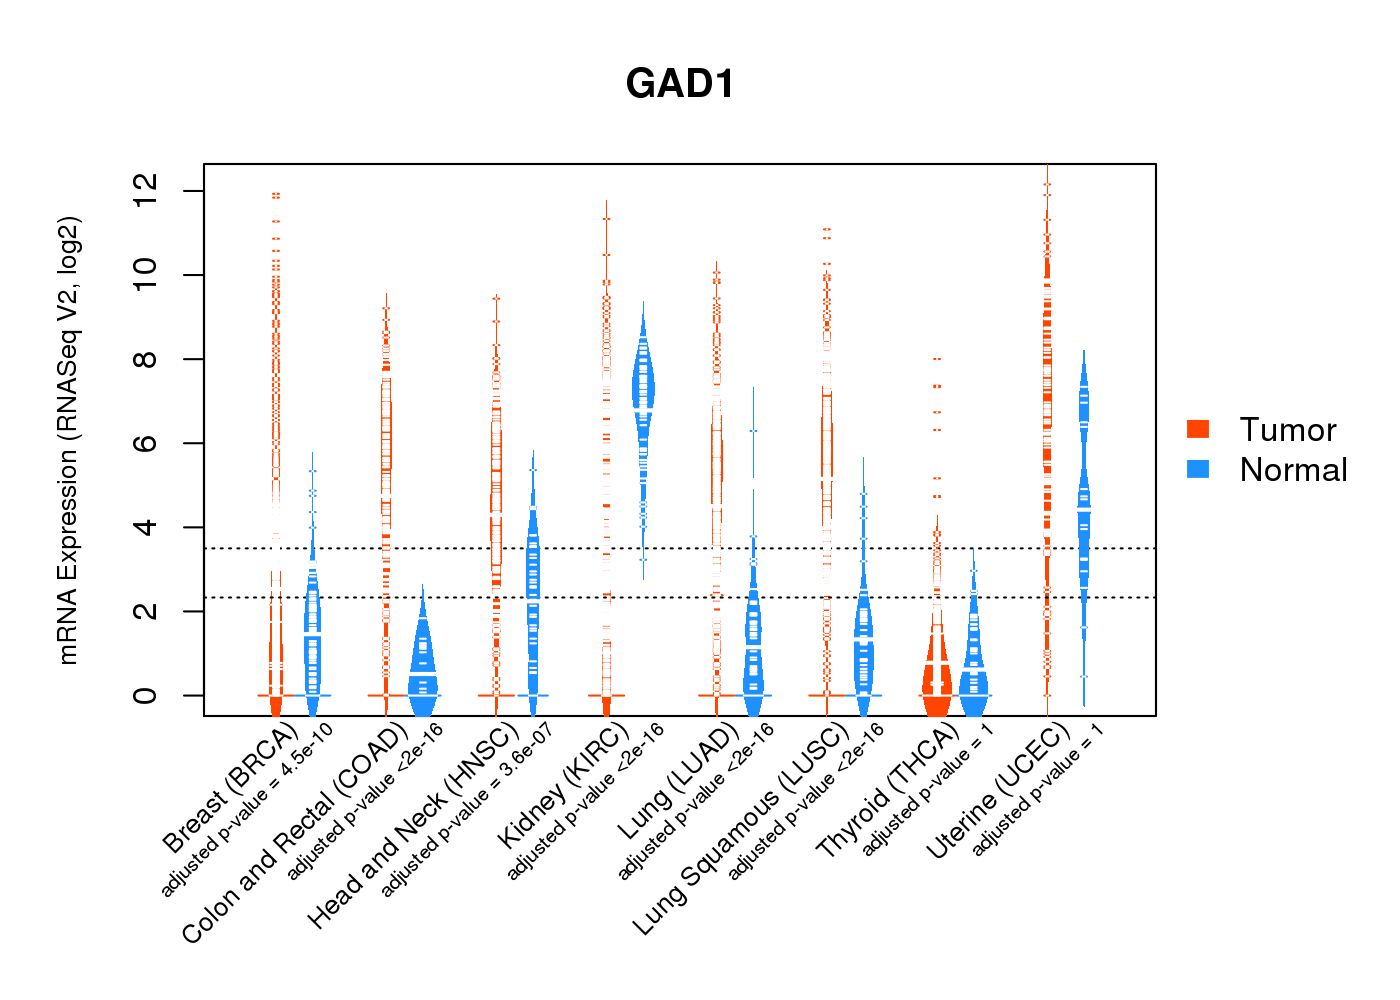
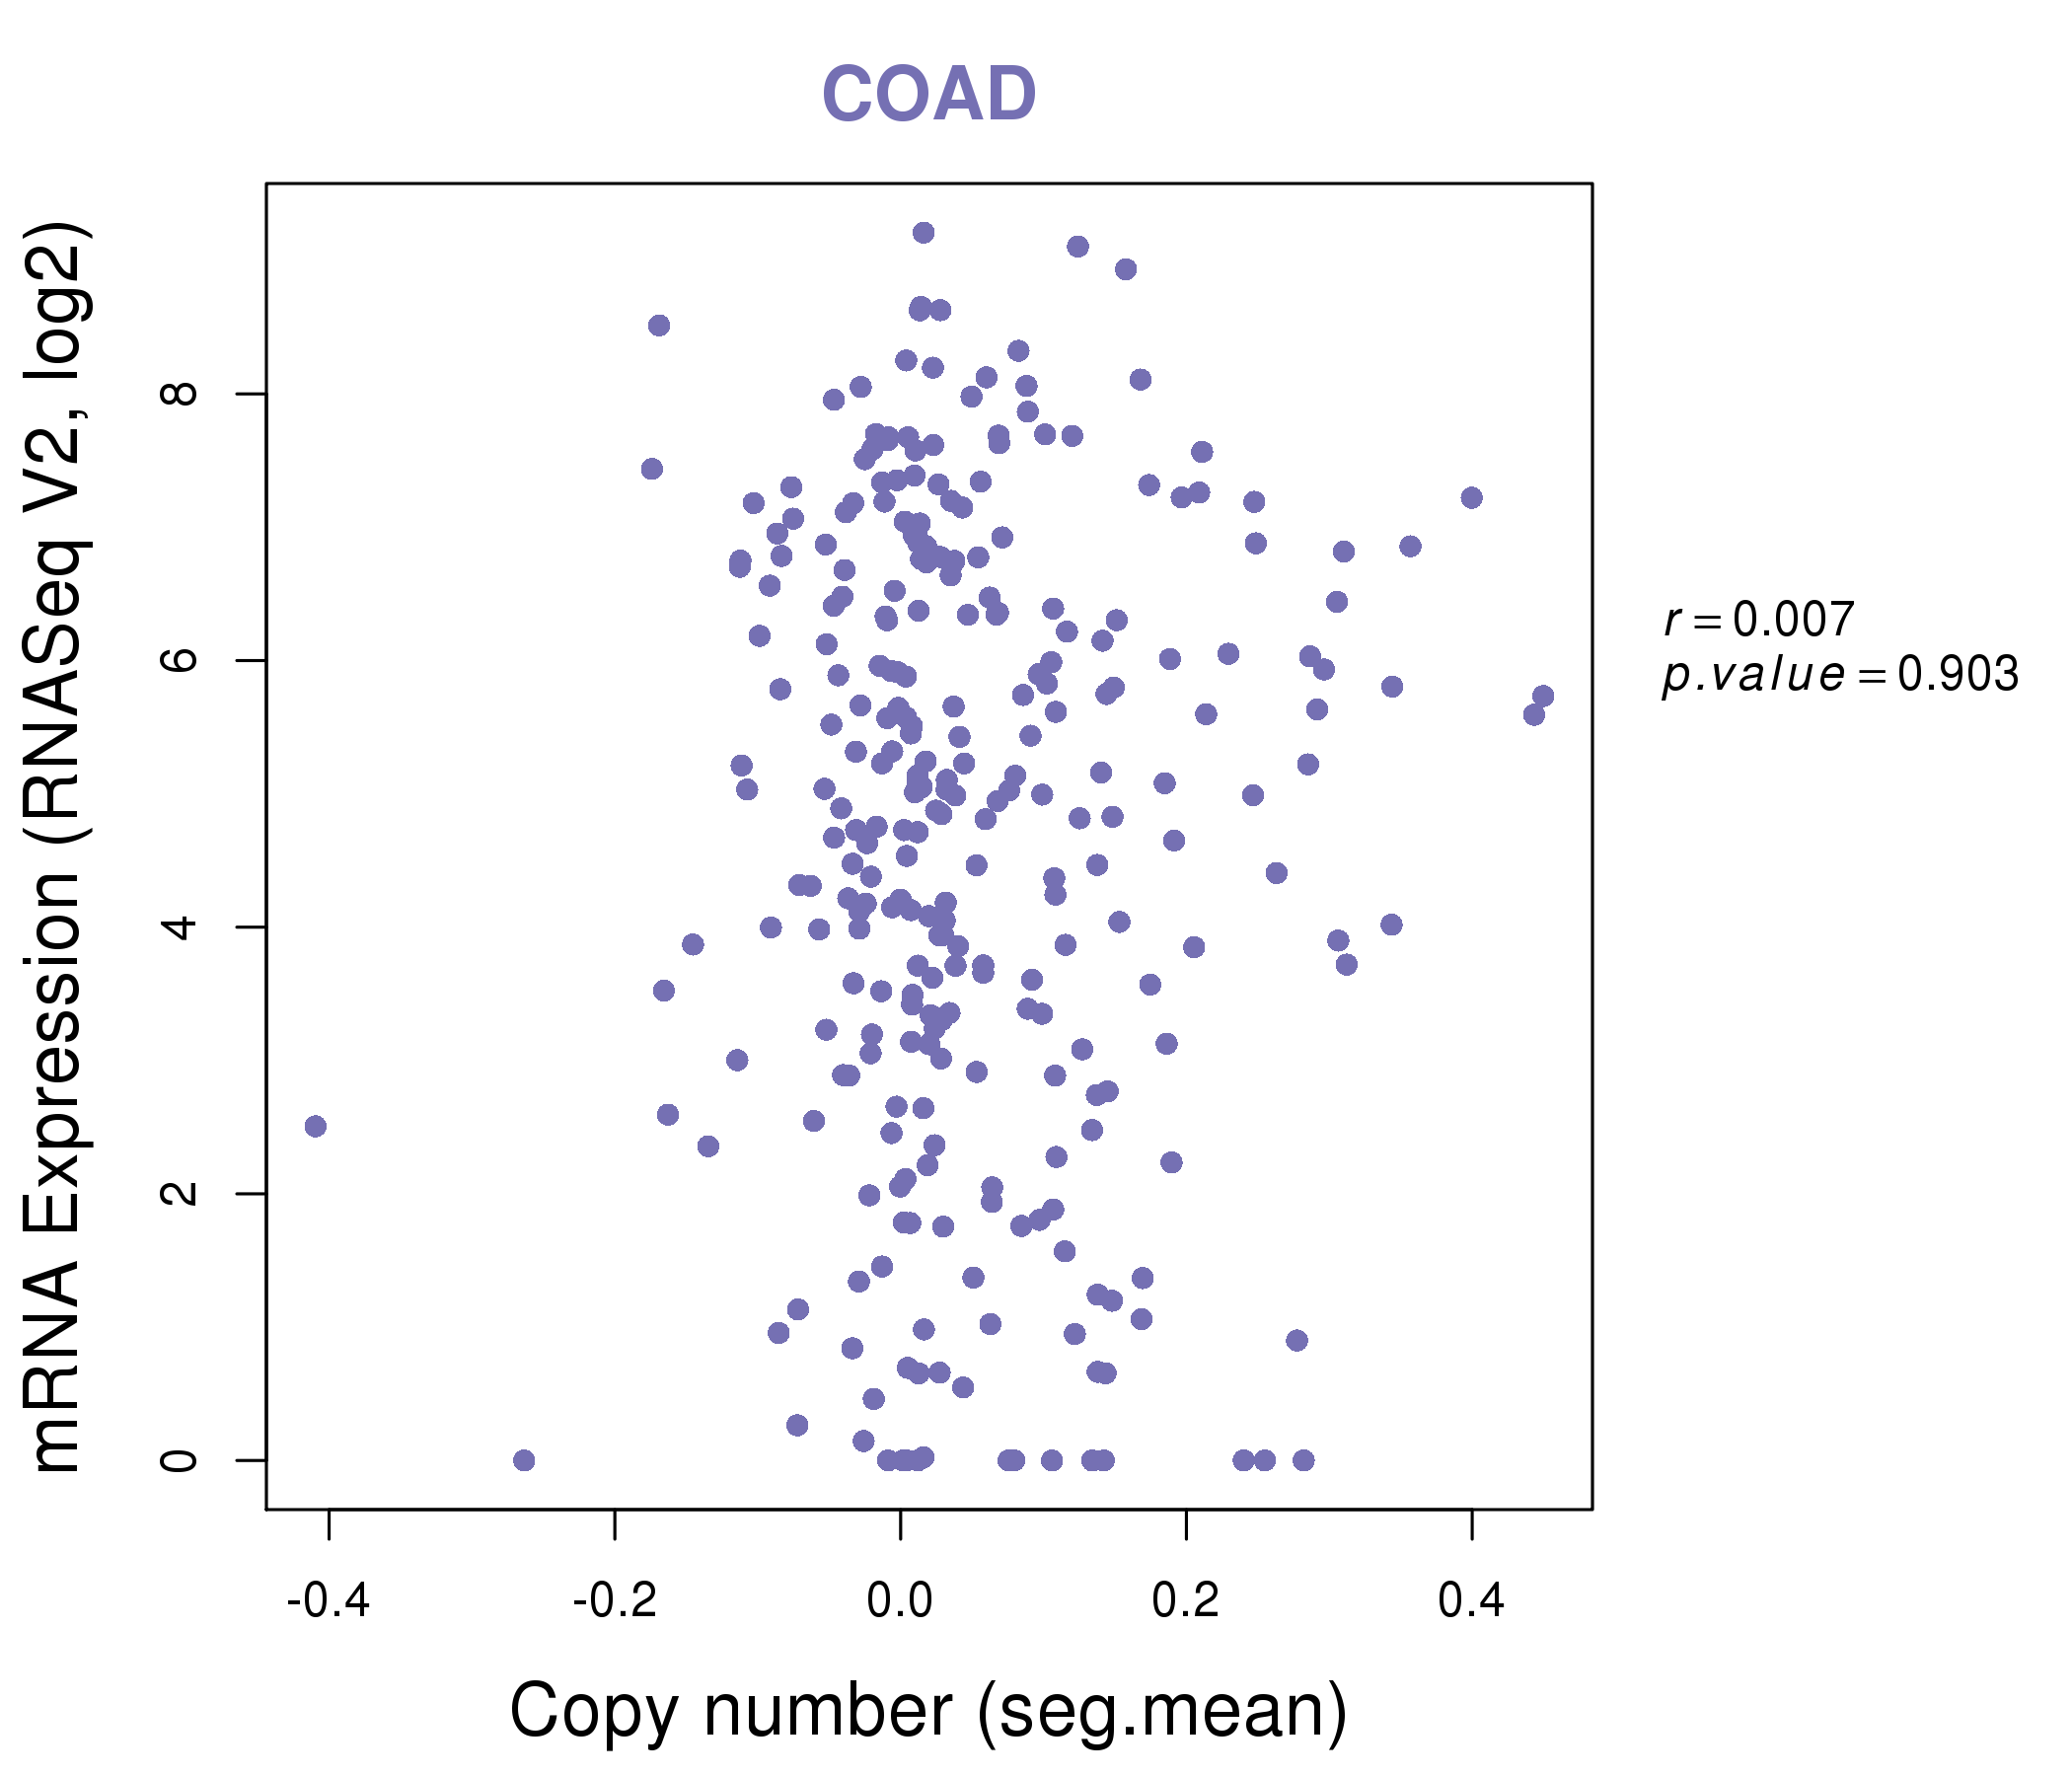
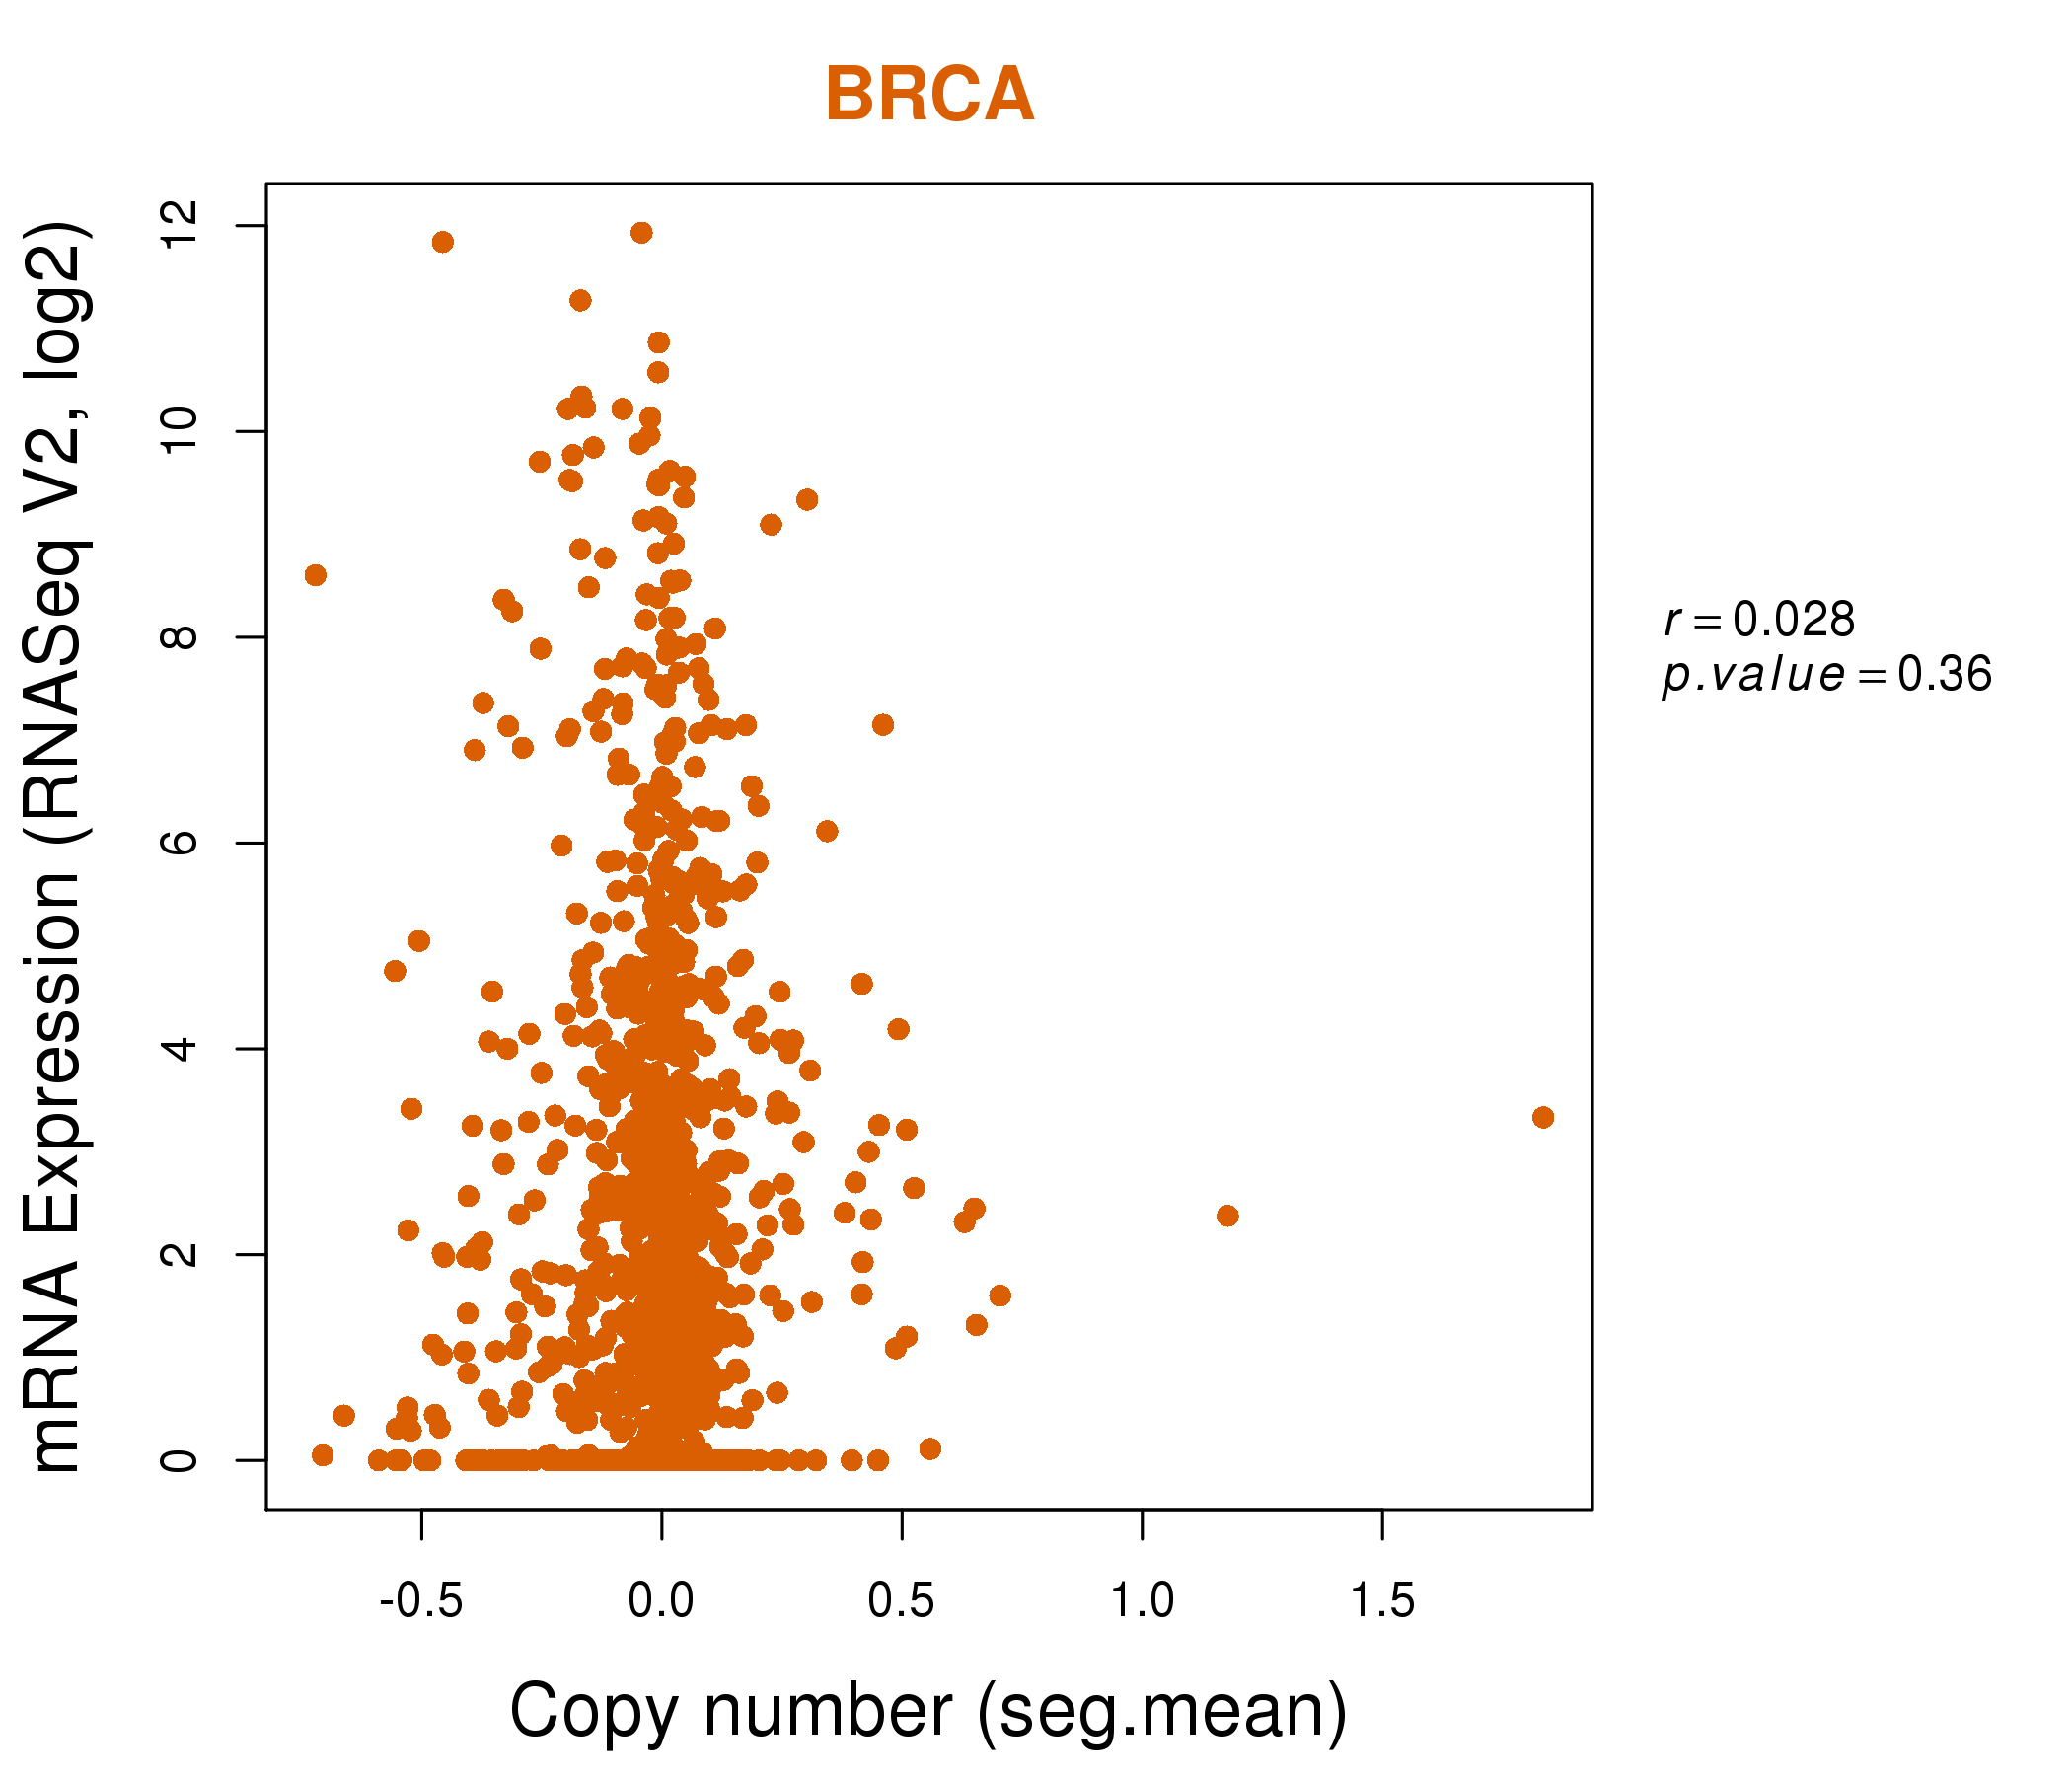
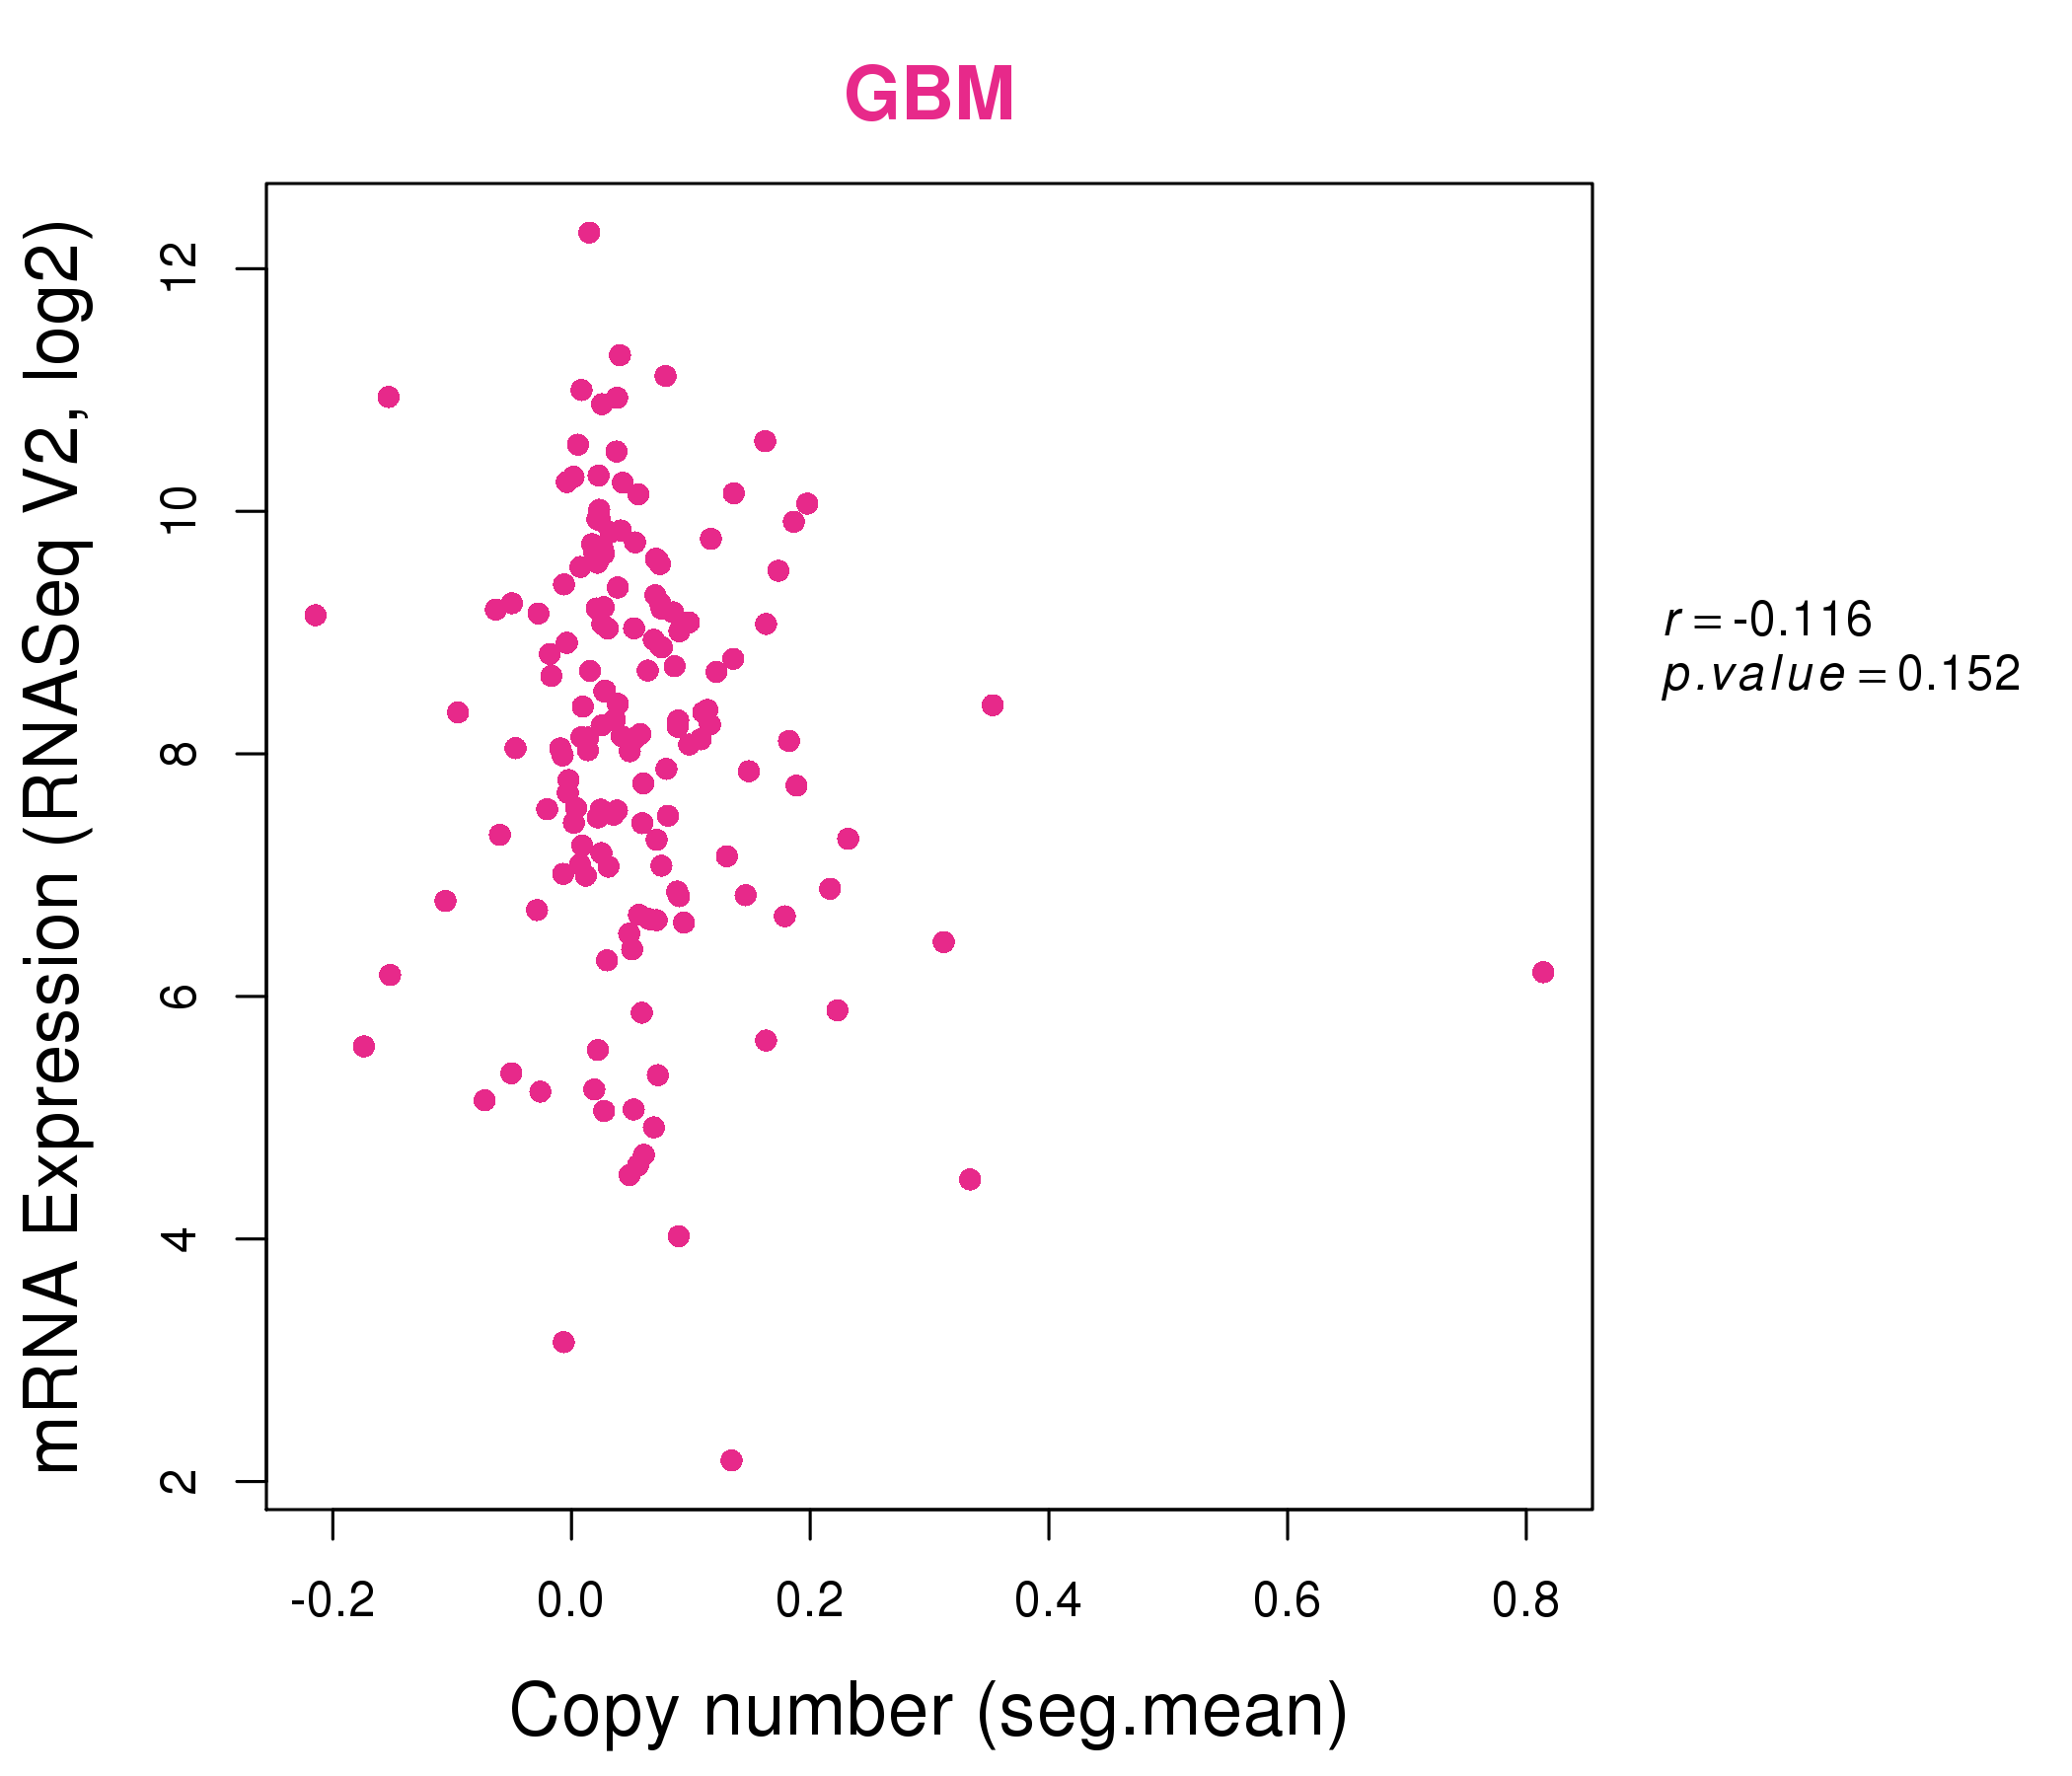
| * Normalized gene expression data of RNASeqV2 was extracted from TCGA using R package TCGA-Assembler. The URLs of all public data files on TCGA DCC data server were gathered at Jan-05-2015. Only eight cancer types have enough normal control samples for differential expression analysis. (t test, adjusted p<0.05 (using Benjamini-Hochberg FDR)) |
 |
| Top |
| * This plots show the correlation between CNV and gene expression. |
: Open all plots for all cancer types
 |
|
 |
|
| Top |
| Gene-Gene Network Information |
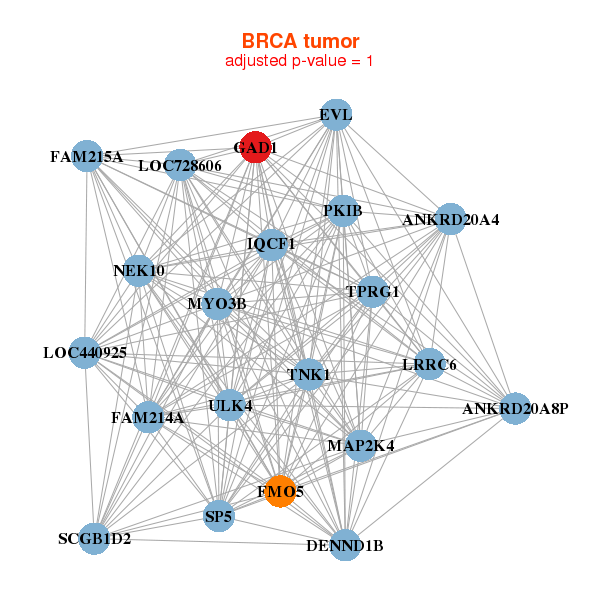
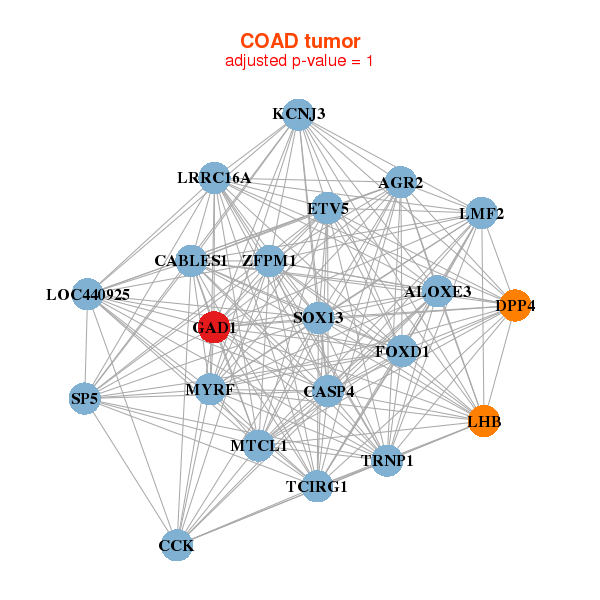
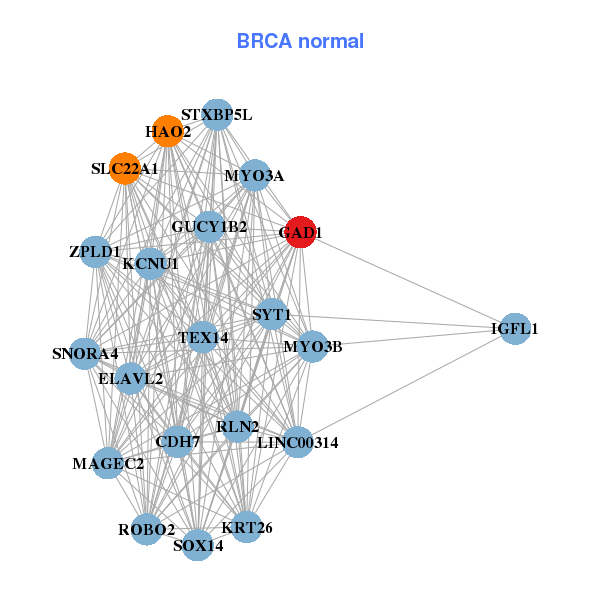
| * Co-Expression network figures were drawn using R package igraph. Only the top 20 genes with the highest correlations were shown. Red circle: input gene, orange circle: cell metabolism gene, sky circle: other gene |
: Open all plots for all cancer types
 |
| ||||
| ANKRD20A4,ANKRD20A8P,FAM215A,DENND1B,EVL,FMO5,GAD1, IQCF1,FAM214A,LOC440925,LOC728606,LRRC6,MAP2K4,MYO3B, NEK10,PKIB,SCGB1D2,SP5,TNK1,TPRG1,ULK4 | LINC00314,CDH7,ELAVL2,GAD1,GUCY1B2,HAO2,IGFL1, KCNU1,KRT26,MAGEC2,MYO3A,MYO3B,RLN2,ROBO2, SLC22A1,SNORA4,SOX14,STXBP5L,SYT1,TEX14,ZPLD1 | ||||
 |
| ||||
| AGR2,ALOXE3,MYRF,CABLES1,CASP4,CCK,DPP4, ETV5,FOXD1,GAD1,KCNJ3,MTCL1,LHB,LMF2, LOC440925,LRRC16A,SOX13,SP5,TCIRG1,TRNP1,ZFPM1 | CYP4F30P,CEACAM3,DEFA1B,RIPPLY3,EPB41L4A,GAD1,GJB4, GNRHR,GPR12,HPVC1,KRTAP13-2,MORF4,MSMB,OR2S2, OTX1,PAPPA2,TAPT1,TMEM105,SYNDIG1L,UNC5C,ZNF720 |
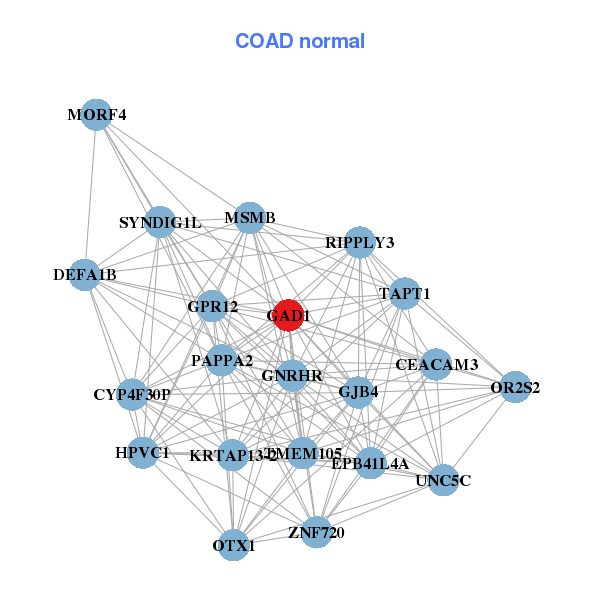
| * Co-Expression network figures were drawn using R package igraph. Only the top 20 genes with the highest correlations were shown. Red circle: input gene, orange circle: cell metabolism gene, sky circle: other gene |
: Open all plots for all cancer types
| Top |
: Open all interacting genes' information including KEGG pathway for all interacting genes from DAVID
| Top |
| Pharmacological Information for GAD1 |
| DB Category | DB Name | DB's ID and Url link |
| * Gene Centered Interaction Network. |
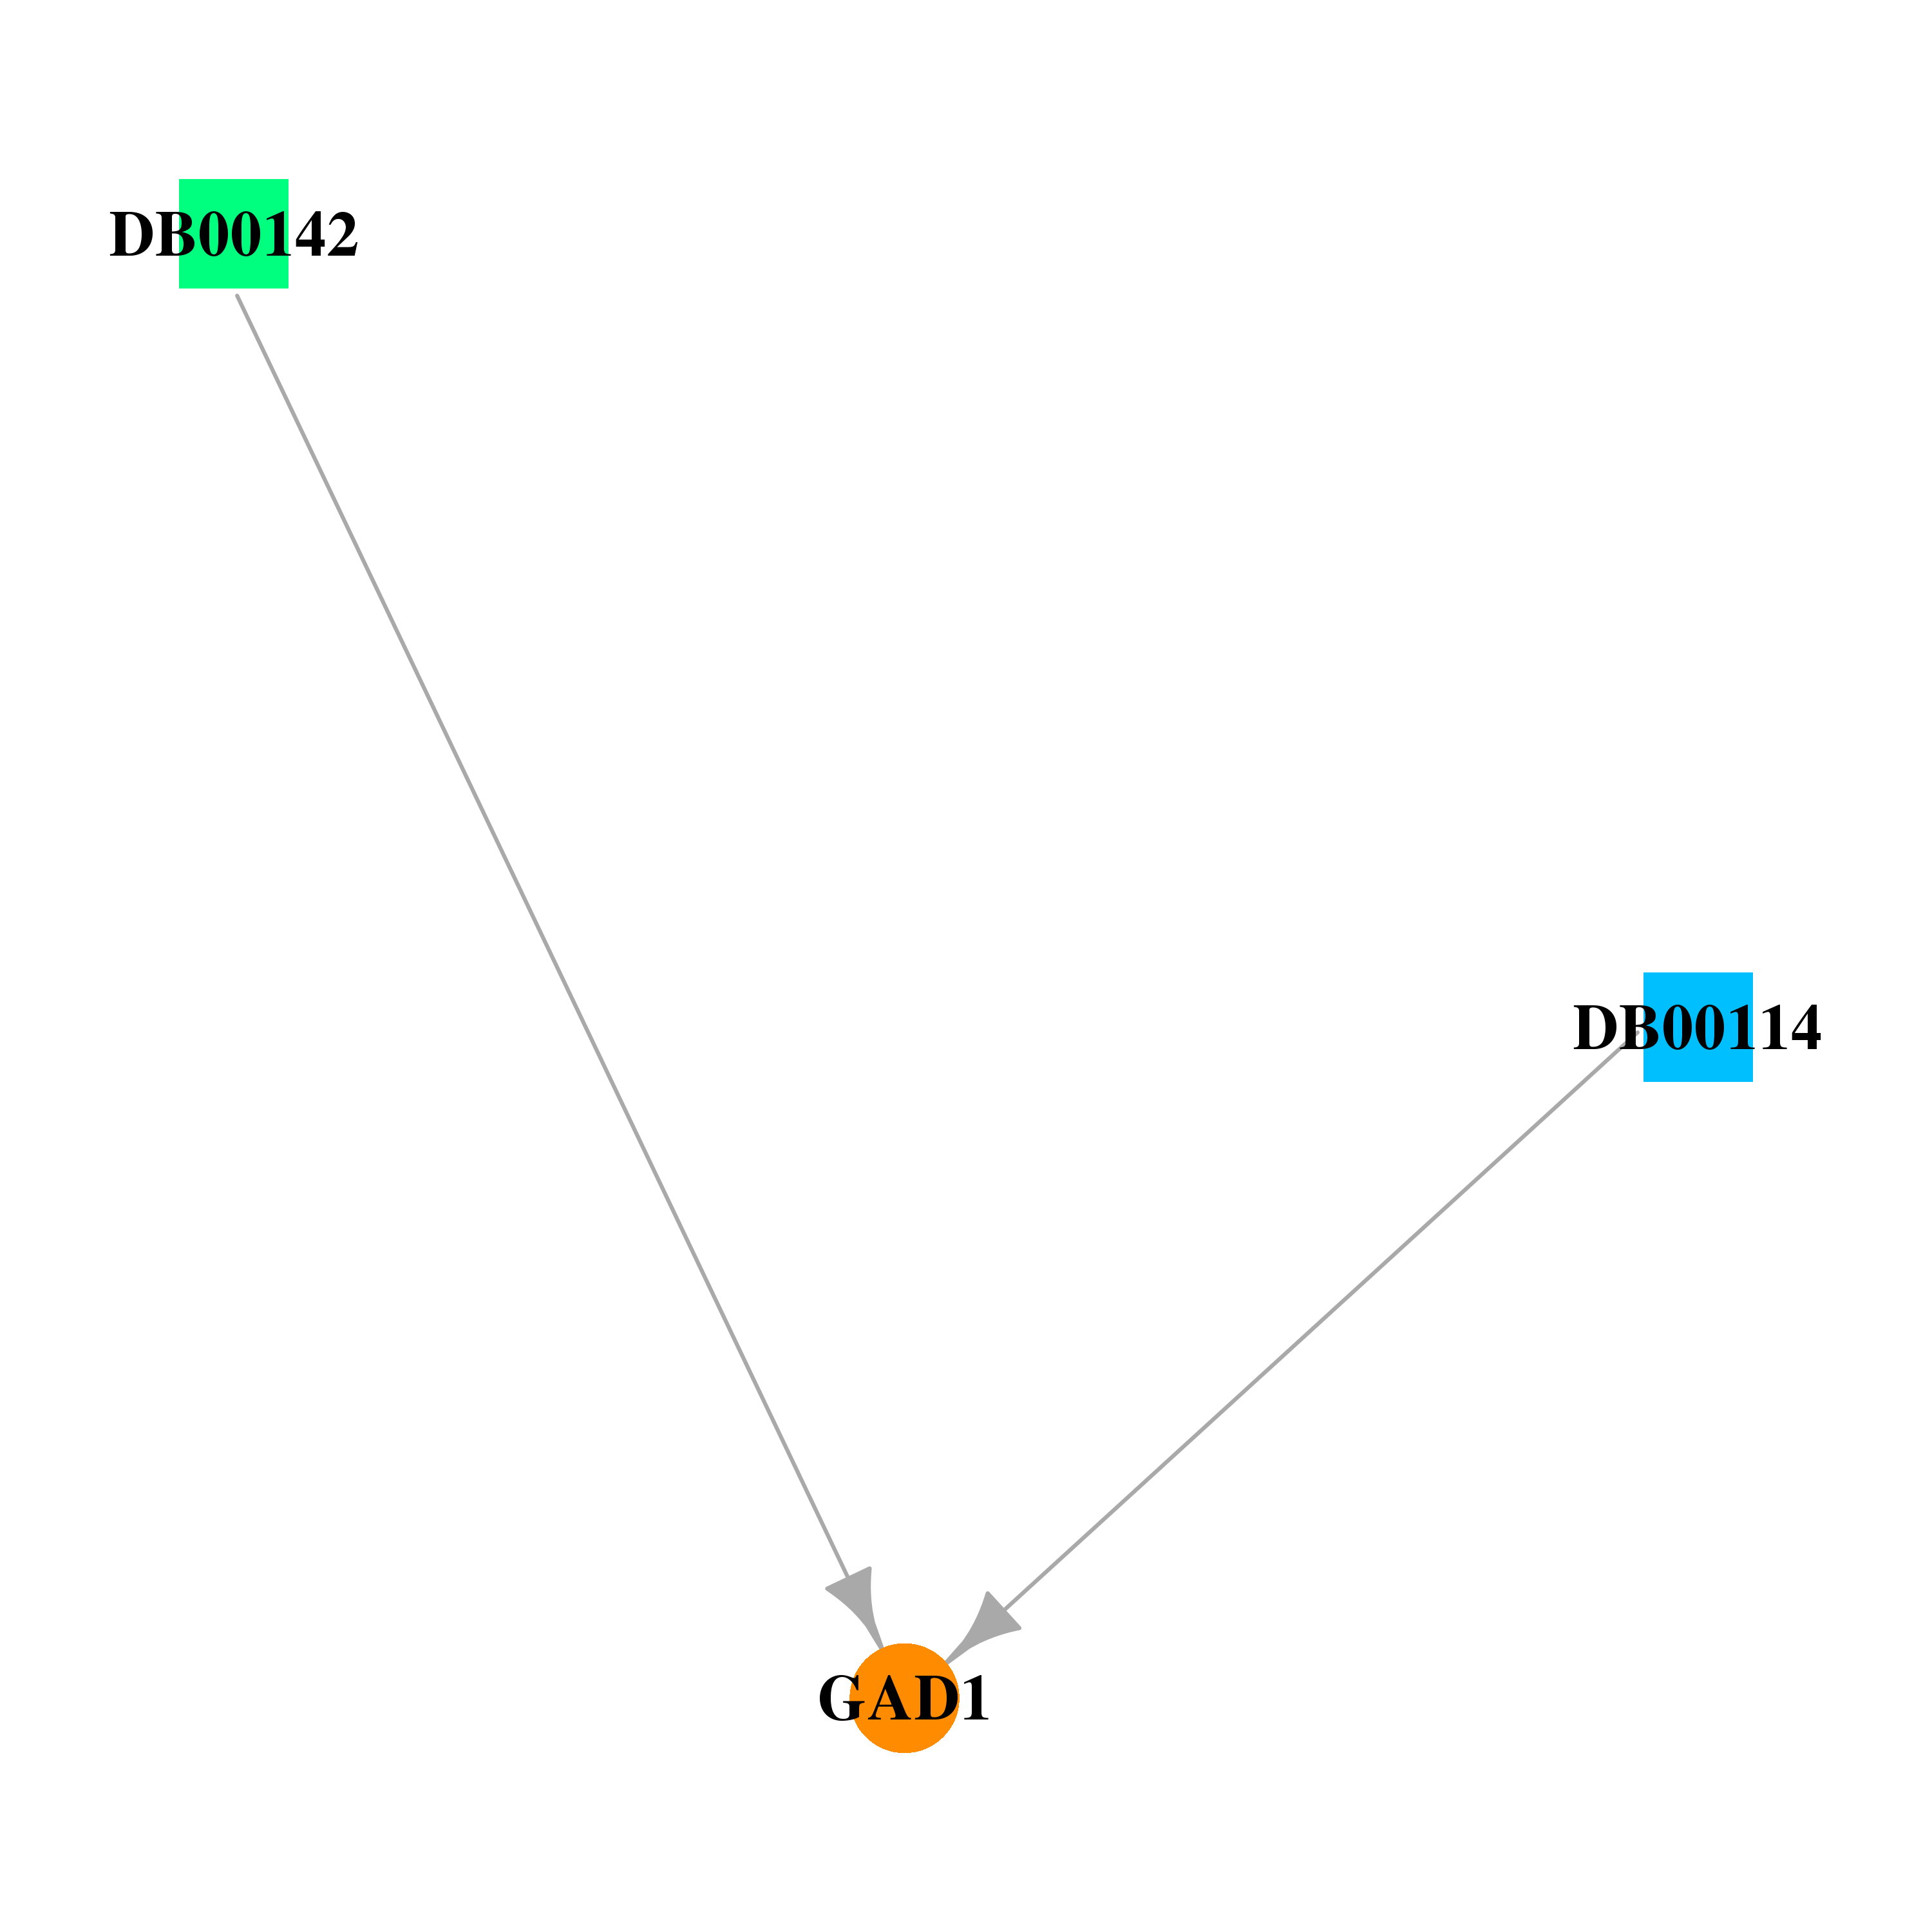 |
| * Drug Centered Interaction Network. |
| DrugBank ID | Target Name | Drug Groups | Generic Name | Drug Centered Network | Drug Structure |
| DB00114 | glutamate decarboxylase 1 (brain, 67kDa) | nutraceutical | Pyridoxal Phosphate |  |  |
| DB00142 | glutamate decarboxylase 1 (brain, 67kDa) | approved; nutraceutical | L-Glutamic Acid | 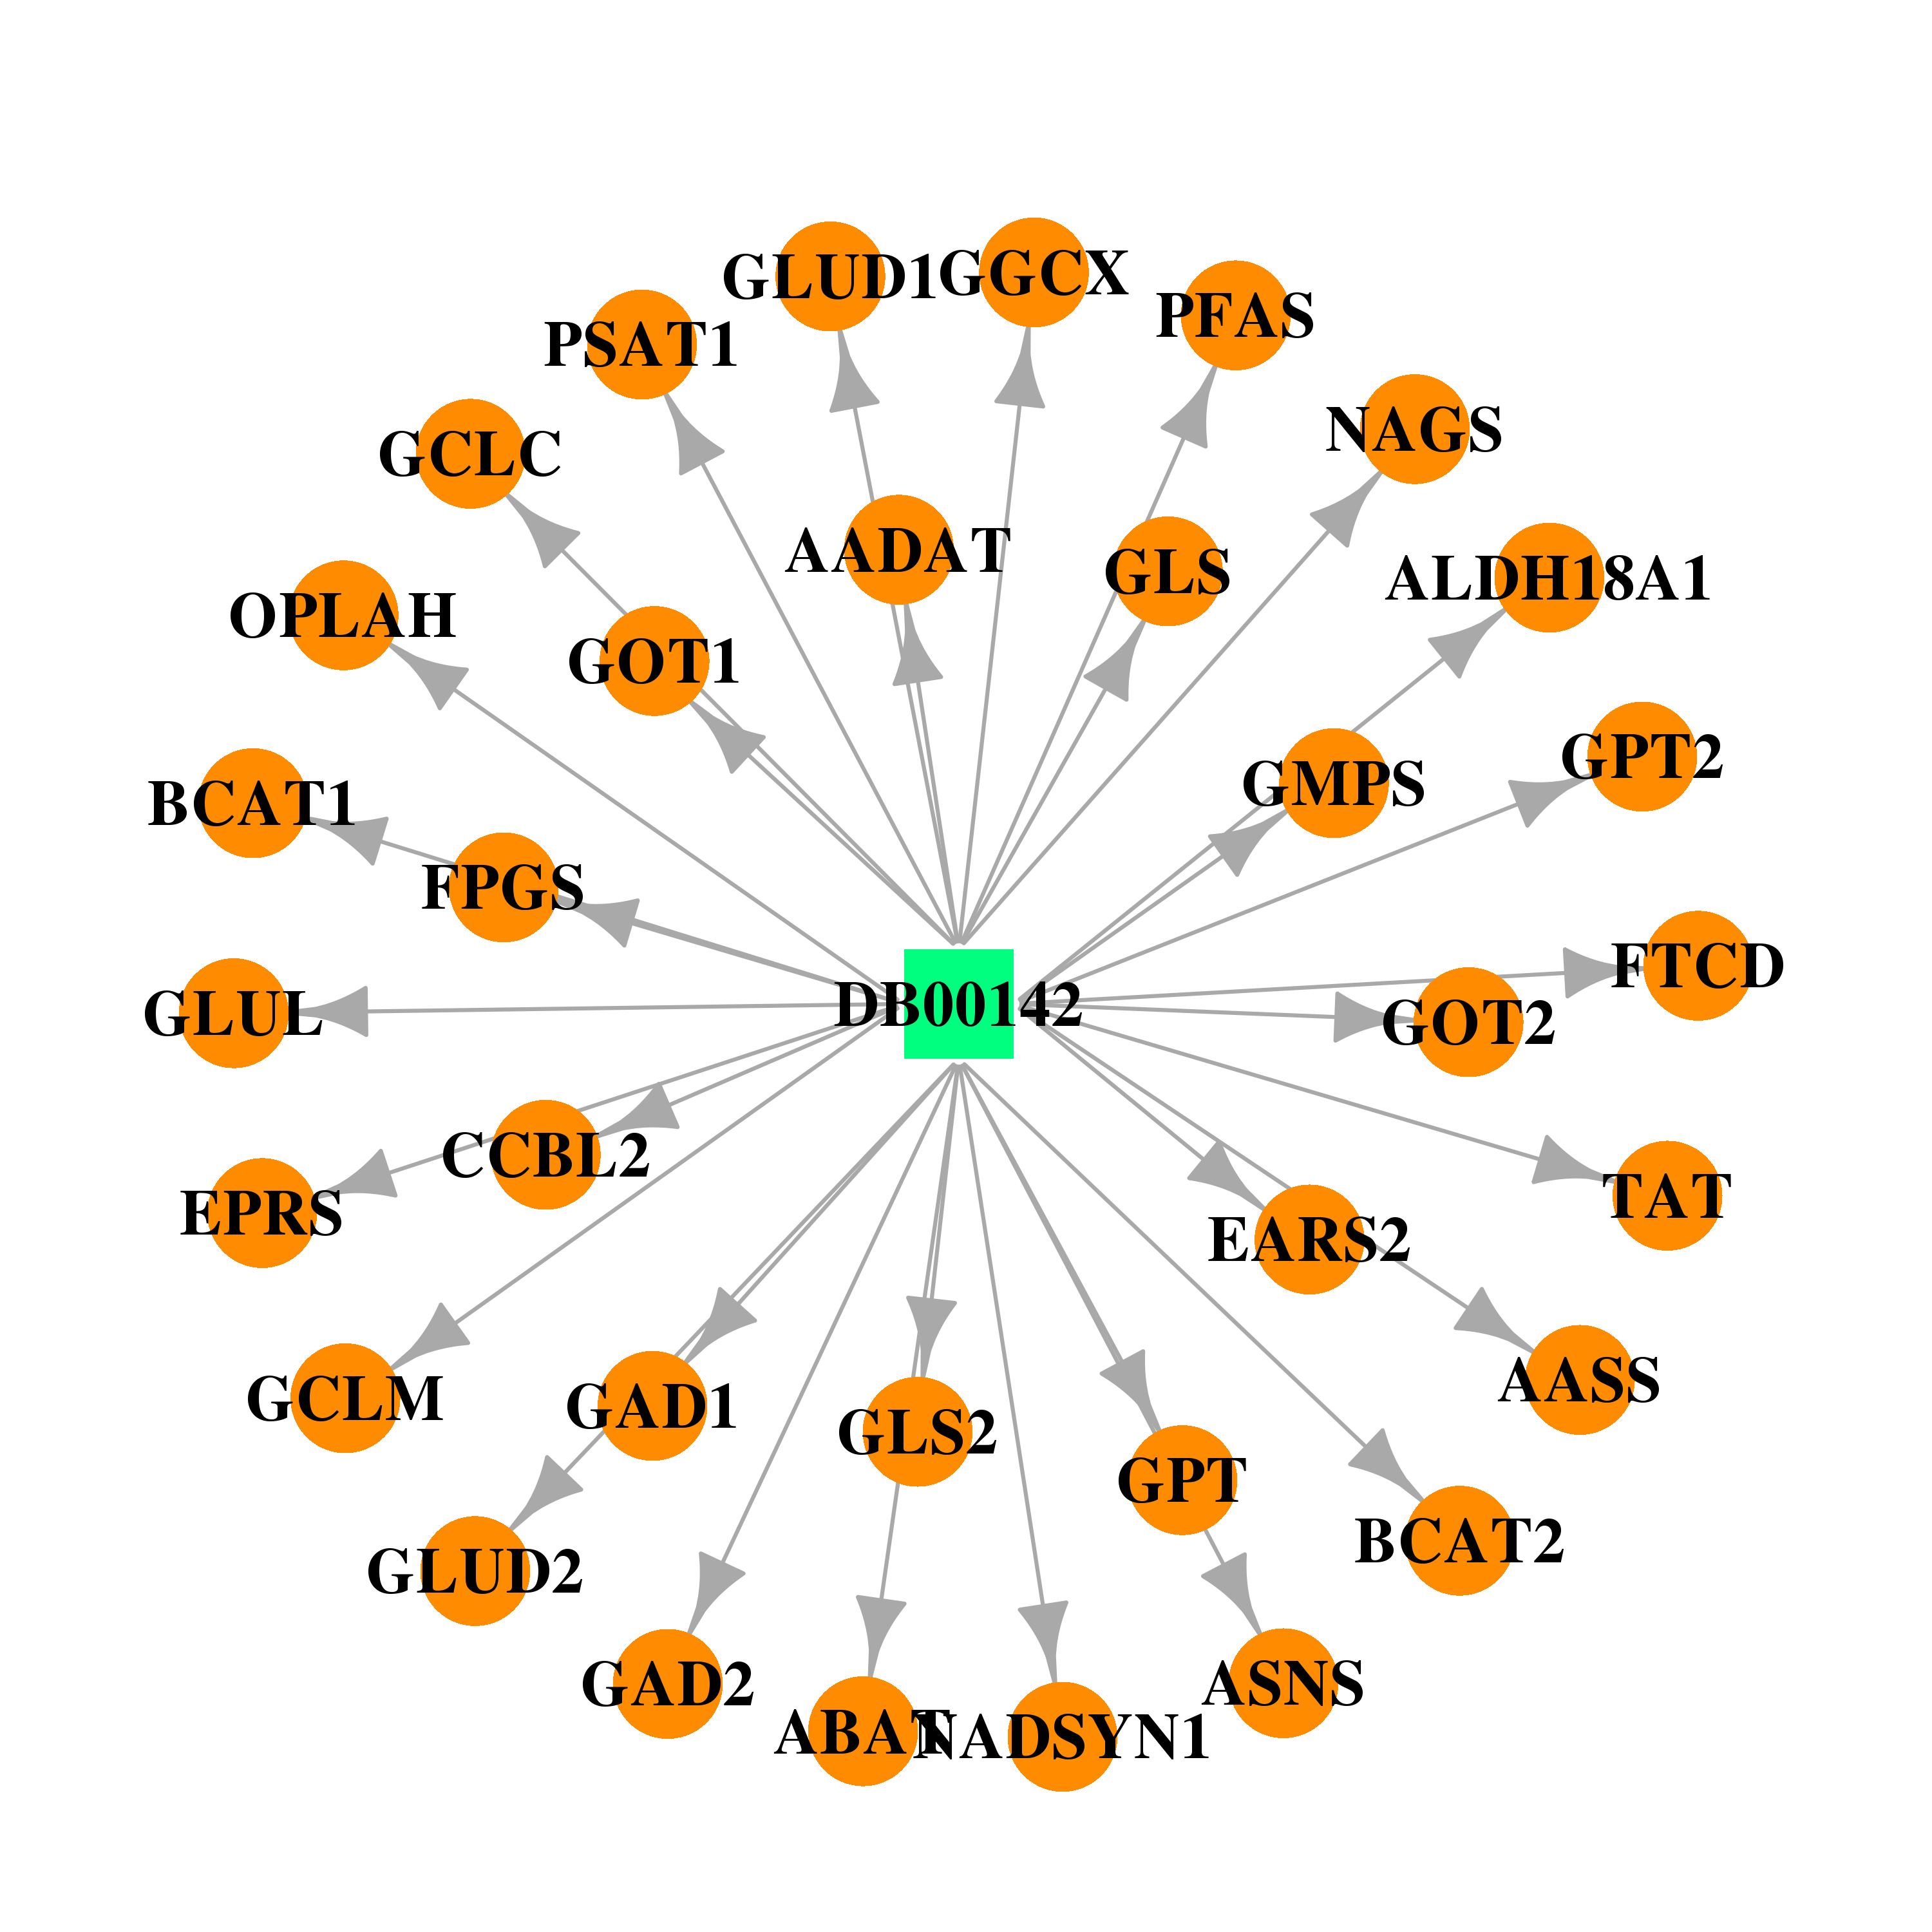 | 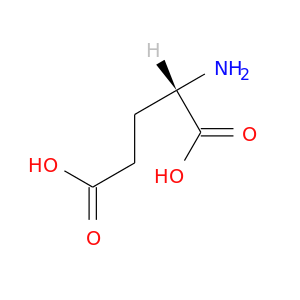 |
| Top |
| Cross referenced IDs for GAD1 |
| * We obtained these cross-references from Uniprot database. It covers 150 different DBs, 18 categories. http://www.uniprot.org/help/cross_references_section |
: Open all cross reference information
|
Copyright © 2016-Present - The Univsersity of Texas Health Science Center at Houston @ |