|
||||||||||||||||||||
| |
| Phenotypic Information (metabolism pathway, cancer, disease, phenome) |
| |
| |
| Gene-Gene Network Information: Co-Expression Network, Interacting Genes & KEGG |
| |
|


| Gene Summary for RPL36 |
| Basic gene info. | Gene symbol | RPL36 |
| Gene name | ribosomal protein L36 | |
| Synonyms | L36 | |
| Cytomap | UCSC genome browser: 19p13.3 | |
| Genomic location | chr19 :5690271-5691678 | |
| Type of gene | protein-coding | |
| RefGenes | NM_015414.3, NM_033643.2, | |
| Ensembl id | ENSG00000130255 | |
| Description | 60S ribosomal protein L36 | |
| Modification date | 20141207 | |
| dbXrefs | HGNC : HGNC | |
| Ensembl : ENSG00000130255 | ||
| HPRD : 10201 | ||
| Vega : OTTHUMG00000178585 | ||
| Protein | UniProt: go to UniProt's Cross Reference DB Table | |
| Expression | CleanEX: HS_RPL36 | |
| BioGPS: 25873 | ||
| Gene Expression Atlas: ENSG00000130255 | ||
| The Human Protein Atlas: ENSG00000130255 | ||
| Pathway | NCI Pathway Interaction Database: RPL36 | |
| KEGG: RPL36 | ||
| REACTOME: RPL36 | ||
| ConsensusPathDB | ||
| Pathway Commons: RPL36 | ||
| Metabolism | MetaCyc: RPL36 | |
| HUMANCyc: RPL36 | ||
| Regulation | Ensembl's Regulation: ENSG00000130255 | |
| miRBase: chr19 :5,690,271-5,691,678 | ||
| TargetScan: NM_015414 | ||
| cisRED: ENSG00000130255 | ||
| Context | iHOP: RPL36 | |
| cancer metabolism search in PubMed: RPL36 | ||
| UCL Cancer Institute: RPL36 | ||
| Assigned class in ccmGDB | C | |
| Top |
| Phenotypic Information for RPL36(metabolism pathway, cancer, disease, phenome) |
| Cancer | CGAP: RPL36 |
| Familial Cancer Database: RPL36 | |
| * This gene is included in those cancer gene databases. |
|
|
|
|
|
| . | ||||||||||||||
Oncogene 1 | Significant driver gene in | |||||||||||||||||||
| cf) number; DB name 1 Oncogene; http://nar.oxfordjournals.org/content/35/suppl_1/D721.long, 2 Tumor Suppressor gene; https://bioinfo.uth.edu/TSGene/, 3 Cancer Gene Census; http://www.nature.com/nrc/journal/v4/n3/abs/nrc1299.html, 4 CancerGenes; http://nar.oxfordjournals.org/content/35/suppl_1/D721.long, 5 Network of Cancer Gene; http://ncg.kcl.ac.uk/index.php, 1Therapeutic Vulnerabilities in Cancer; http://cbio.mskcc.org/cancergenomics/statius/ |
| REACTOME_METABOLISM_OF_PROTEINS REACTOME_METABOLISM_OF_MRNA REACTOME_METABOLISM_OF_RNA | |
| OMIM | |
| Orphanet | |
| Disease | KEGG Disease: RPL36 |
| MedGen: RPL36 (Human Medical Genetics with Condition) | |
| ClinVar: RPL36 | |
| Phenotype | MGI: RPL36 (International Mouse Phenotyping Consortium) |
| PhenomicDB: RPL36 | |
| Mutations for RPL36 |
| * Under tables are showing count per each tissue to give us broad intuition about tissue specific mutation patterns.You can go to the detailed page for each mutation database's web site. |
| There's no structural variation information in COSMIC data for this gene. |
| * From mRNA Sanger sequences, Chitars2.0 arranged chimeric transcripts. This table shows RPL36 related fusion information. |
| ID | Head Gene | Tail Gene | Accession | Gene_a | qStart_a | qEnd_a | Chromosome_a | tStart_a | tEnd_a | Gene_a | qStart_a | qEnd_a | Chromosome_a | tStart_a | tEnd_a |
| EC575727 | FOXP2 | 1 | 54 | 7 | 113937246 | 113937300 | RPL36 | 49 | 116 | 19 | 5691358 | 5691425 | |
| BG271954 | ZFP36L2 | 1 | 218 | 2 | 43451136 | 43451353 | RPL36 | 214 | 267 | 19 | 5691358 | 5691411 | |
| BE881501 | UGGT1 | 1 | 449 | 2 | 128947371 | 128947822 | RPL36 | 442 | 485 | 19 | 5691635 | 5691678 | |
| AI497618 | RPL36 | 36 | 79 | 19 | 5691635 | 5691678 | IGFBP5 | 75 | 535 | 2 | 217541449 | 217543759 | |
| AI497603 | RPL36 | 24 | 66 | 19 | 5691636 | 5691678 | SLC23A2 | 65 | 335 | 20 | 4833667 | 4833937 | |
| Top |
| There's no copy number variation information in COSMIC data for this gene. |
| Top |
|
 |
| Top |
| Stat. for Non-Synonymous SNVs (# total SNVs=2) | (# total SNVs=0) |
 | |
(# total SNVs=0) | (# total SNVs=0) |
| Top |
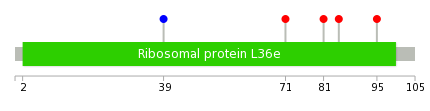
| * When you move the cursor on each content, you can see more deailed mutation information on the Tooltip. Those are primary_site,primary_histology,mutation(aa),pubmedID. |
| GRCh37 position | Mutation(aa) | Unique sampleID count |
| chr19:5691353-5691353 | p.F39F | 1 |
| chr19:5691448-5691448 | p.K71T | 1 |
| chr19:5691557-5691557 | p.I81M | 1 |
| chr19:5691568-5691568 | p.R85K | 1 |
| chr19:5691598-5691598 | p.A95V | 1 |
| Top |
|
 |
| Point Mutation/ Tissue ID | 1 | 2 | 3 | 4 | 5 | 6 | 7 | 8 | 9 | 10 | 11 | 12 | 13 | 14 | 15 | 16 | 17 | 18 | 19 | 20 |
| # sample | 1 | 1 | 2 | 1 | ||||||||||||||||
| # mutation | 1 | 1 | 2 | 1 | ||||||||||||||||
| nonsynonymous SNV | 1 | 1 | 2 | 1 | ||||||||||||||||
| synonymous SNV |
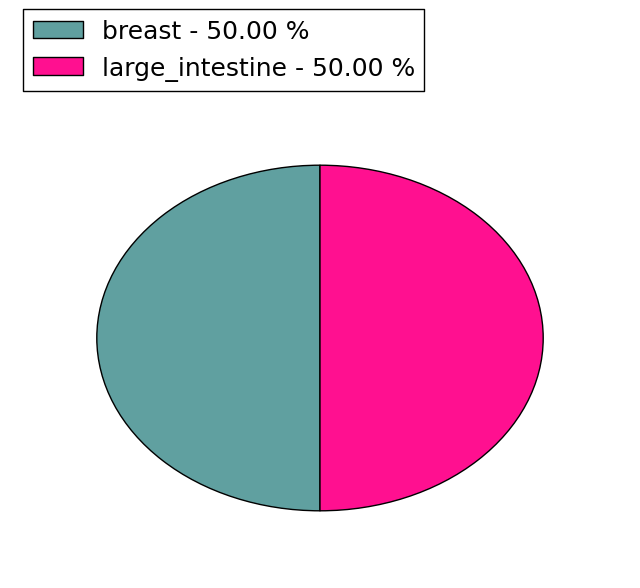
| cf) Tissue ID; Tissue type (1; BLCA[Bladder Urothelial Carcinoma], 2; BRCA[Breast invasive carcinoma], 3; CESC[Cervical squamous cell carcinoma and endocervical adenocarcinoma], 4; COAD[Colon adenocarcinoma], 5; GBM[Glioblastoma multiforme], 6; Glioma Low Grade, 7; HNSC[Head and Neck squamous cell carcinoma], 8; KICH[Kidney Chromophobe], 9; KIRC[Kidney renal clear cell carcinoma], 10; KIRP[Kidney renal papillary cell carcinoma], 11; LAML[Acute Myeloid Leukemia], 12; LUAD[Lung adenocarcinoma], 13; LUSC[Lung squamous cell carcinoma], 14; OV[Ovarian serous cystadenocarcinoma ], 15; PAAD[Pancreatic adenocarcinoma], 16; PRAD[Prostate adenocarcinoma], 17; SKCM[Skin Cutaneous Melanoma], 18:STAD[Stomach adenocarcinoma], 19:THCA[Thyroid carcinoma], 20:UCEC[Uterine Corpus Endometrial Carcinoma]) |
| Top |
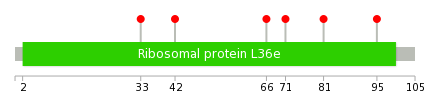
| * We represented just top 10 SNVs. When you move the cursor on each content, you can see more deailed mutation information on the Tooltip. Those are primary_site, primary_histology, mutation(aa), pubmedID. |
| Genomic Position | Mutation(aa) | Unique sampleID count |
| chr19:5691333 | p.L33V,RPL36 | 1 |
| chr19:5691360 | p.D42N,RPL36 | 1 |
| chr19:5691434 | p.D66E,RPL36 | 1 |
| chr19:5691448 | p.K71T,RPL36 | 1 |
| chr19:5691557 | p.I81M,RPL36 | 1 |
| chr19:5691598 | p.A95V,RPL36 | 1 |
| * Copy number data were extracted from TCGA using R package TCGA-Assembler. The URLs of all public data files on TCGA DCC data server were gathered on Jan-05-2015. Function ProcessCNAData in TCGA-Assembler package was used to obtain gene-level copy number value which is calculated as the average copy number of the genomic region of a gene. |
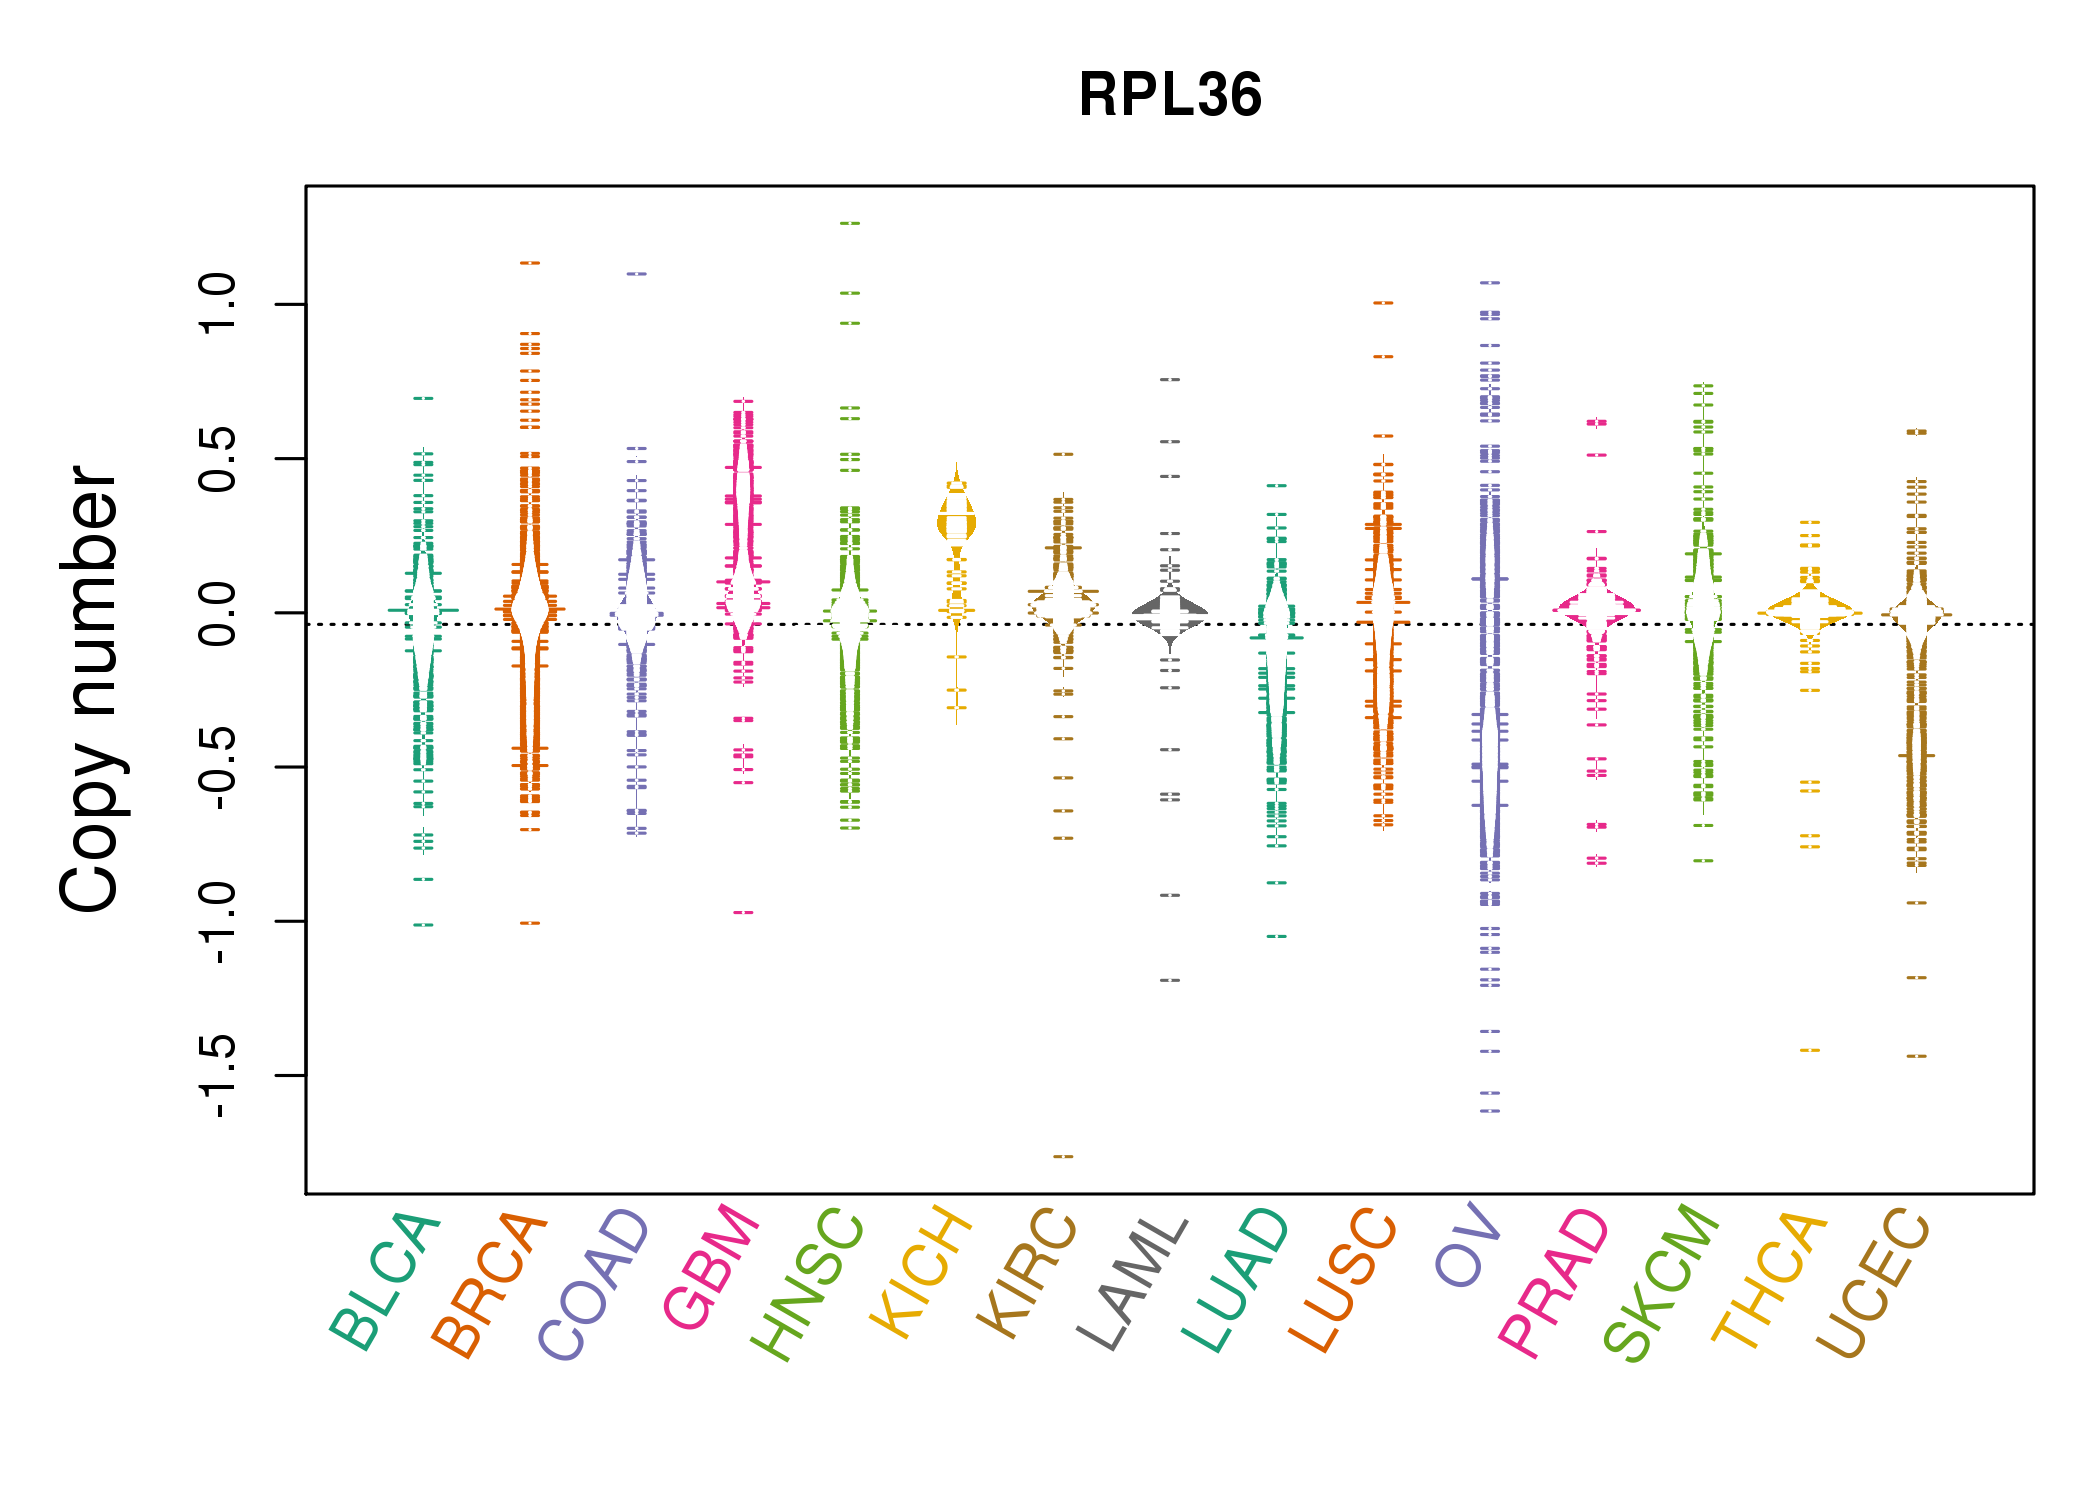 |
| cf) Tissue ID[Tissue type]: BLCA[Bladder Urothelial Carcinoma], BRCA[Breast invasive carcinoma], CESC[Cervical squamous cell carcinoma and endocervical adenocarcinoma], COAD[Colon adenocarcinoma], GBM[Glioblastoma multiforme], Glioma Low Grade, HNSC[Head and Neck squamous cell carcinoma], KICH[Kidney Chromophobe], KIRC[Kidney renal clear cell carcinoma], KIRP[Kidney renal papillary cell carcinoma], LAML[Acute Myeloid Leukemia], LUAD[Lung adenocarcinoma], LUSC[Lung squamous cell carcinoma], OV[Ovarian serous cystadenocarcinoma ], PAAD[Pancreatic adenocarcinoma], PRAD[Prostate adenocarcinoma], SKCM[Skin Cutaneous Melanoma], STAD[Stomach adenocarcinoma], THCA[Thyroid carcinoma], UCEC[Uterine Corpus Endometrial Carcinoma] |
| Top |
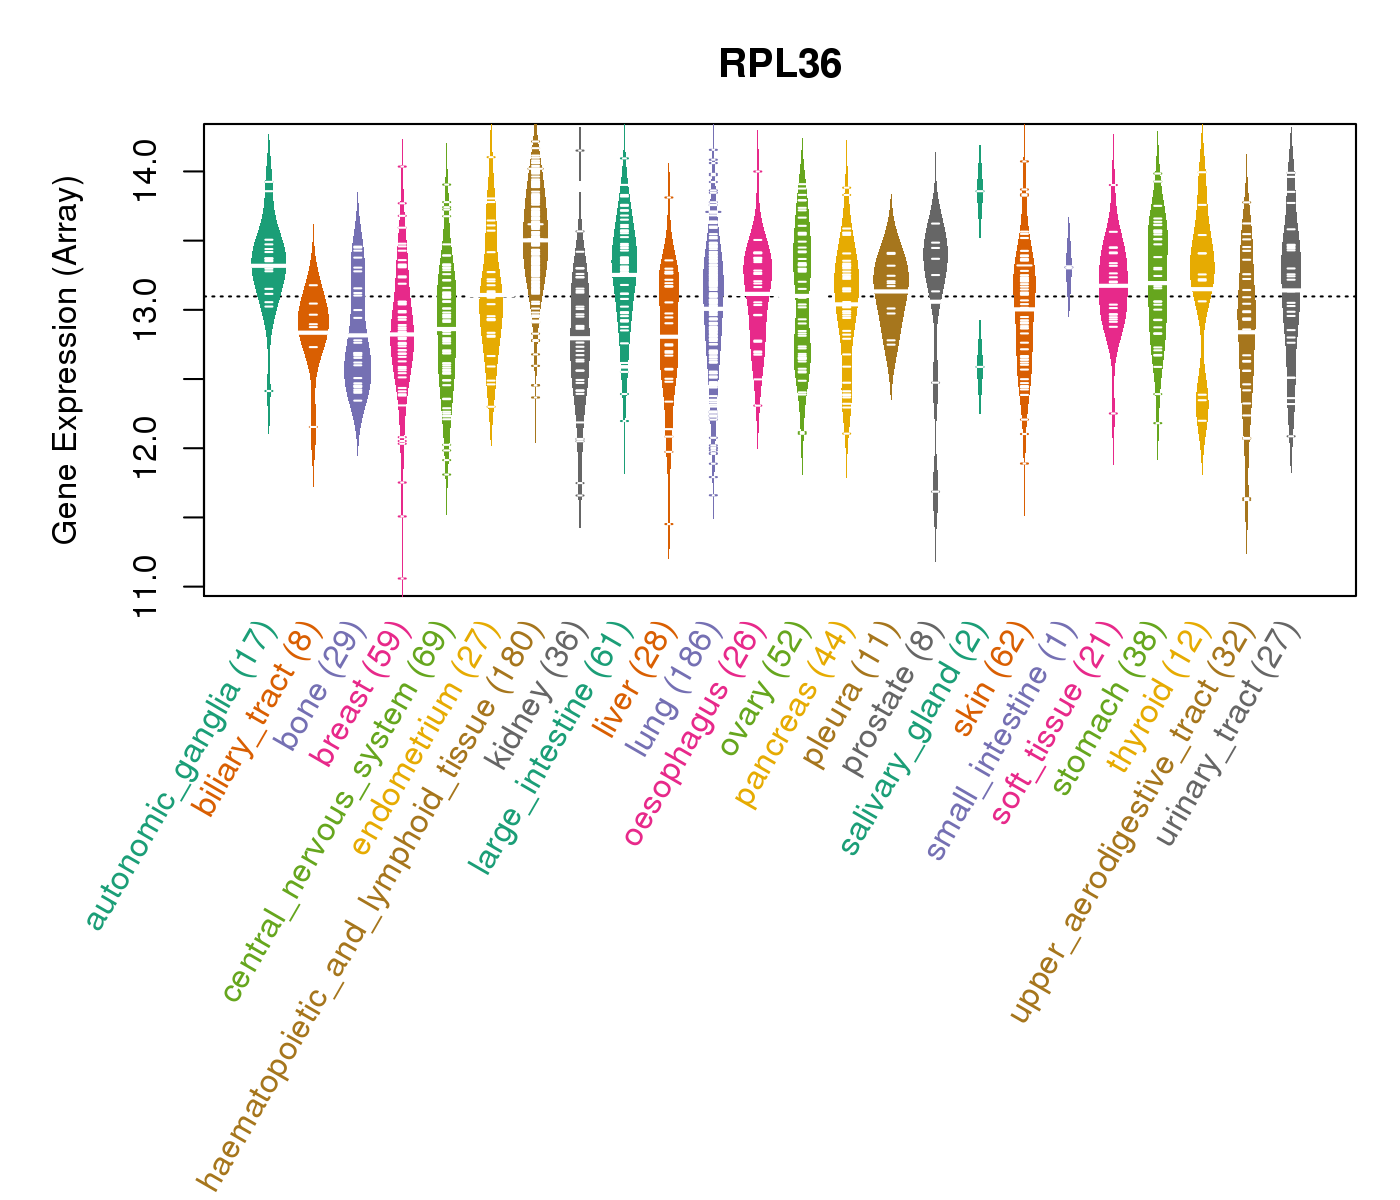
| Gene Expression for RPL36 |
| * CCLE gene expression data were extracted from CCLE_Expression_Entrez_2012-10-18.res: Gene-centric RMA-normalized mRNA expression data. |
 |
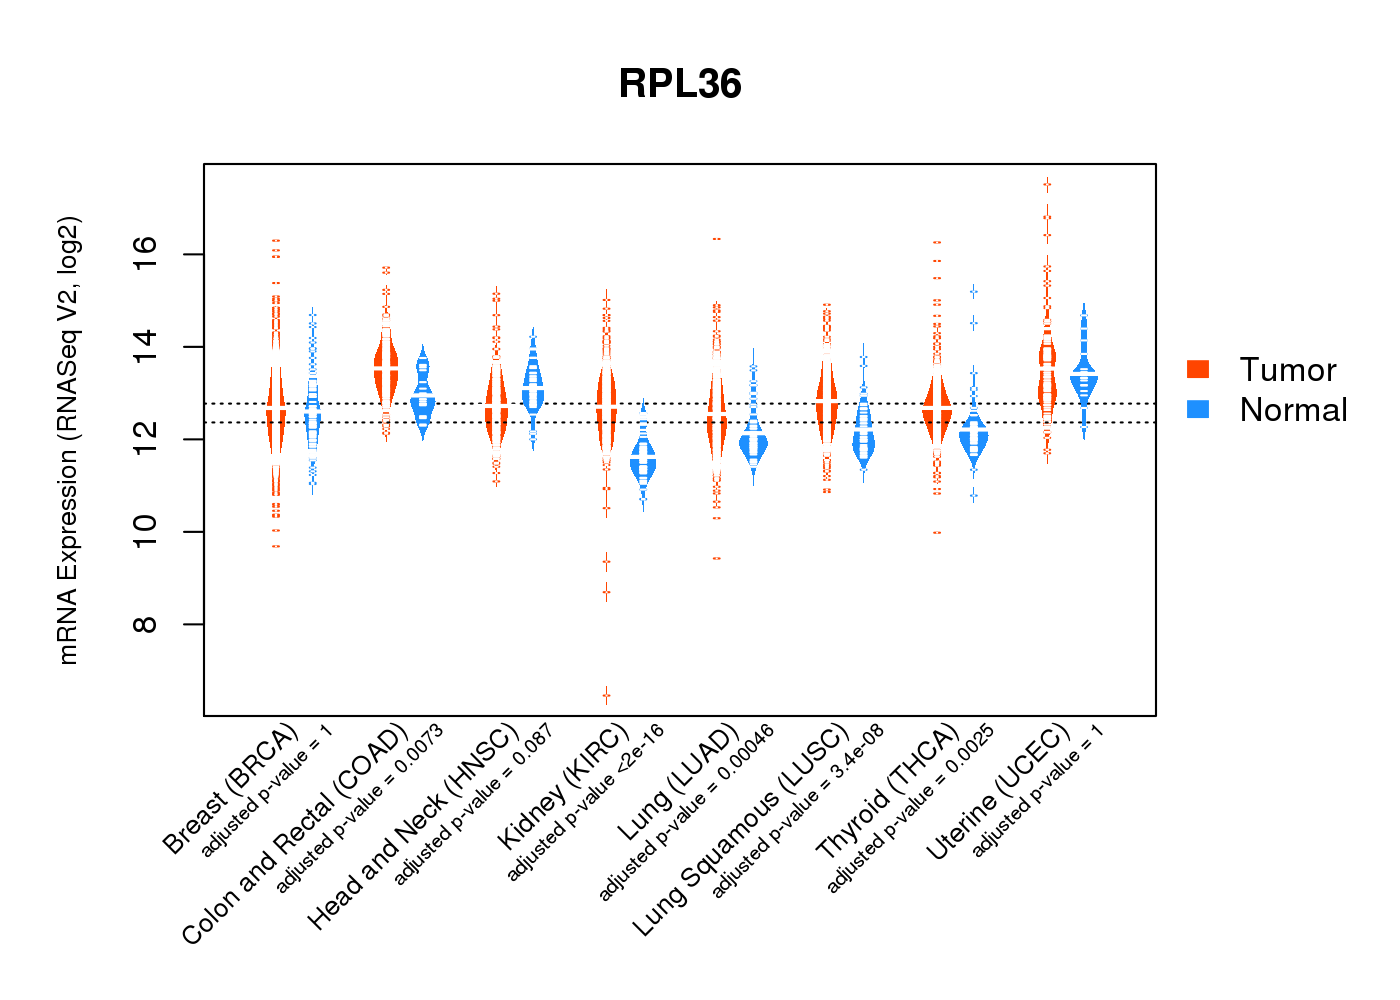
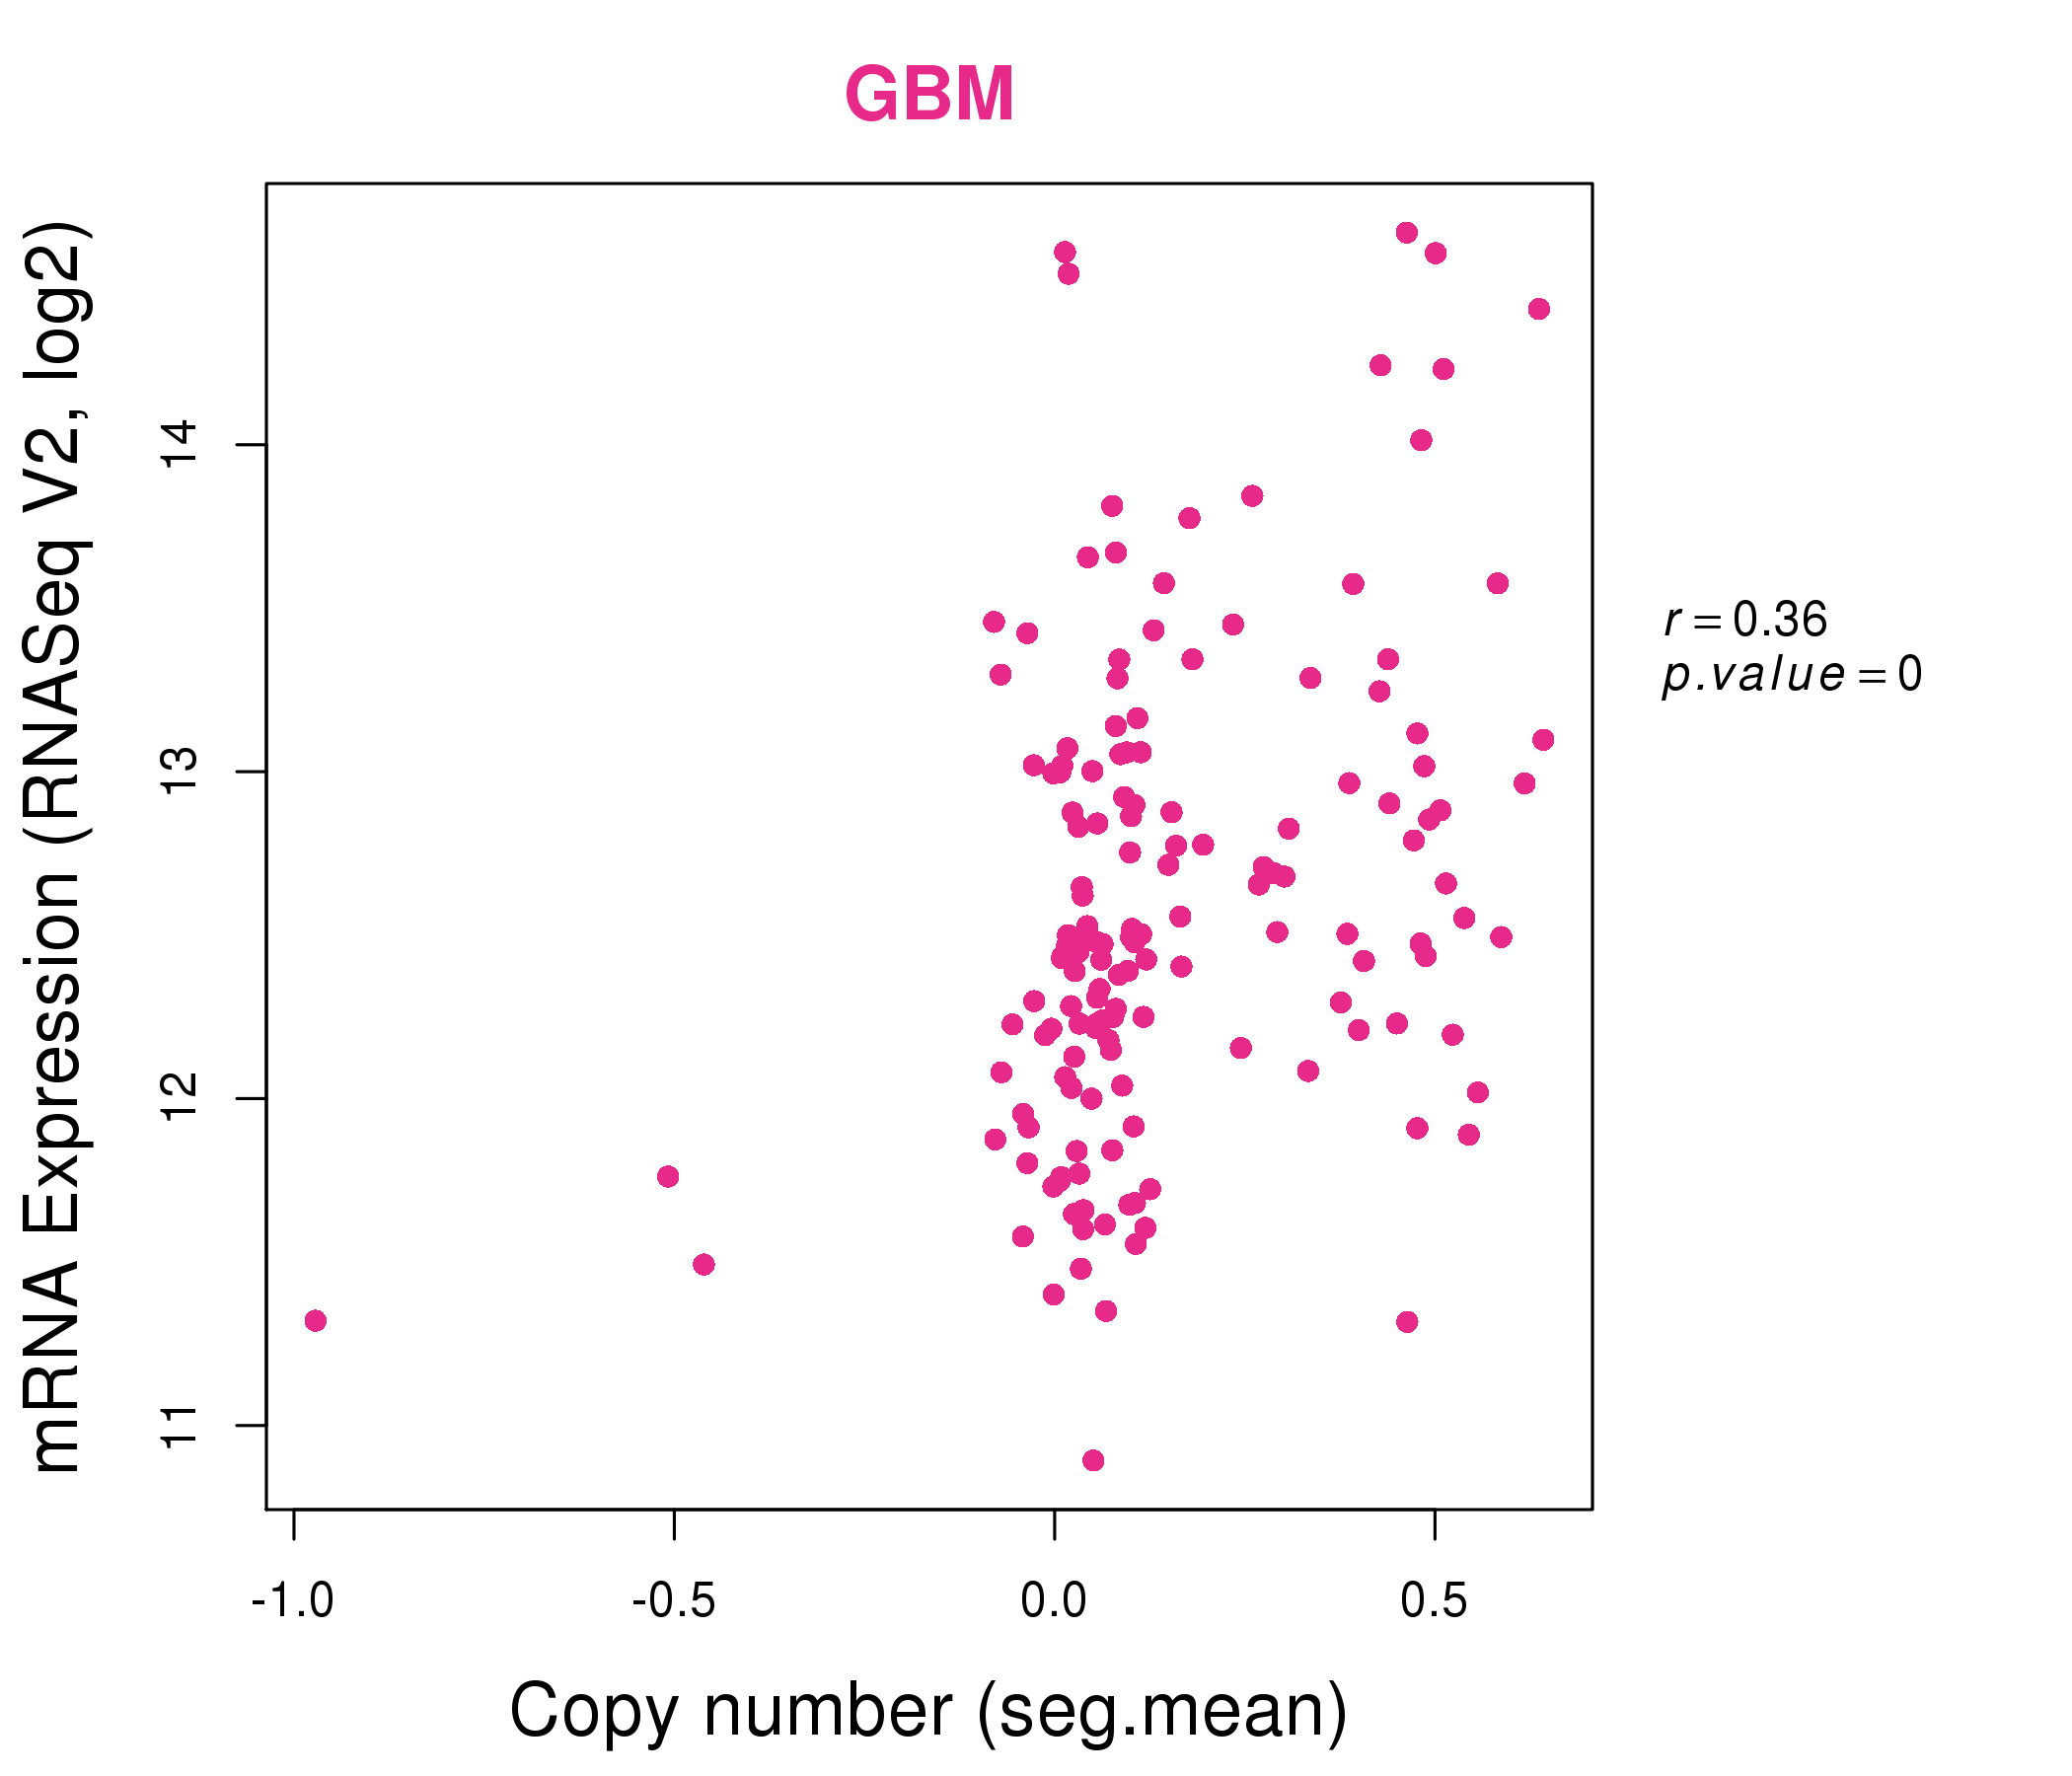
| * Normalized gene expression data of RNASeqV2 was extracted from TCGA using R package TCGA-Assembler. The URLs of all public data files on TCGA DCC data server were gathered at Jan-05-2015. Only eight cancer types have enough normal control samples for differential expression analysis. (t test, adjusted p<0.05 (using Benjamini-Hochberg FDR)) |
 |
| Top |
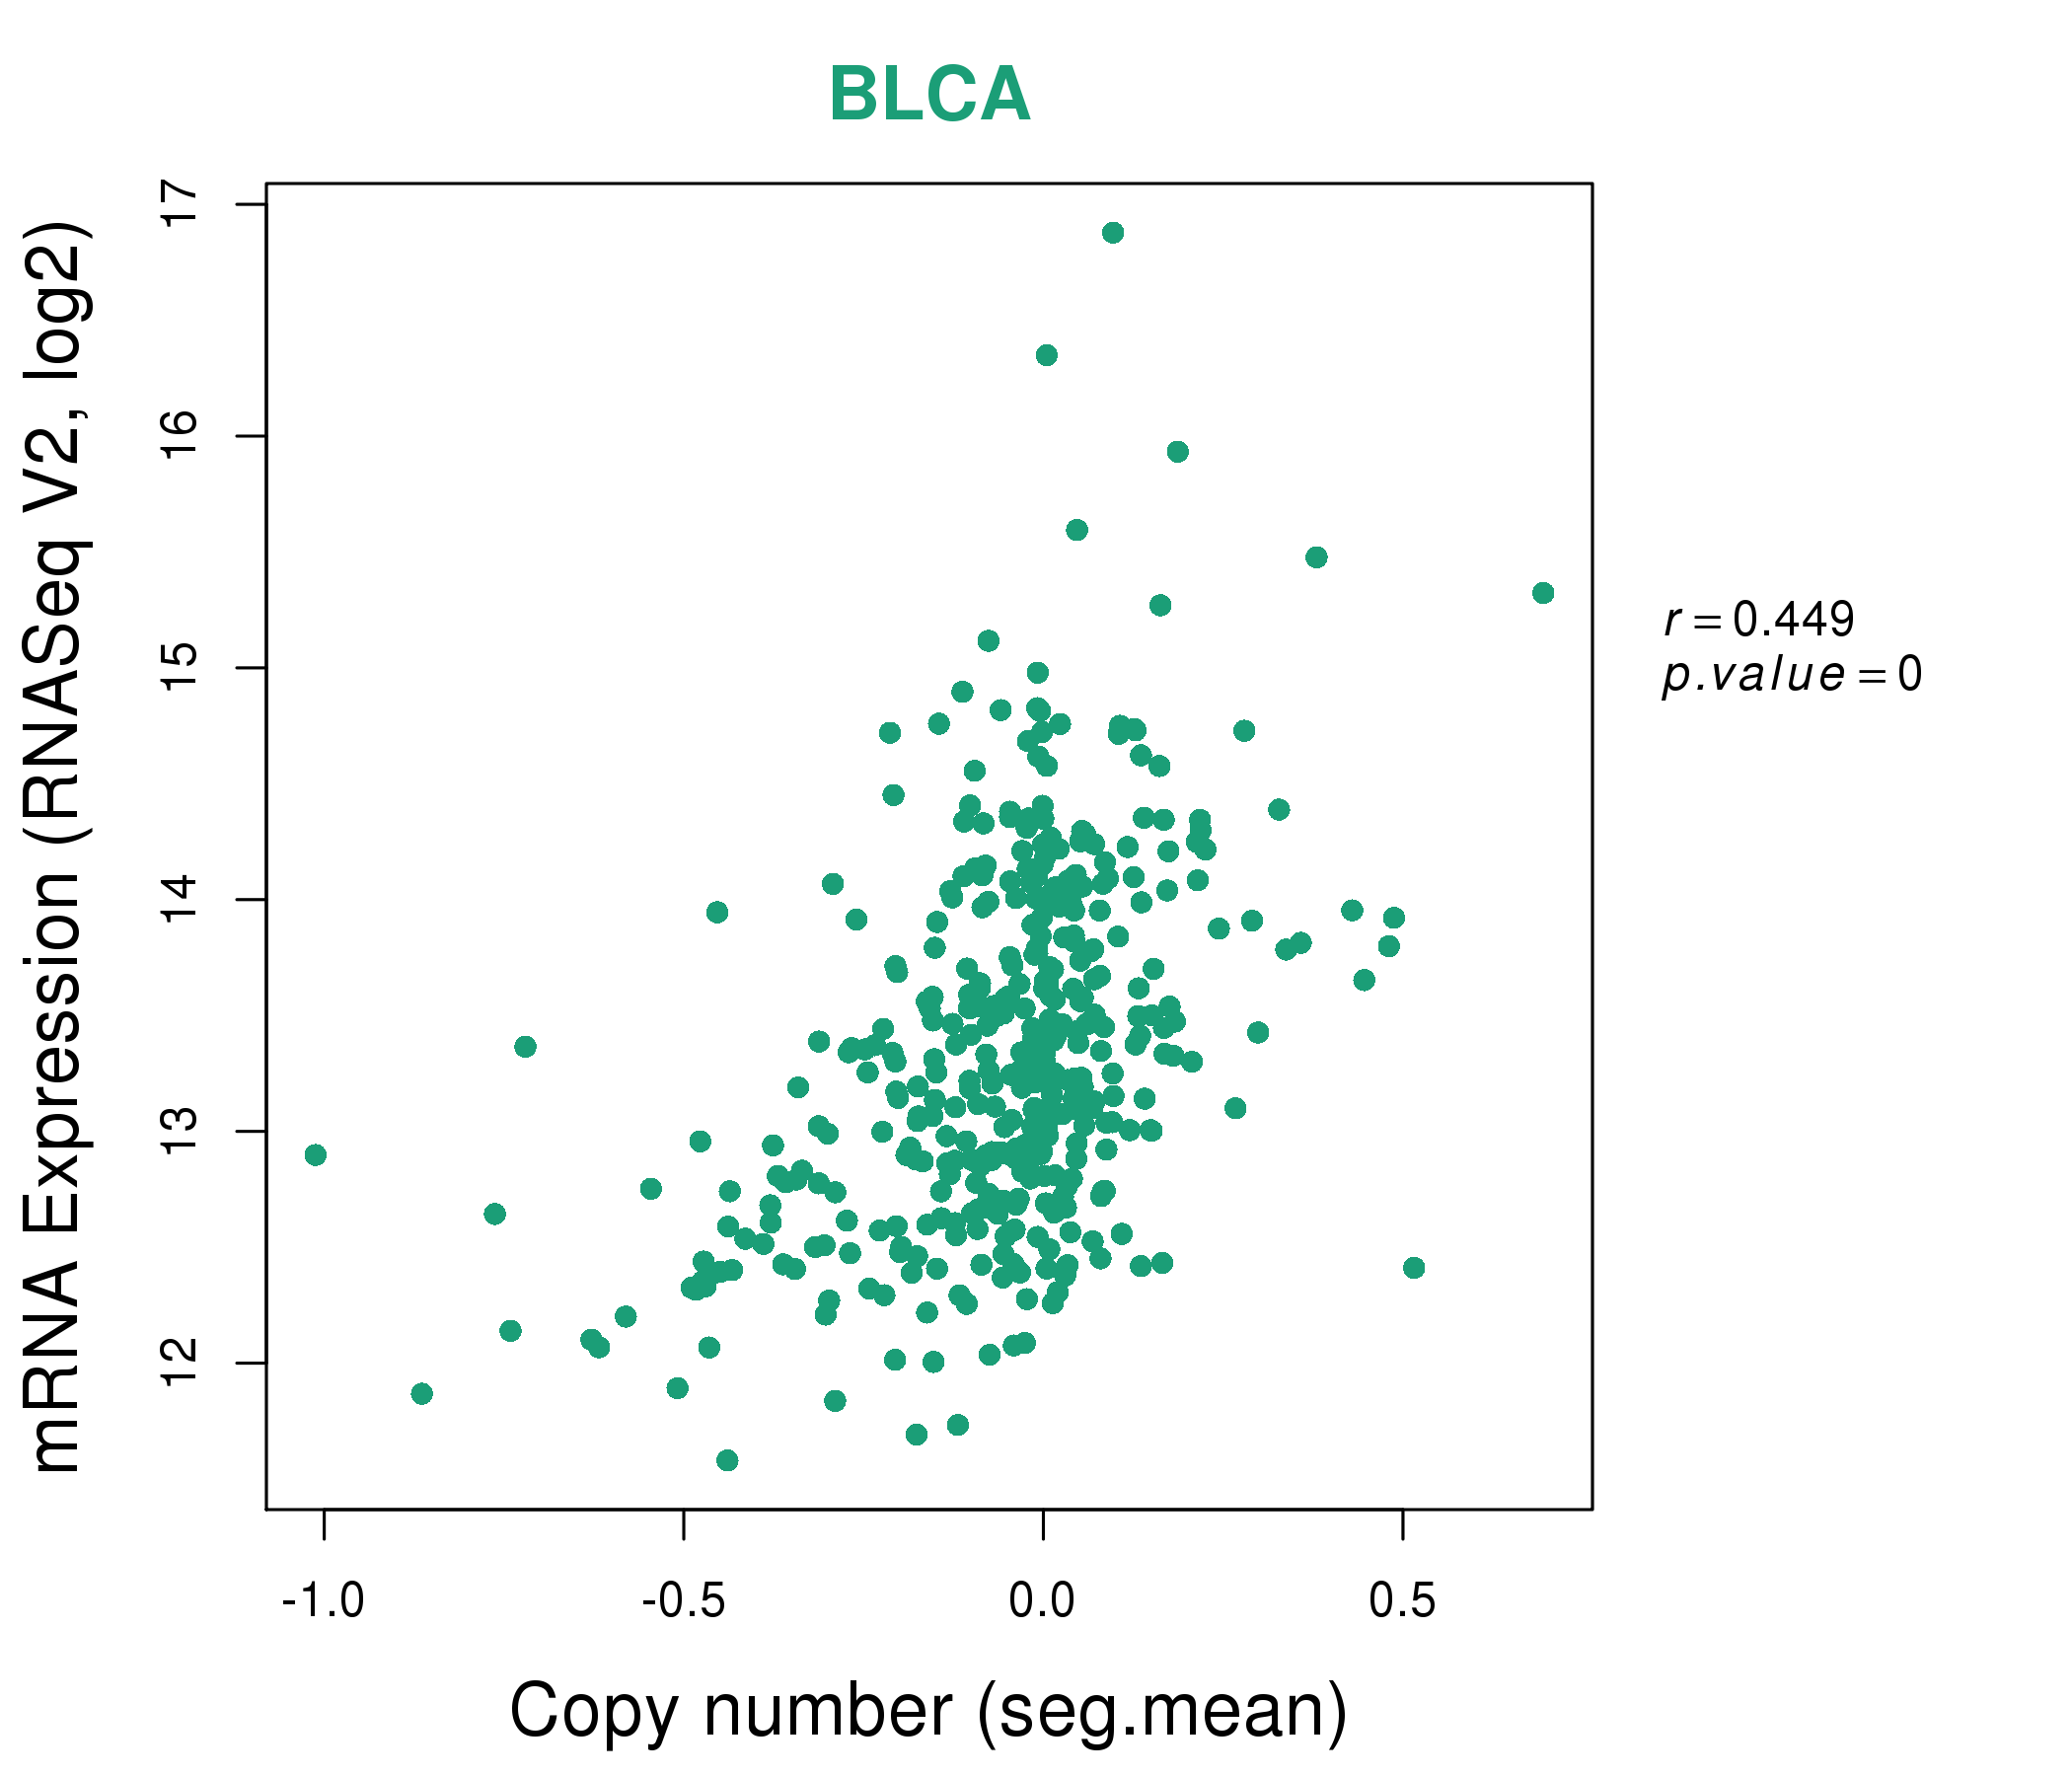
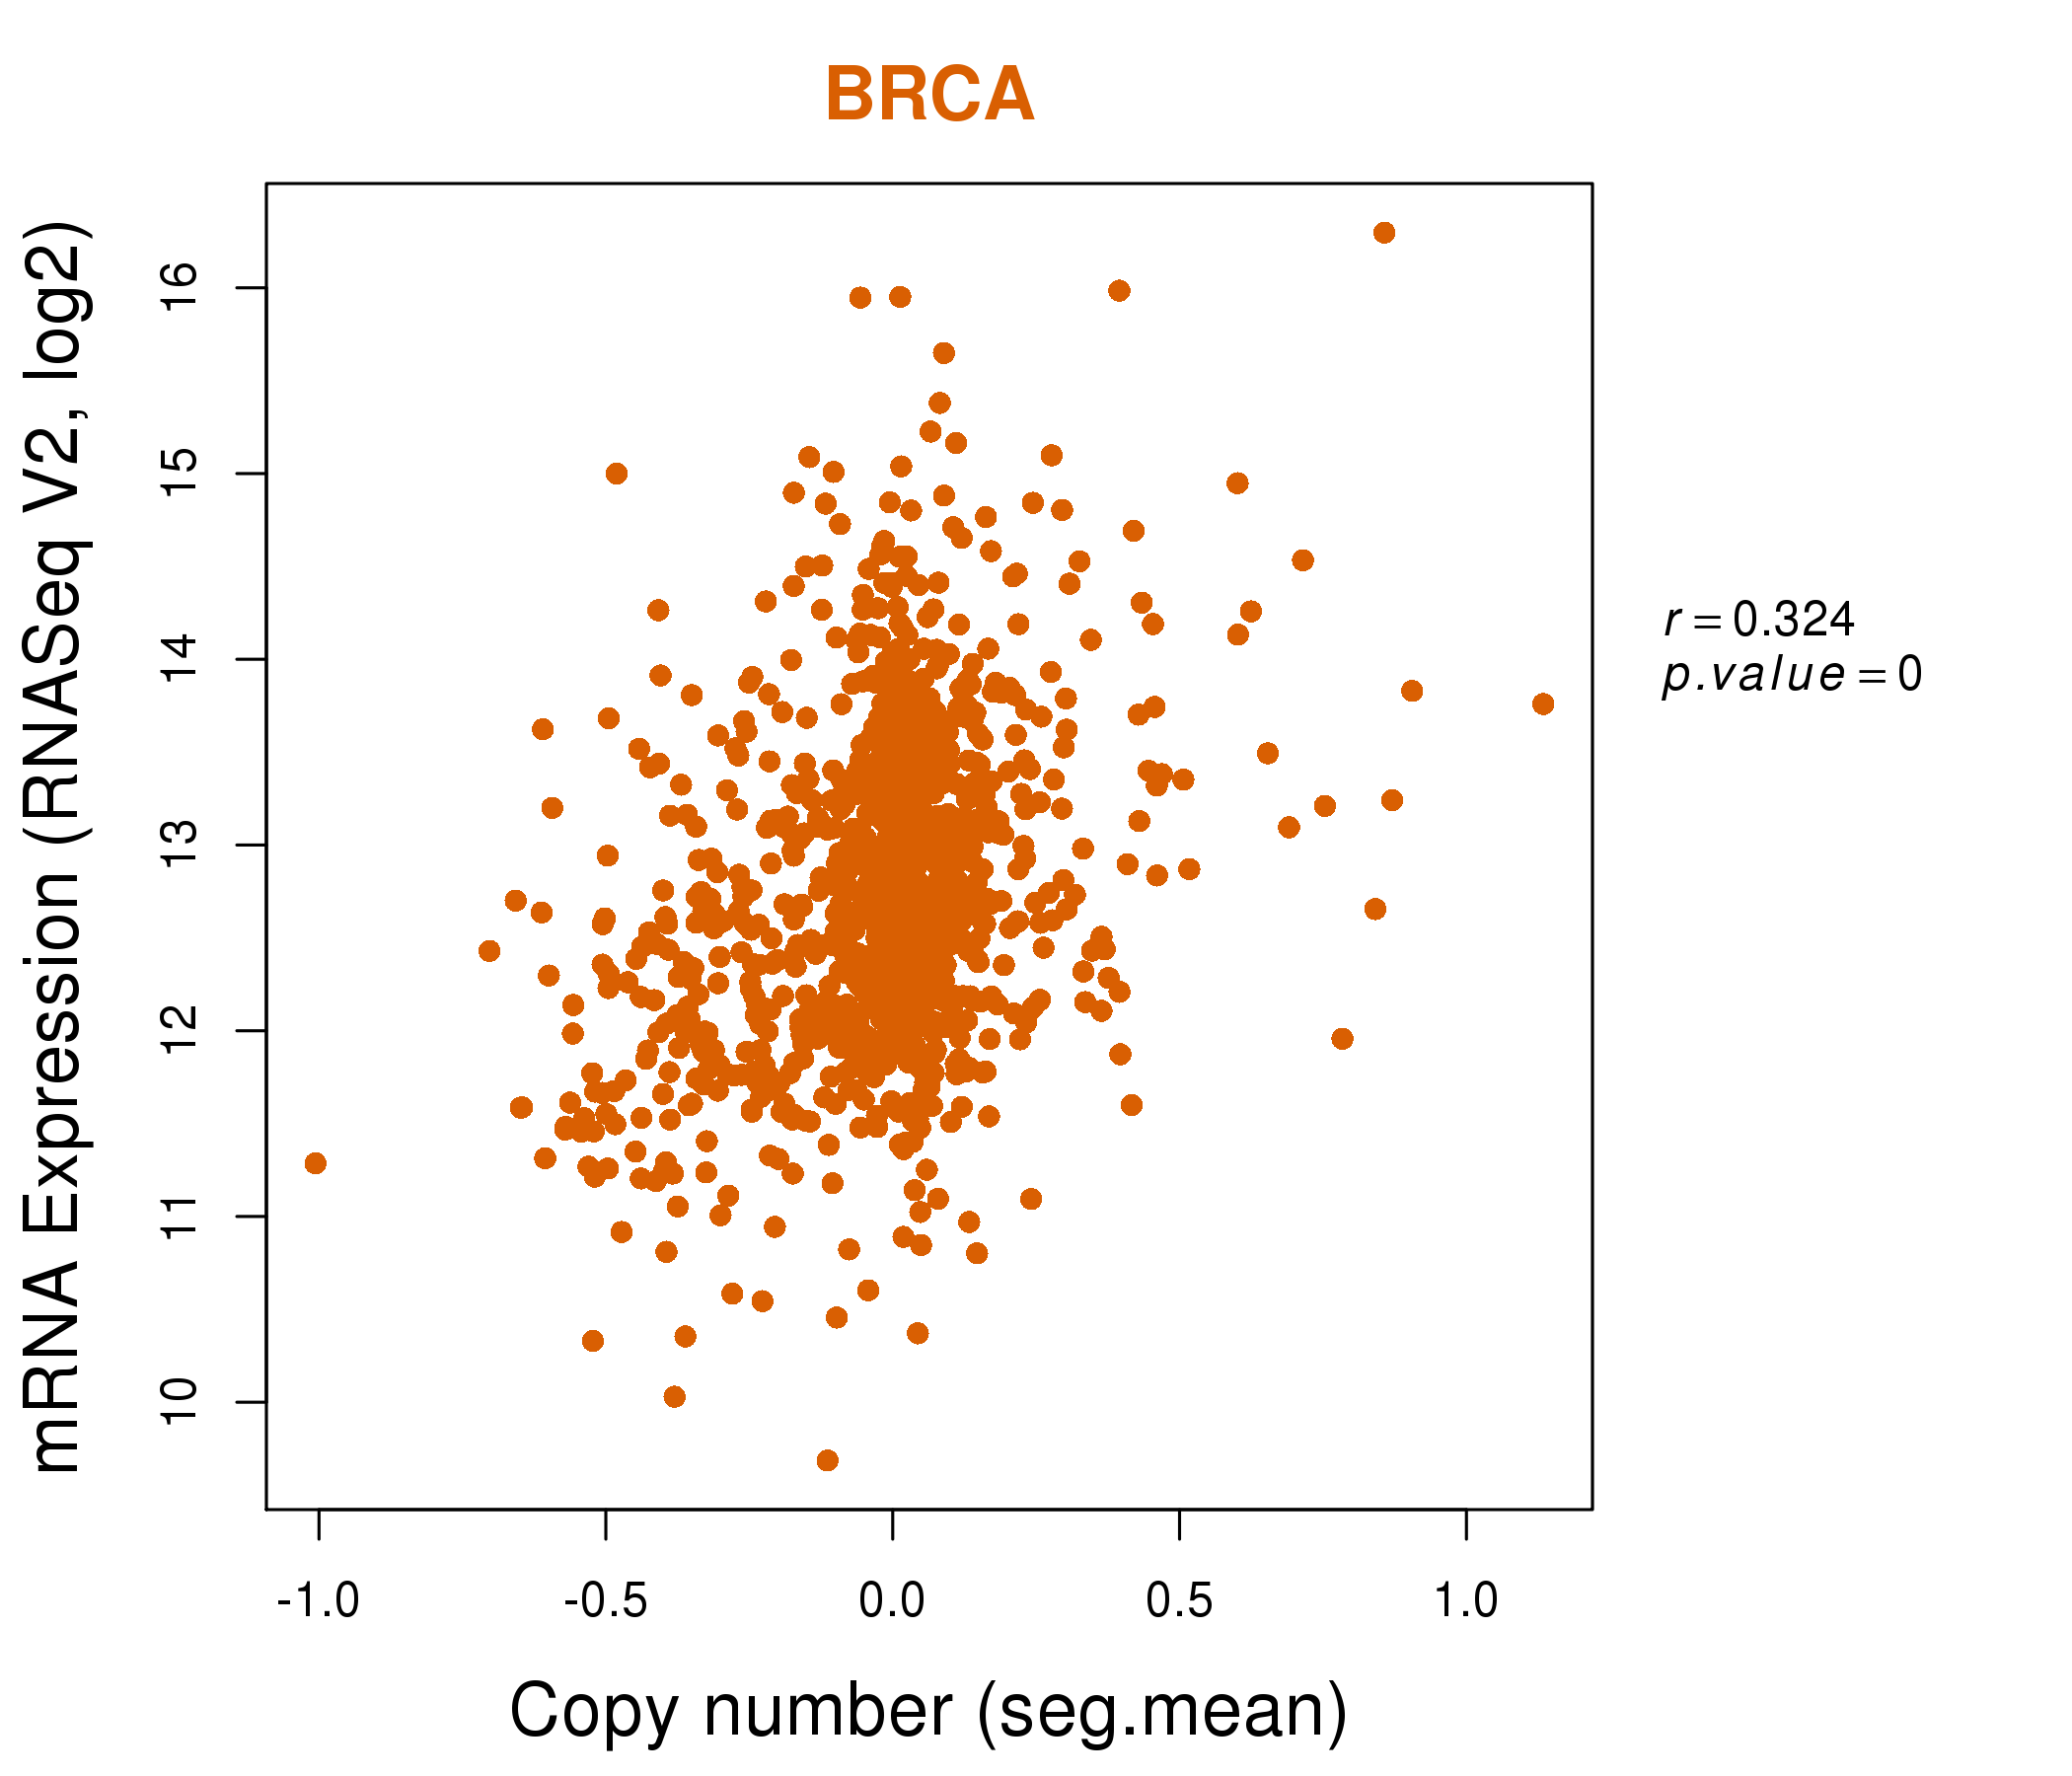
| * This plots show the correlation between CNV and gene expression. |
: Open all plots for all cancer types
 |
|
 |
|
| Top |
| Gene-Gene Network Information |
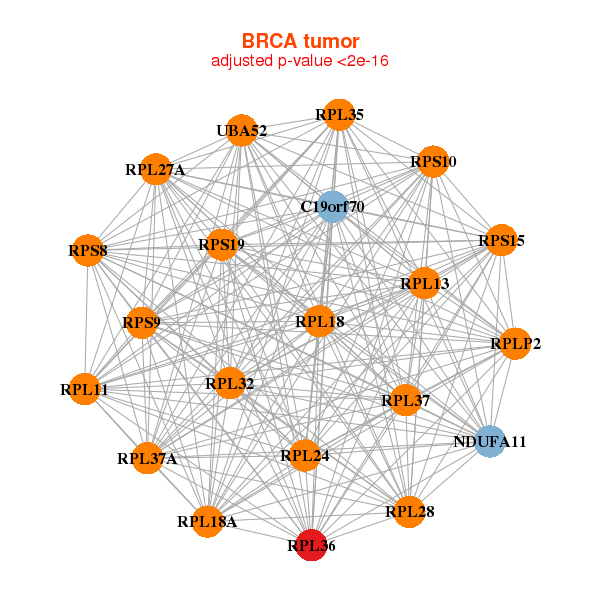
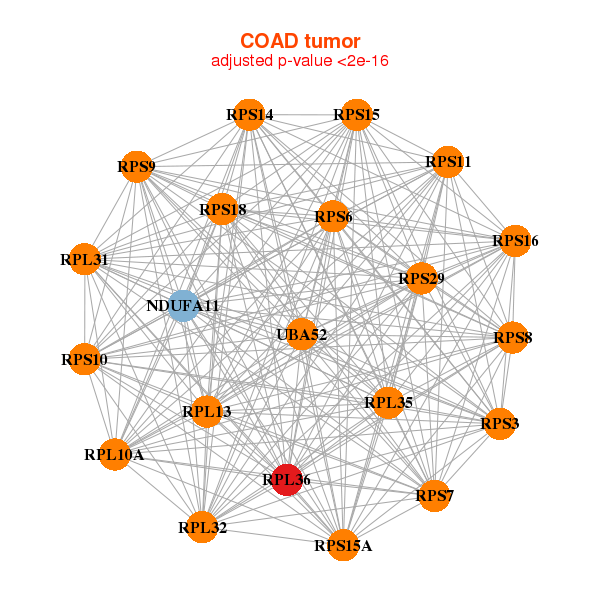
| * Co-Expression network figures were drawn using R package igraph. Only the top 20 genes with the highest correlations were shown. Red circle: input gene, orange circle: cell metabolism gene, sky circle: other gene |
: Open all plots for all cancer types
 |
|
| CDCA3,EIF5AL1,FAM136A,LYAR,MRPL9,NOP2,NPM3, PFDN2,PUS1,RPL35A,RPL36A,RPS24,RPS2,RPS7, SF3B14,SNHG1,SNHG3,SNRPA,TIMM8A,UCK2,UQCRH | AHCY,ZFAS1,FAM83A,GINS2,GNB2L1,IMPDH2,DANCR, NPM1,PRPS2,RPL10A,RPL12,RPL36A,RPS18,RPS24, RPS4X,S100A14,SMPDL3B,NELFCD,TPRXL,TSPAN1,WNT4 |
 |
|
| HIST1H4K,LCE2B,LOC100132247,LOC613037,FTX,OR6N2,OR8B3, POTEE,PPIAL4G,PRAMEF17,PRAMEF3,RPL13AP20,RPL13AP6,RPL21, RPL36A,RPL39,RPS26P11,RPSAP9,SNORA38,SNORD16,SNORD35B, SNORD88C,TBC1 | ATAD5,BLM,BRIP1,RMI2,ZGRF1,CHAF1B,CHEK1, CSTF3,DTL,EHF,FAM111B,GPX2,JAK2,KNTC1, LOC100129066,MCM7,RPL36A,SHCBP1,TIFA,TMEM173,TYMS |
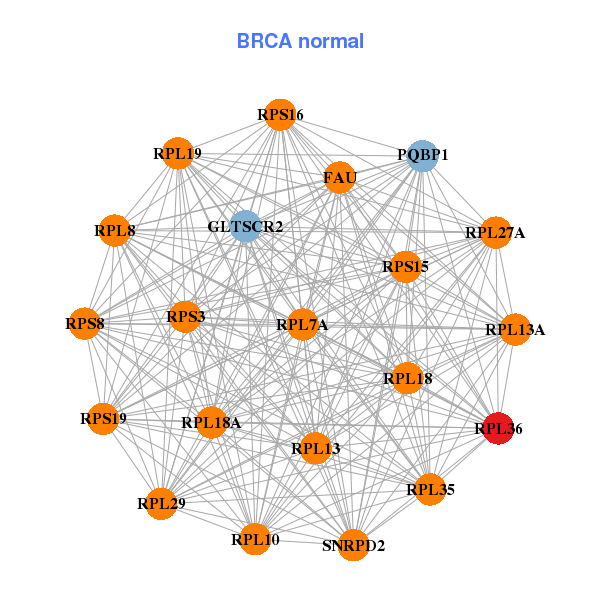
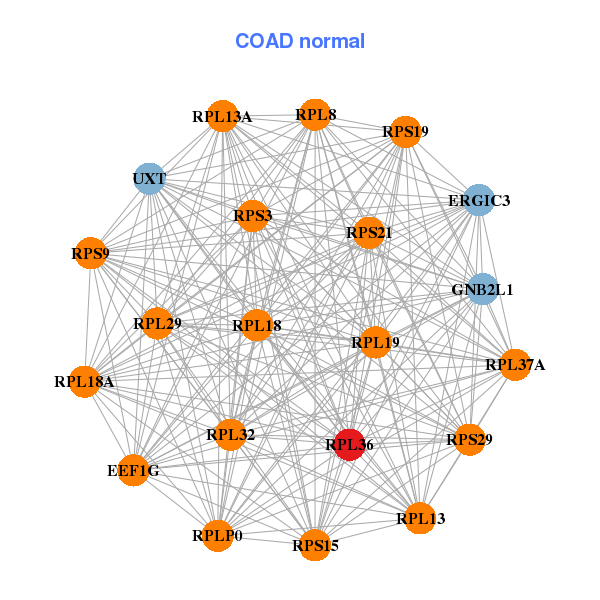
| * Co-Expression network figures were drawn using R package igraph. Only the top 20 genes with the highest correlations were shown. Red circle: input gene, orange circle: cell metabolism gene, sky circle: other gene |
: Open all plots for all cancer types
| Top |
: Open all interacting genes' information including KEGG pathway for all interacting genes from DAVID
| Top |
| Pharmacological Information for RPL36 |
| There's no related Drug. |
| Top |
| Cross referenced IDs for RPL36 |
| * We obtained these cross-references from Uniprot database. It covers 150 different DBs, 18 categories. http://www.uniprot.org/help/cross_references_section |
: Open all cross reference information
|
Copyright © 2016-Present - The Univsersity of Texas Health Science Center at Houston @ |