|
||||||||||||||||||||||||||||||||||||||||||||||||||||||||||||||||||||||||||||||||||||||||||||||||||||||||||||||||||||||||||||||||||||||||||||||||||||||||||||||||||||||||||||||||||||||||||||||||||||||||||||||||||||||||||||||||||||||||||||||||||||||||||||||||||||||||||||||||||||||||||||||||||||||||||||||||||||||||||
| |
| Phenotypic Information (metabolism pathway, cancer, disease, phenome) |
| |
| |
| Gene-Gene Network Information: Co-Expression Network, Interacting Genes & KEGG |
| |
|


| Gene Summary for GALNT2 |
| Basic gene info. | Gene symbol | GALNT2 |
| Gene name | polypeptide N-acetylgalactosaminyltransferase 2 | |
| Synonyms | GalNAc-T2 | |
| Cytomap | UCSC genome browser: 1q41-q42 | |
| Genomic location | chr1 :230202955-230417875 | |
| Type of gene | protein-coding | |
| RefGenes | NM_001291866.1, NM_004481.4,NR_120373.1, | |
| Ensembl id | ENSG00000143641 | |
| Description | UDP-GalNAc:polypeptide N-acetylgalactosaminyltransferase 2UDP-N-acetyl-alpha-D-galactosamine:polypeptide N-acetylgalactosaminyltransferase 2 (GalNAc-T2)polypeptide GalNAc transferase 2pp-GaNTase 2 | |
| Modification date | 20141222 | |
| dbXrefs | MIM : 602274 | |
| HGNC : HGNC | ||
| Ensembl : ENSG00000143641 | ||
| HPRD : 03782 | ||
| Vega : OTTHUMG00000037771 | ||
| Protein | UniProt: go to UniProt's Cross Reference DB Table | |
| Expression | CleanEX: HS_GALNT2 | |
| BioGPS: 2590 | ||
| Gene Expression Atlas: ENSG00000143641 | ||
| The Human Protein Atlas: ENSG00000143641 | ||
| Pathway | NCI Pathway Interaction Database: GALNT2 | |
| KEGG: GALNT2 | ||
| REACTOME: GALNT2 | ||
| ConsensusPathDB | ||
| Pathway Commons: GALNT2 | ||
| Metabolism | MetaCyc: GALNT2 | |
| HUMANCyc: GALNT2 | ||
| Regulation | Ensembl's Regulation: ENSG00000143641 | |
| miRBase: chr1 :230,202,955-230,417,875 | ||
| TargetScan: NM_001291866 | ||
| cisRED: ENSG00000143641 | ||
| Context | iHOP: GALNT2 | |
| cancer metabolism search in PubMed: GALNT2 | ||
| UCL Cancer Institute: GALNT2 | ||
| Assigned class in ccmGDB | C | |
| Top |
| Phenotypic Information for GALNT2(metabolism pathway, cancer, disease, phenome) |
| Cancer | CGAP: GALNT2 |
| Familial Cancer Database: GALNT2 | |
| * This gene is included in those cancer gene databases. |
|
|
|
|
|
| . | ||||||||||||||||||||||||||||||||||||||||||||||||||||||||||||||||||||||||||||||||||||||||||||||||||||||||||||||||||||||||||||||||||||||||||||||||||||||||||||||||||||||||||||||||||||||||||||||||||||||||||||||||||||||||||||||||||||||||||||||||||||||||||||||||||||||||||||||||||||||||||||||||||||||||||||||||||||
Oncogene 1 | Significant driver gene in | |||||||||||||||||||||||||||||||||||||||||||||||||||||||||||||||||||||||||||||||||||||||||||||||||||||||||||||||||||||||||||||||||||||||||||||||||||||||||||||||||||||||||||||||||||||||||||||||||||||||||||||||||||||||||||||||||||||||||||||||||||||||||||||||||||||||||||||||||||||||||||||||||||||||||||||||||||||||||
| cf) number; DB name 1 Oncogene; http://nar.oxfordjournals.org/content/35/suppl_1/D721.long, 2 Tumor Suppressor gene; https://bioinfo.uth.edu/TSGene/, 3 Cancer Gene Census; http://www.nature.com/nrc/journal/v4/n3/abs/nrc1299.html, 4 CancerGenes; http://nar.oxfordjournals.org/content/35/suppl_1/D721.long, 5 Network of Cancer Gene; http://ncg.kcl.ac.uk/index.php, 1Therapeutic Vulnerabilities in Cancer; http://cbio.mskcc.org/cancergenomics/statius/ |
| REACTOME_METABOLISM_OF_PROTEINS | |
| OMIM | |
| Orphanet | |
| Disease | KEGG Disease: GALNT2 |
| MedGen: GALNT2 (Human Medical Genetics with Condition) | |
| ClinVar: GALNT2 | |
| Phenotype | MGI: GALNT2 (International Mouse Phenotyping Consortium) |
| PhenomicDB: GALNT2 | |
| Mutations for GALNT2 |
| * Under tables are showing count per each tissue to give us broad intuition about tissue specific mutation patterns.You can go to the detailed page for each mutation database's web site. |
| There's no structural variation information in COSMIC data for this gene. |
| * From mRNA Sanger sequences, Chitars2.0 arranged chimeric transcripts. This table shows GALNT2 related fusion information. |
| ID | Head Gene | Tail Gene | Accession | Gene_a | qStart_a | qEnd_a | Chromosome_a | tStart_a | tEnd_a | Gene_a | qStart_a | qEnd_a | Chromosome_a | tStart_a | tEnd_a |
| BJ995070 | ZNF664 | 1 | 98 | 12 | 124457788 | 124458467 | GALNT2 | 92 | 600 | 1 | 230416045 | 230416553 | |
| AW015340 | GALNT2 | 11 | 252 | 1 | 230301660 | 230301899 | AUTS2 | 243 | 331 | 7 | 69722942 | 69723030 | |
| AW992137 | GALNT2 | 1 | 77 | 1 | 230272431 | 230272507 | GALNT2 | 76 | 328 | 1 | 230305798 | 230306050 | |
| AF130059 | SMOC1 | 15 | 330 | 14 | 70351984 | 70352299 | GALNT2 | 322 | 691 | 1 | 230415455 | 230415823 | |
| BG985354 | GALNT2 | 27 | 300 | 1 | 230258147 | 230258423 | BRD9 | 293 | 507 | 5 | 882190 | 882404 | |
| BQ335474 | GALNT2 | 10 | 280 | 1 | 230398716 | 230410299 | MEMO1 | 274 | 330 | 2 | 32217481 | 32217537 | |
| Top |
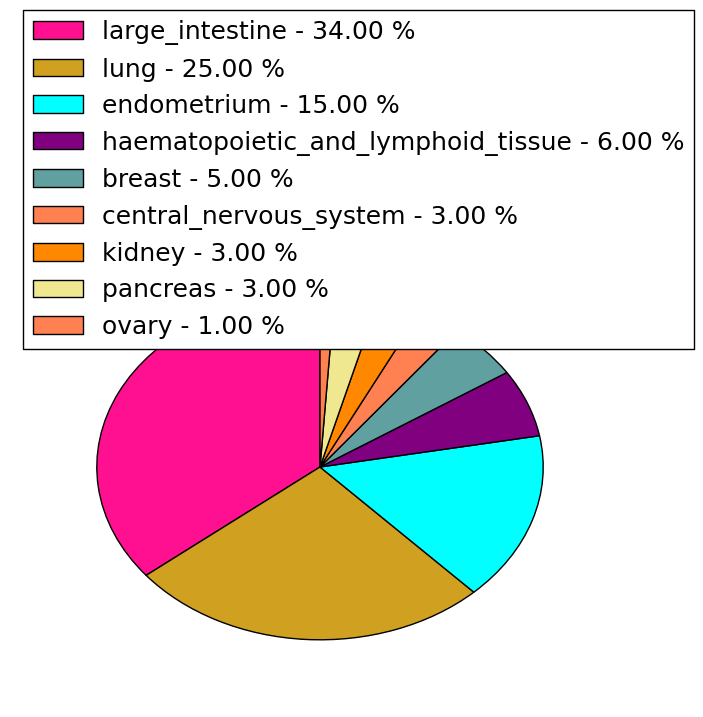
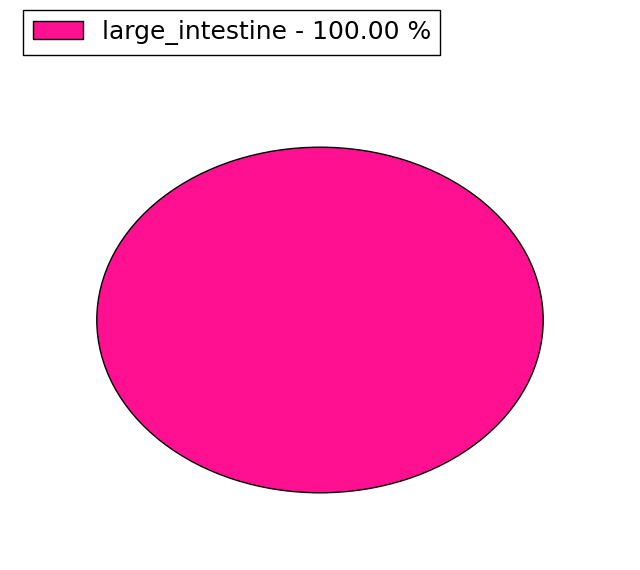
| Mutation type/ Tissue ID | brca | cns | cerv | endome | haematopo | kidn | Lintest | liver | lung | ns | ovary | pancre | prost | skin | stoma | thyro | urina | |||
| Total # sample | 3 | 1 | 1 | 2 | 1 | 1 | 2 | 2 | 3 | |||||||||||
| GAIN (# sample) | 2 | 1 | 1 | 1 | 1 | 2 | 1 | 3 | ||||||||||||
| LOSS (# sample) | 1 | 1 | 1 | 1 |
| cf) Tissue ID; Tissue type (1; Breast, 2; Central_nervous_system, 3; Cervix, 4; Endometrium, 5; Haematopoietic_and_lymphoid_tissue, 6; Kidney, 7; Large_intestine, 8; Liver, 9; Lung, 10; NS, 11; Ovary, 12; Pancreas, 13; Prostate, 14; Skin, 15; Stomach, 16; Thyroid, 17; Urinary_tract) |
| Top |
|
 |
| Top |
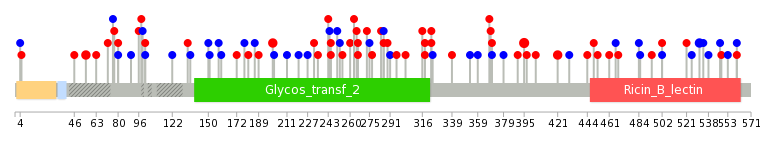
| Stat. for Non-Synonymous SNVs (# total SNVs=58) | (# total SNVs=30) |
 |  |
(# total SNVs=1) | (# total SNVs=0) |
 |
| Top |
| * When you move the cursor on each content, you can see more deailed mutation information on the Tooltip. Those are primary_site,primary_histology,mutation(aa),pubmedID. |
| GRCh37 position | Mutation(aa) | Unique sampleID count |
| chr1:230372444-230372444 | p.R194* | 3 |
| chr1:230398367-230398367 | p.F395L | 3 |
| chr1:230338999-230338999 | p.R113* | 2 |
| chr1:230401027-230401027 | p.Q452* | 2 |
| chr1:230372463-230372463 | p.R200Q | 2 |
| chr1:230386265-230386265 | p.K323R | 2 |
| chr1:230314000-230314000 | p.D55H | 2 |
| chr1:230415081-230415081 | p.L531L | 2 |
| chr1:230398658-230398658 | p.? | 2 |
| chr1:230398700-230398700 | p.L421P | 2 |
| Top |
|
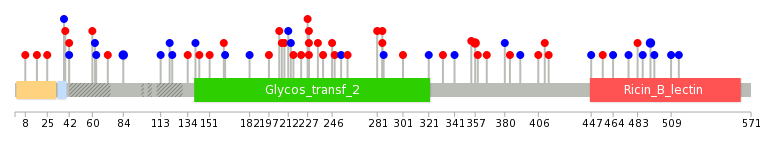 |
| Point Mutation/ Tissue ID | 1 | 2 | 3 | 4 | 5 | 6 | 7 | 8 | 9 | 10 | 11 | 12 | 13 | 14 | 15 | 16 | 17 | 18 | 19 | 20 |
| # sample | 3 | 4 | 1 | 12 | 1 | 4 | 2 | 2 | 1 | 13 | 1 | 2 | 1 | 5 | 3 | 10 | ||||
| # mutation | 3 | 4 | 1 | 13 | 1 | 4 | 2 | 2 | 1 | 13 | 1 | 2 | 1 | 5 | 3 | 13 | ||||
| nonsynonymous SNV | 2 | 1 | 10 | 1 | 3 | 1 | 1 | 6 | 1 | 1 | 3 | 3 | 8 | |||||||
| synonymous SNV | 1 | 3 | 1 | 3 | 1 | 2 | 1 | 7 | 1 | 1 | 2 | 5 |
| cf) Tissue ID; Tissue type (1; BLCA[Bladder Urothelial Carcinoma], 2; BRCA[Breast invasive carcinoma], 3; CESC[Cervical squamous cell carcinoma and endocervical adenocarcinoma], 4; COAD[Colon adenocarcinoma], 5; GBM[Glioblastoma multiforme], 6; Glioma Low Grade, 7; HNSC[Head and Neck squamous cell carcinoma], 8; KICH[Kidney Chromophobe], 9; KIRC[Kidney renal clear cell carcinoma], 10; KIRP[Kidney renal papillary cell carcinoma], 11; LAML[Acute Myeloid Leukemia], 12; LUAD[Lung adenocarcinoma], 13; LUSC[Lung squamous cell carcinoma], 14; OV[Ovarian serous cystadenocarcinoma ], 15; PAAD[Pancreatic adenocarcinoma], 16; PRAD[Prostate adenocarcinoma], 17; SKCM[Skin Cutaneous Melanoma], 18:STAD[Stomach adenocarcinoma], 19:THCA[Thyroid carcinoma], 20:UCEC[Uterine Corpus Endometrial Carcinoma]) |
| Top |
| * We represented just top 10 SNVs. When you move the cursor on each content, you can see more deailed mutation information on the Tooltip. Those are primary_site, primary_histology, mutation(aa), pubmedID. |
| Genomic Position | Mutation(aa) | Unique sampleID count |
| chr1:230386265 | p.R84R,GALNT2 | 2 |
| chr1:230415081 | p.L493L,GALNT2 | 2 |
| chr1:230381875 | p.A228T,GALNT2 | 2 |
| chr1:230339028 | p.F357L,GALNT2 | 2 |
| chr1:230398367 | p.K285R,GALNT2 | 2 |
| chr1:230398692 | p.I214I,GALNT2 | 1 |
| chr1:230372430 | p.H321H,GALNT2 | 1 |
| chr1:230415063 | p.R476R,GALNT2 | 1 |
| chr1:230381858 | p.D216N,GALNT2 | 1 |
| chr1:230338962 | p.P332L,GALNT2 | 1 |
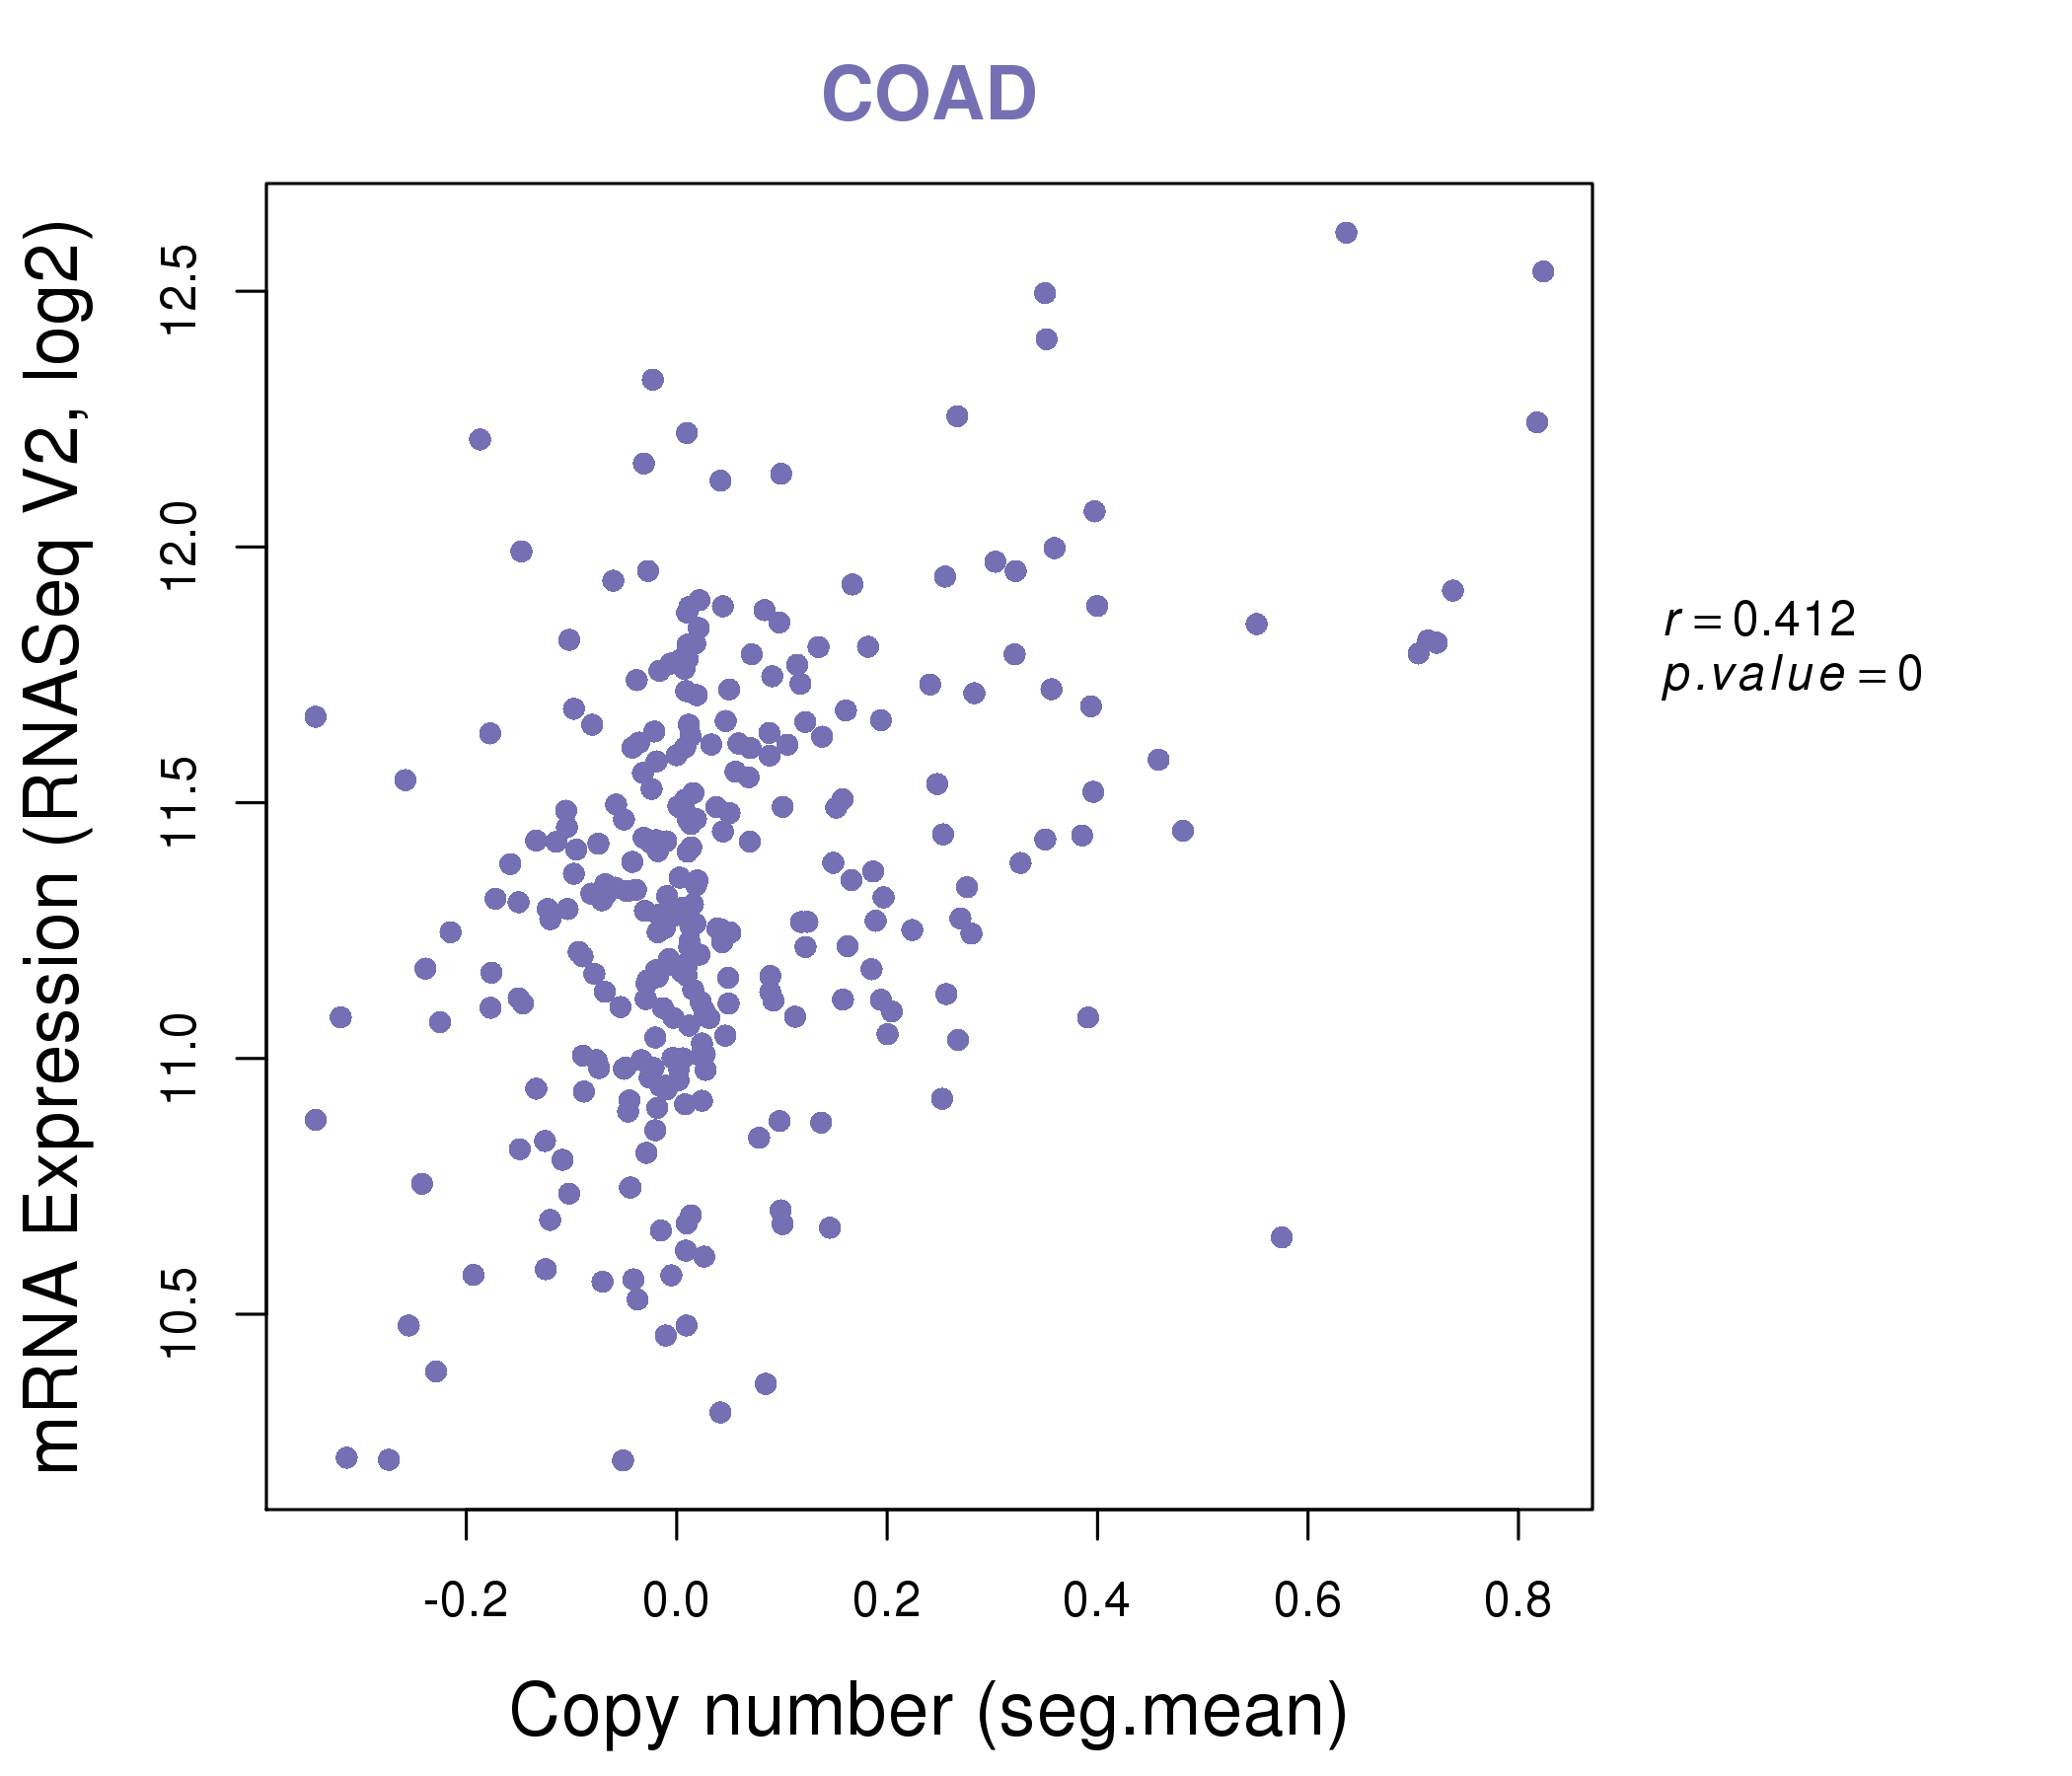
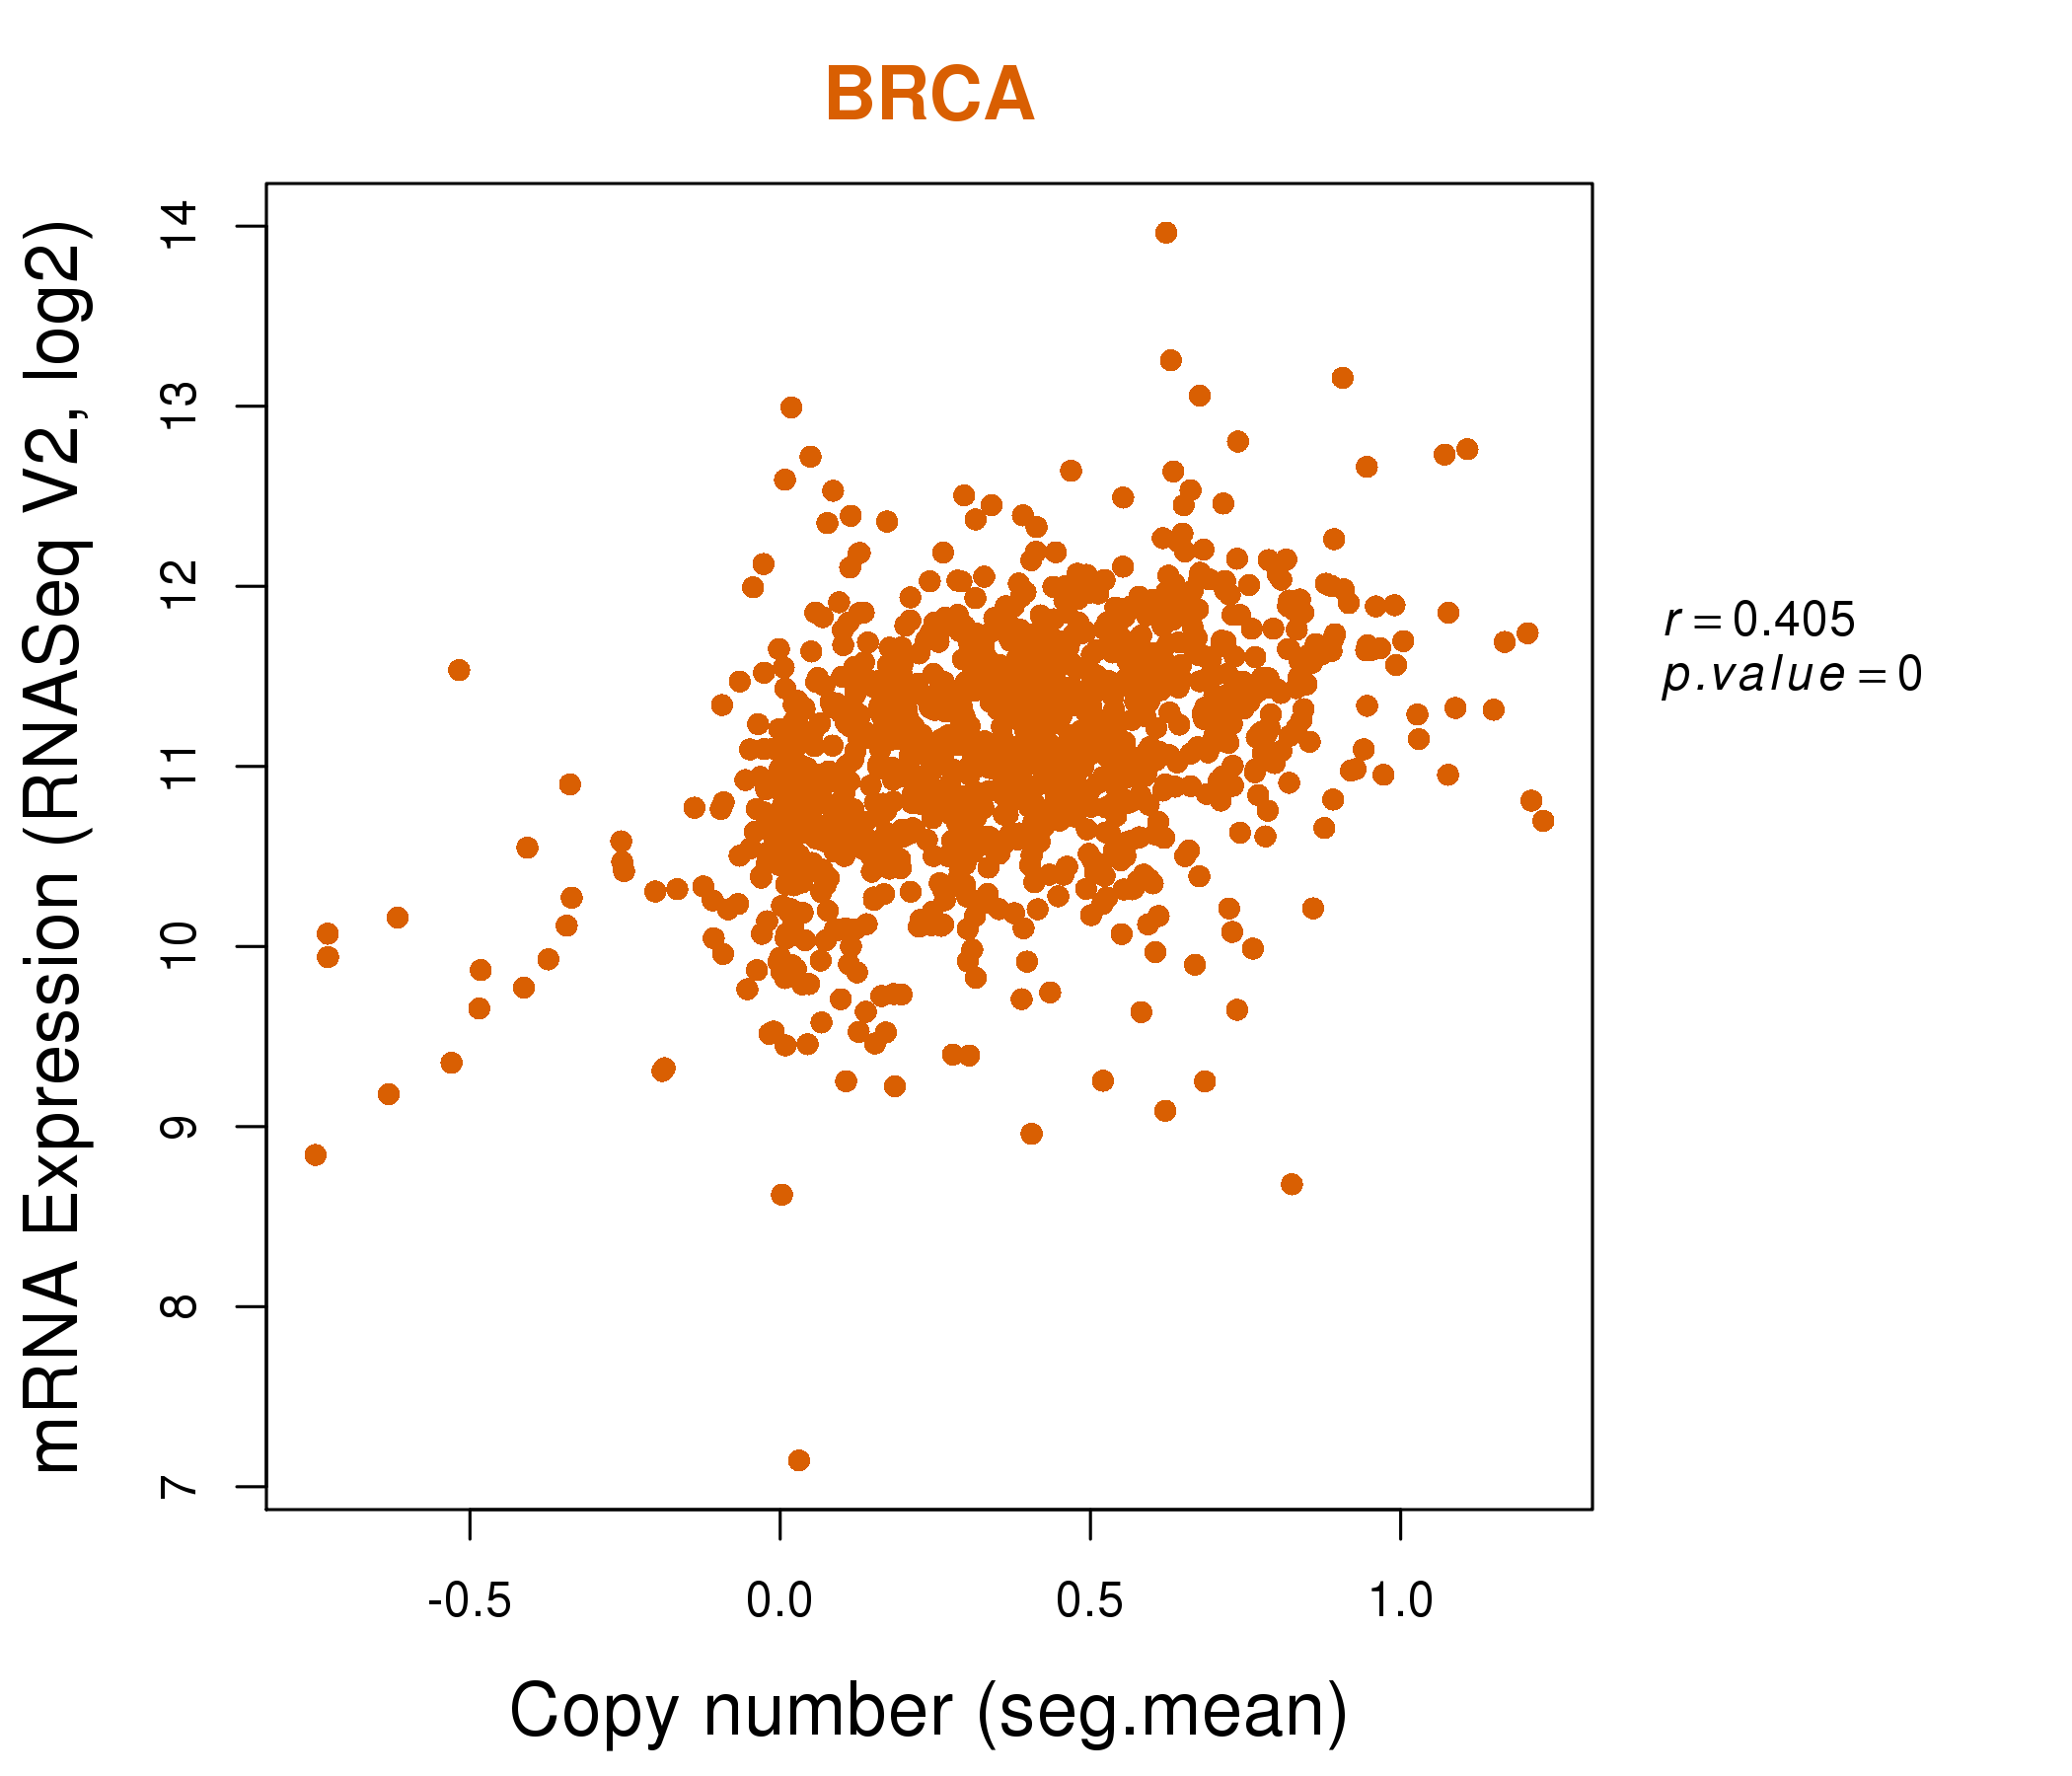
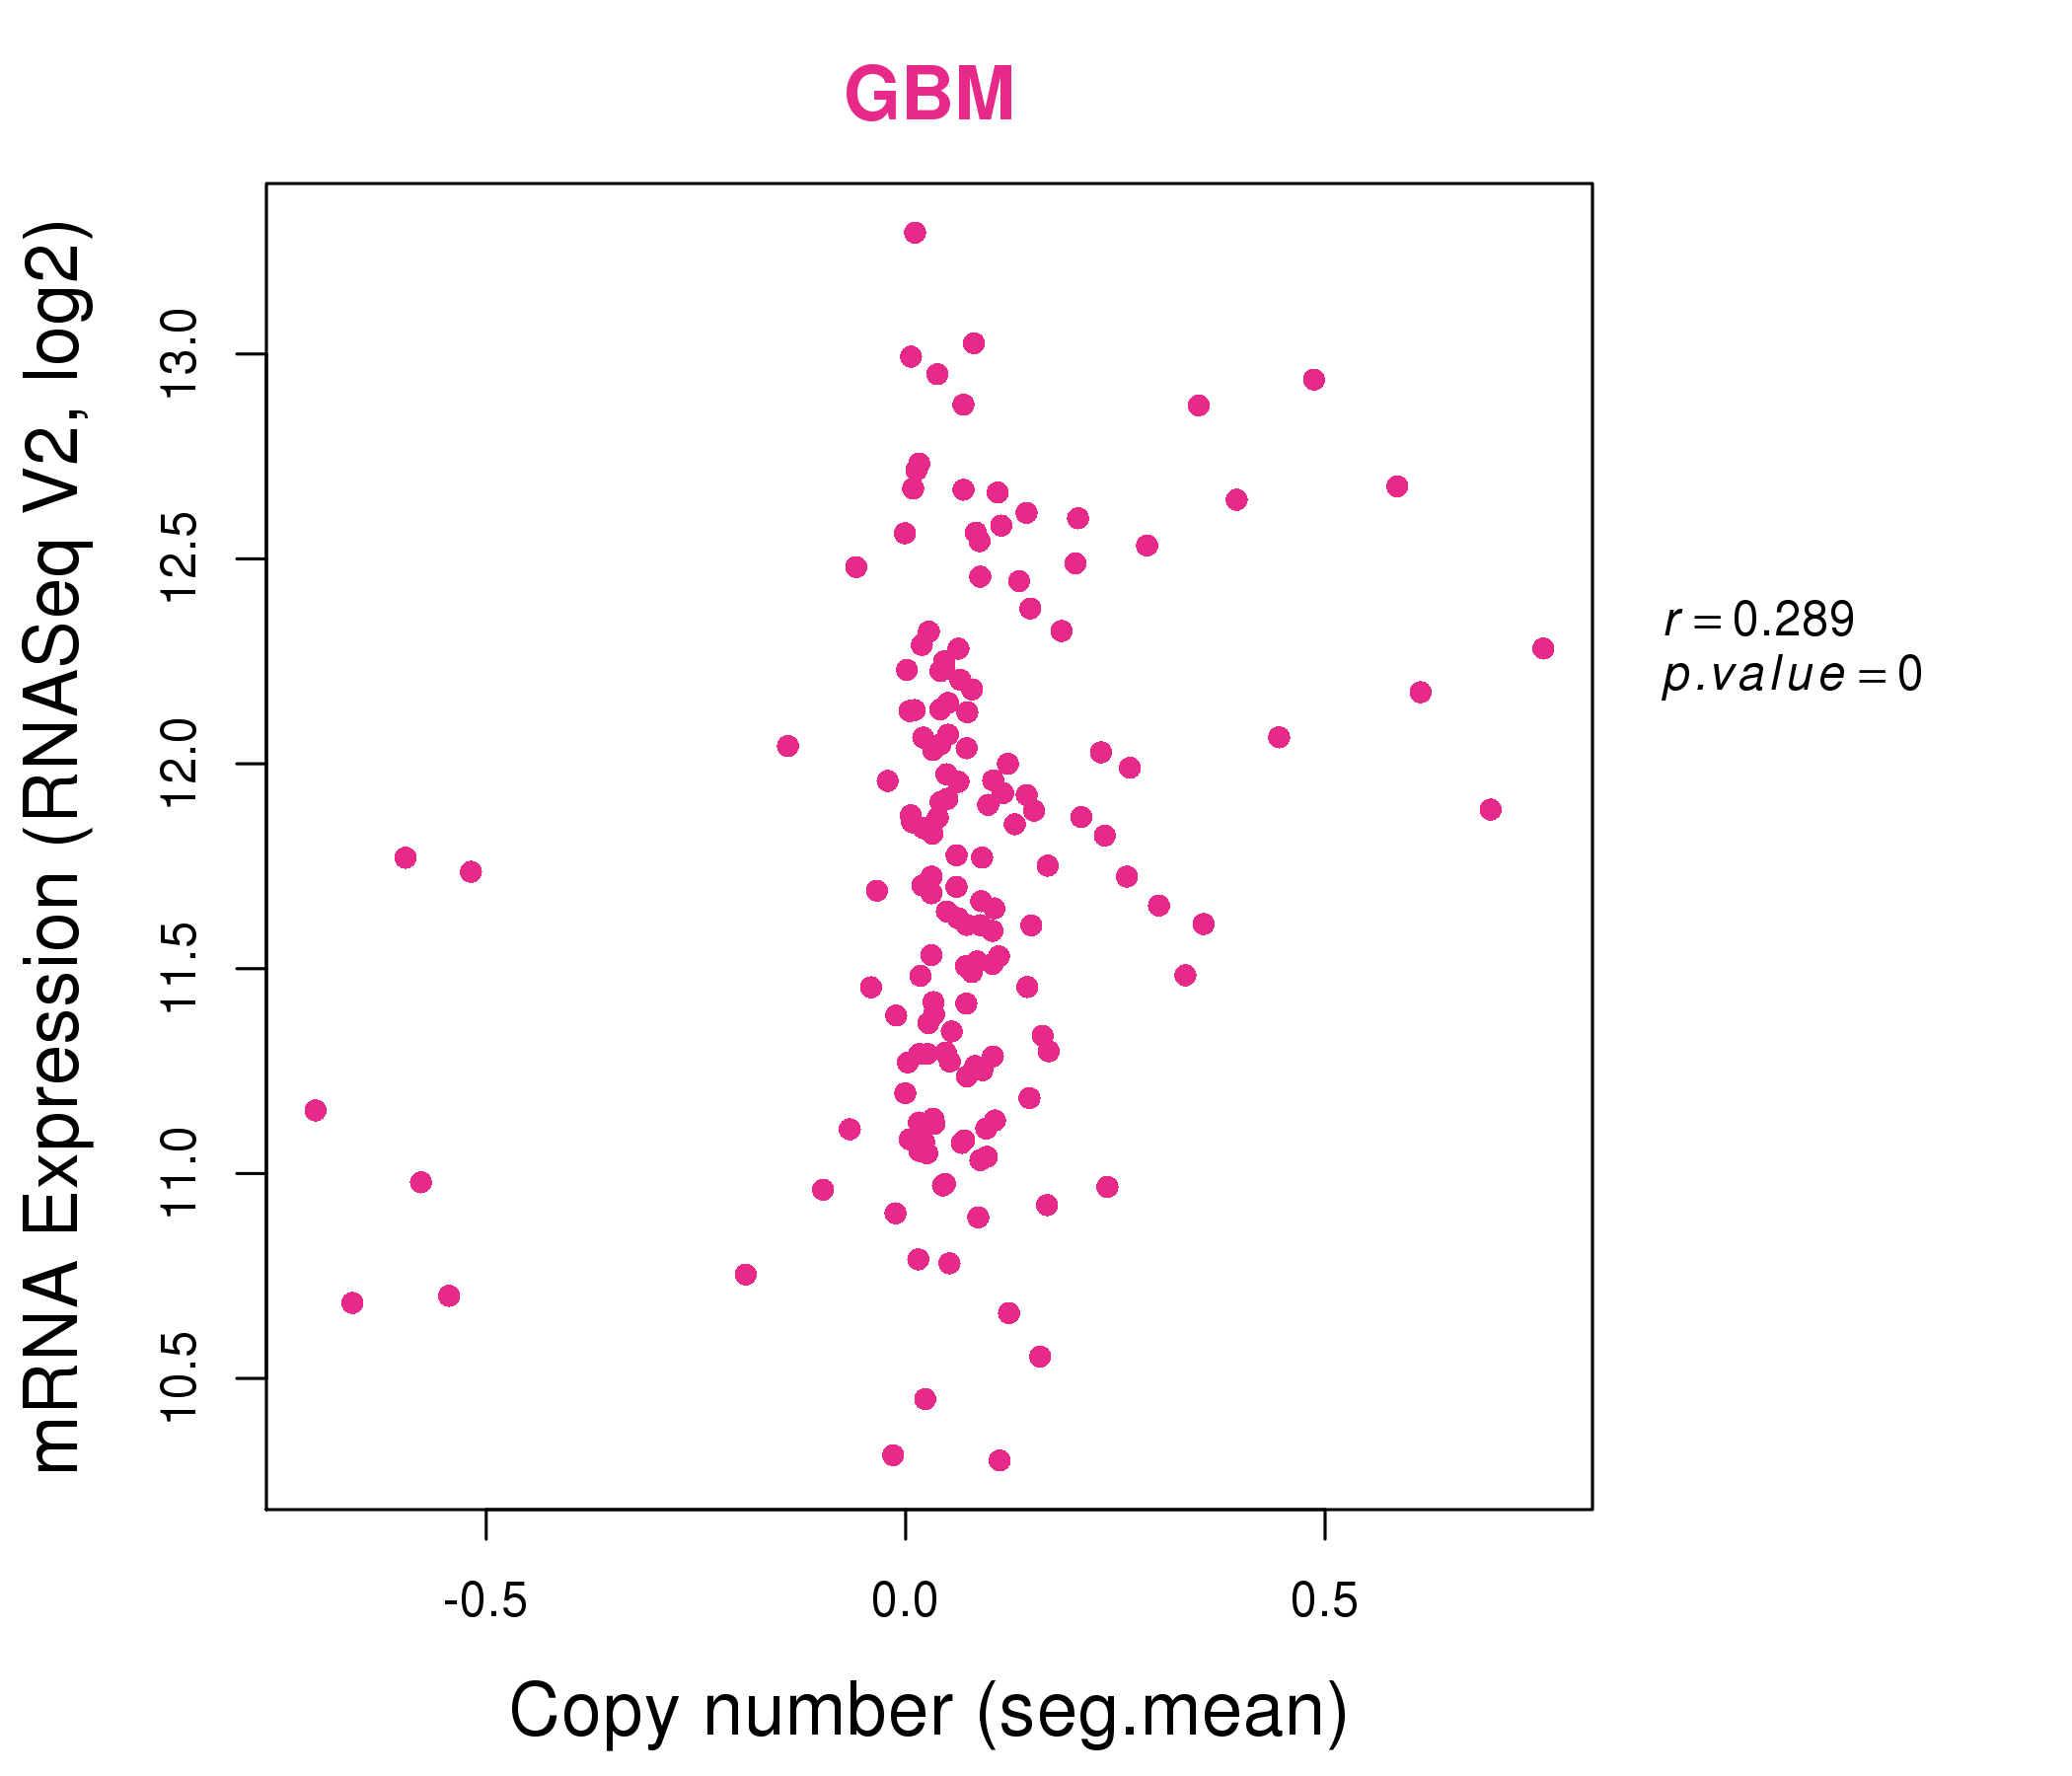
| * Copy number data were extracted from TCGA using R package TCGA-Assembler. The URLs of all public data files on TCGA DCC data server were gathered on Jan-05-2015. Function ProcessCNAData in TCGA-Assembler package was used to obtain gene-level copy number value which is calculated as the average copy number of the genomic region of a gene. |
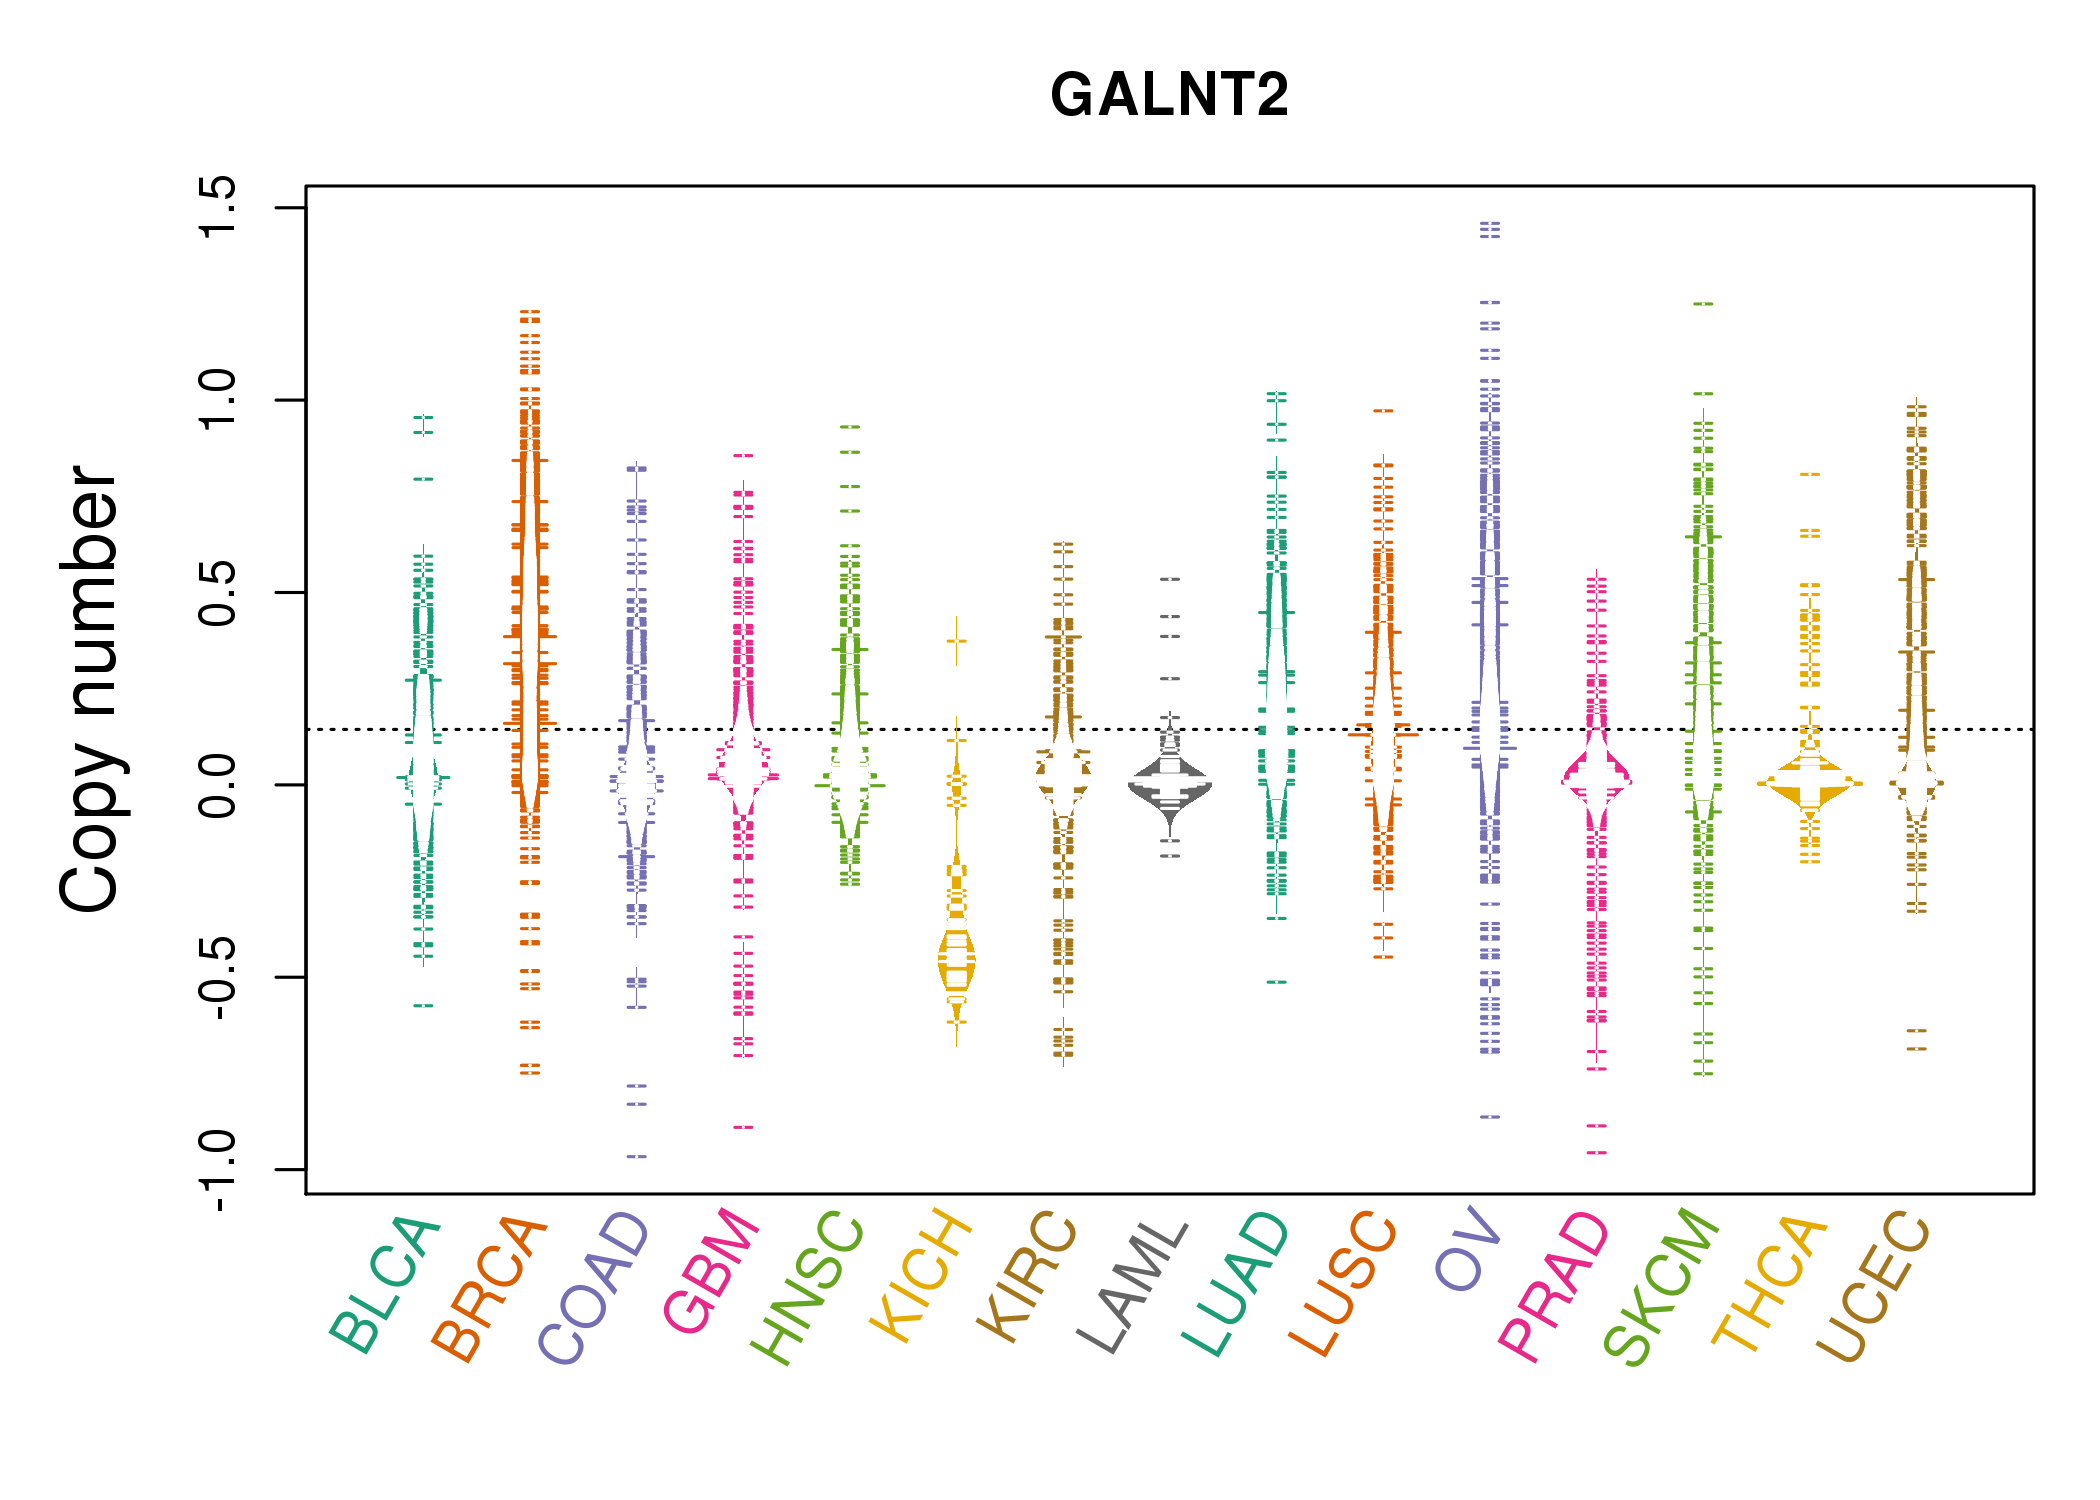 |
| cf) Tissue ID[Tissue type]: BLCA[Bladder Urothelial Carcinoma], BRCA[Breast invasive carcinoma], CESC[Cervical squamous cell carcinoma and endocervical adenocarcinoma], COAD[Colon adenocarcinoma], GBM[Glioblastoma multiforme], Glioma Low Grade, HNSC[Head and Neck squamous cell carcinoma], KICH[Kidney Chromophobe], KIRC[Kidney renal clear cell carcinoma], KIRP[Kidney renal papillary cell carcinoma], LAML[Acute Myeloid Leukemia], LUAD[Lung adenocarcinoma], LUSC[Lung squamous cell carcinoma], OV[Ovarian serous cystadenocarcinoma ], PAAD[Pancreatic adenocarcinoma], PRAD[Prostate adenocarcinoma], SKCM[Skin Cutaneous Melanoma], STAD[Stomach adenocarcinoma], THCA[Thyroid carcinoma], UCEC[Uterine Corpus Endometrial Carcinoma] |
| Top |
| Gene Expression for GALNT2 |
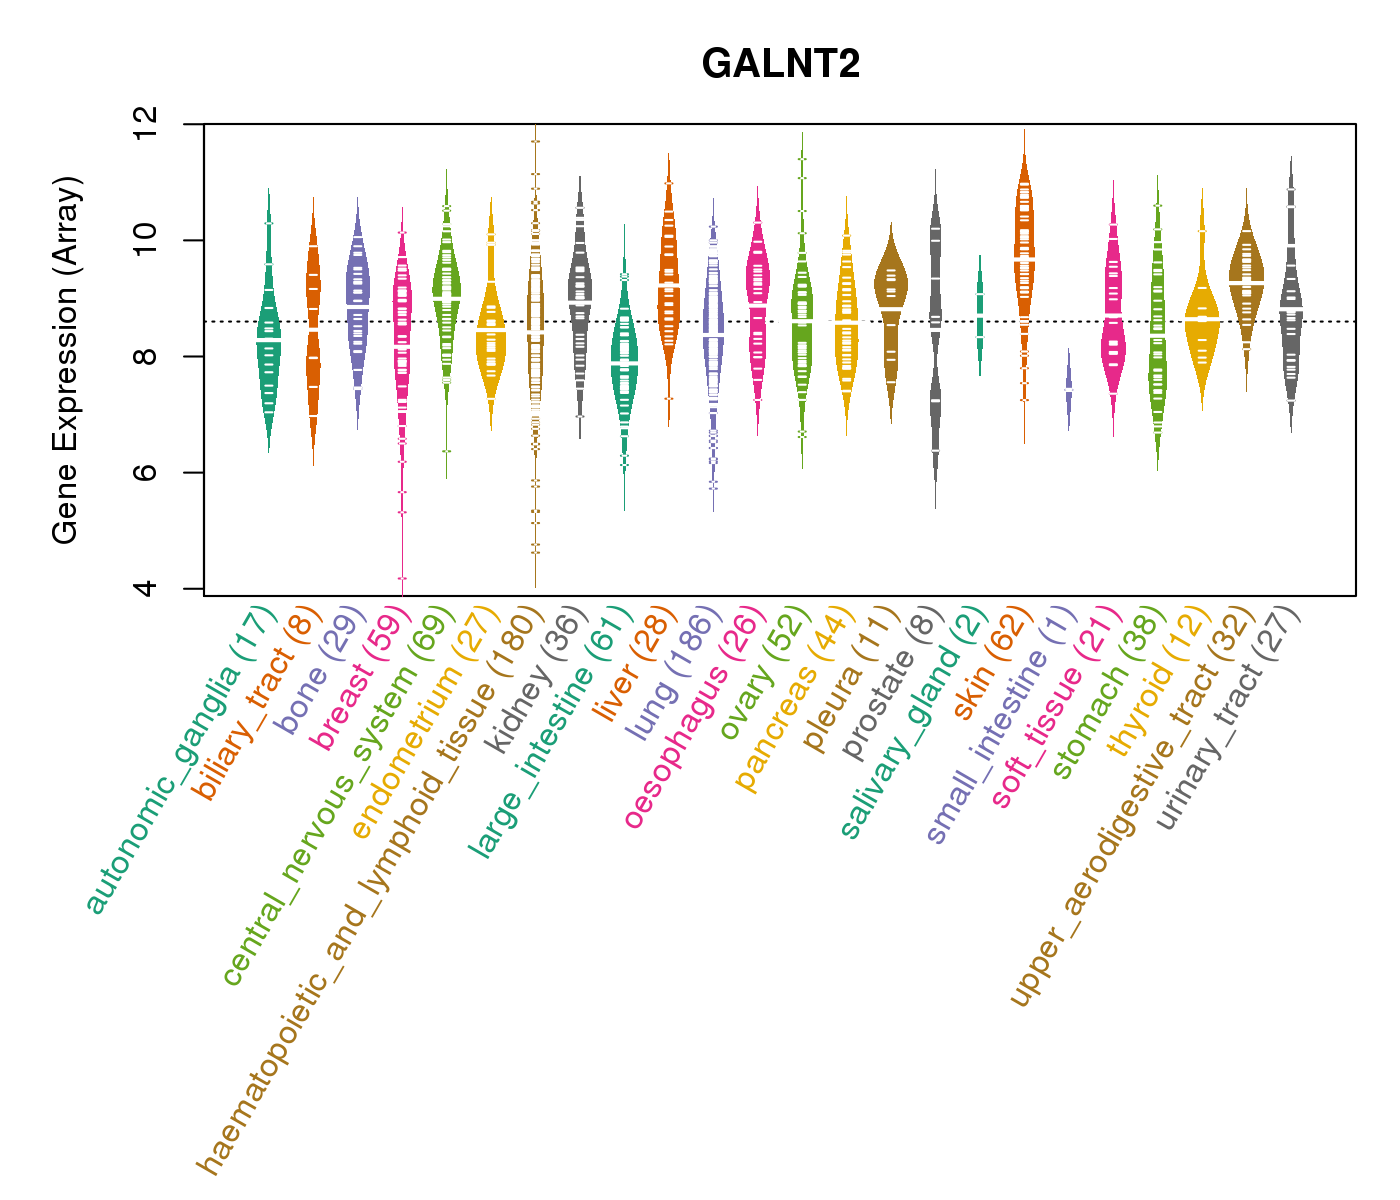
| * CCLE gene expression data were extracted from CCLE_Expression_Entrez_2012-10-18.res: Gene-centric RMA-normalized mRNA expression data. |
 |
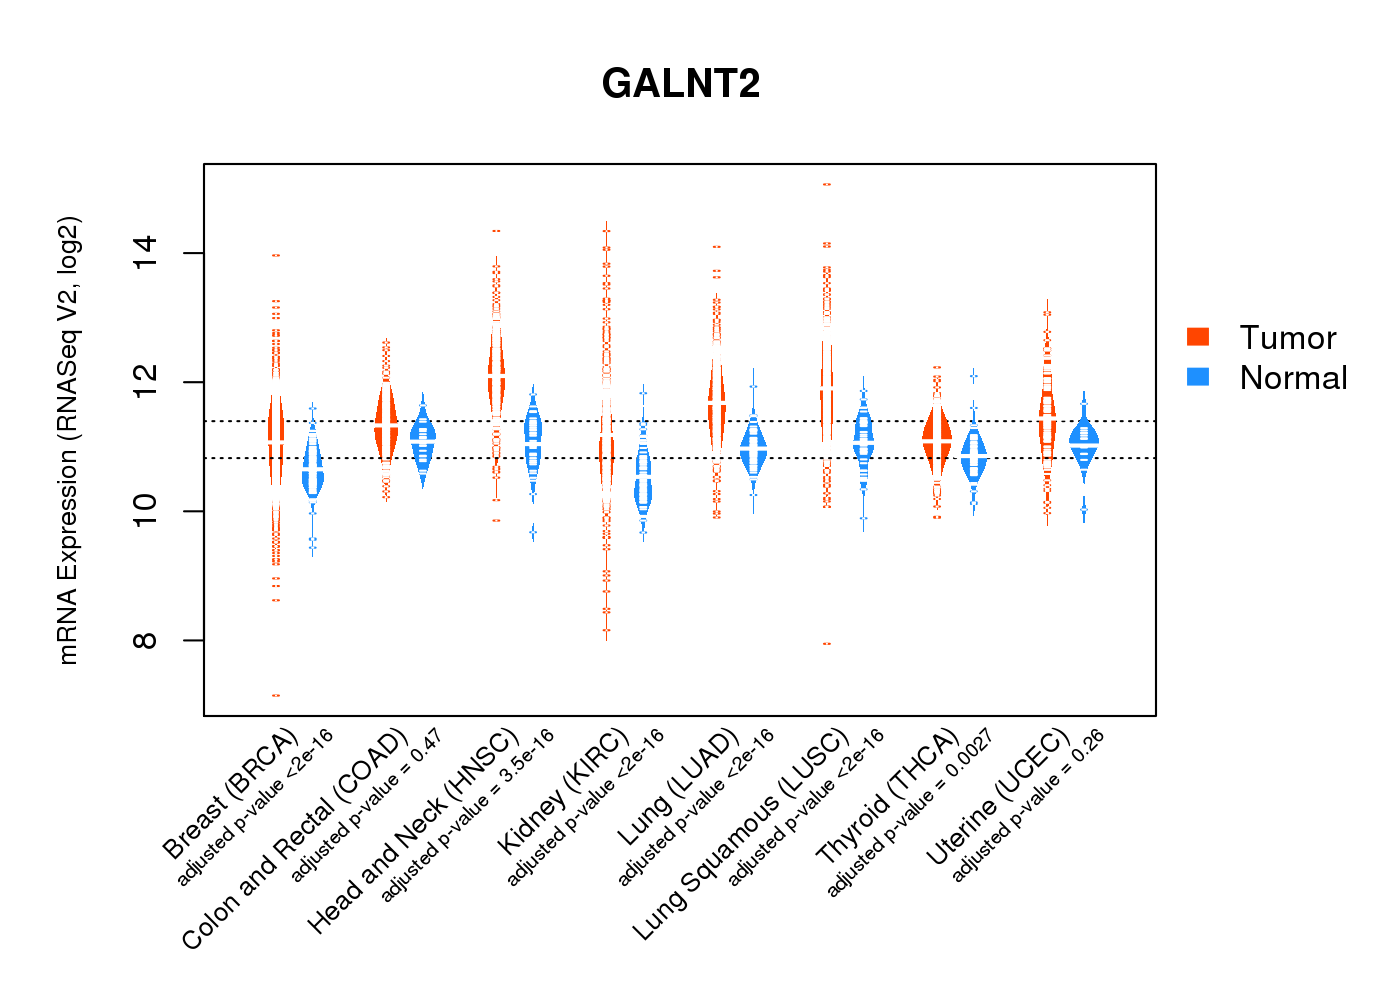
| * Normalized gene expression data of RNASeqV2 was extracted from TCGA using R package TCGA-Assembler. The URLs of all public data files on TCGA DCC data server were gathered at Jan-05-2015. Only eight cancer types have enough normal control samples for differential expression analysis. (t test, adjusted p<0.05 (using Benjamini-Hochberg FDR)) |
 |
| Top |
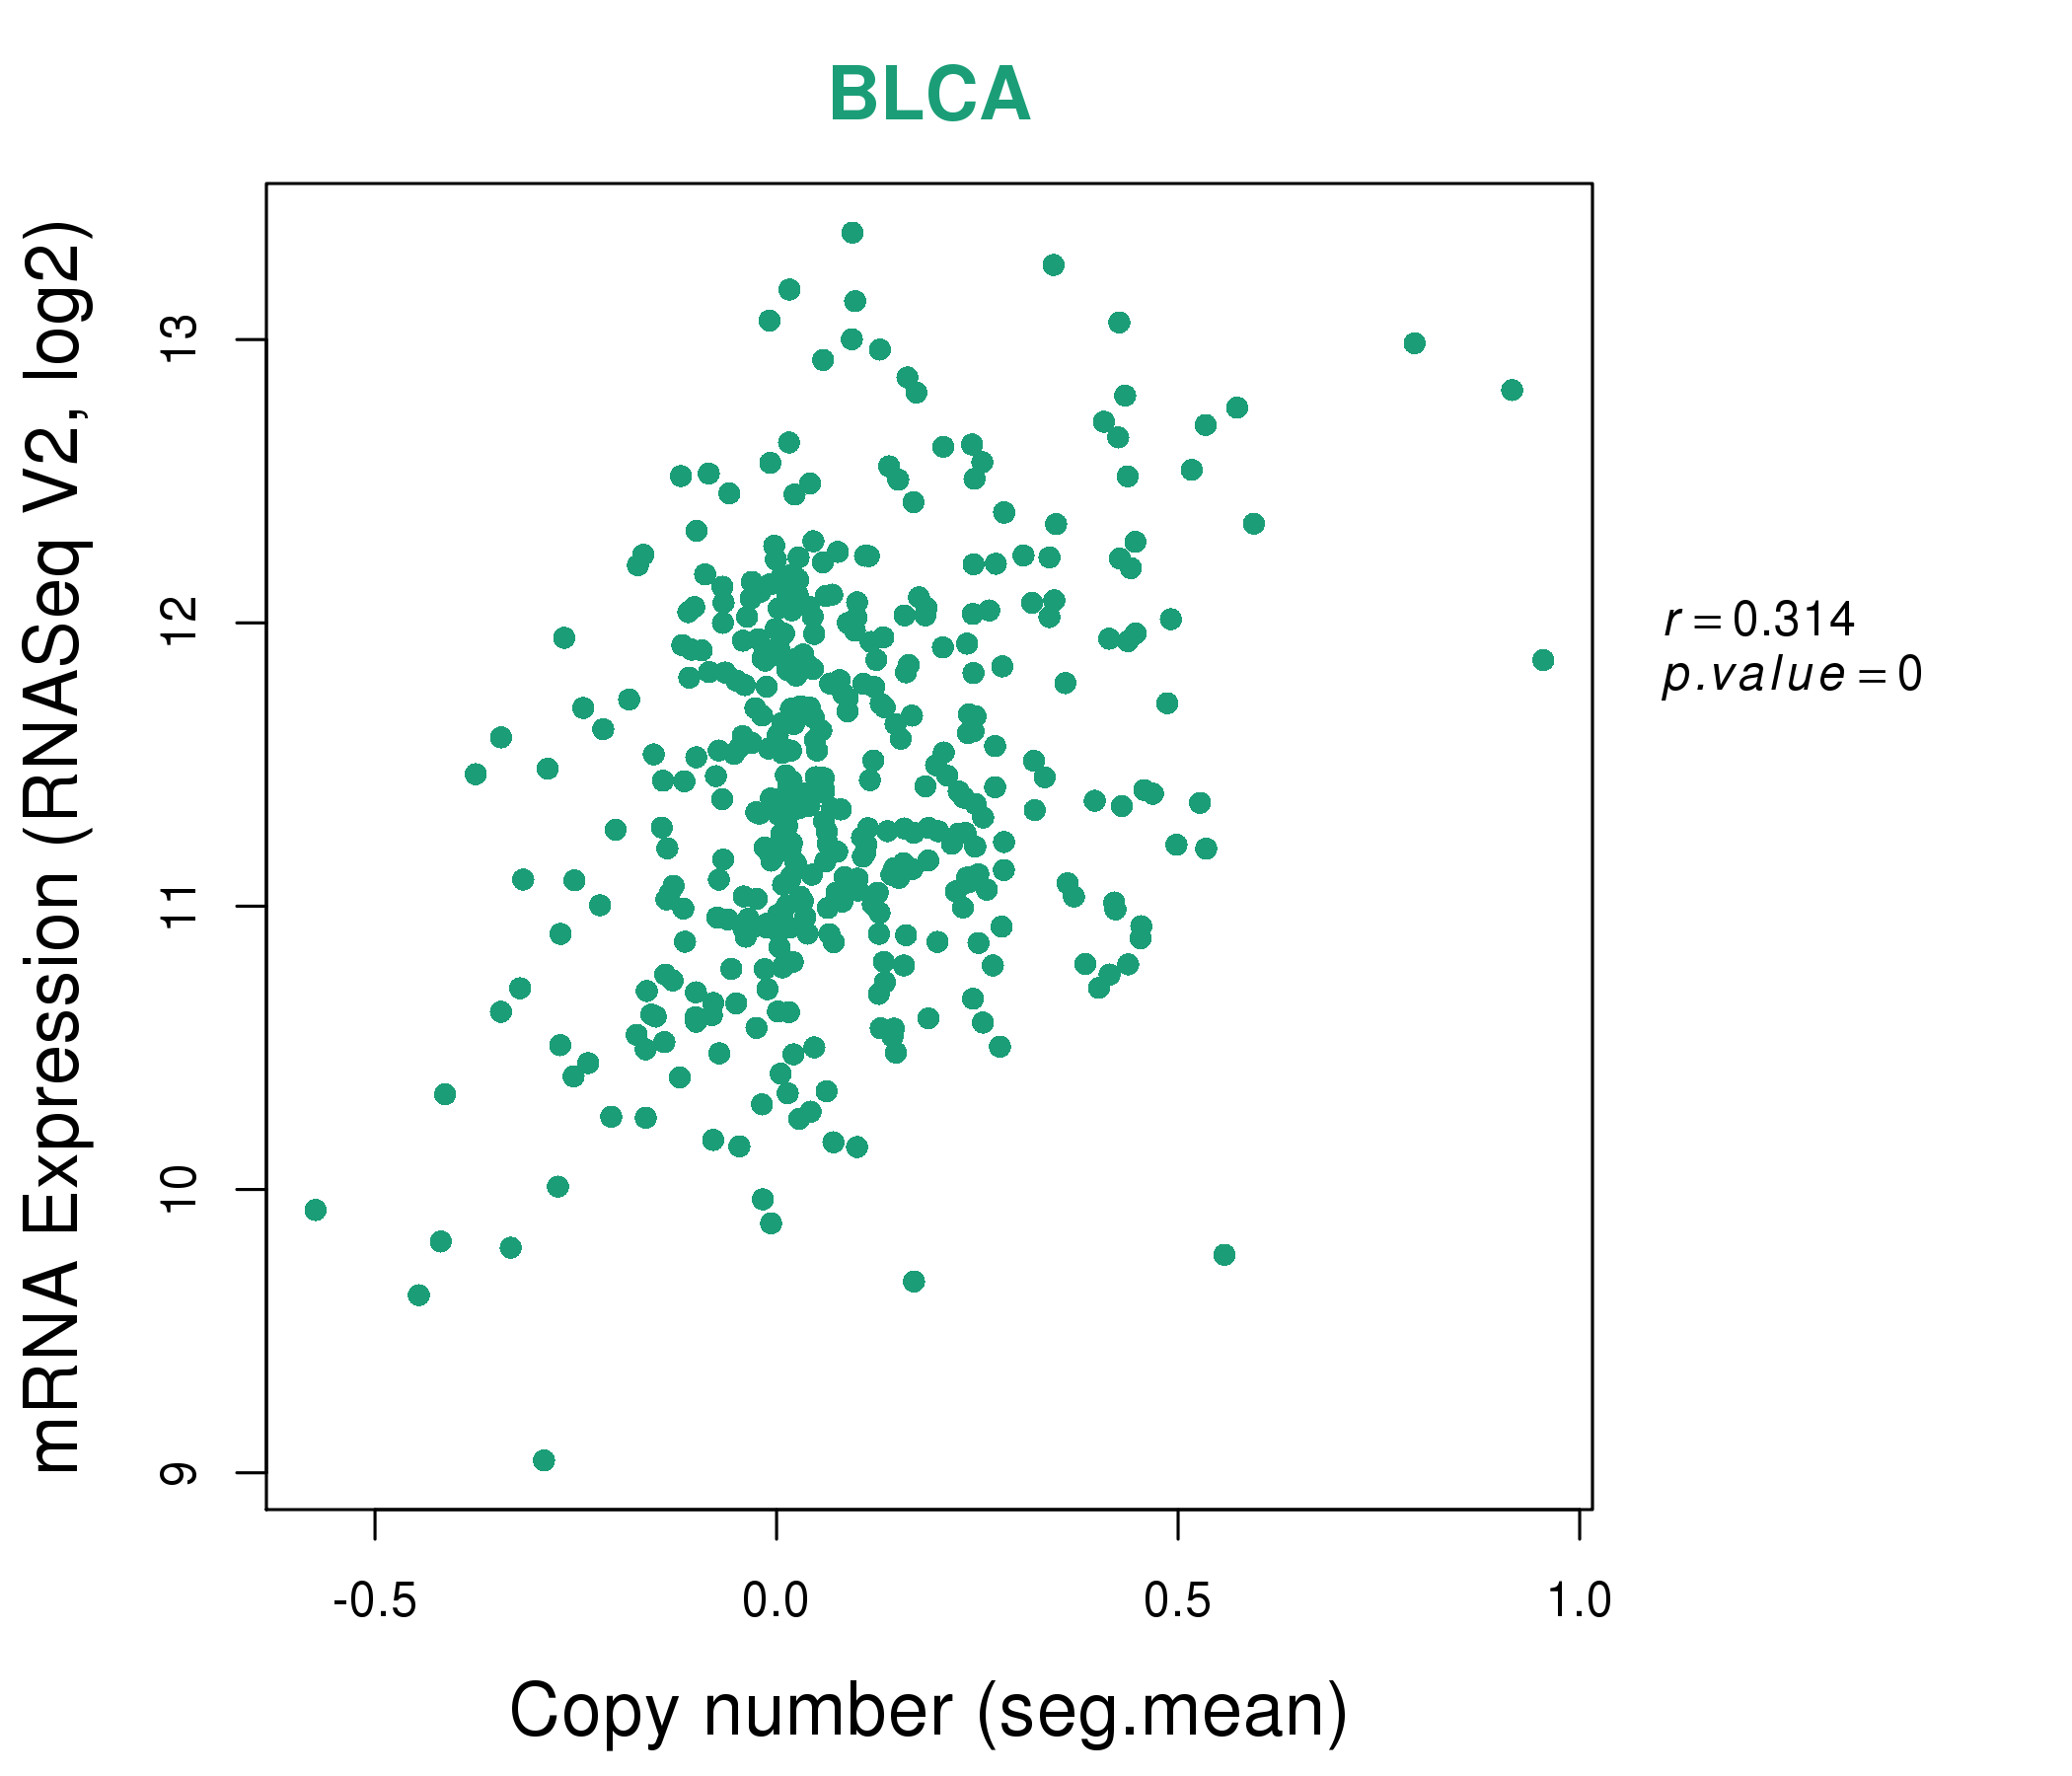
| * This plots show the correlation between CNV and gene expression. |
: Open all plots for all cancer types
 |
|
 |
|
| Top |
| Gene-Gene Network Information |
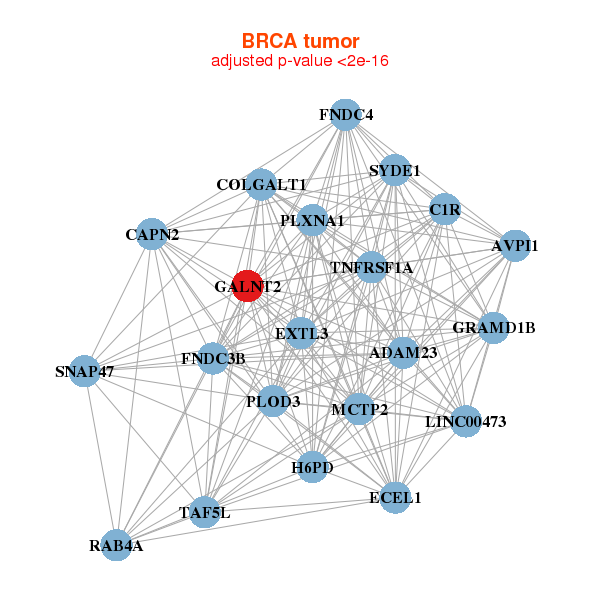
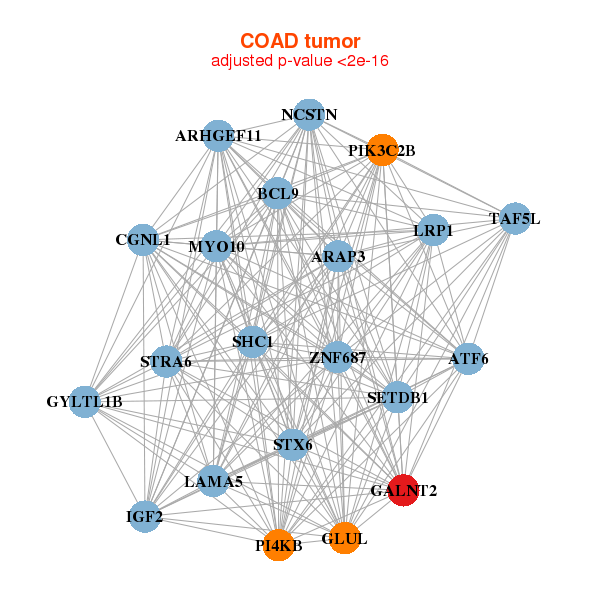
| * Co-Expression network figures were drawn using R package igraph. Only the top 20 genes with the highest correlations were shown. Red circle: input gene, orange circle: cell metabolism gene, sky circle: other gene |
: Open all plots for all cancer types
 |
|
| ADAM23,AVPI1,C1R,LINC00473,CAPN2,ECEL1,EXTL3, FNDC3B,FNDC4,GALNT2,COLGALT1,GRAMD1B,H6PD,MCTP2, PLOD3,PLXNA1,RAB4A,SNAP47,SYDE1,TAF5L,TNFRSF1A | AARS,AP2A1,B4GALT2,C1orf216,DCTN1,EHD1,GALNT2, ITFG3,LAMB2,LRP3,MXD4,NUCB1,PKN1,PLXND1, POR,RNPEPL1,RPS6KA4,ST3GAL2,TMEM104,USF2,ZBED1 |
 |
|
| ARAP3,ARHGEF11,ATF6,BCL9,CGNL1,GALNT2,GLUL, GYLTL1B,IGF2,LAMA5,LRP1,MYO10,NCSTN,PI4KB, PIK3C2B,SETDB1,SHC1,STRA6,STX6,TAF5L,ZNF687 | AARS,ABCC1,LINC00346,CBX2,CLSTN3,DOC2B,ENG, GALNT2,HK1,LRRC37A3,MAP3K6,MAPK11,MMRN2,PLXND1, SELP,SLC43A3,SRP68,STAT5A,TNFRSF8,TXLNA,VCP |
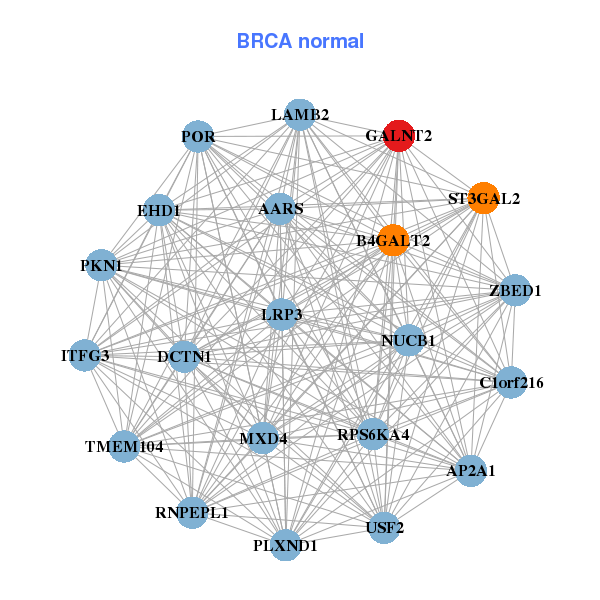
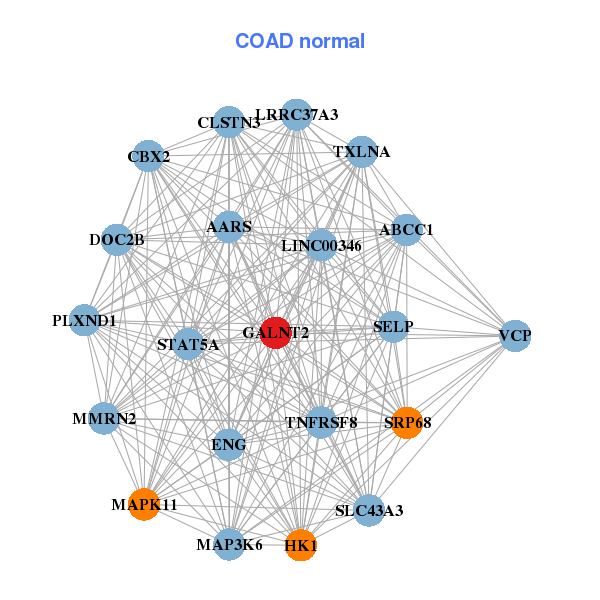
| * Co-Expression network figures were drawn using R package igraph. Only the top 20 genes with the highest correlations were shown. Red circle: input gene, orange circle: cell metabolism gene, sky circle: other gene |
: Open all plots for all cancer types
| Top |
: Open all interacting genes' information including KEGG pathway for all interacting genes from DAVID
| Top |
| Pharmacological Information for GALNT2 |
| There's no related Drug. |
| Top |
| Cross referenced IDs for GALNT2 |
| * We obtained these cross-references from Uniprot database. It covers 150 different DBs, 18 categories. http://www.uniprot.org/help/cross_references_section |
: Open all cross reference information
|
Copyright © 2016-Present - The Univsersity of Texas Health Science Center at Houston @ |