|
||||||||||||||||||||||||||||||||||||||||||||||||||||||||||||||||||||||||||||||||||||||||||||||||||||||||||||||||||||||||||||||||||||||||||||||||||||||||||||||||||||||||||||||||||||||||||||||||||||||||||||||||||||||||||||||||||||||||||||||||||||||||||||||||||||||||||||||||||||||||||||||||||||||||||||||||||||||||||
| |
| Phenotypic Information (metabolism pathway, cancer, disease, phenome) |
| |
| |
| Gene-Gene Network Information: Co-Expression Network, Interacting Genes & KEGG |
| |
|


| Gene Summary for MTHFD1L |
| Top |
| Phenotypic Information for MTHFD1L(metabolism pathway, cancer, disease, phenome) |
| Cancer | CGAP: MTHFD1L |
| Familial Cancer Database: MTHFD1L | |
| * This gene is included in those cancer gene databases. |
|
|
|
|
|
|
| ||||||||||||||||||||||||||||||||||||||||||||||||||||||||||||||||||||||||||||||||||||||||||||||||||||||||||||||||||||||||||||||||||||||||||||||||||||||||||||||||||||||||||||||||||||||||||||||||||||||||||||||||||||||||||||||||||||||||||||||||||||||||||||||||||||||||||||||||||||||||||||||||||||||||||||||||||||
Oncogene 1 | Significant driver gene in | |||||||||||||||||||||||||||||||||||||||||||||||||||||||||||||||||||||||||||||||||||||||||||||||||||||||||||||||||||||||||||||||||||||||||||||||||||||||||||||||||||||||||||||||||||||||||||||||||||||||||||||||||||||||||||||||||||||||||||||||||||||||||||||||||||||||||||||||||||||||||||||||||||||||||||||||||||||||||
| cf) number; DB name 1 Oncogene; http://nar.oxfordjournals.org/content/35/suppl_1/D721.long, 2 Tumor Suppressor gene; https://bioinfo.uth.edu/TSGene/, 3 Cancer Gene Census; http://www.nature.com/nrc/journal/v4/n3/abs/nrc1299.html, 4 CancerGenes; http://nar.oxfordjournals.org/content/35/suppl_1/D721.long, 5 Network of Cancer Gene; http://ncg.kcl.ac.uk/index.php, 1Therapeutic Vulnerabilities in Cancer; http://cbio.mskcc.org/cancergenomics/statius/ |
| KEGG_GLYOXYLATE_AND_DICARBOXYLATE_METABOLISM | |
| Mutations for MTHFD1L |
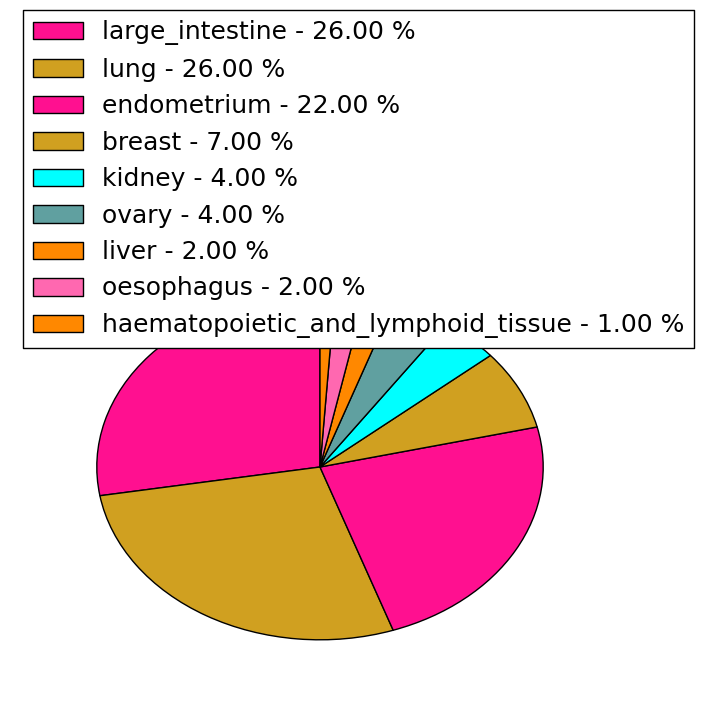
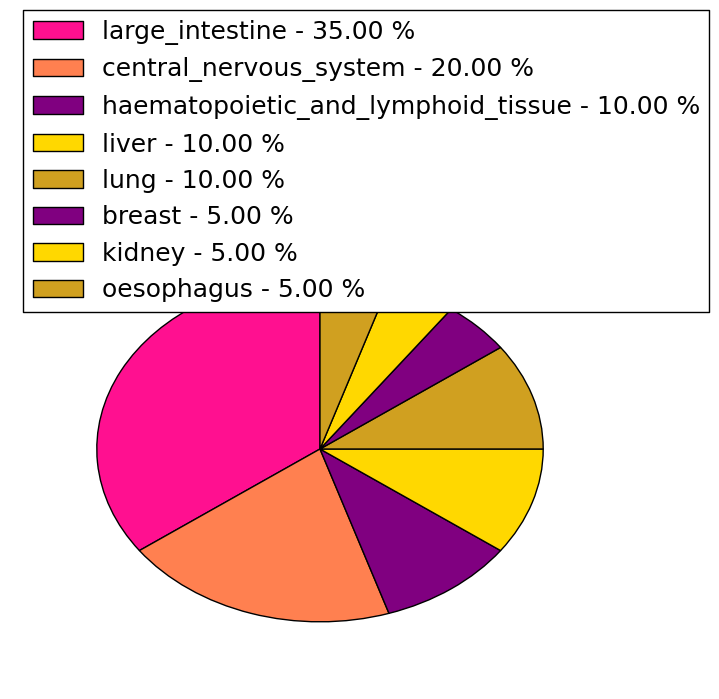
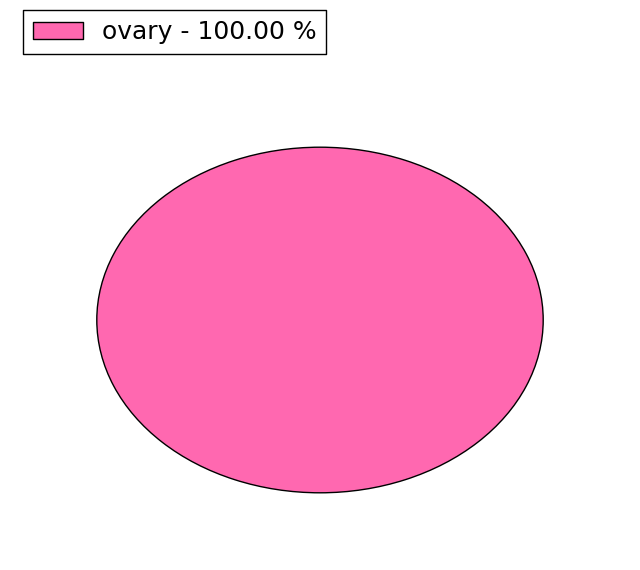
| * Under tables are showing count per each tissue to give us broad intuition about tissue specific mutation patterns.You can go to the detailed page for each mutation database's web site. |
| There's no structural variation information in COSMIC data for this gene. |
| * From mRNA Sanger sequences, Chitars2.0 arranged chimeric transcripts. This table shows MTHFD1L related fusion information. |
| ID | Head Gene | Tail Gene | Accession | Gene_a | qStart_a | qEnd_a | Chromosome_a | tStart_a | tEnd_a | Gene_a | qStart_a | qEnd_a | Chromosome_a | tStart_a | tEnd_a |
| AA764935 | MTHFD1L | 1 | 237 | 6 | 151300887 | 151301123 | MTHFD1L | 237 | 337 | 6 | 151311062 | 151311164 | |
| AI311578 | MTHFD1L | 4 | 113 | 6 | 151220027 | 151220136 | RNU5E-1 | 113 | 484 | 5 | 80548500 | 80550879 | |
| BP339812 | IMP3 | 1 | 409 | 15 | 75932094 | 75932561 | MTHFD1L | 406 | 582 | 6 | 151281493 | 151293131 | |
| AA829961 | MTHFD1L | 1 | 237 | 6 | 151300887 | 151301123 | MTHFD1L | 237 | 474 | 6 | 151310926 | 151311164 | |
| AA811452 | MTHFD1L | 1 | 237 | 6 | 151300887 | 151301123 | MTHFD1L | 237 | 497 | 6 | 151310903 | 151311164 | |
| AF190155 | MTHFD1L | 1 | 1815 | 6 | 151328155 | 151329970 | MTHFD1L | 1803 | 2280 | 6 | 151324685 | 151325162 | |
| AW976998 | MTHFD1L | 1 | 227 | 6 | 151300887 | 151301113 | MTHFD1L | 227 | 426 | 6 | 151310965 | 151311164 | |
| AA815116 | MTHFD1L | 1 | 237 | 6 | 151300887 | 151301123 | MTHFD1L | 237 | 474 | 6 | 151310926 | 151311164 | |
| Top |
| Mutation type/ Tissue ID | brca | cns | cerv | endome | haematopo | kidn | Lintest | liver | lung | ns | ovary | pancre | prost | skin | stoma | thyro | urina | |||
| Total # sample | 1 | |||||||||||||||||||
| GAIN (# sample) | 1 | |||||||||||||||||||
| LOSS (# sample) |
| cf) Tissue ID; Tissue type (1; Breast, 2; Central_nervous_system, 3; Cervix, 4; Endometrium, 5; Haematopoietic_and_lymphoid_tissue, 6; Kidney, 7; Large_intestine, 8; Liver, 9; Lung, 10; NS, 11; Ovary, 12; Pancreas, 13; Prostate, 14; Skin, 15; Stomach, 16; Thyroid, 17; Urinary_tract) |
| Top |
|
 |
| Top |
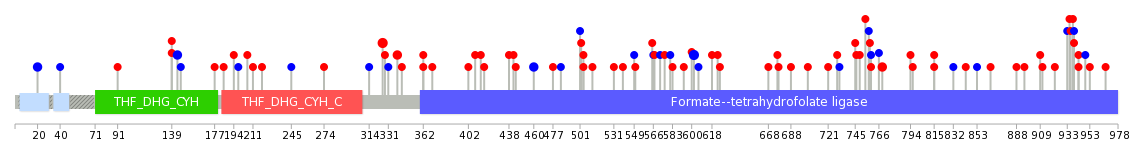
| Stat. for Non-Synonymous SNVs (# total SNVs=67) | (# total SNVs=20) |
 |  |
(# total SNVs=1) | (# total SNVs=0) |
 |
| Top |
| * When you move the cursor on each content, you can see more deailed mutation information on the Tooltip. Those are primary_site,primary_histology,mutation(aa),pubmedID. |
| GRCh37 position | Mutation(aa) | Unique sampleID count |
| chr6:151239797-151239797 | p.R326Q | 3 |
| chr6:151281413-151281413 | p.A602A | 3 |
| chr6:151203912-151203912 | p.I144I | 2 |
| chr6:151334956-151334956 | p.E769D | 2 |
| chr6:151265691-151265691 | p.D504N | 2 |
| chr6:151243371-151243371 | p.R339C | 2 |
| chr6:151187018-151187018 | p.G20G | 2 |
| chr6:151247259-151247259 | p.D362N | 2 |
| chr6:151258063-151258063 | p.T460T | 2 |
| chr6:151198960-151198960 | p.E139K | 2 |
| Top |
|
 |
| Point Mutation/ Tissue ID | 1 | 2 | 3 | 4 | 5 | 6 | 7 | 8 | 9 | 10 | 11 | 12 | 13 | 14 | 15 | 16 | 17 | 18 | 19 | 20 |
| # sample | 1 | 4 | 15 | 2 | 3 | 3 | 8 | 2 | 2 | 2 | 9 | 1 | 11 | |||||||
| # mutation | 1 | 4 | 15 | 2 | 3 | 3 | 8 | 2 | 2 | 2 | 9 | 1 | 15 | |||||||
| nonsynonymous SNV | 1 | 4 | 12 | 3 | 2 | 6 | 2 | 2 | 1 | 5 | 1 | 15 | ||||||||
| synonymous SNV | 3 | 2 | 1 | 2 | 1 | 4 |
| cf) Tissue ID; Tissue type (1; BLCA[Bladder Urothelial Carcinoma], 2; BRCA[Breast invasive carcinoma], 3; CESC[Cervical squamous cell carcinoma and endocervical adenocarcinoma], 4; COAD[Colon adenocarcinoma], 5; GBM[Glioblastoma multiforme], 6; Glioma Low Grade, 7; HNSC[Head and Neck squamous cell carcinoma], 8; KICH[Kidney Chromophobe], 9; KIRC[Kidney renal clear cell carcinoma], 10; KIRP[Kidney renal papillary cell carcinoma], 11; LAML[Acute Myeloid Leukemia], 12; LUAD[Lung adenocarcinoma], 13; LUSC[Lung squamous cell carcinoma], 14; OV[Ovarian serous cystadenocarcinoma ], 15; PAAD[Pancreatic adenocarcinoma], 16; PRAD[Prostate adenocarcinoma], 17; SKCM[Skin Cutaneous Melanoma], 18:STAD[Stomach adenocarcinoma], 19:THCA[Thyroid carcinoma], 20:UCEC[Uterine Corpus Endometrial Carcinoma]) |
| Top |
| * We represented just top 10 SNVs. When you move the cursor on each content, you can see more deailed mutation information on the Tooltip. Those are primary_site, primary_histology, mutation(aa), pubmedID. |
| Genomic Position | Mutation(aa) | Unique sampleID count |
| chr6:151247259 | p.T461T,MTHFD1L | 2 |
| chr6:151265691 | p.S246S,MTHFD1L | 2 |
| chr6:151209072 | p.D505Y,MTHFD1L | 2 |
| chr6:151270259 | p.R327Q,MTHFD1L | 2 |
| chr6:151258063 | p.R340C,MTHFD1L | 2 |
| chr6:151239797 | p.D363N,MTHFD1L | 2 |
| chr6:151281413 | p.T573T,MTHFD1L | 2 |
| chr6:151243371 | p.A603A,MTHFD1L | 2 |
| chr6:151204010 | p.A206T,MTHFD1L | 1 |
| chr6:151281460 | p.M626I,MTHFD1L | 1 |
| * Copy number data were extracted from TCGA using R package TCGA-Assembler. The URLs of all public data files on TCGA DCC data server were gathered on Jan-05-2015. Function ProcessCNAData in TCGA-Assembler package was used to obtain gene-level copy number value which is calculated as the average copy number of the genomic region of a gene. |
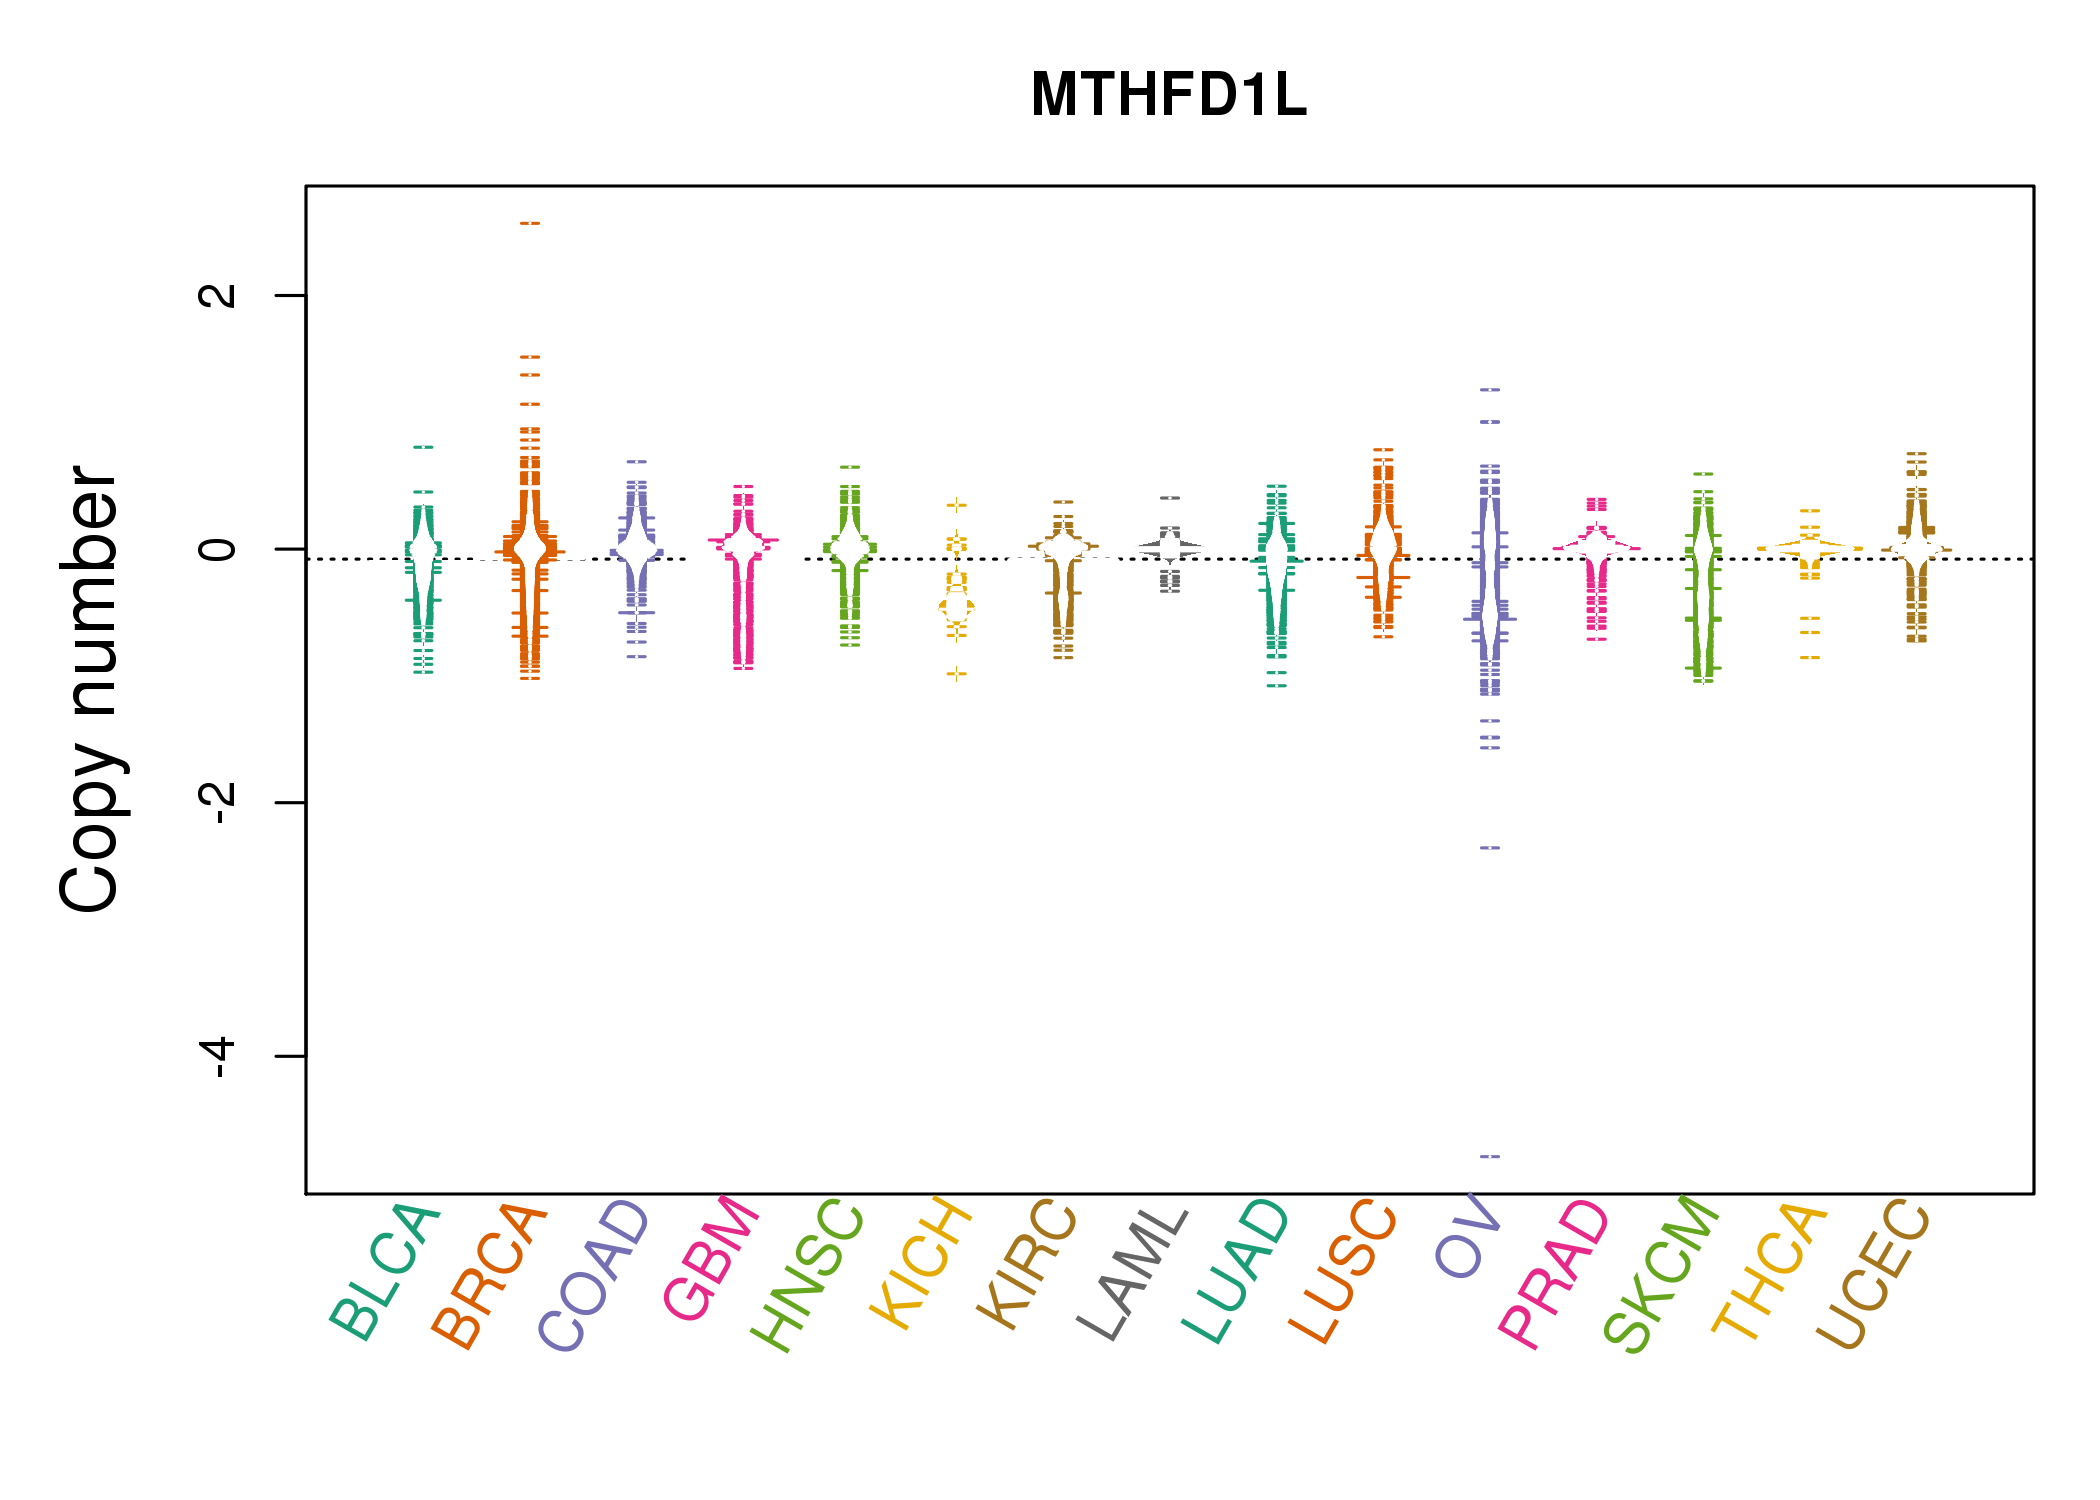 |
| cf) Tissue ID[Tissue type]: BLCA[Bladder Urothelial Carcinoma], BRCA[Breast invasive carcinoma], CESC[Cervical squamous cell carcinoma and endocervical adenocarcinoma], COAD[Colon adenocarcinoma], GBM[Glioblastoma multiforme], Glioma Low Grade, HNSC[Head and Neck squamous cell carcinoma], KICH[Kidney Chromophobe], KIRC[Kidney renal clear cell carcinoma], KIRP[Kidney renal papillary cell carcinoma], LAML[Acute Myeloid Leukemia], LUAD[Lung adenocarcinoma], LUSC[Lung squamous cell carcinoma], OV[Ovarian serous cystadenocarcinoma ], PAAD[Pancreatic adenocarcinoma], PRAD[Prostate adenocarcinoma], SKCM[Skin Cutaneous Melanoma], STAD[Stomach adenocarcinoma], THCA[Thyroid carcinoma], UCEC[Uterine Corpus Endometrial Carcinoma] |
| Top |
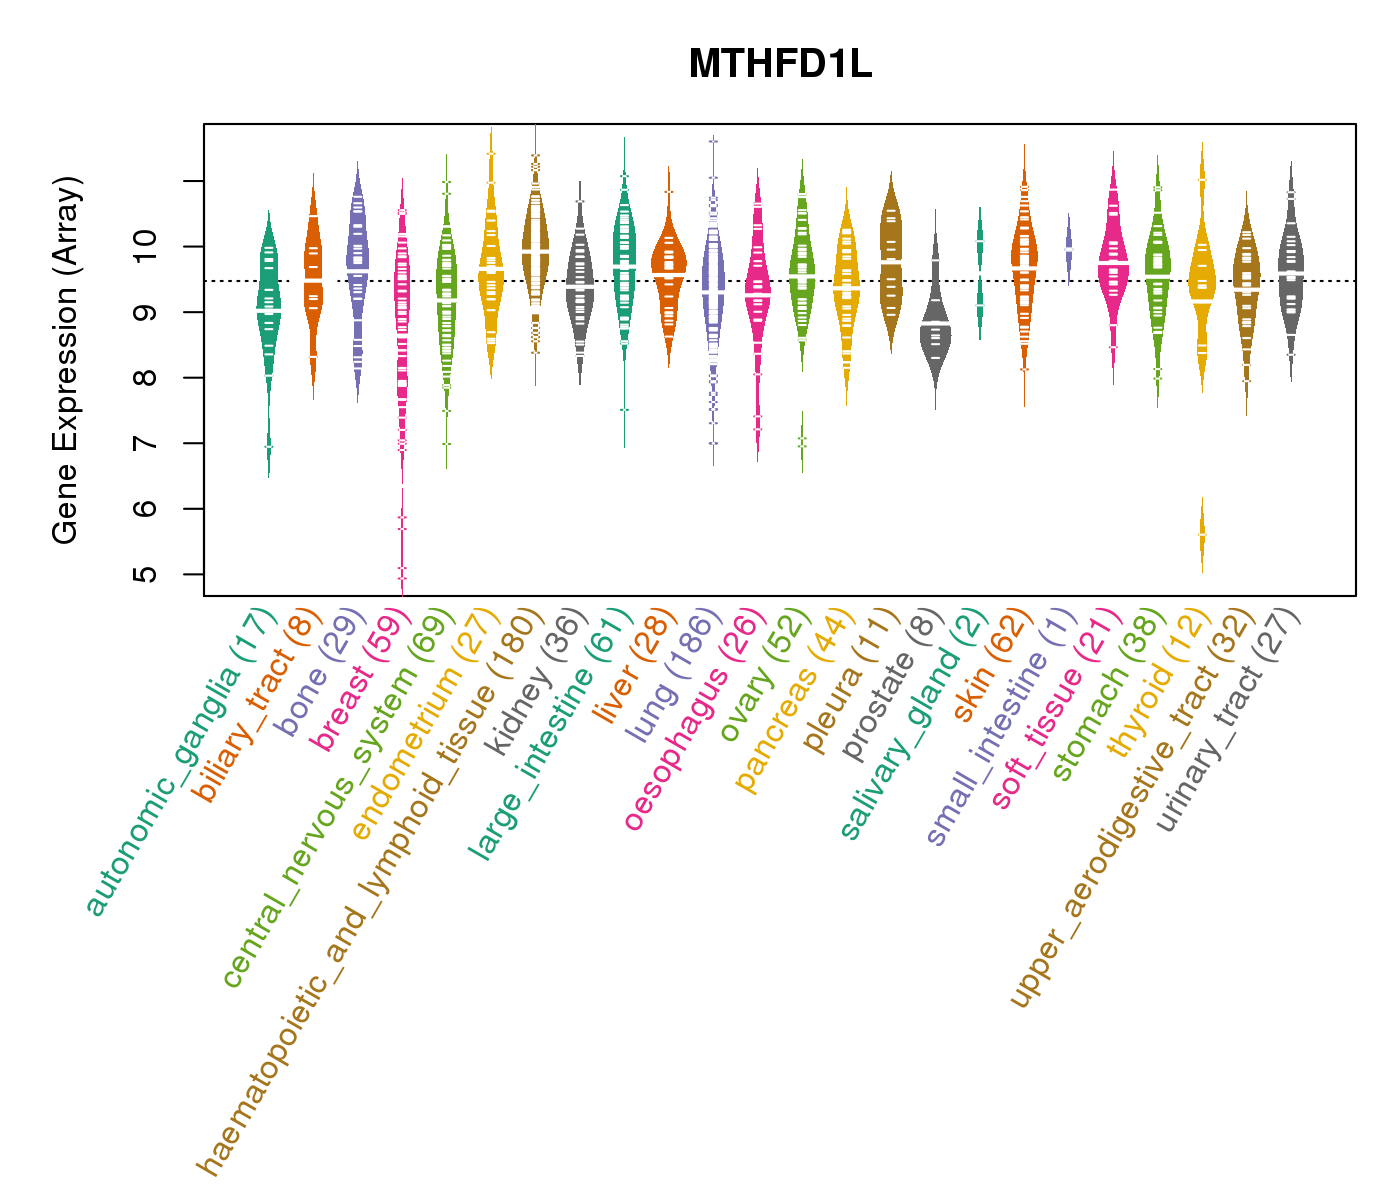
| Gene Expression for MTHFD1L |
| * CCLE gene expression data were extracted from CCLE_Expression_Entrez_2012-10-18.res: Gene-centric RMA-normalized mRNA expression data. |
 |
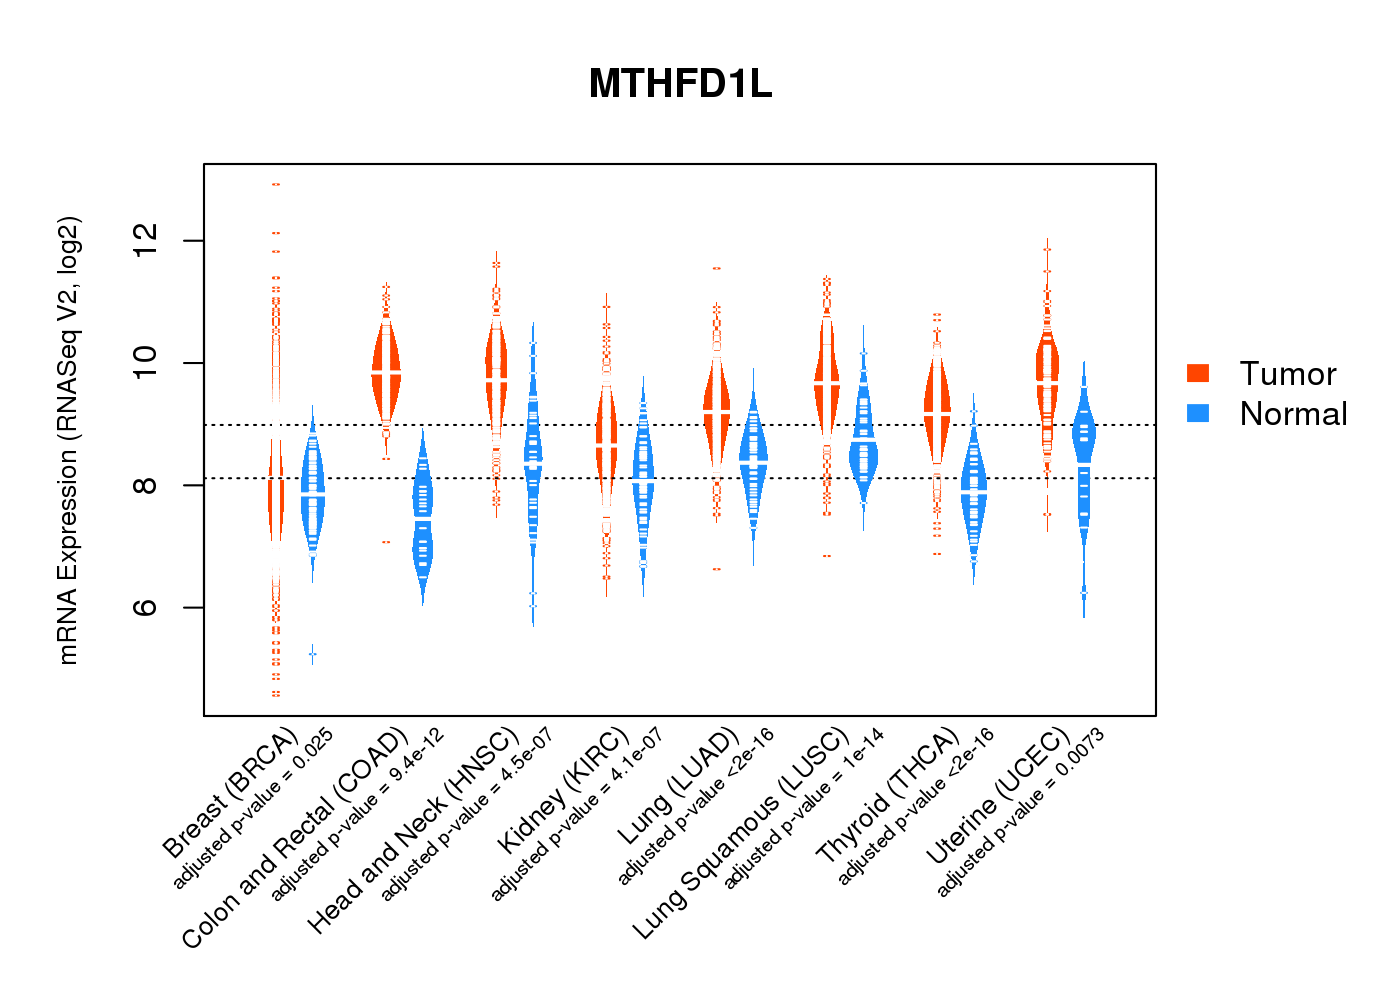
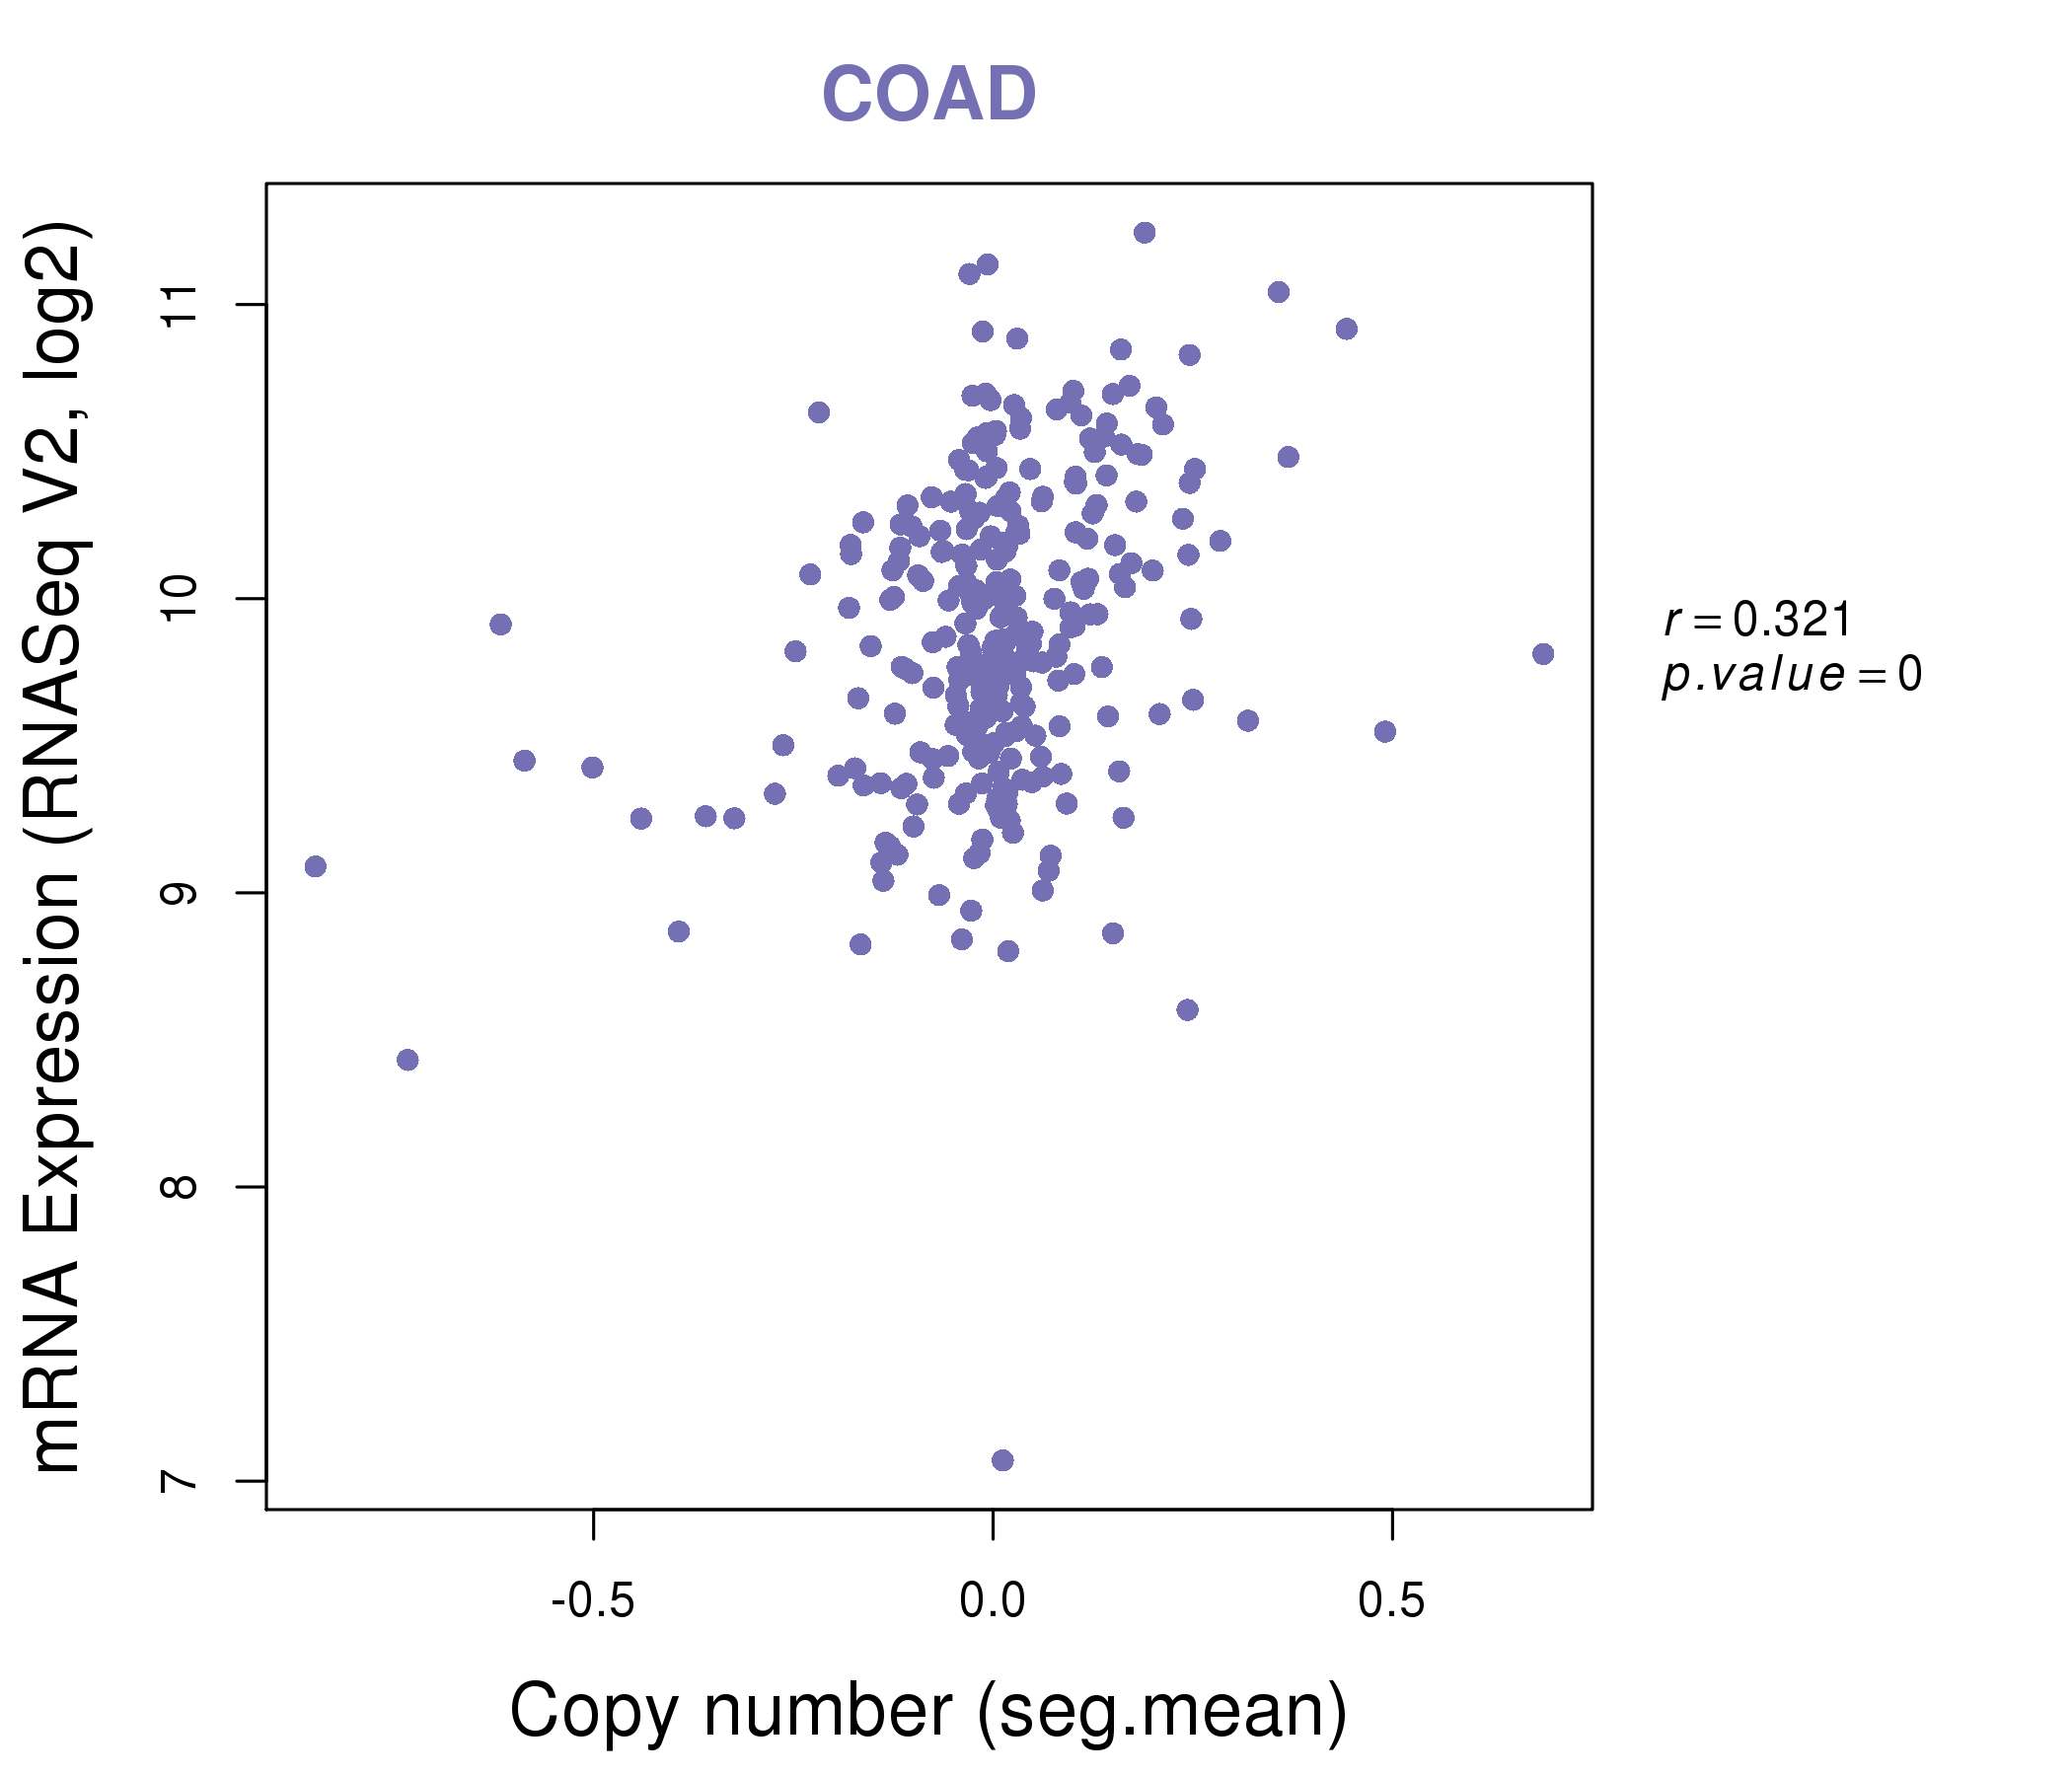
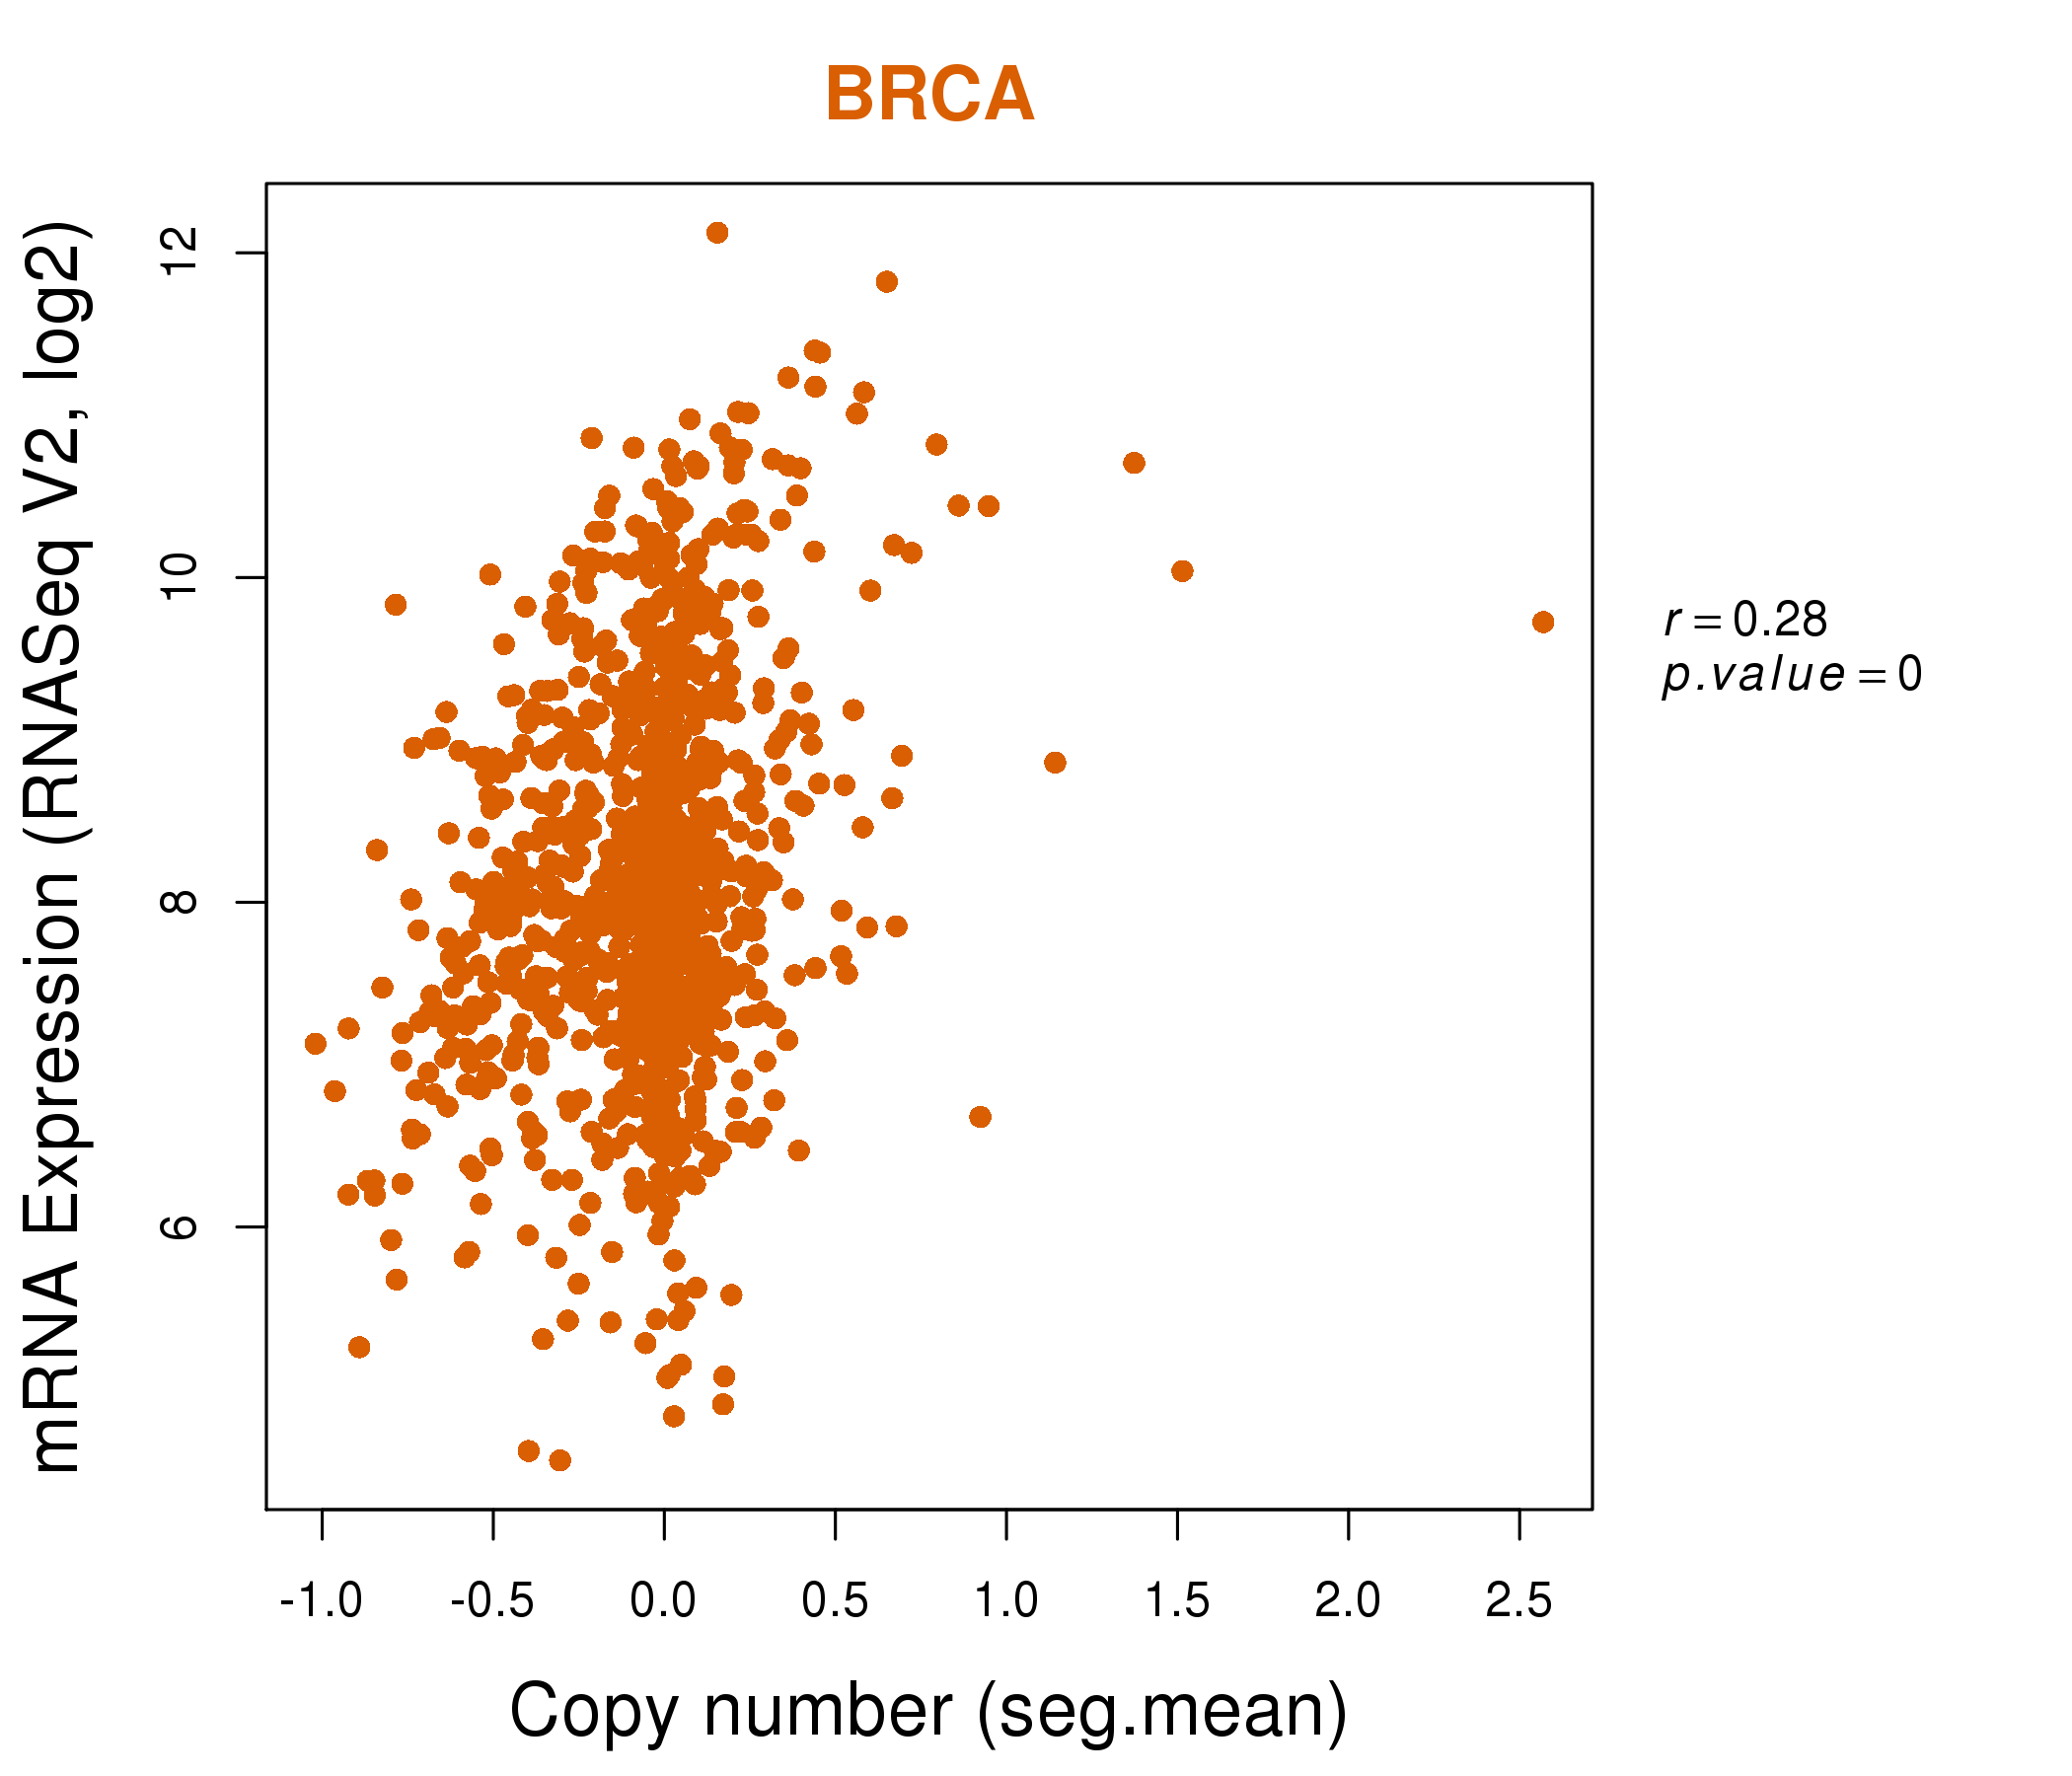
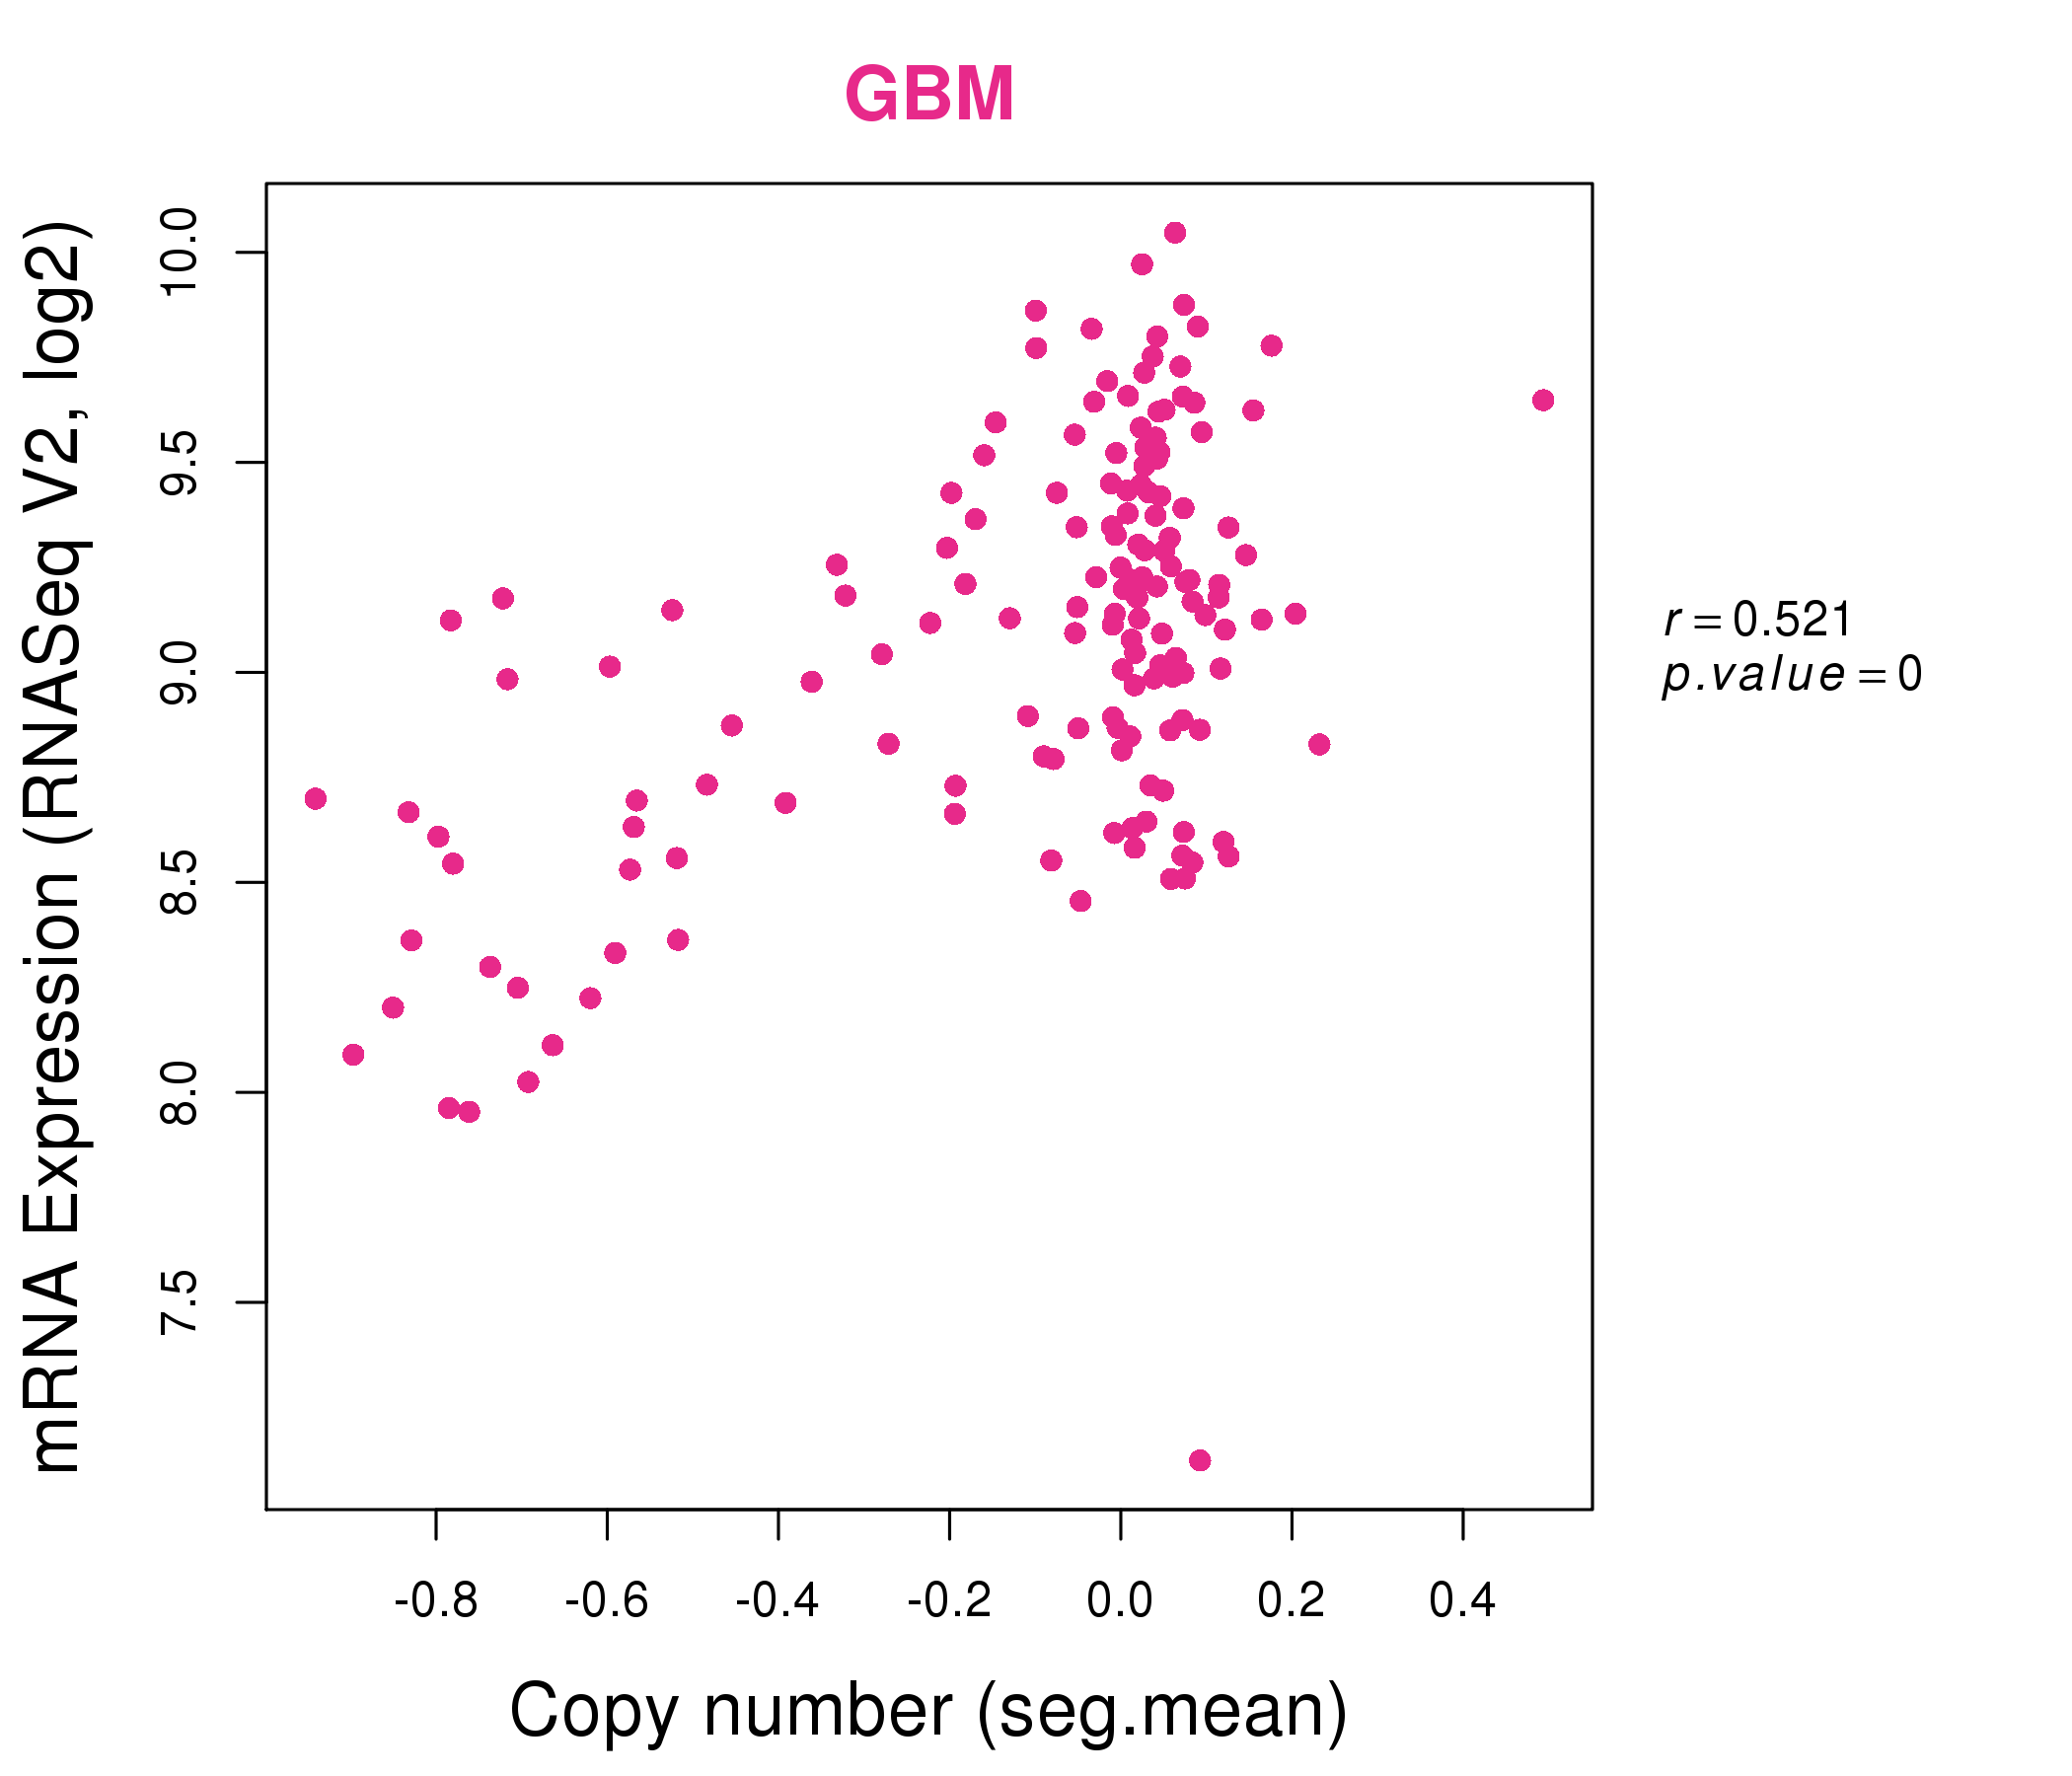
| * Normalized gene expression data of RNASeqV2 was extracted from TCGA using R package TCGA-Assembler. The URLs of all public data files on TCGA DCC data server were gathered at Jan-05-2015. Only eight cancer types have enough normal control samples for differential expression analysis. (t test, adjusted p<0.05 (using Benjamini-Hochberg FDR)) |
 |
| Top |
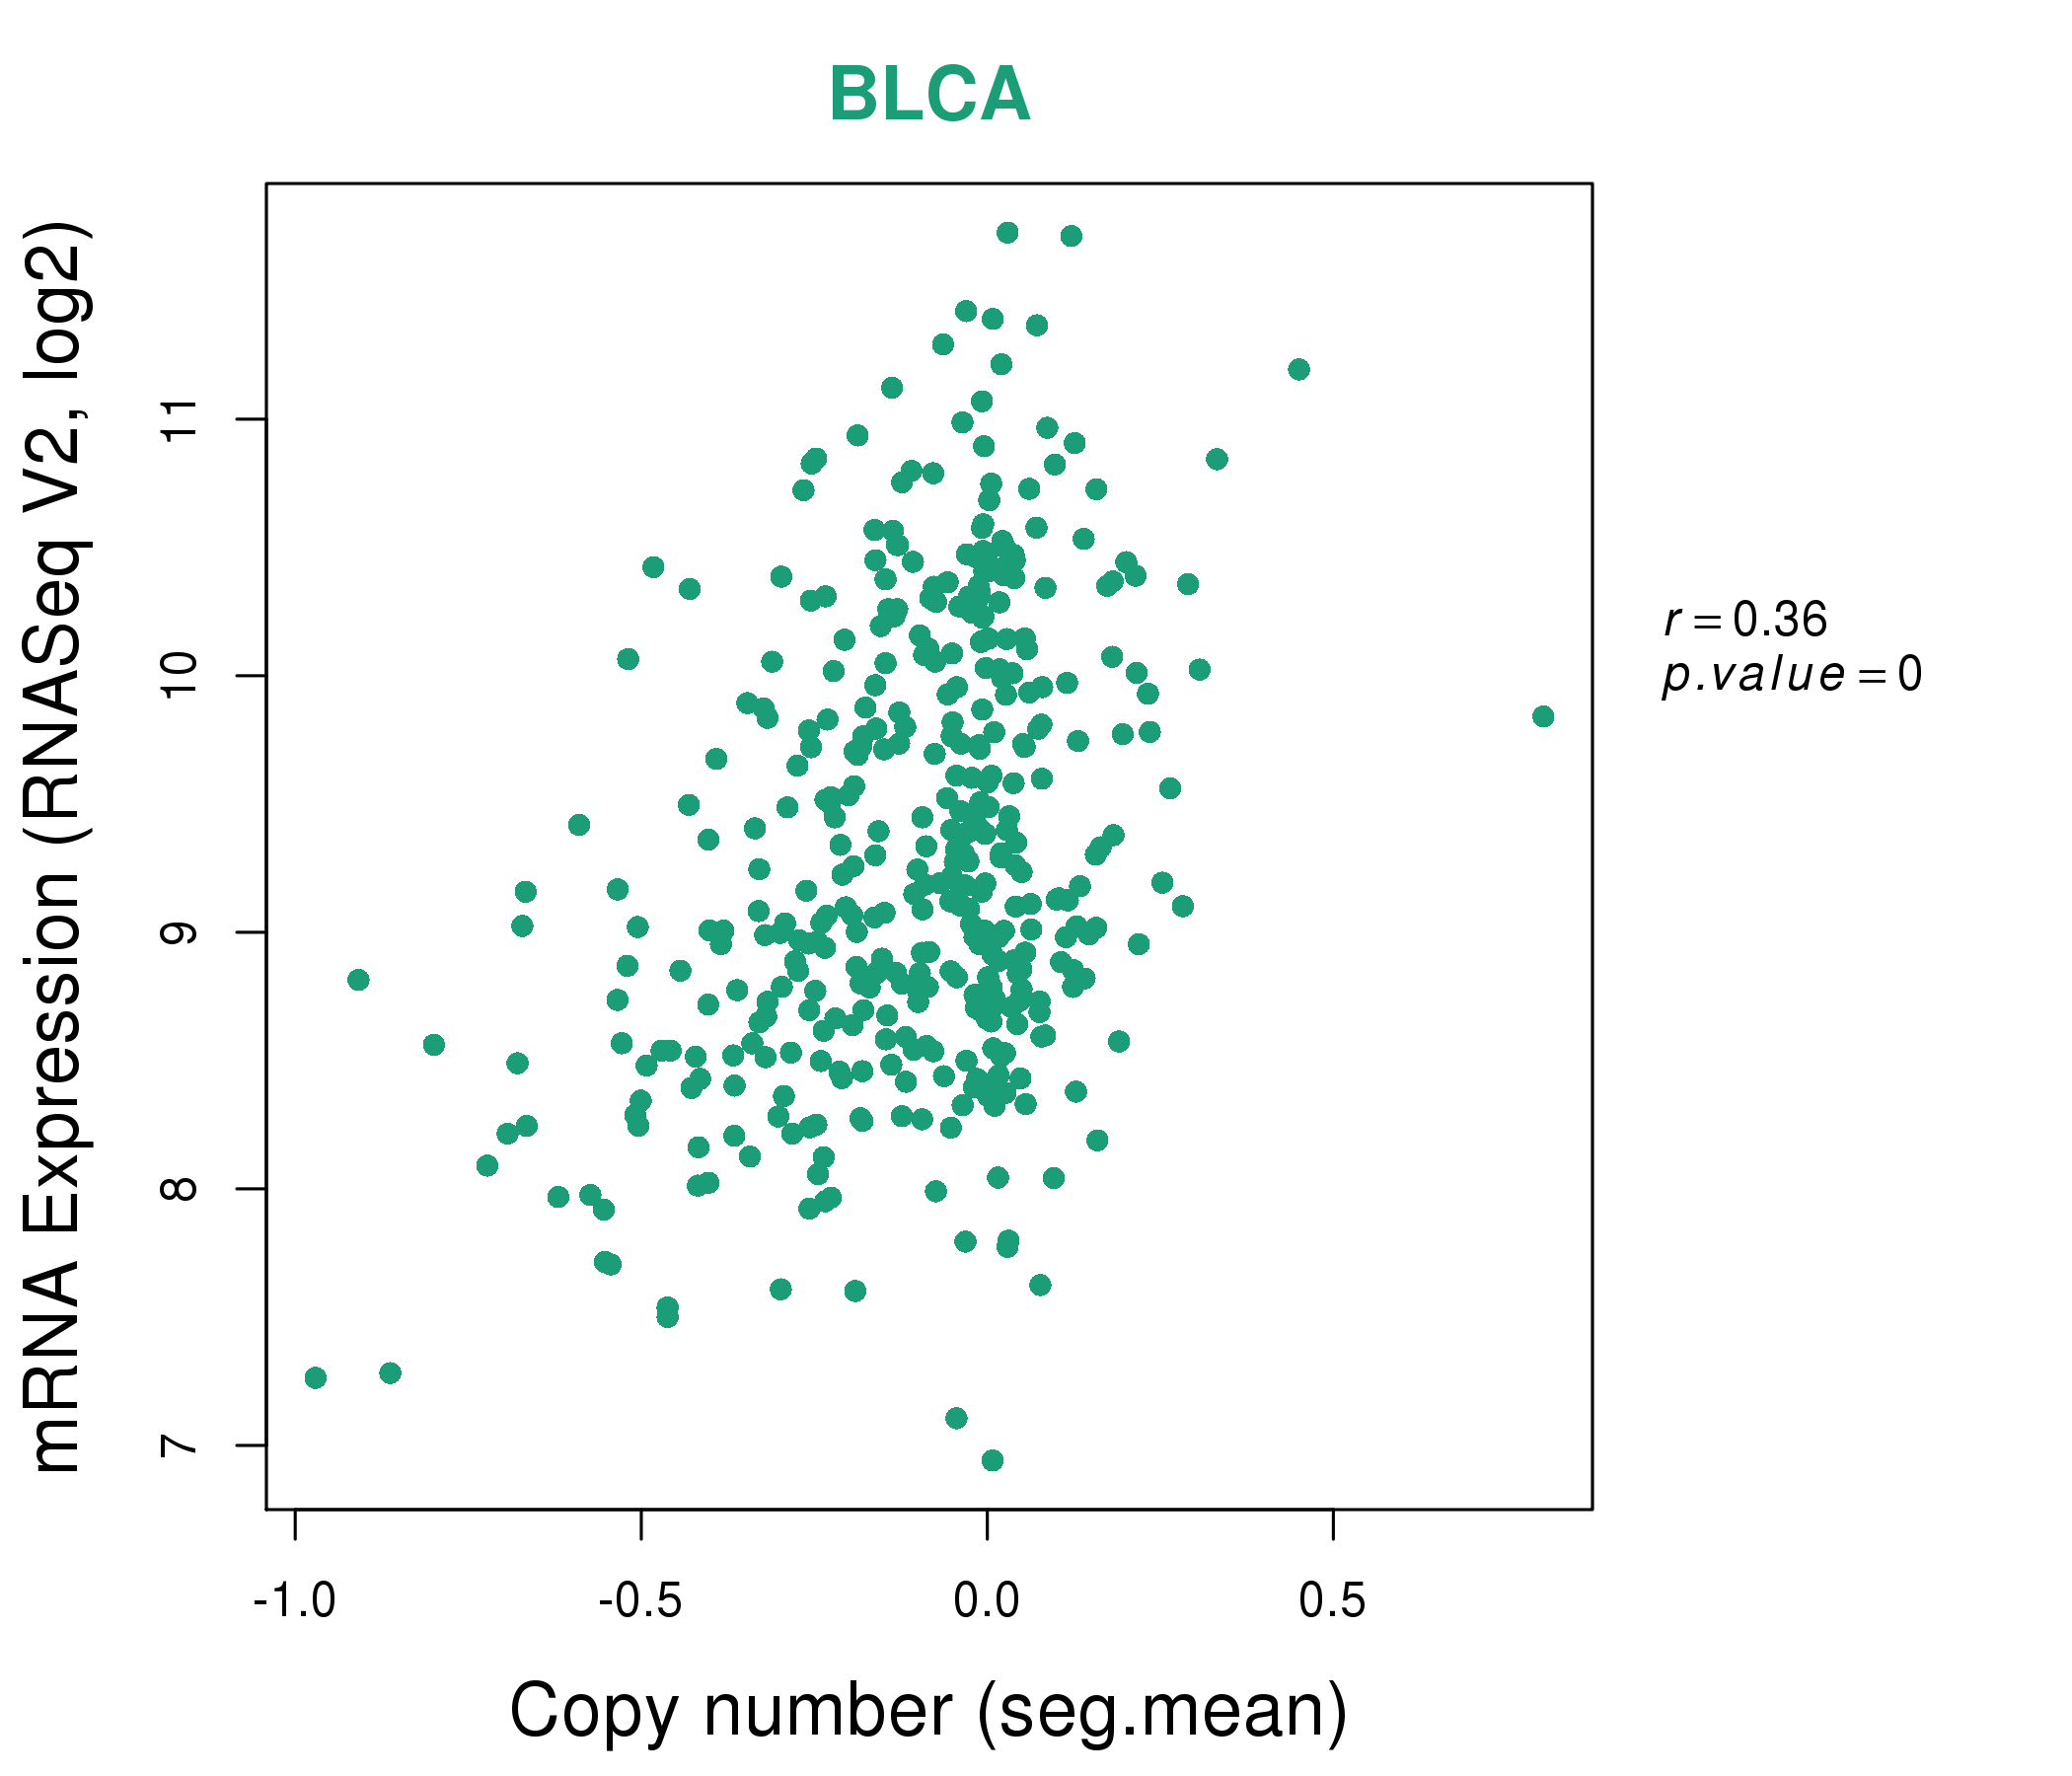
| * This plots show the correlation between CNV and gene expression. |
: Open all plots for all cancer types
 |
|
 |
|
| Top |
| Gene-Gene Network Information |
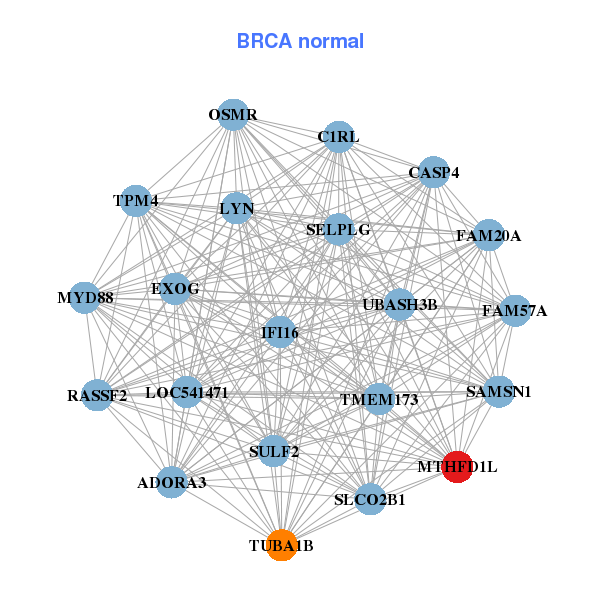
| * Co-Expression network figures were drawn using R package igraph. Only the top 20 genes with the highest correlations were shown. Red circle: input gene, orange circle: cell metabolism gene, sky circle: other gene |
: Open all plots for all cancer types
 |
|
| AMD1,ANKS6,CDC20,CTPS1,EXO5,COLGALT1,HMGA1, IFRD1,MPP6,MTHFD1L,NIP7,NUP93,PABPC4,PLEKHG1, PPP1R14C,PSAT1,TBPL1,ULBP1,YARS,YBX1,ZFP69B | ADORA3,C1RL,CASP4,EXOG,FAM20A,FAM57A,IFI16, LOC541471,LYN,MTHFD1L,MYD88,OSMR,RASSF2,SAMSN1, SELPLG,SLCO2B1,SULF2,TMEM173,TPM4,TUBA1B,UBASH3B |
 |
|
| CAD,CCDC86,CDCA5,CTPS1,EFTUD2,LMNB2,MCM4, MTHFD1L,NCAPD3,NCL,NLE1,NOLC1,POLR1A,SLC7A5, SSRP1,STC2,TCP1,TRAP1,XPO5,XPOT,YARS | CALR,CRELD2,DNAJC10,GARS,HM13,HSP90B1,HSPA5, HYOU1,IARS,IPO4,LRP8,MANF,MARS,MCM6, MTHFD1L,PDIA4,PKM,RUVBL1,SLC38A5,SRM,YARS |
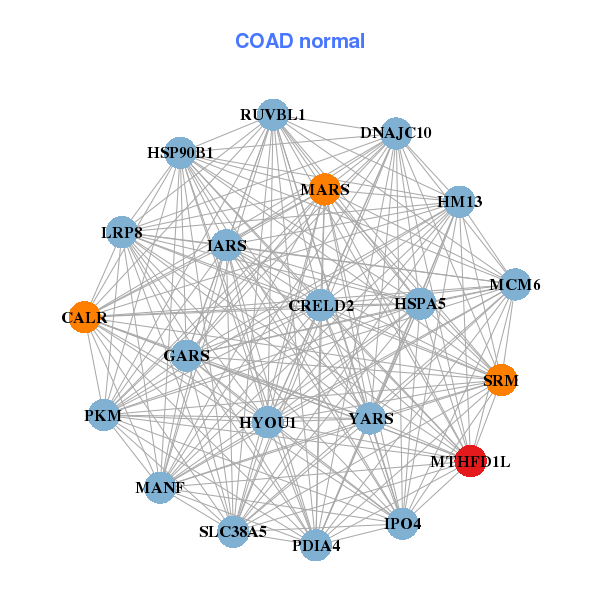
| * Co-Expression network figures were drawn using R package igraph. Only the top 20 genes with the highest correlations were shown. Red circle: input gene, orange circle: cell metabolism gene, sky circle: other gene |
: Open all plots for all cancer types
| Top |
: Open all interacting genes' information including KEGG pathway for all interacting genes from DAVID
| Top |
| Pharmacological Information for MTHFD1L |
| There's no related Drug. |
| Top |
| Cross referenced IDs for MTHFD1L |
| * We obtained these cross-references from Uniprot database. It covers 150 different DBs, 18 categories. http://www.uniprot.org/help/cross_references_section |
: Open all cross reference information
|
Copyright © 2016-Present - The Univsersity of Texas Health Science Center at Houston @ |