|
||||||||||||||||||||
| |
| Phenotypic Information (metabolism pathway, cancer, disease, phenome) |
| |
| |
| Gene-Gene Network Information: Co-Expression Network, Interacting Genes & KEGG |
| |
|


| Gene Summary for GALNT3 |
| Basic gene info. | Gene symbol | GALNT3 |
| Gene name | polypeptide N-acetylgalactosaminyltransferase 3 | |
| Synonyms | GalNAc-T3|HFTC|HHS | |
| Cytomap | UCSC genome browser: 2q24-q31 | |
| Genomic location | chr2 :166604312-166650803 | |
| Type of gene | protein-coding | |
| RefGenes | NM_004482.3, | |
| Ensembl id | ENSG00000115339 | |
| Description | GalNAc transferase 3UDP-GalNAc:polypeptide N-acetylgalactosaminyltransferase 3UDP-N-acetyl-alpha-D-galactosamine:polypeptide N-acetylgalactosaminyltransferase 3 (GalNAc-T3)polypeptide GalNAc transferase 3polypeptide GalNAc-transferase T3pp-GaNTase 3 | |
| Modification date | 20141219 | |
| dbXrefs | MIM : 601756 | |
| HGNC : HGNC | ||
| Ensembl : ENSG00000115339 | ||
| HPRD : 03453 | ||
| Vega : OTTHUMG00000132157 | ||
| Protein | UniProt: go to UniProt's Cross Reference DB Table | |
| Expression | CleanEX: HS_GALNT3 | |
| BioGPS: 2591 | ||
| Gene Expression Atlas: ENSG00000115339 | ||
| The Human Protein Atlas: ENSG00000115339 | ||
| Pathway | NCI Pathway Interaction Database: GALNT3 | |
| KEGG: GALNT3 | ||
| REACTOME: GALNT3 | ||
| ConsensusPathDB | ||
| Pathway Commons: GALNT3 | ||
| Metabolism | MetaCyc: GALNT3 | |
| HUMANCyc: GALNT3 | ||
| Regulation | Ensembl's Regulation: ENSG00000115339 | |
| miRBase: chr2 :166,604,312-166,650,803 | ||
| TargetScan: NM_004482 | ||
| cisRED: ENSG00000115339 | ||
| Context | iHOP: GALNT3 | |
| cancer metabolism search in PubMed: GALNT3 | ||
| UCL Cancer Institute: GALNT3 | ||
| Assigned class in ccmGDB | C | |
| Top |
| Phenotypic Information for GALNT3(metabolism pathway, cancer, disease, phenome) |
| Cancer | CGAP: GALNT3 |
| Familial Cancer Database: GALNT3 | |
| * This gene is included in those cancer gene databases. |
|
|
|
|
|
| . | ||||||||||||||
Oncogene 1 | Significant driver gene in | |||||||||||||||||||
| cf) number; DB name 1 Oncogene; http://nar.oxfordjournals.org/content/35/suppl_1/D721.long, 2 Tumor Suppressor gene; https://bioinfo.uth.edu/TSGene/, 3 Cancer Gene Census; http://www.nature.com/nrc/journal/v4/n3/abs/nrc1299.html, 4 CancerGenes; http://nar.oxfordjournals.org/content/35/suppl_1/D721.long, 5 Network of Cancer Gene; http://ncg.kcl.ac.uk/index.php, 1Therapeutic Vulnerabilities in Cancer; http://cbio.mskcc.org/cancergenomics/statius/ |
| REACTOME_METABOLISM_OF_PROTEINS | |
| OMIM | |
| Orphanet | |
| Disease | KEGG Disease: GALNT3 |
| MedGen: GALNT3 (Human Medical Genetics with Condition) | |
| ClinVar: GALNT3 | |
| Phenotype | MGI: GALNT3 (International Mouse Phenotyping Consortium) |
| PhenomicDB: GALNT3 | |
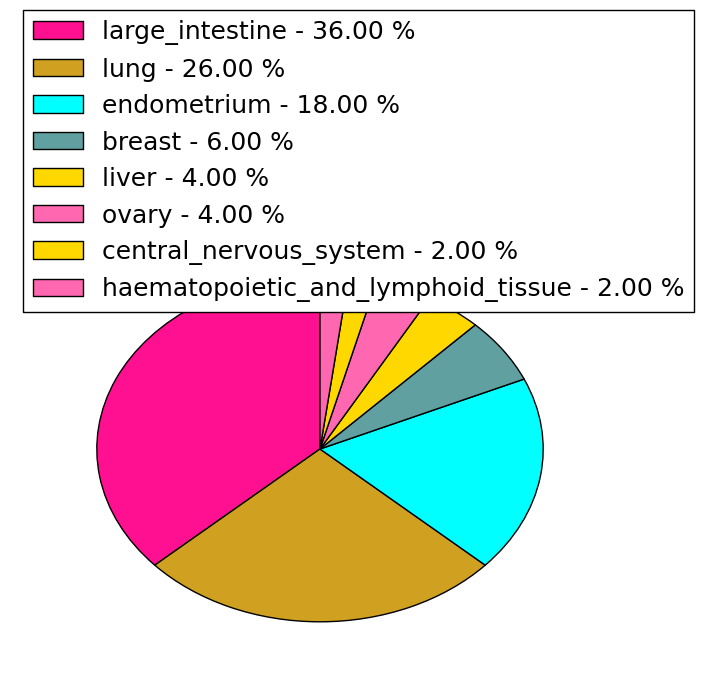
| Mutations for GALNT3 |
| * Under tables are showing count per each tissue to give us broad intuition about tissue specific mutation patterns.You can go to the detailed page for each mutation database's web site. |
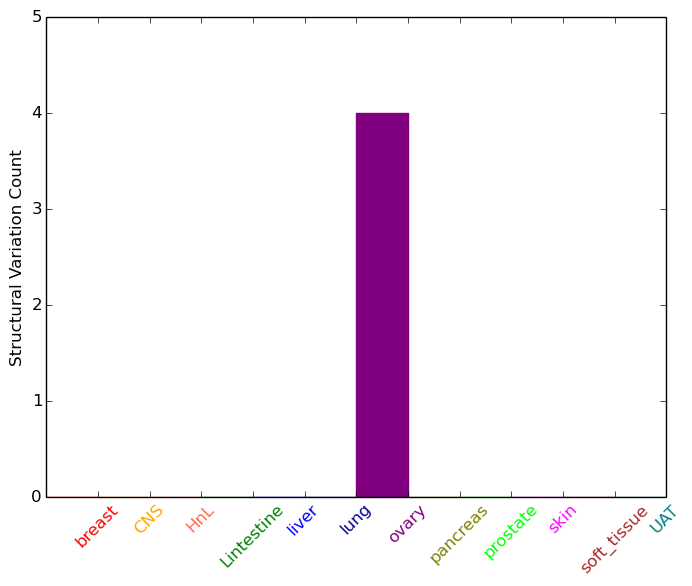
| - Statistics for Tissue and Mutation type | Top |
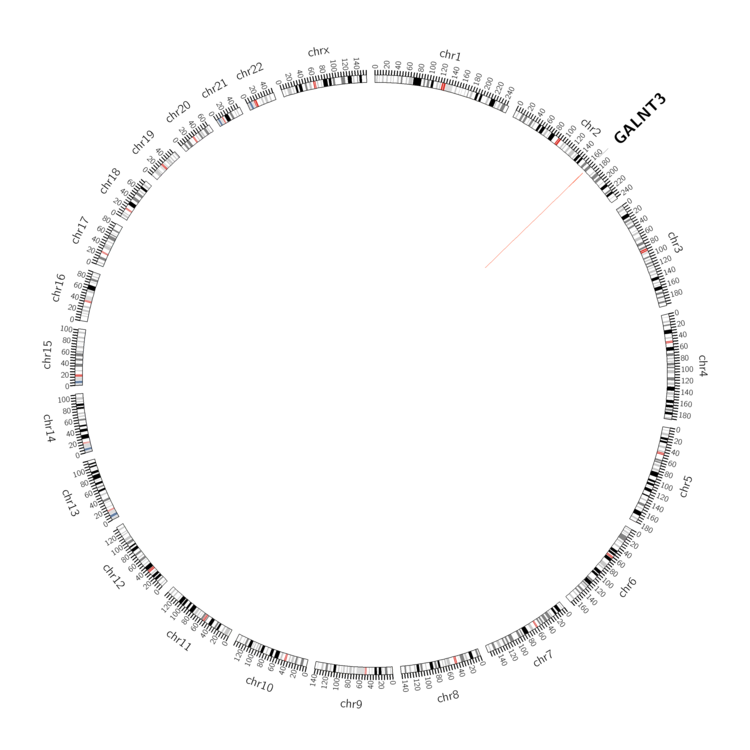 |
| - For Inter-chromosomal Variations |
| There's no inter-chromosomal structural variation. |
| - For Intra-chromosomal Variations |
| * Intra-chromosomal variantions includes 'intrachromosomal amplicon to amplicon', 'intrachromosomal amplicon to non-amplified dna', 'intrachromosomal deletion', 'intrachromosomal fold-back inversion', 'intrachromosomal inversion', 'intrachromosomal tandem duplication', 'Intrachromosomal unknown type', 'intrachromosomal with inverted orientation', 'intrachromosomal with non-inverted orientation'. |
 |
| Sample | Symbol_a | Chr_a | Start_a | End_a | Symbol_b | Chr_b | Start_b | End_b |
| ovary | GALNT3 | chr2 | 166629770 | 166629790 | GALNT3 | chr2 | 166604433 | 166604453 |
| cf) Tissue number; Tissue name (1;Breast, 2;Central_nervous_system, 3;Haematopoietic_and_lymphoid_tissue, 4;Large_intestine, 5;Liver, 6;Lung, 7;Ovary, 8;Pancreas, 9;Prostate, 10;Skin, 11;Soft_tissue, 12;Upper_aerodigestive_tract) |
| * From mRNA Sanger sequences, Chitars2.0 arranged chimeric transcripts. This table shows GALNT3 related fusion information. |
| ID | Head Gene | Tail Gene | Accession | Gene_a | qStart_a | qEnd_a | Chromosome_a | tStart_a | tEnd_a | Gene_a | qStart_a | qEnd_a | Chromosome_a | tStart_a | tEnd_a |
| BF902896 | GALNT3 | 1 | 54 | 2 | 166611225 | 166611481 | ABCA7 | 52 | 297 | 19 | 1056082 | 1056413 | |
| Top |
| There's no copy number variation information in COSMIC data for this gene. |
| Top |
|
 |
| Top |
| Stat. for Non-Synonymous SNVs (# total SNVs=49) | (# total SNVs=18) |
 |  |
(# total SNVs=2) | (# total SNVs=0) |
 |
| Top |
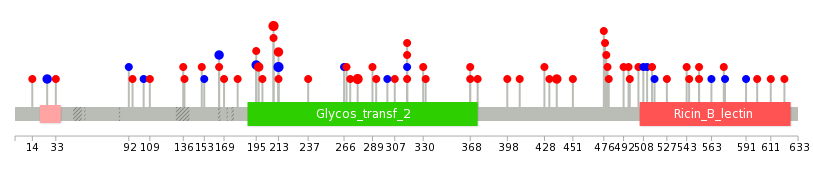
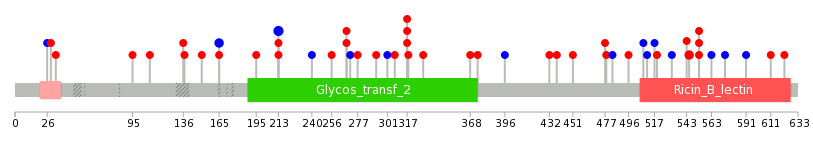
| * When you move the cursor on each content, you can see more deailed mutation information on the Tooltip. Those are primary_site,primary_histology,mutation(aa),pubmedID. |
| GRCh37 position | Mutation(aa) | Unique sampleID count |
| chr2:166621457-166621457 | p.L209F | 4 |
| chr2:166621443-166621443 | p.P213P | 3 |
| chr2:166618424-166618424 | p.D277H | 3 |
| chr2:166613637-166613637 | p.R438C | 2 |
| chr2:166626716-166626716 | p.G165G | 2 |
| chr2:166615969-166615969 | p.N317S | 2 |
| chr2:166627133-166627133 | p.V26V | 2 |
| chr2:166621445-166621445 | p.P213S | 2 |
| chr2:166621492-166621492 | p.A197V | 2 |
| chr2:166621497-166621497 | p.N195N | 2 |
| Top |
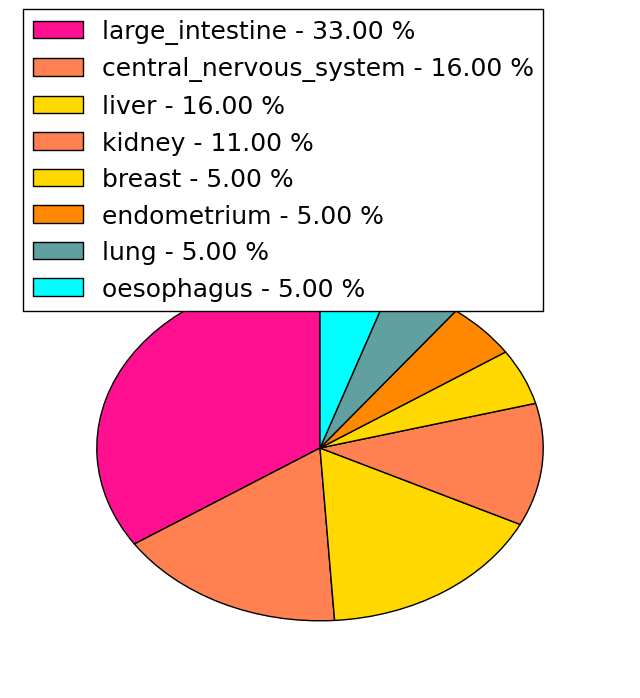
|
 |
| Point Mutation/ Tissue ID | 1 | 2 | 3 | 4 | 5 | 6 | 7 | 8 | 9 | 10 | 11 | 12 | 13 | 14 | 15 | 16 | 17 | 18 | 19 | 20 |
| # sample | 1 | 15 | 2 | 4 | 2 | 8 | 2 | 1 | 6 | 5 | 8 | |||||||||
| # mutation | 1 | 12 | 2 | 4 | 2 | 8 | 3 | 1 | 6 | 5 | 9 | |||||||||
| nonsynonymous SNV | 1 | 9 | 3 | 8 | 3 | 1 | 3 | 2 | 8 | |||||||||||
| synonymous SNV | 3 | 2 | 1 | 2 | 3 | 3 | 1 |
| cf) Tissue ID; Tissue type (1; BLCA[Bladder Urothelial Carcinoma], 2; BRCA[Breast invasive carcinoma], 3; CESC[Cervical squamous cell carcinoma and endocervical adenocarcinoma], 4; COAD[Colon adenocarcinoma], 5; GBM[Glioblastoma multiforme], 6; Glioma Low Grade, 7; HNSC[Head and Neck squamous cell carcinoma], 8; KICH[Kidney Chromophobe], 9; KIRC[Kidney renal clear cell carcinoma], 10; KIRP[Kidney renal papillary cell carcinoma], 11; LAML[Acute Myeloid Leukemia], 12; LUAD[Lung adenocarcinoma], 13; LUSC[Lung squamous cell carcinoma], 14; OV[Ovarian serous cystadenocarcinoma ], 15; PAAD[Pancreatic adenocarcinoma], 16; PRAD[Prostate adenocarcinoma], 17; SKCM[Skin Cutaneous Melanoma], 18:STAD[Stomach adenocarcinoma], 19:THCA[Thyroid carcinoma], 20:UCEC[Uterine Corpus Endometrial Carcinoma]) |
| Top |
| * We represented just top 10 SNVs. When you move the cursor on each content, you can see more deailed mutation information on the Tooltip. Those are primary_site, primary_histology, mutation(aa), pubmedID. |
| Genomic Position | Mutation(aa) | Unique sampleID count |
| chr2:166621443 | p.P213P | 3 |
| chr2:166626716 | p.A268T | 2 |
| chr2:166618451 | p.R553Q | 2 |
| chr2:166615969 | p.E545K | 2 |
| chr2:166606373 | p.G165G | 2 |
| chr2:166606398 | p.N317S | 2 |
| chr2:166606403 | p.P109A | 1 |
| chr2:166613637 | p.Y508Y | 1 |
| chr2:166616044 | p.V301V | 1 |
| chr2:166611170 | p.R95I | 1 |
| * Copy number data were extracted from TCGA using R package TCGA-Assembler. The URLs of all public data files on TCGA DCC data server were gathered on Jan-05-2015. Function ProcessCNAData in TCGA-Assembler package was used to obtain gene-level copy number value which is calculated as the average copy number of the genomic region of a gene. |
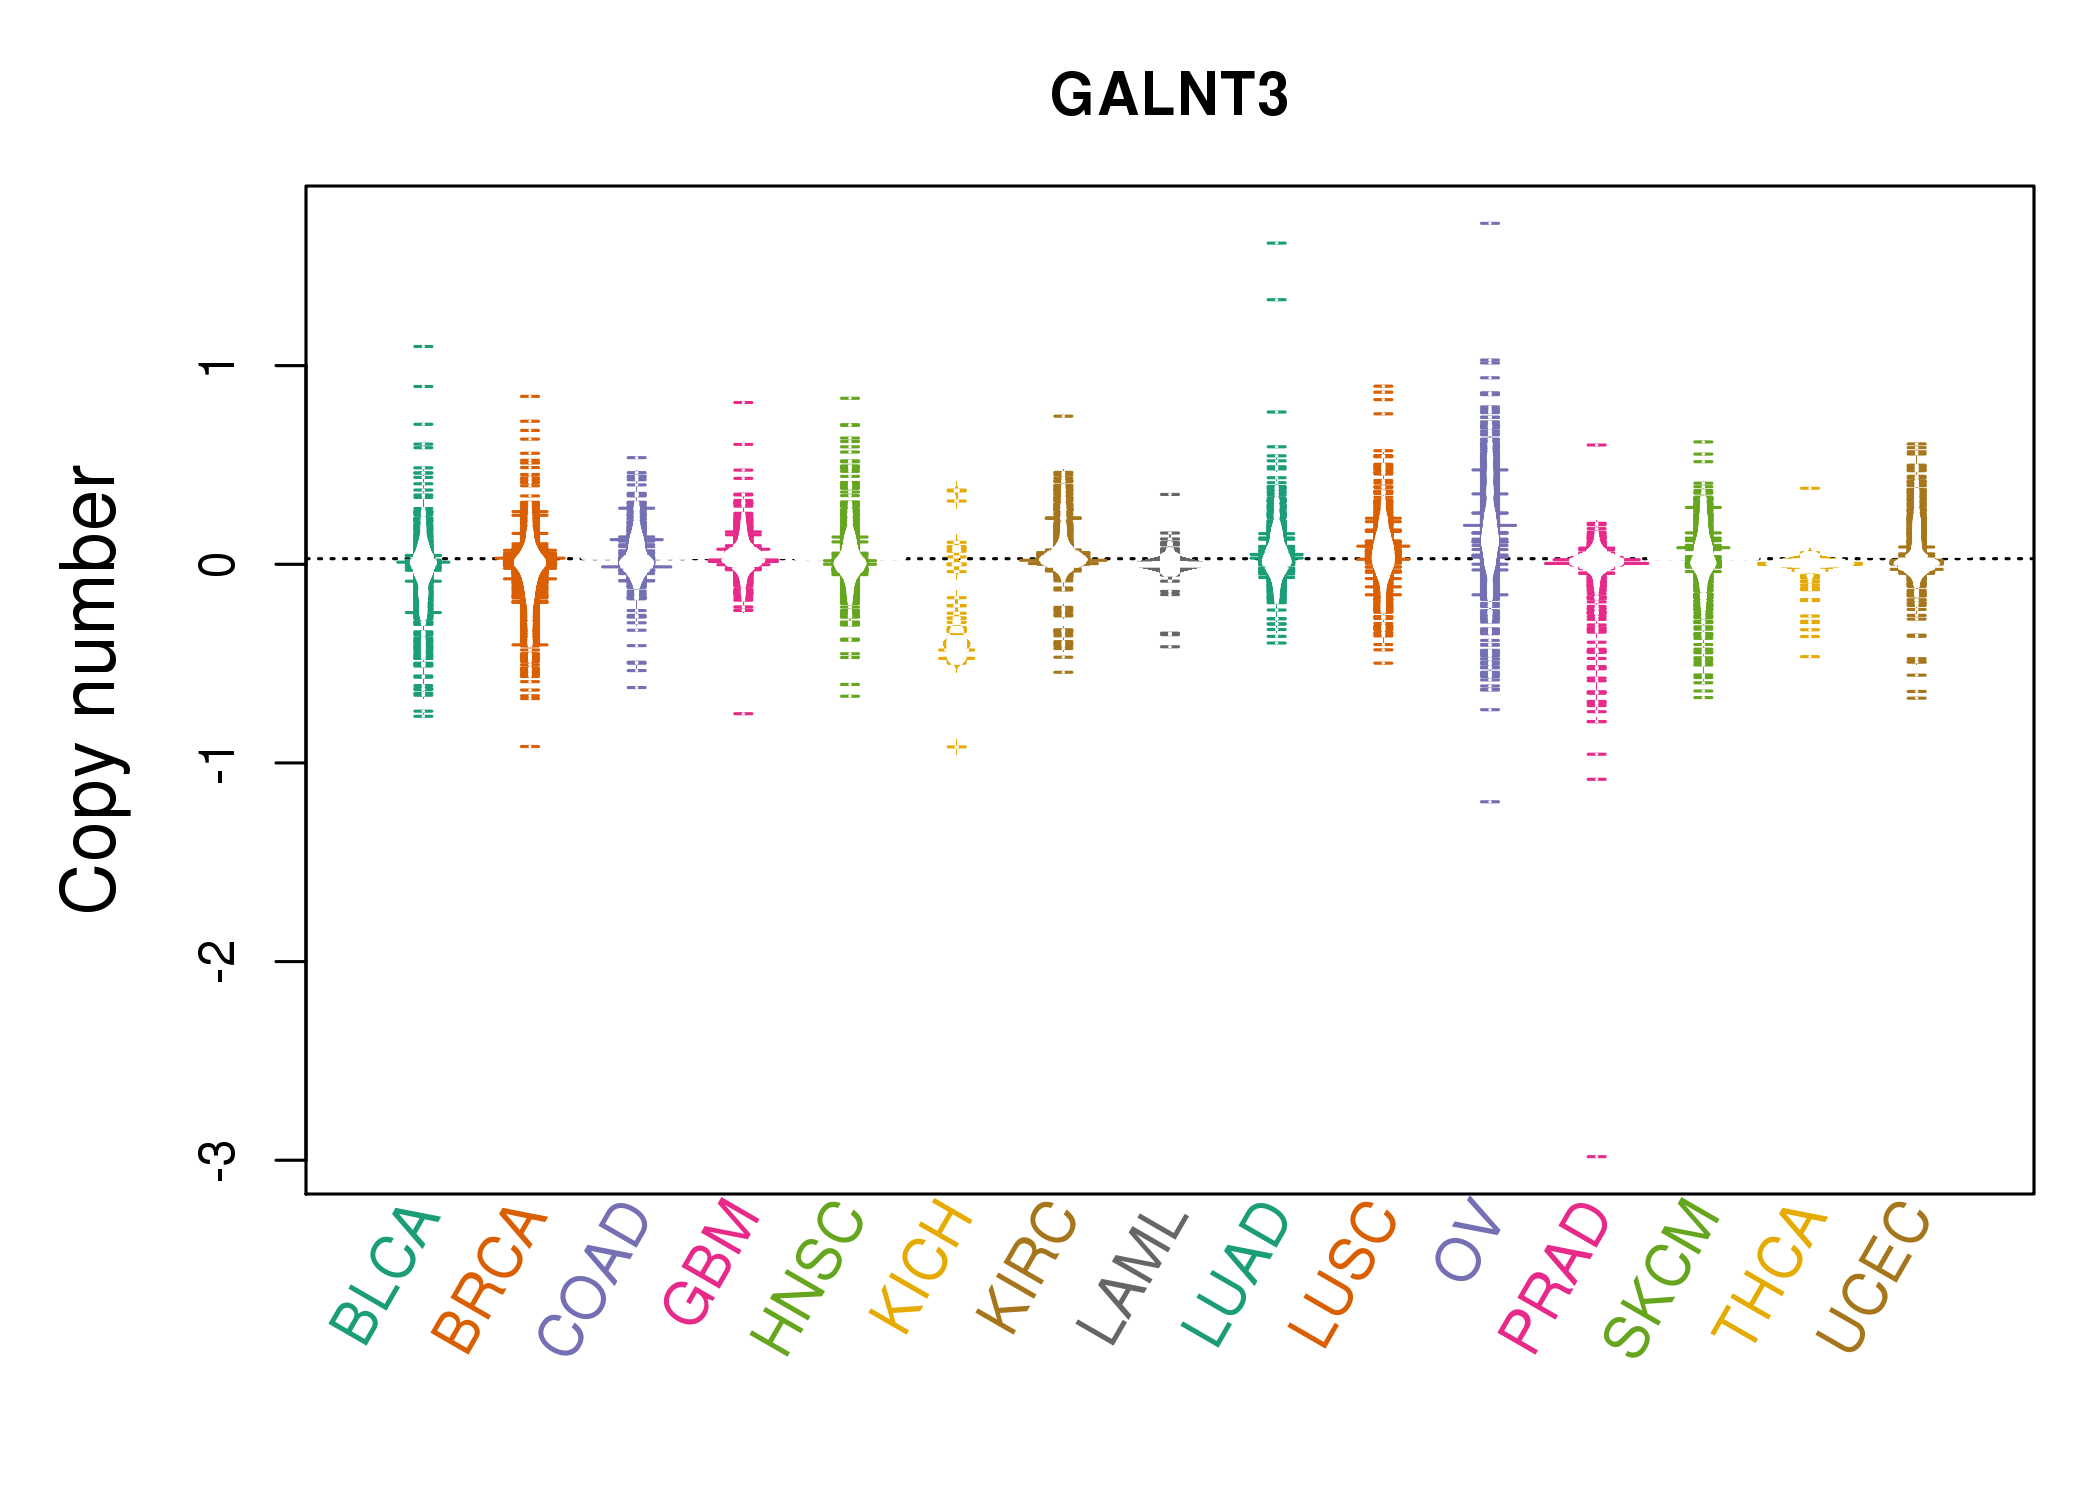 |
| cf) Tissue ID[Tissue type]: BLCA[Bladder Urothelial Carcinoma], BRCA[Breast invasive carcinoma], CESC[Cervical squamous cell carcinoma and endocervical adenocarcinoma], COAD[Colon adenocarcinoma], GBM[Glioblastoma multiforme], Glioma Low Grade, HNSC[Head and Neck squamous cell carcinoma], KICH[Kidney Chromophobe], KIRC[Kidney renal clear cell carcinoma], KIRP[Kidney renal papillary cell carcinoma], LAML[Acute Myeloid Leukemia], LUAD[Lung adenocarcinoma], LUSC[Lung squamous cell carcinoma], OV[Ovarian serous cystadenocarcinoma ], PAAD[Pancreatic adenocarcinoma], PRAD[Prostate adenocarcinoma], SKCM[Skin Cutaneous Melanoma], STAD[Stomach adenocarcinoma], THCA[Thyroid carcinoma], UCEC[Uterine Corpus Endometrial Carcinoma] |
| Top |
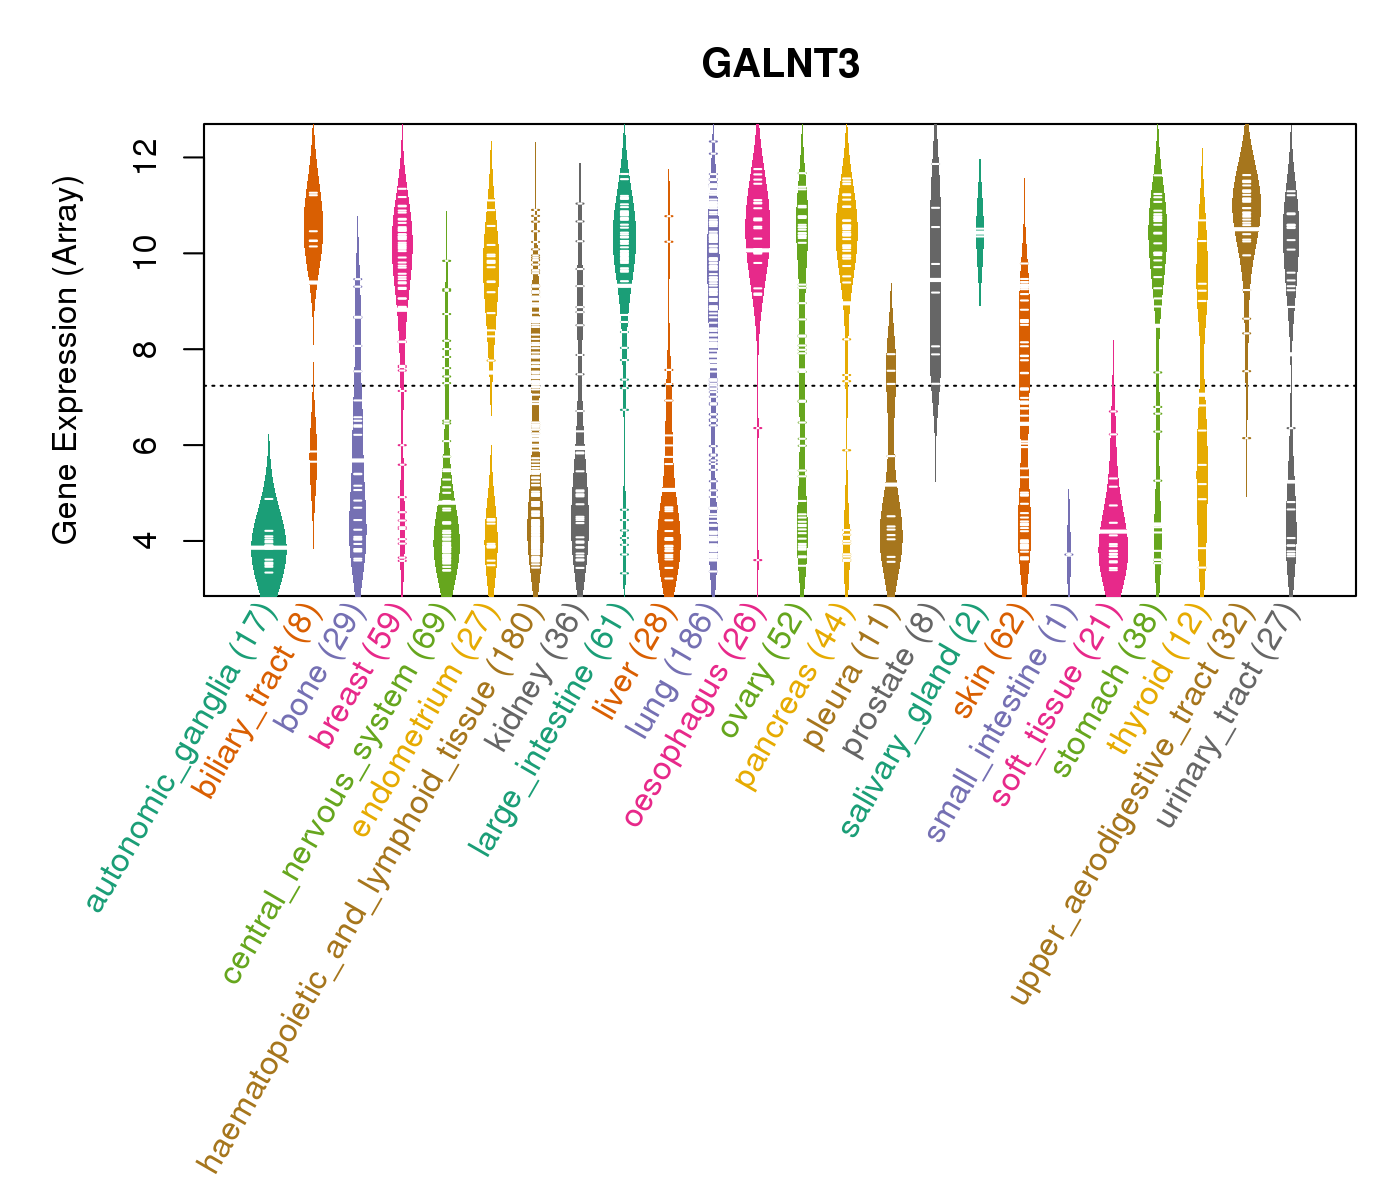
| Gene Expression for GALNT3 |
| * CCLE gene expression data were extracted from CCLE_Expression_Entrez_2012-10-18.res: Gene-centric RMA-normalized mRNA expression data. |
 |
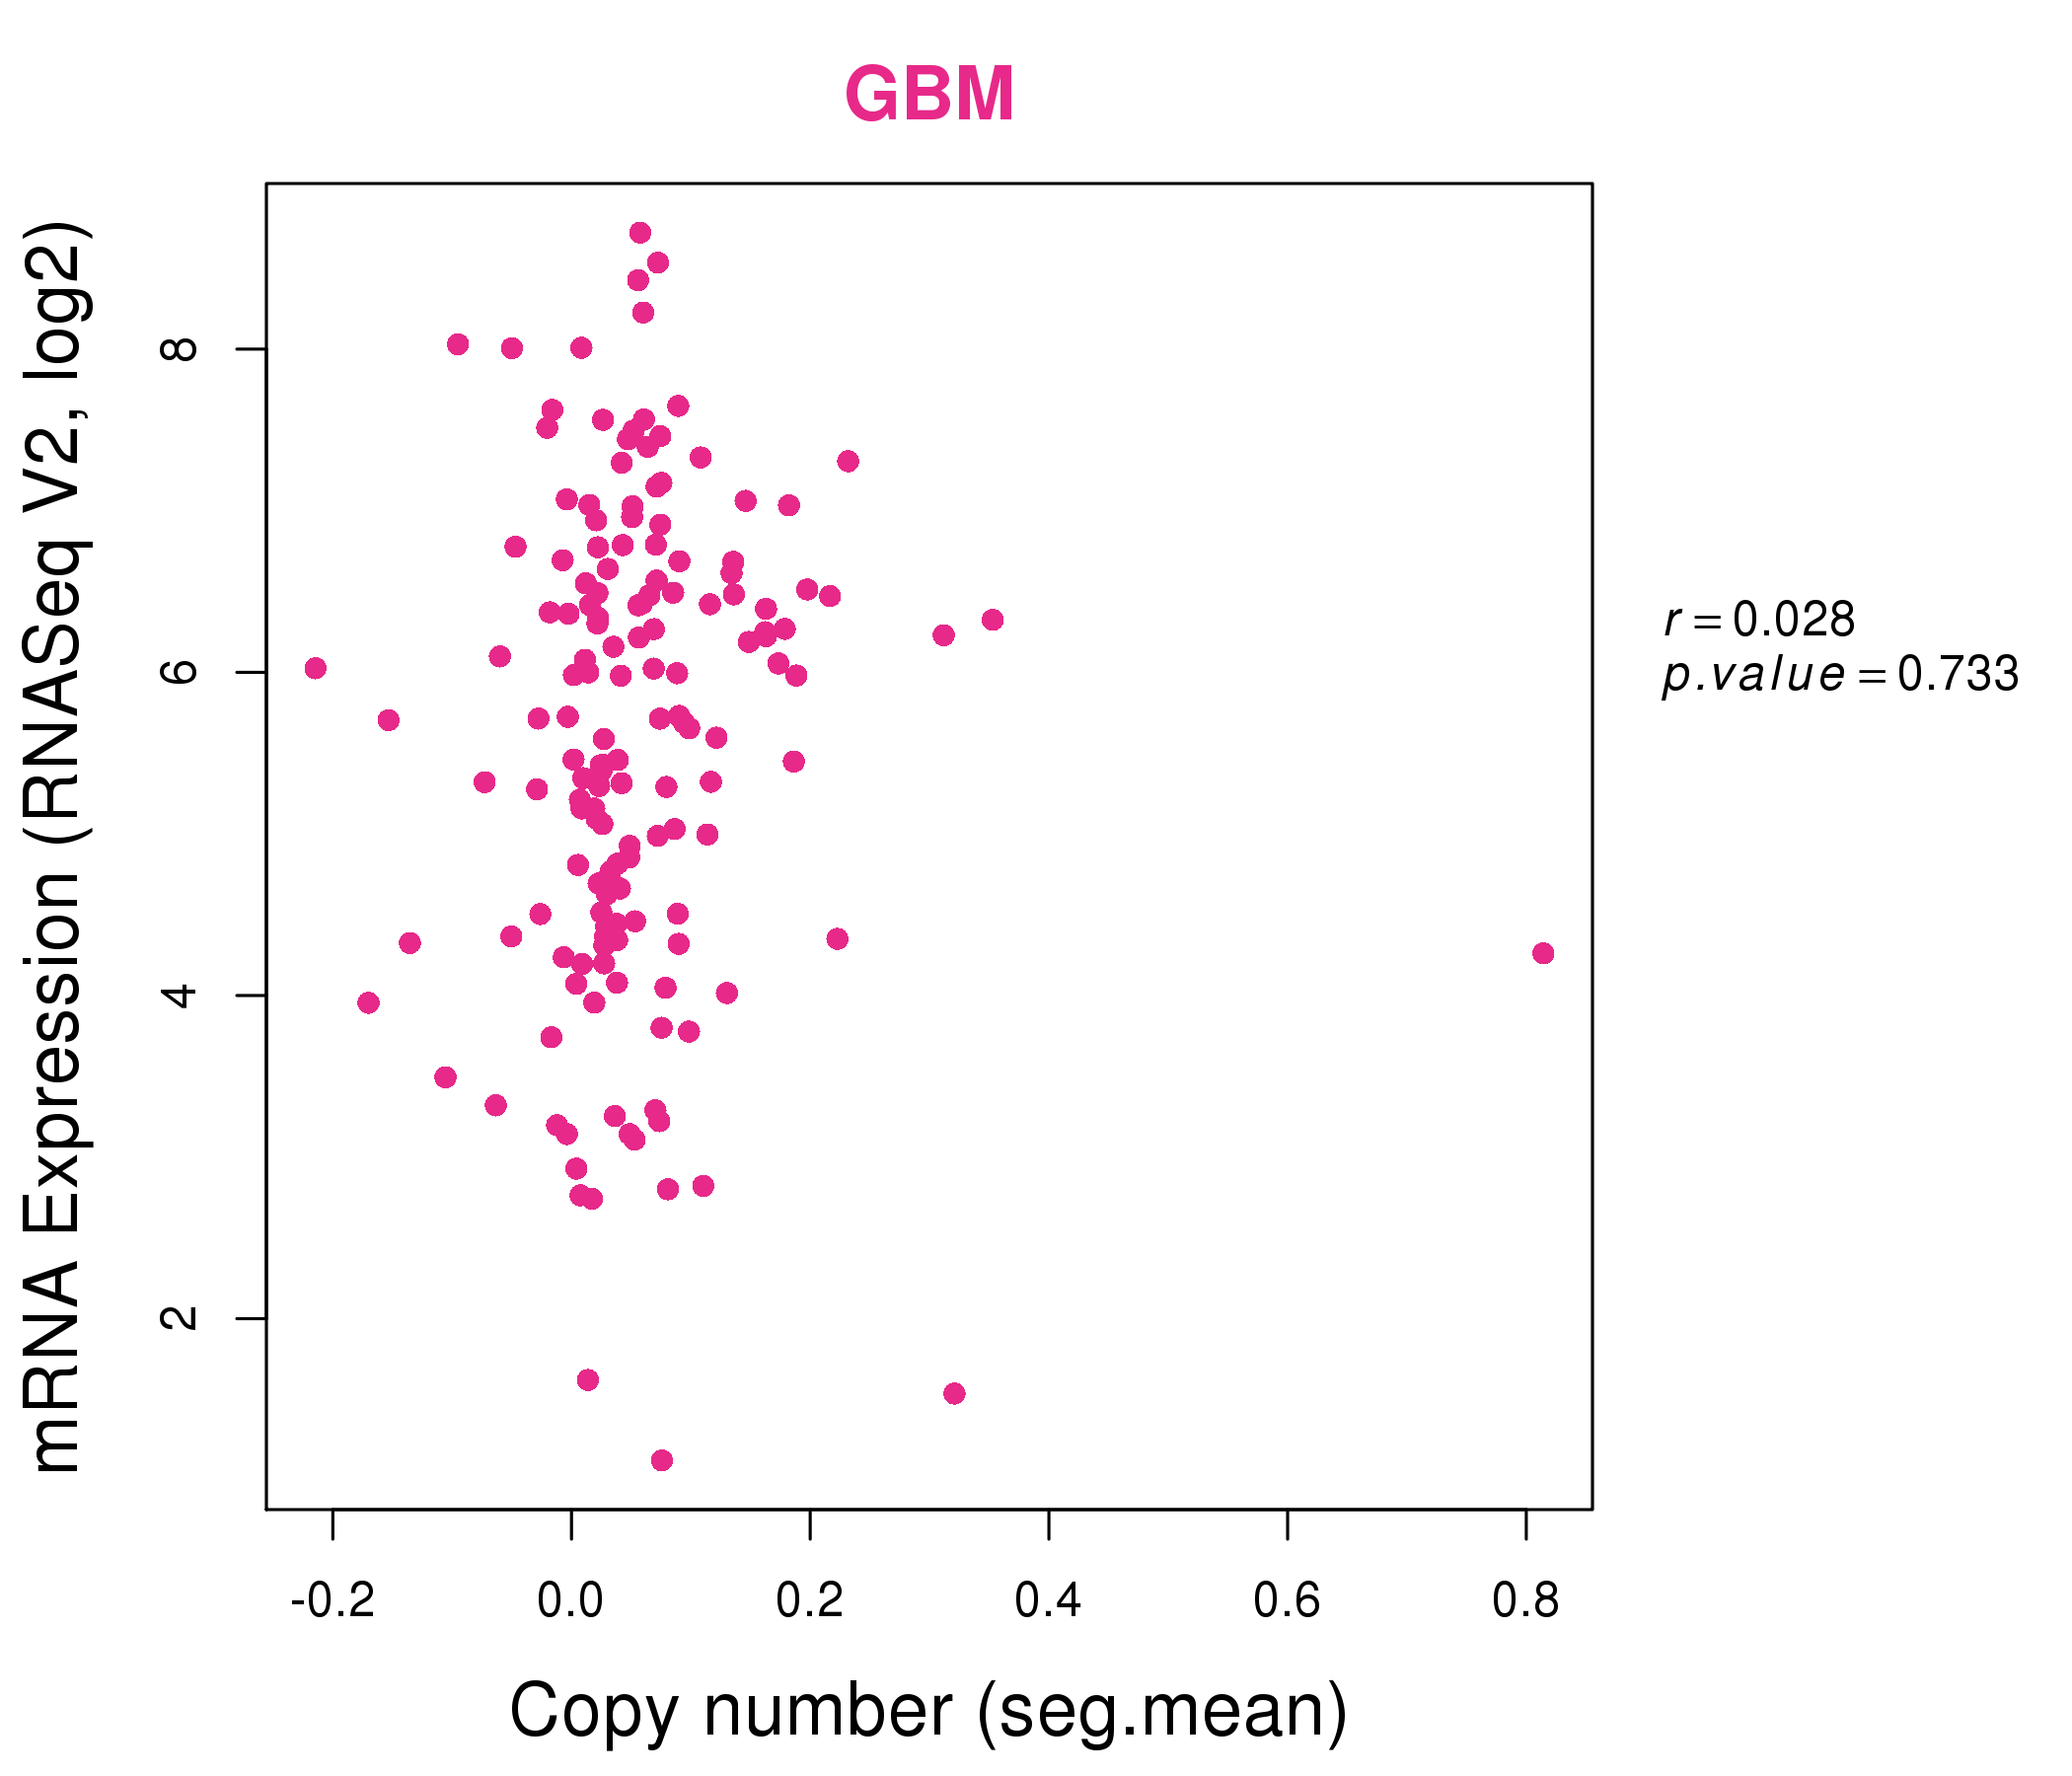
| * Normalized gene expression data of RNASeqV2 was extracted from TCGA using R package TCGA-Assembler. The URLs of all public data files on TCGA DCC data server were gathered at Jan-05-2015. Only eight cancer types have enough normal control samples for differential expression analysis. (t test, adjusted p<0.05 (using Benjamini-Hochberg FDR)) |
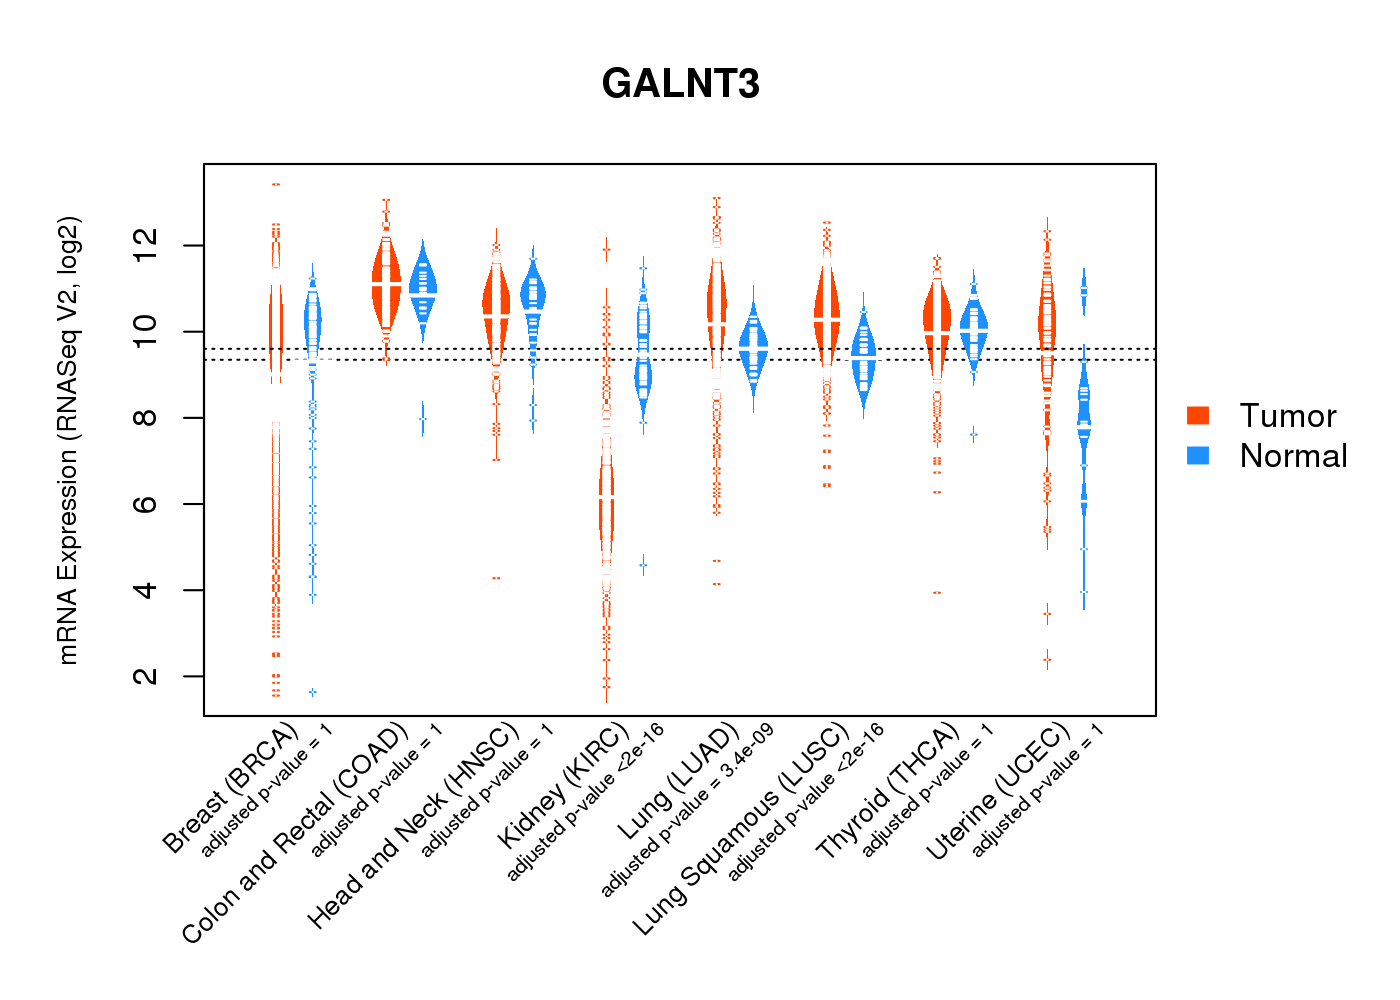 |
| Top |
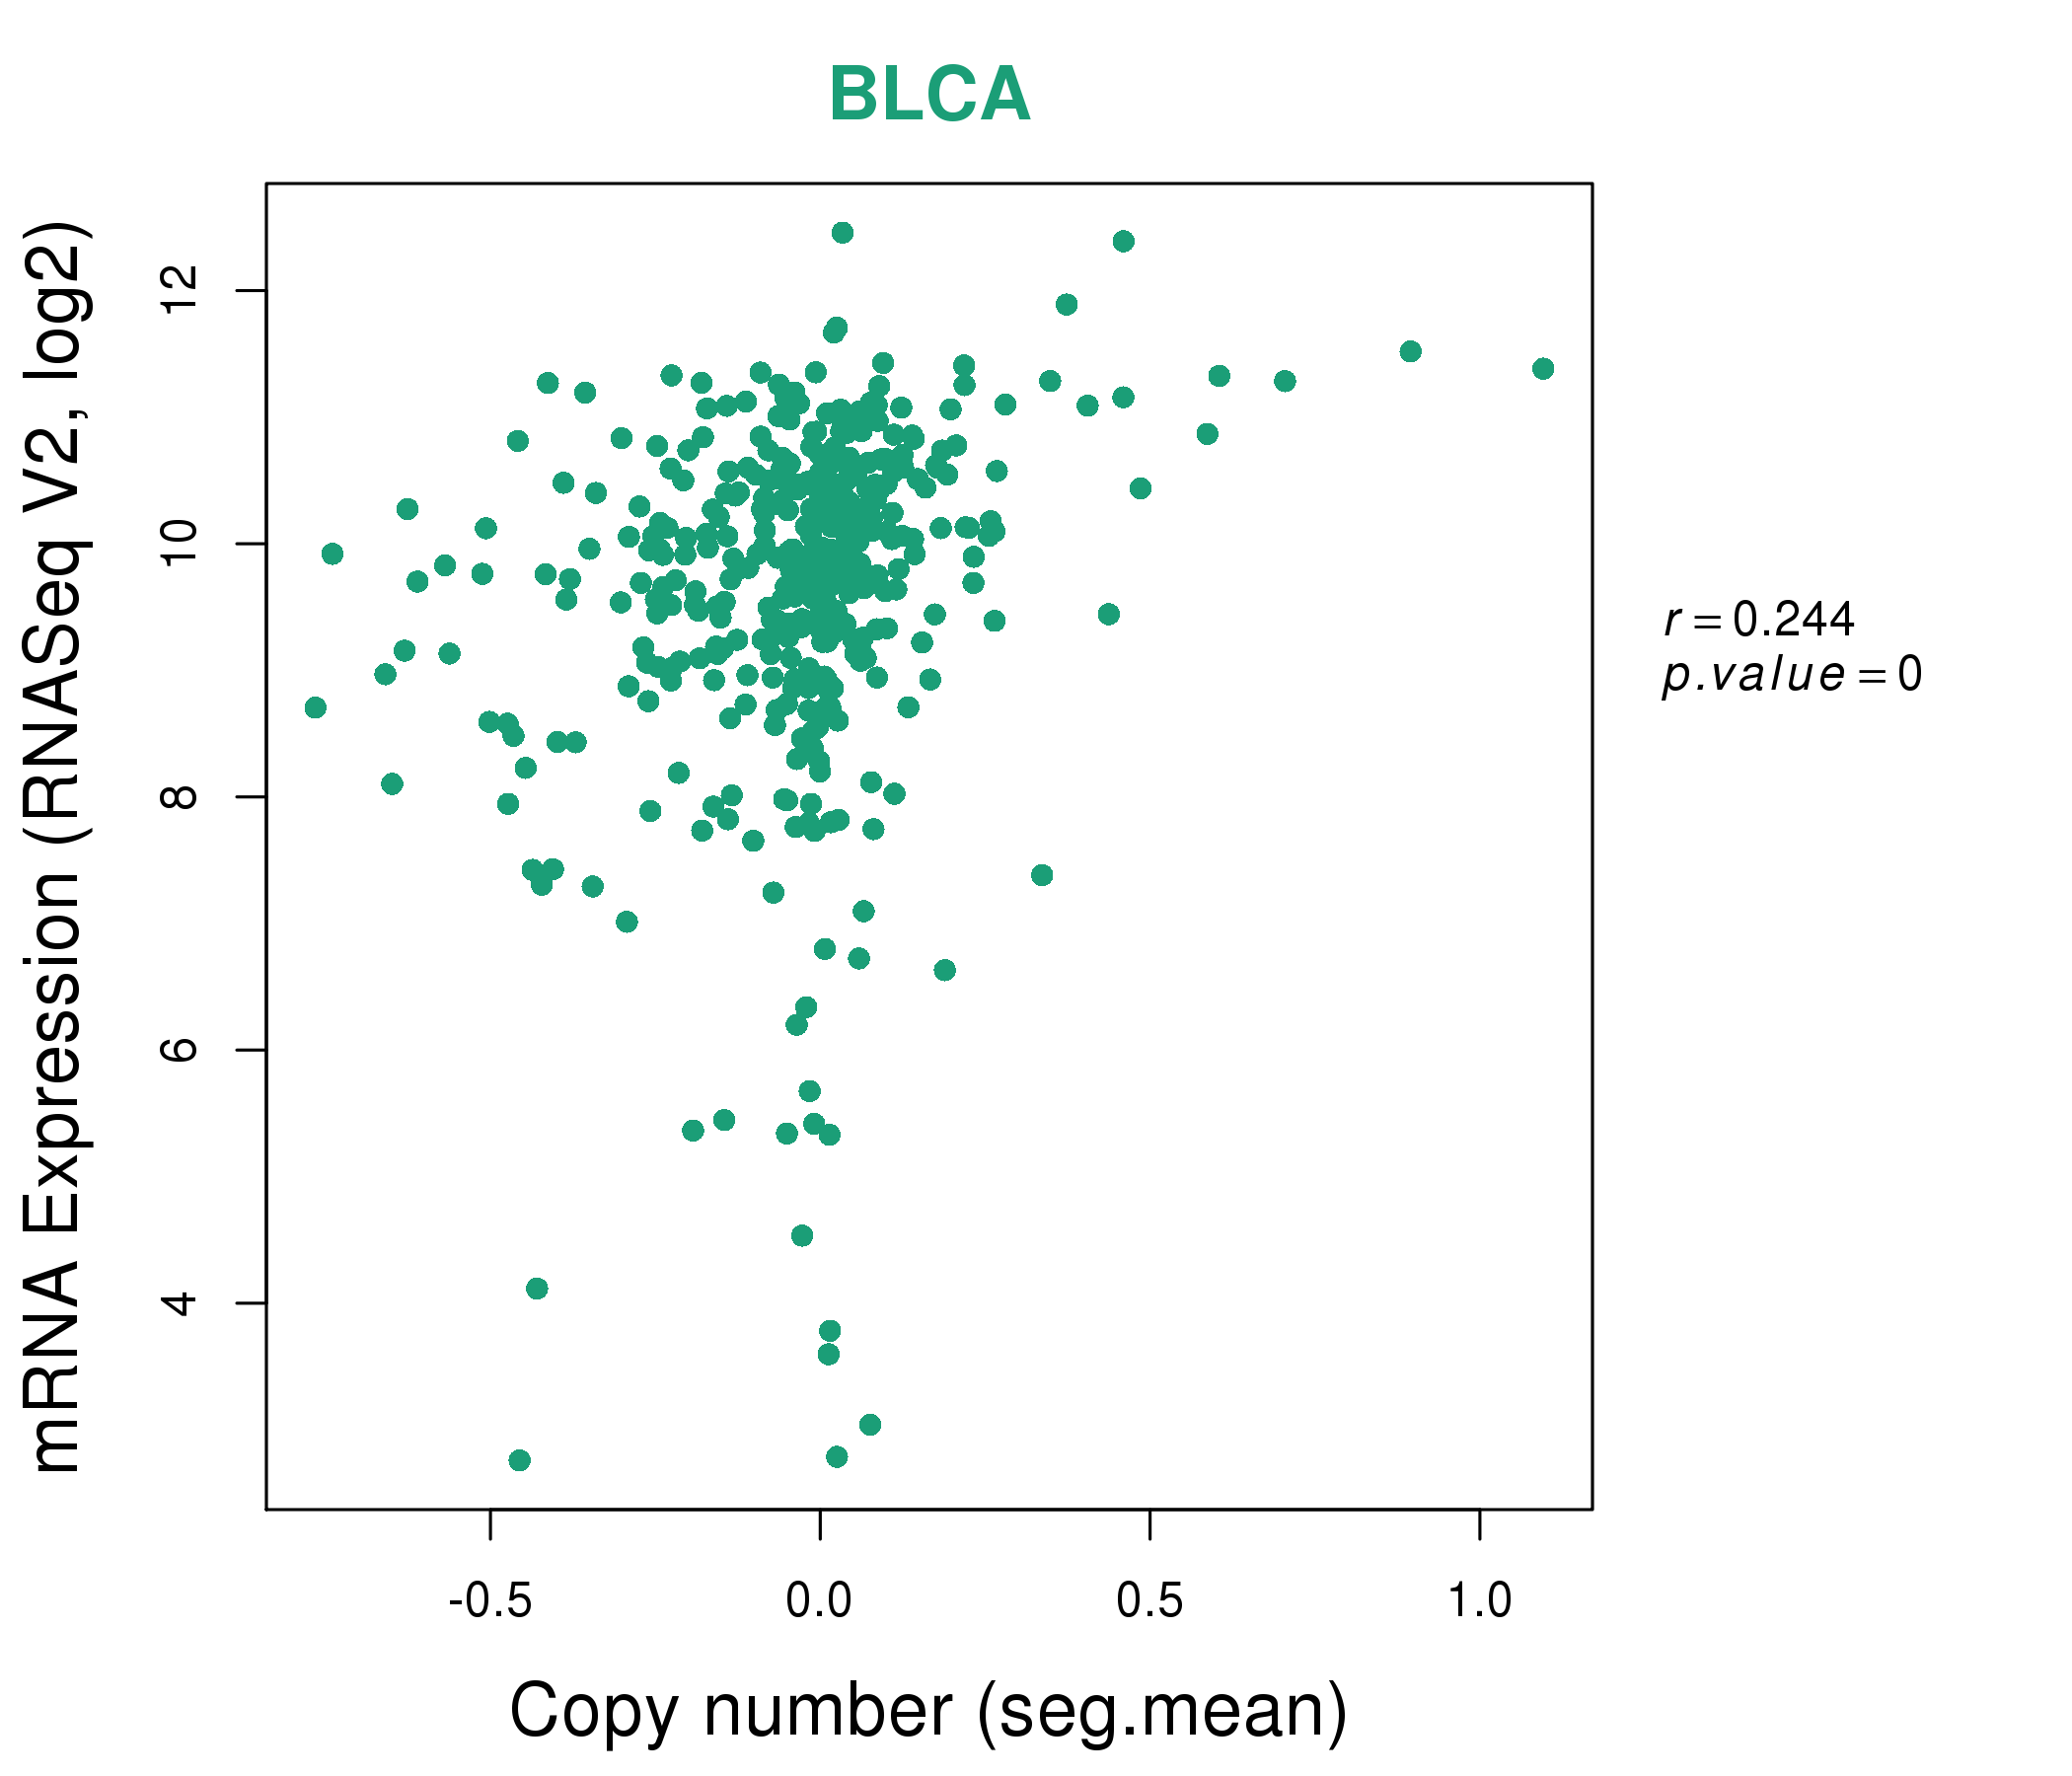
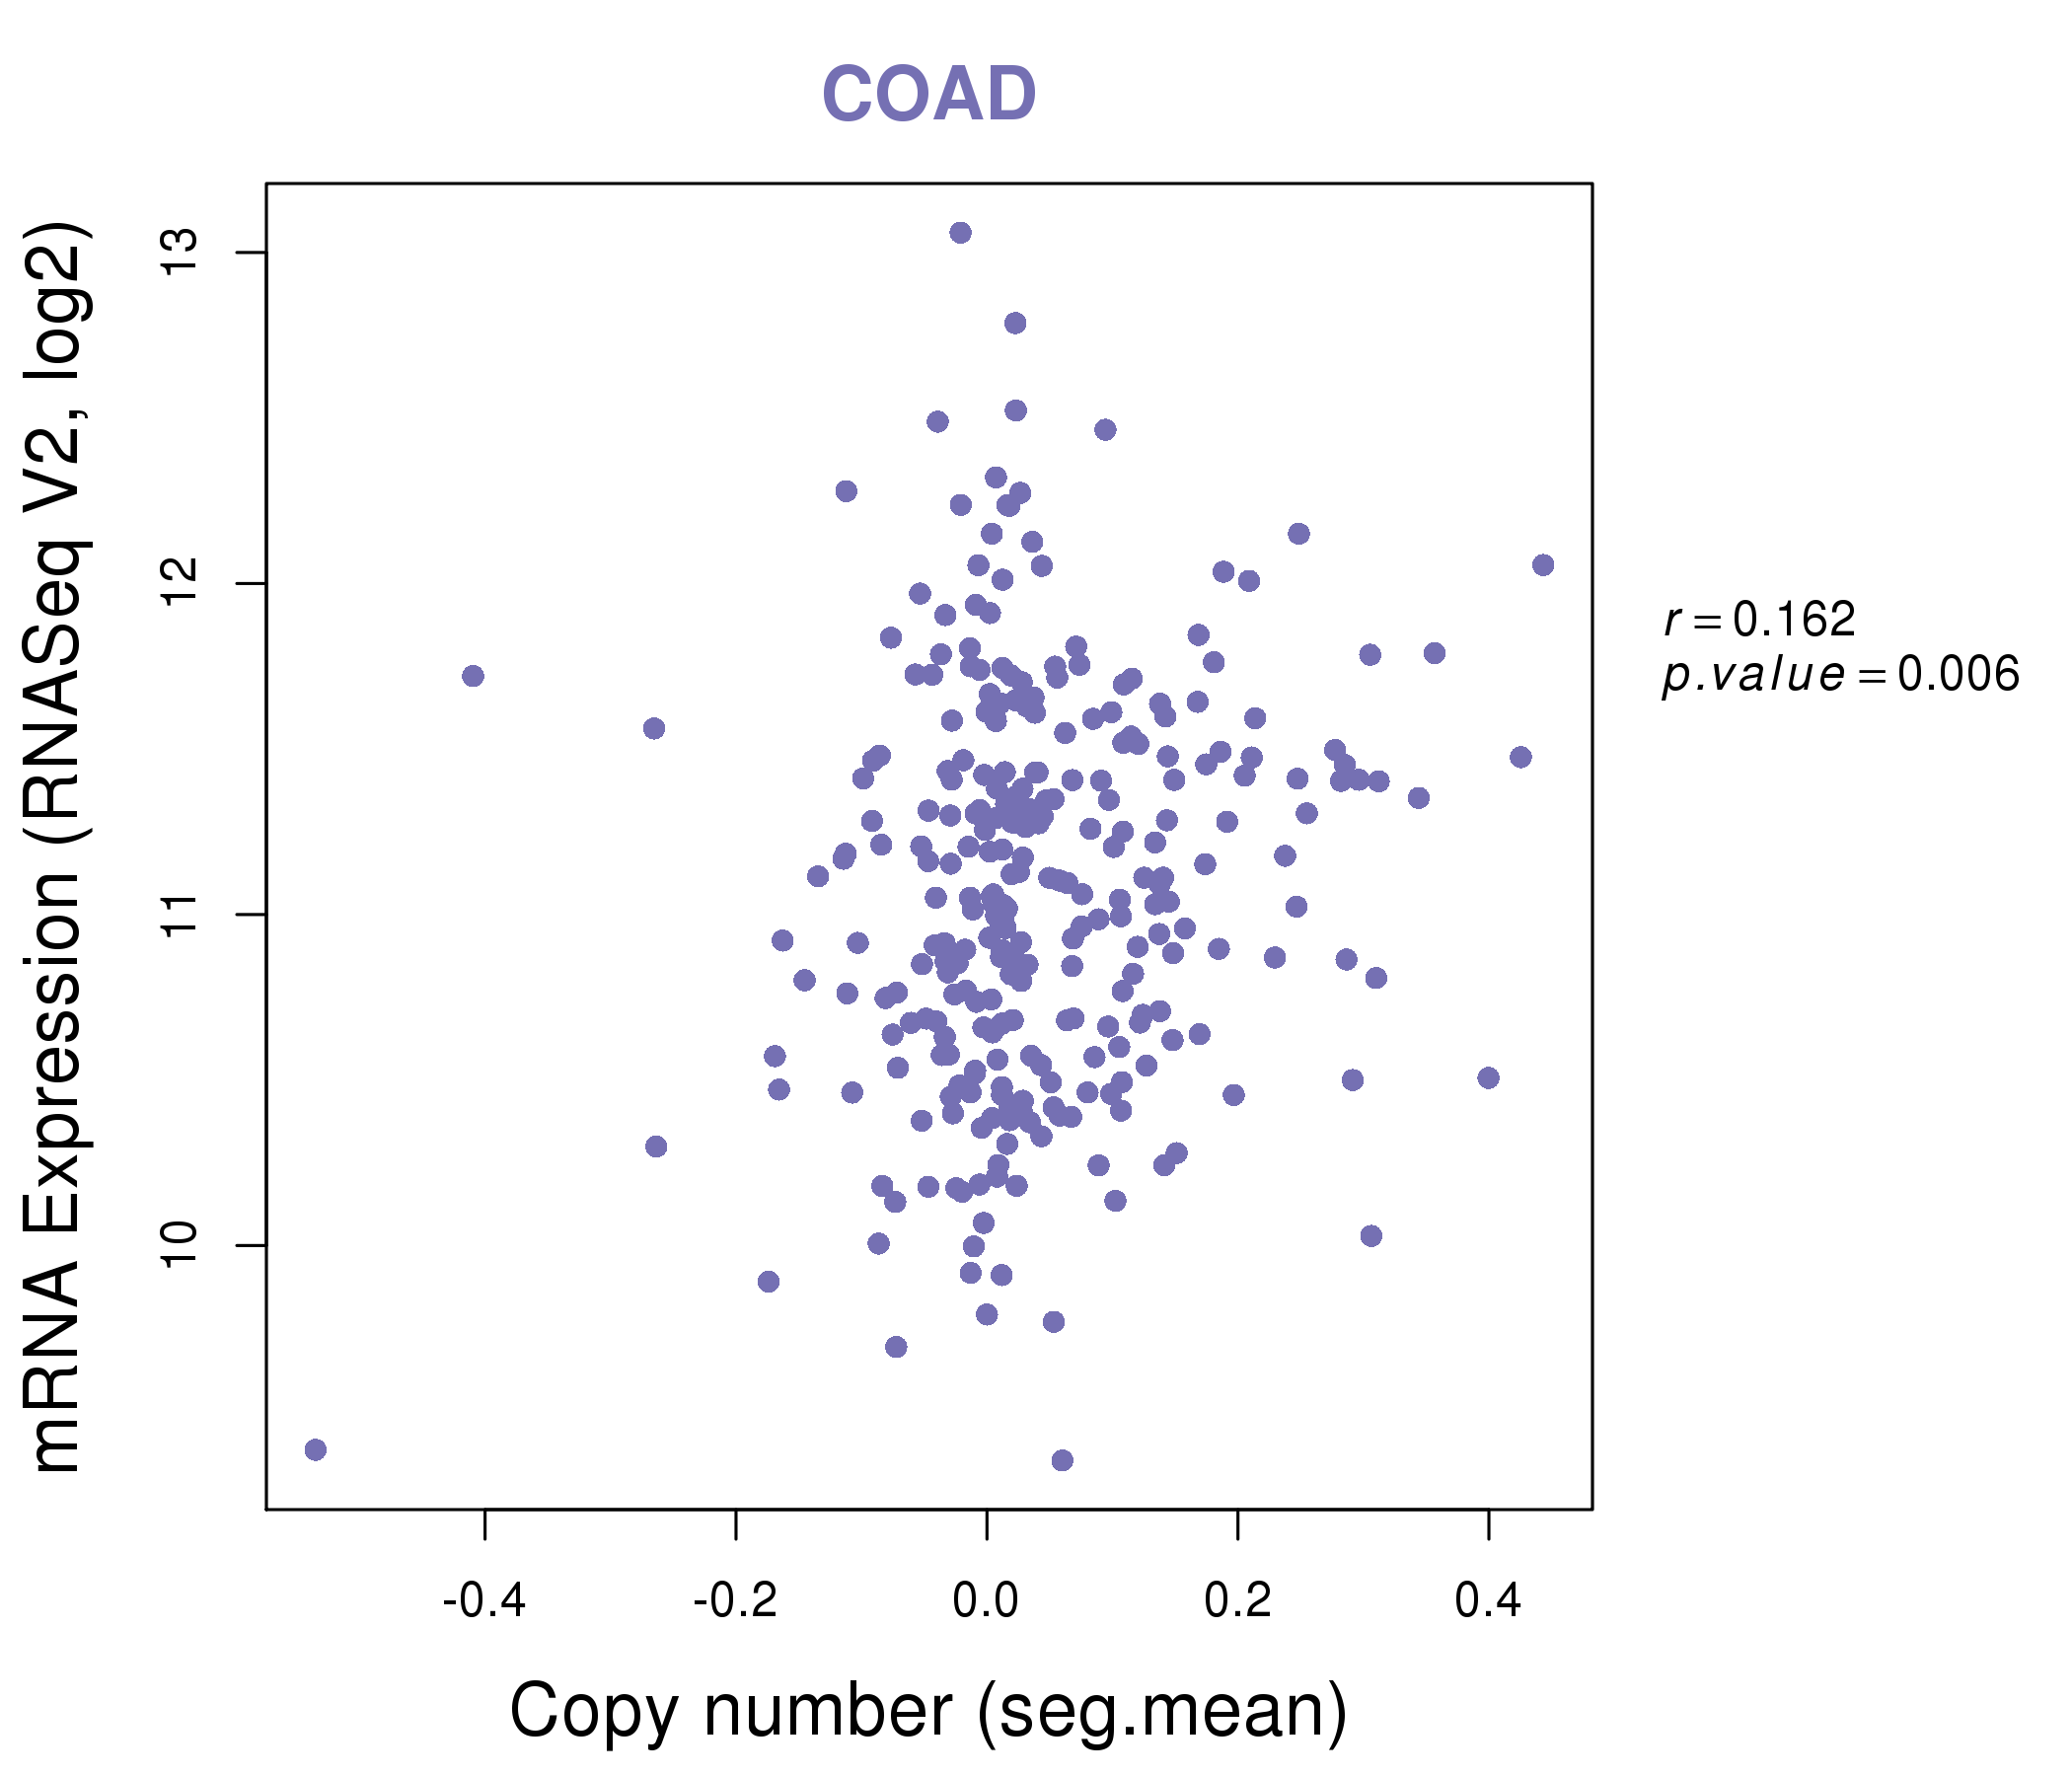
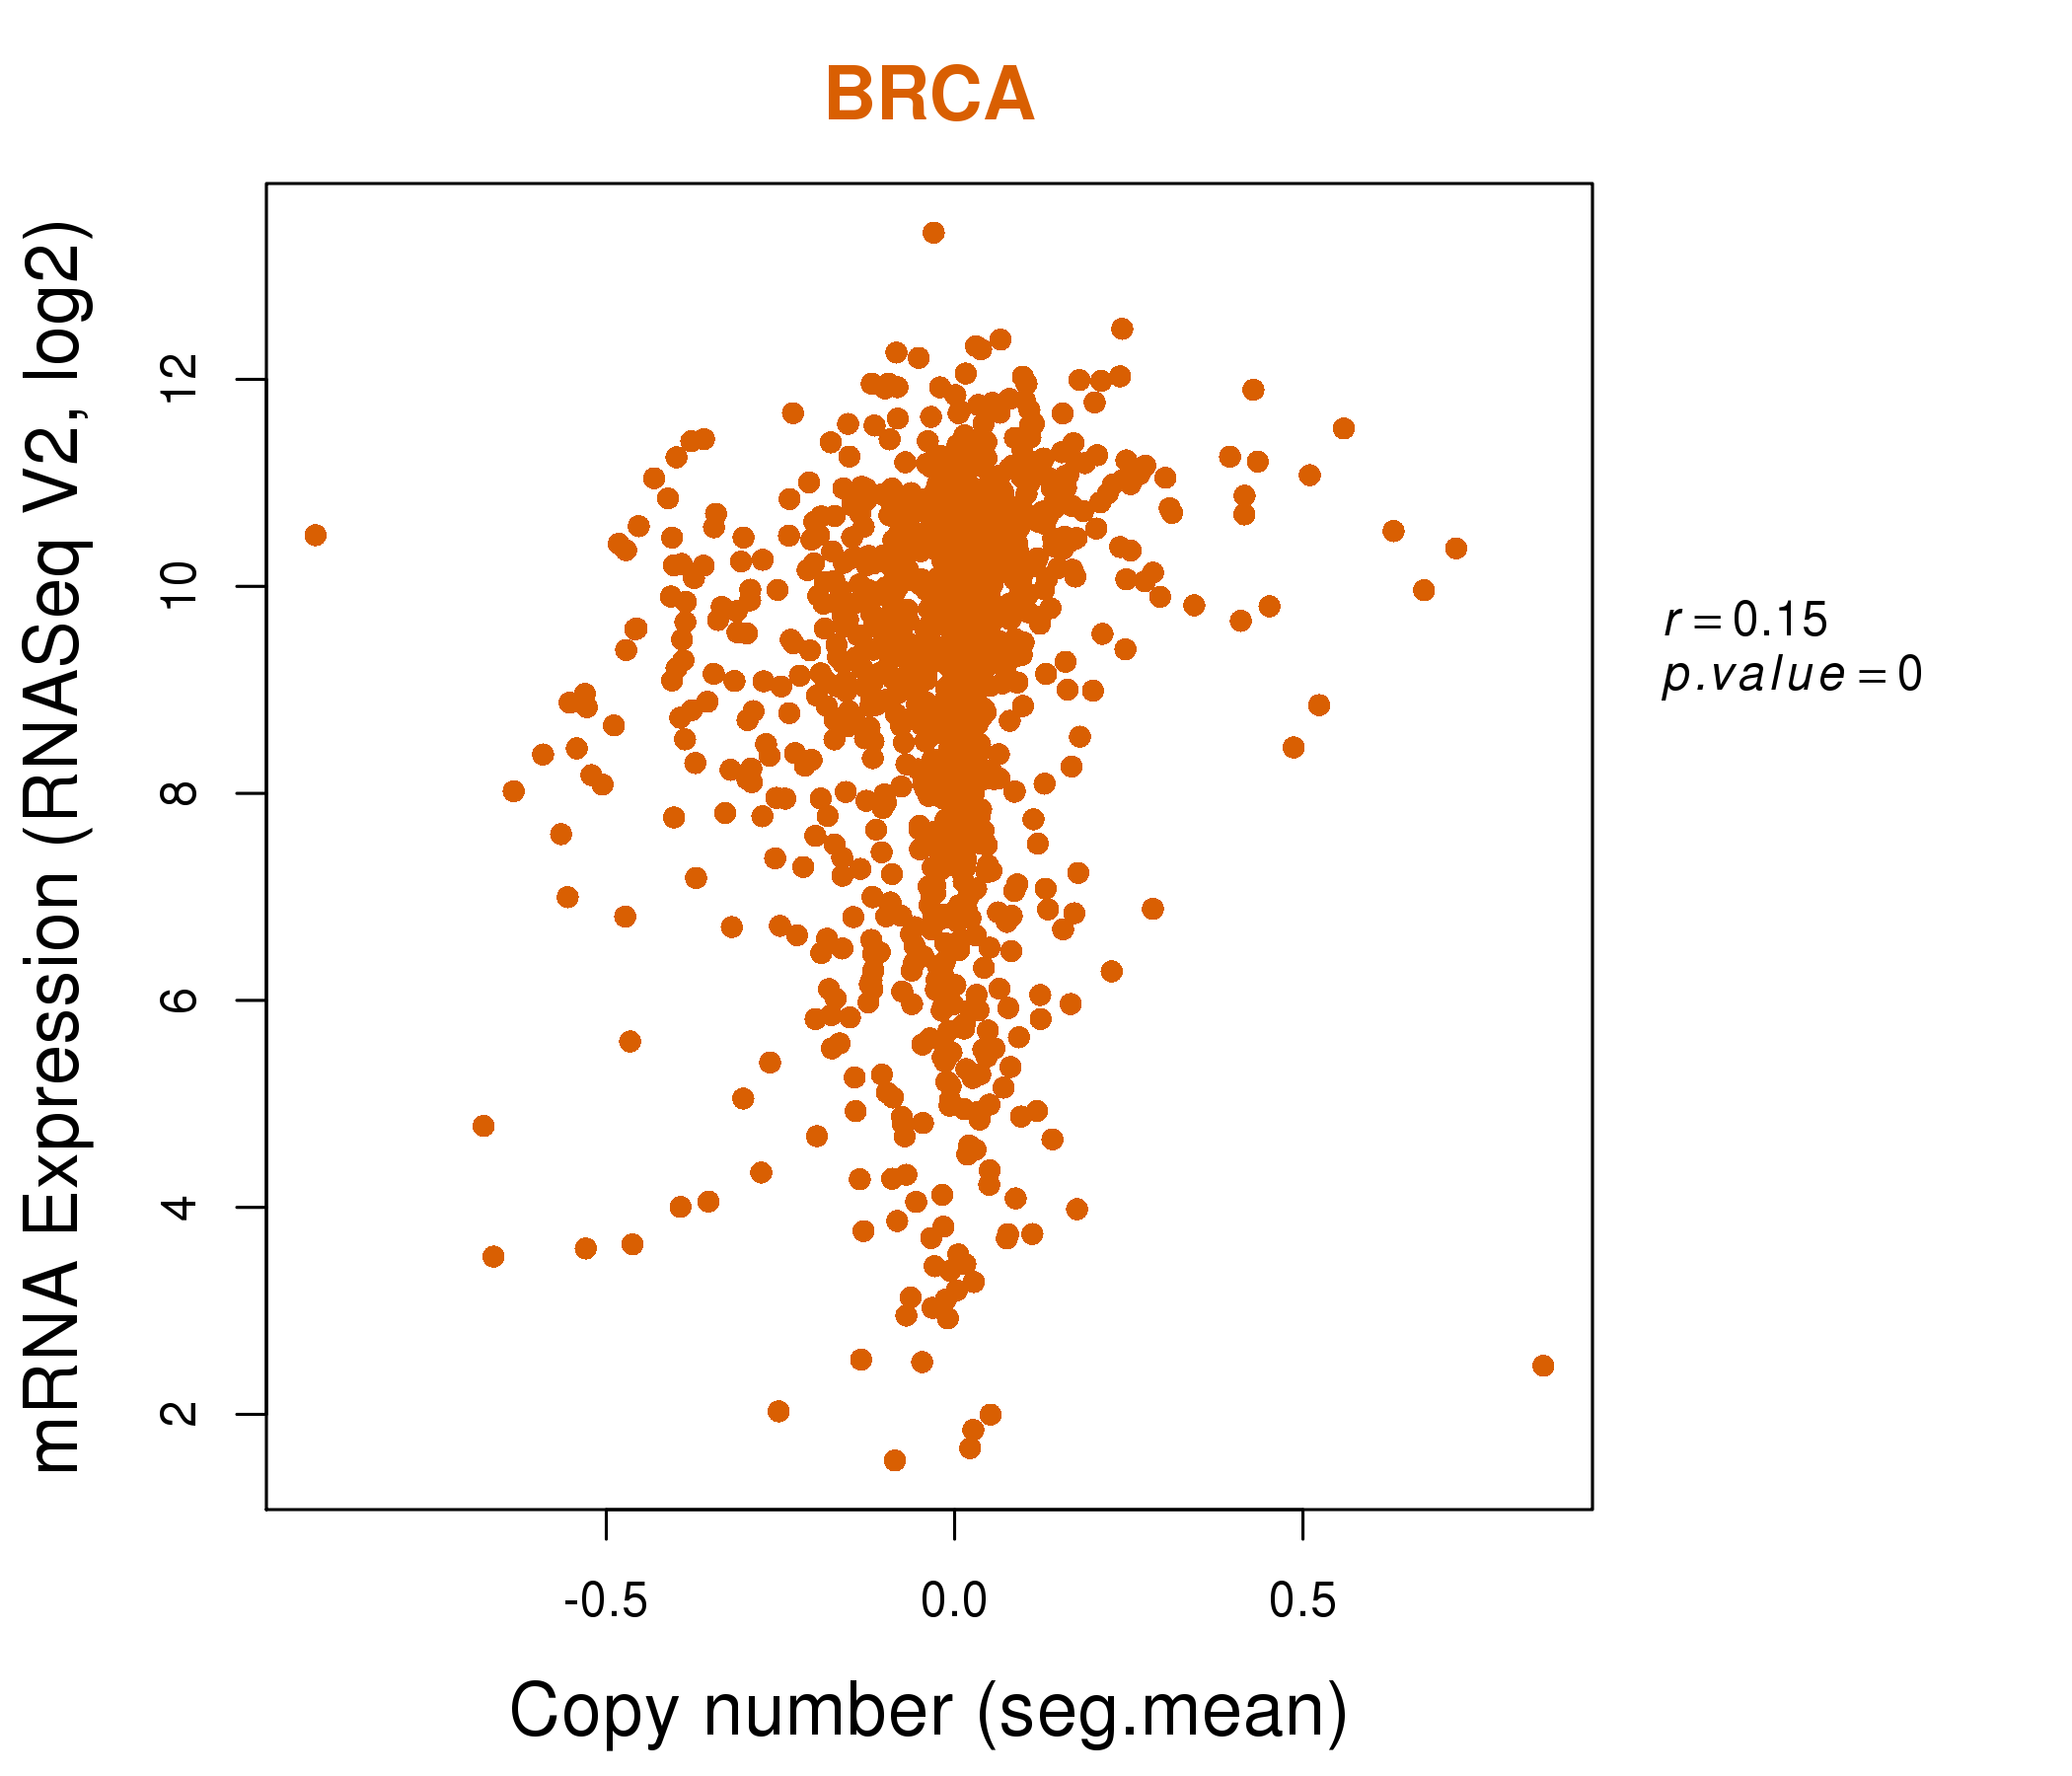
| * This plots show the correlation between CNV and gene expression. |
: Open all plots for all cancer types
 |
|
 |
|
| Top |
| Gene-Gene Network Information |
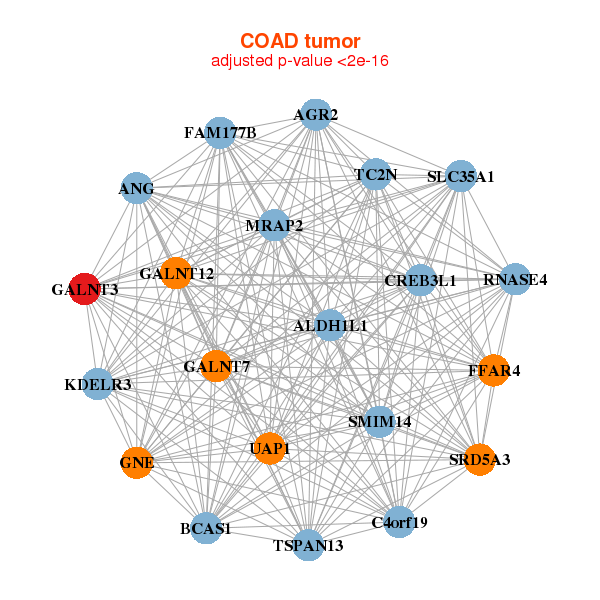
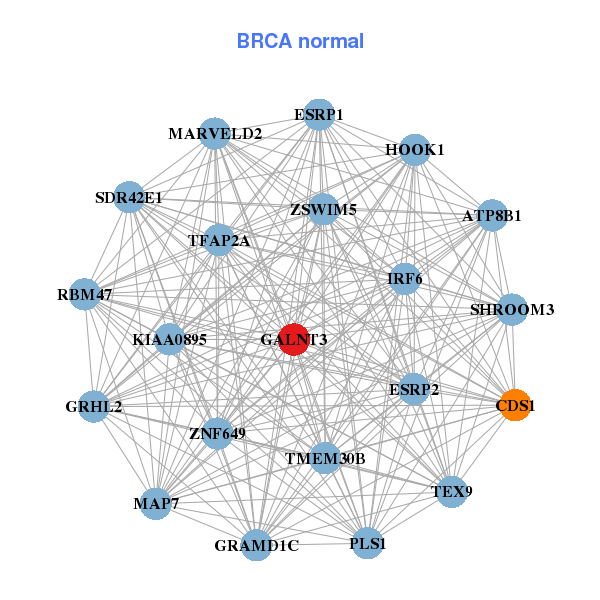
| * Co-Expression network figures were drawn using R package igraph. Only the top 20 genes with the highest correlations were shown. Red circle: input gene, orange circle: cell metabolism gene, sky circle: other gene |
: Open all plots for all cancer types
 |
|
| ACTR3,AGFG1,CCNYL1,CMPK1,CREB3L2,FNDC3B,GALNT3, GAN,GORASP2,IDH1,MFSD9,PEX13,PPP1CB,PPP2R3A, PRKAA1,PSME4,RNF217,SLC31A1,SLC41A2,TES,TMEM123 | ATP8B1,CDS1,ESRP1,ESRP2,GALNT3,GRAMD1C,GRHL2, HOOK1,IRF6,KIAA0895,MAP7,MARVELD2,PLS1,RBM47, SDR42E1,SHROOM3,TEX9,TFAP2A,TMEM30B,ZNF649,ZSWIM5 |
 |
|
| AGR2,ALDH1L1,ANG,BCAS1,C4orf19,SMIM14,CREB3L1, FAM177B,GALNT12,GALNT3,GALNT7,GNE,FFAR4,KDELR3, MRAP2,RNASE4,SLC35A1,SRD5A3,TC2N,TSPAN13,UAP1 | ACBD3,ATP2C1,BRCC3,CMTM8,DENND2D,EDEM3,EHF, ESRP1,FOXA3,GALNT3,ICA1,KDELR2,LXN,PAWR, SLC10A7,SLC35A2,TM9SF2,TPD52,TSPAN13,TTC39A,ZDHHC13 |
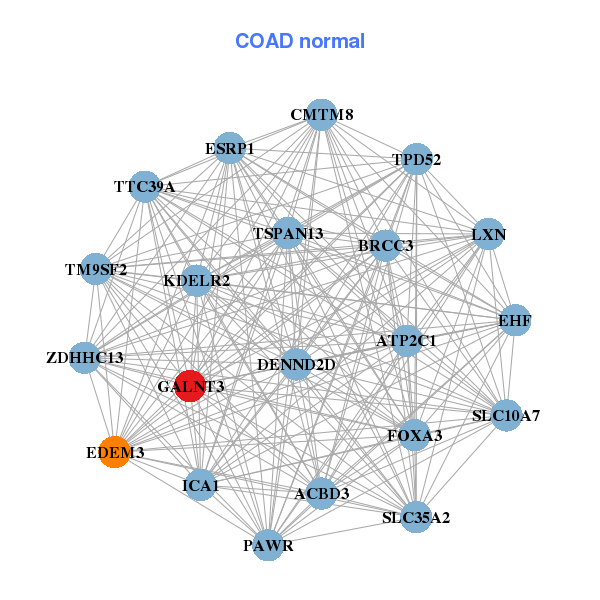
| * Co-Expression network figures were drawn using R package igraph. Only the top 20 genes with the highest correlations were shown. Red circle: input gene, orange circle: cell metabolism gene, sky circle: other gene |
: Open all plots for all cancer types
| Top |
: Open all interacting genes' information including KEGG pathway for all interacting genes from DAVID
| Top |
| Pharmacological Information for GALNT3 |
| There's no related Drug. |
| Top |
| Cross referenced IDs for GALNT3 |
| * We obtained these cross-references from Uniprot database. It covers 150 different DBs, 18 categories. http://www.uniprot.org/help/cross_references_section |
: Open all cross reference information
|
Copyright © 2016-Present - The Univsersity of Texas Health Science Center at Houston @ |