|
||||||||||||||||||||
| |
| Phenotypic Information (metabolism pathway, cancer, disease, phenome) |
| |
| |
| Gene-Gene Network Information: Co-Expression Network, Interacting Genes & KEGG |
| |
|


| Gene Summary for GALT |
| Basic gene info. | Gene symbol | GALT |
| Gene name | galactose-1-phosphate uridylyltransferase | |
| Synonyms | - | |
| Cytomap | UCSC genome browser: 9p13 | |
| Genomic location | chr9 :34646585-34650595 | |
| Type of gene | protein-coding | |
| RefGenes | NM_000155.3, NM_001258332.1, | |
| Ensembl id | ENSG00000213930 | |
| Description | UDP-glucose--hexose-1-phosphate uridylyltransferasegal-1-P uridylyltransferasegalactose-1-phosphate uridyl transferase | |
| Modification date | 20141219 | |
| dbXrefs | MIM : 606999 | |
| HGNC : HGNC | ||
| Ensembl : ENSG00000213930 | ||
| HPRD : 06106 | ||
| Protein | UniProt: P07902 go to UniProt's Cross Reference DB Table | |
| Expression | CleanEX: HS_GALT | |
| BioGPS: 2592 | ||
| Gene Expression Atlas: ENSG00000213930 | ||
| The Human Protein Atlas: ENSG00000213930 | ||
| Pathway | NCI Pathway Interaction Database: GALT | |
| KEGG: GALT | ||
| REACTOME: GALT | ||
| ConsensusPathDB | ||
| Pathway Commons: GALT | ||
| Metabolism | MetaCyc: GALT | |
| HUMANCyc: GALT | ||
| Regulation | Ensembl's Regulation: ENSG00000213930 | |
| miRBase: chr9 :34,646,585-34,650,595 | ||
| TargetScan: NM_000155 | ||
| cisRED: ENSG00000213930 | ||
| Context | iHOP: GALT | |
| cancer metabolism search in PubMed: GALT | ||
| UCL Cancer Institute: GALT | ||
| Assigned class in ccmGDB | A - This gene has a literature evidence and it belongs to cancer gene. | |
| References showing role of GALT in cancer cell metabolism | 1. Gatto F, Miess H, Schulze A, Nielsen J (2015) Flux balance analysis predicts essential genes in clear cell renal cell carcinoma metabolism. Sci Rep 5: 10738. doi: 10.1038/srep10738. go to article | |
| Top |
| Phenotypic Information for GALT(metabolism pathway, cancer, disease, phenome) |
| Cancer | CGAP: GALT |
| Familial Cancer Database: GALT | |
| * This gene is included in those cancer gene databases. |
|
|
|
|
|
| . | ||||||||||||||
Oncogene 1 | Significant driver gene in | |||||||||||||||||||
| cf) number; DB name 1 Oncogene; http://nar.oxfordjournals.org/content/35/suppl_1/D721.long, 2 Tumor Suppressor gene; https://bioinfo.uth.edu/TSGene/, 3 Cancer Gene Census; http://www.nature.com/nrc/journal/v4/n3/abs/nrc1299.html, 4 CancerGenes; http://nar.oxfordjournals.org/content/35/suppl_1/D721.long, 5 Network of Cancer Gene; http://ncg.kcl.ac.uk/index.php, 1Therapeutic Vulnerabilities in Cancer; http://cbio.mskcc.org/cancergenomics/statius/ |
| KEGG_GALACTOSE_METABOLISM KEGG_AMINO_SUGAR_AND_NUCLEOTIDE_SUGAR_METABOLISM REACTOME_METABOLISM_OF_CARBOHYDRATES | |
| OMIM | 230400; phenotype. 230400; phenotype. 606999; gene. 606999; gene. |
| Orphanet | 79239; Classic galactosemia. 79239; Classic galactosemia. |
| Disease | KEGG Disease: GALT |
| MedGen: GALT (Human Medical Genetics with Condition) | |
| ClinVar: GALT | |
| Phenotype | MGI: GALT (International Mouse Phenotyping Consortium) |
| PhenomicDB: GALT | |
| Mutations for GALT |
| * Under tables are showing count per each tissue to give us broad intuition about tissue specific mutation patterns.You can go to the detailed page for each mutation database's web site. |
| There's no structural variation information in COSMIC data for this gene. |
| * From mRNA Sanger sequences, Chitars2.0 arranged chimeric transcripts. This table shows GALT related fusion information. |
| ID | Head Gene | Tail Gene | Accession | Gene_a | qStart_a | qEnd_a | Chromosome_a | tStart_a | tEnd_a | Gene_a | qStart_a | qEnd_a | Chromosome_a | tStart_a | tEnd_a |
| CV351576 | SNRNP70 | 1 | 116 | 19 | 49611334 | 49611448 | GALT | 110 | 377 | 9 | 34648372 | 34649047 | |
| BF593407 | GALT | 1 | 307 | 9 | 34650038 | 34650571 | CENPF | 303 | 361 | 1 | 214786559 | 214786617 | |
| Top |
| There's no copy number variation information in COSMIC data for this gene. |
| Top |
|
 |
| Top |
| Stat. for Non-Synonymous SNVs (# total SNVs=24) | (# total SNVs=6) |
 |  |
(# total SNVs=0) | (# total SNVs=0) |
| Top |
| * When you move the cursor on each content, you can see more deailed mutation information on the Tooltip. Those are primary_site,primary_histology,mutation(aa),pubmedID. |
| GRCh37 position | Mutation(aa) | Unique sampleID count |
| chr9:34648859-34648859 | p.R263Q | 2 |
| chr9:34646773-34646773 | p.F24L | 2 |
| chr9:34649061-34649061 | p.Y296C | 2 |
| chr9:34647078-34647078 | p.? | 2 |
| chr9:34647237-34647237 | p.A78A | 1 |
| chr9:34649524-34649524 | p.M341T | 1 |
| chr9:34647938-34647938 | p.A163T | 1 |
| chr9:34648858-34648858 | p.R263W | 1 |
| chr9:34647491-34647491 | p.V85V | 1 |
| chr9:34649550-34649550 | p.T350P | 1 |
| Top |
|
 |
| Point Mutation/ Tissue ID | 1 | 2 | 3 | 4 | 5 | 6 | 7 | 8 | 9 | 10 | 11 | 12 | 13 | 14 | 15 | 16 | 17 | 18 | 19 | 20 |
| # sample | 1 | 1 | 3 | 1 | 3 | 3 | 2 | 1 | 4 | 1 | 2 | 4 | ||||||||
| # mutation | 1 | 1 | 3 | 1 | 3 | 3 | 2 | 1 | 4 | 2 | 2 | 5 | ||||||||
| nonsynonymous SNV | 1 | 1 | 3 | 1 | 2 | 2 | 1 | 1 | 1 | 1 | 2 | 3 | ||||||||
| synonymous SNV | 1 | 1 | 1 | 3 | 1 | 2 |
| cf) Tissue ID; Tissue type (1; BLCA[Bladder Urothelial Carcinoma], 2; BRCA[Breast invasive carcinoma], 3; CESC[Cervical squamous cell carcinoma and endocervical adenocarcinoma], 4; COAD[Colon adenocarcinoma], 5; GBM[Glioblastoma multiforme], 6; Glioma Low Grade, 7; HNSC[Head and Neck squamous cell carcinoma], 8; KICH[Kidney Chromophobe], 9; KIRC[Kidney renal clear cell carcinoma], 10; KIRP[Kidney renal papillary cell carcinoma], 11; LAML[Acute Myeloid Leukemia], 12; LUAD[Lung adenocarcinoma], 13; LUSC[Lung squamous cell carcinoma], 14; OV[Ovarian serous cystadenocarcinoma ], 15; PAAD[Pancreatic adenocarcinoma], 16; PRAD[Prostate adenocarcinoma], 17; SKCM[Skin Cutaneous Melanoma], 18:STAD[Stomach adenocarcinoma], 19:THCA[Thyroid carcinoma], 20:UCEC[Uterine Corpus Endometrial Carcinoma]) |
| Top |
| * We represented just top 10 SNVs. When you move the cursor on each content, you can see more deailed mutation information on the Tooltip. Those are primary_site, primary_histology, mutation(aa), pubmedID. |
| Genomic Position | Mutation(aa) | Unique sampleID count |
| chr9:34647856 | p.L52L,GALT | 1 |
| chr9:34648855 | p.A251T,GALT | 1 |
| chr9:34647892 | p.A54T,GALT | 1 |
| chr9:34648858 | p.H258H,GALT | 1 |
| chr9:34647906 | p.N73D,GALT | 1 |
| chr9:34648884 | p.R92H,GALT | 1 |
| chr9:34647914 | p.R122C,GALT | 1 |
| chr9:34649059 | p.E128Q,GALT | 1 |
| chr9:34647934 | p.R25R | 1 |
| chr9:34649471 | p.P135L,GALT | 1 |
| * Copy number data were extracted from TCGA using R package TCGA-Assembler. The URLs of all public data files on TCGA DCC data server were gathered on Jan-05-2015. Function ProcessCNAData in TCGA-Assembler package was used to obtain gene-level copy number value which is calculated as the average copy number of the genomic region of a gene. |
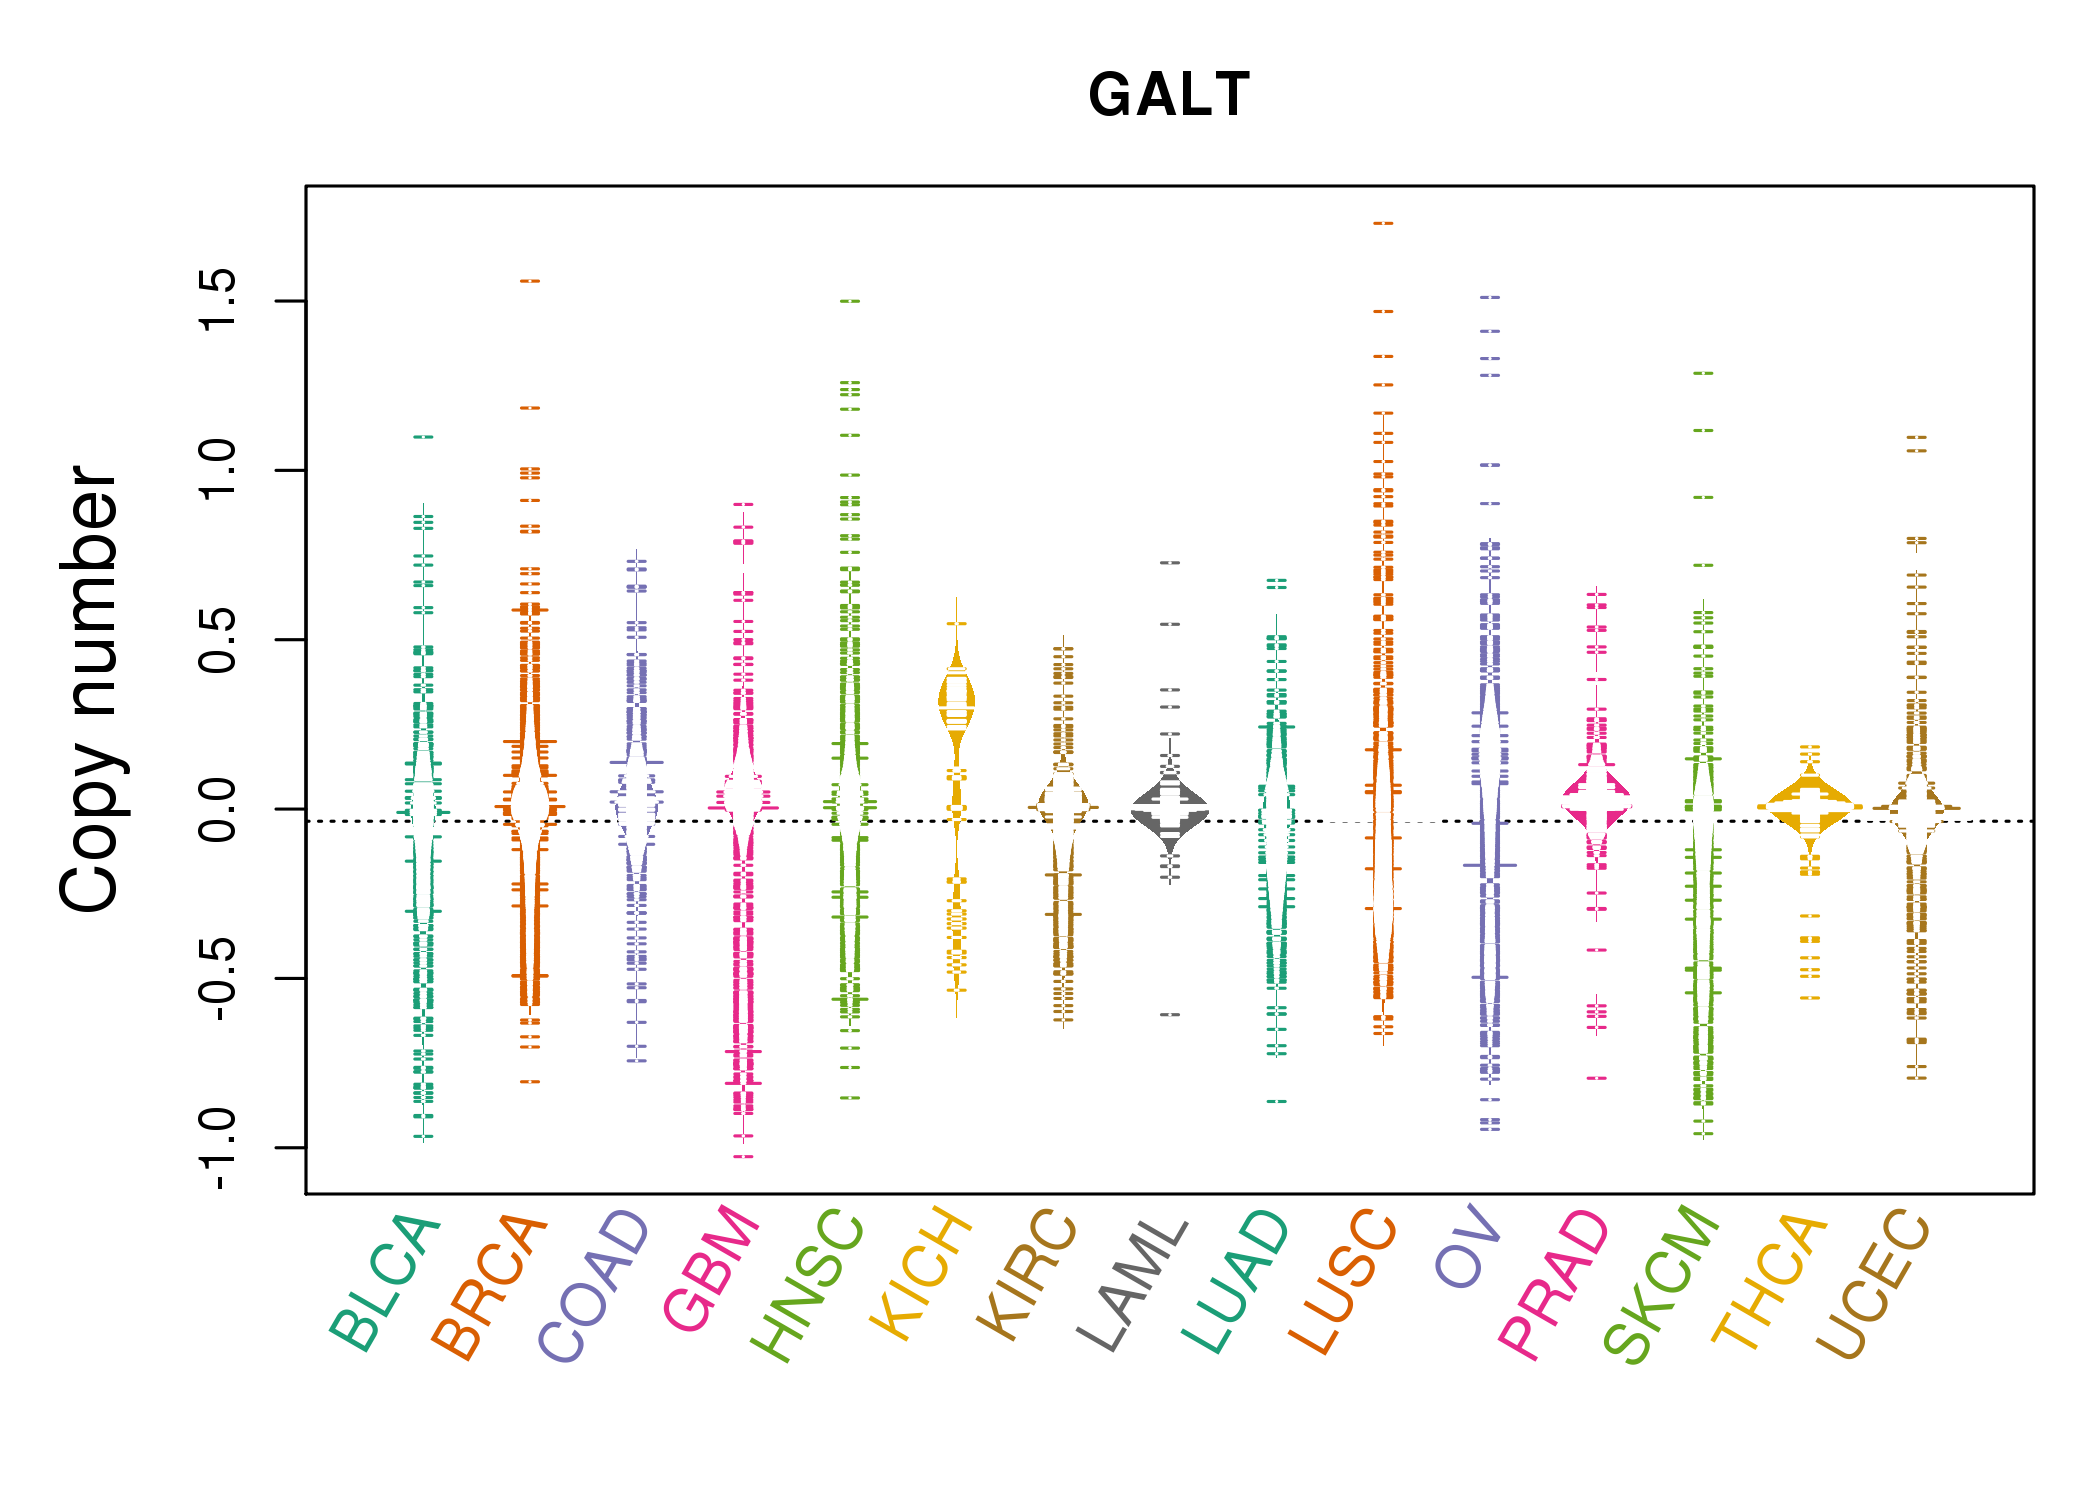 |
| cf) Tissue ID[Tissue type]: BLCA[Bladder Urothelial Carcinoma], BRCA[Breast invasive carcinoma], CESC[Cervical squamous cell carcinoma and endocervical adenocarcinoma], COAD[Colon adenocarcinoma], GBM[Glioblastoma multiforme], Glioma Low Grade, HNSC[Head and Neck squamous cell carcinoma], KICH[Kidney Chromophobe], KIRC[Kidney renal clear cell carcinoma], KIRP[Kidney renal papillary cell carcinoma], LAML[Acute Myeloid Leukemia], LUAD[Lung adenocarcinoma], LUSC[Lung squamous cell carcinoma], OV[Ovarian serous cystadenocarcinoma ], PAAD[Pancreatic adenocarcinoma], PRAD[Prostate adenocarcinoma], SKCM[Skin Cutaneous Melanoma], STAD[Stomach adenocarcinoma], THCA[Thyroid carcinoma], UCEC[Uterine Corpus Endometrial Carcinoma] |
| Top |
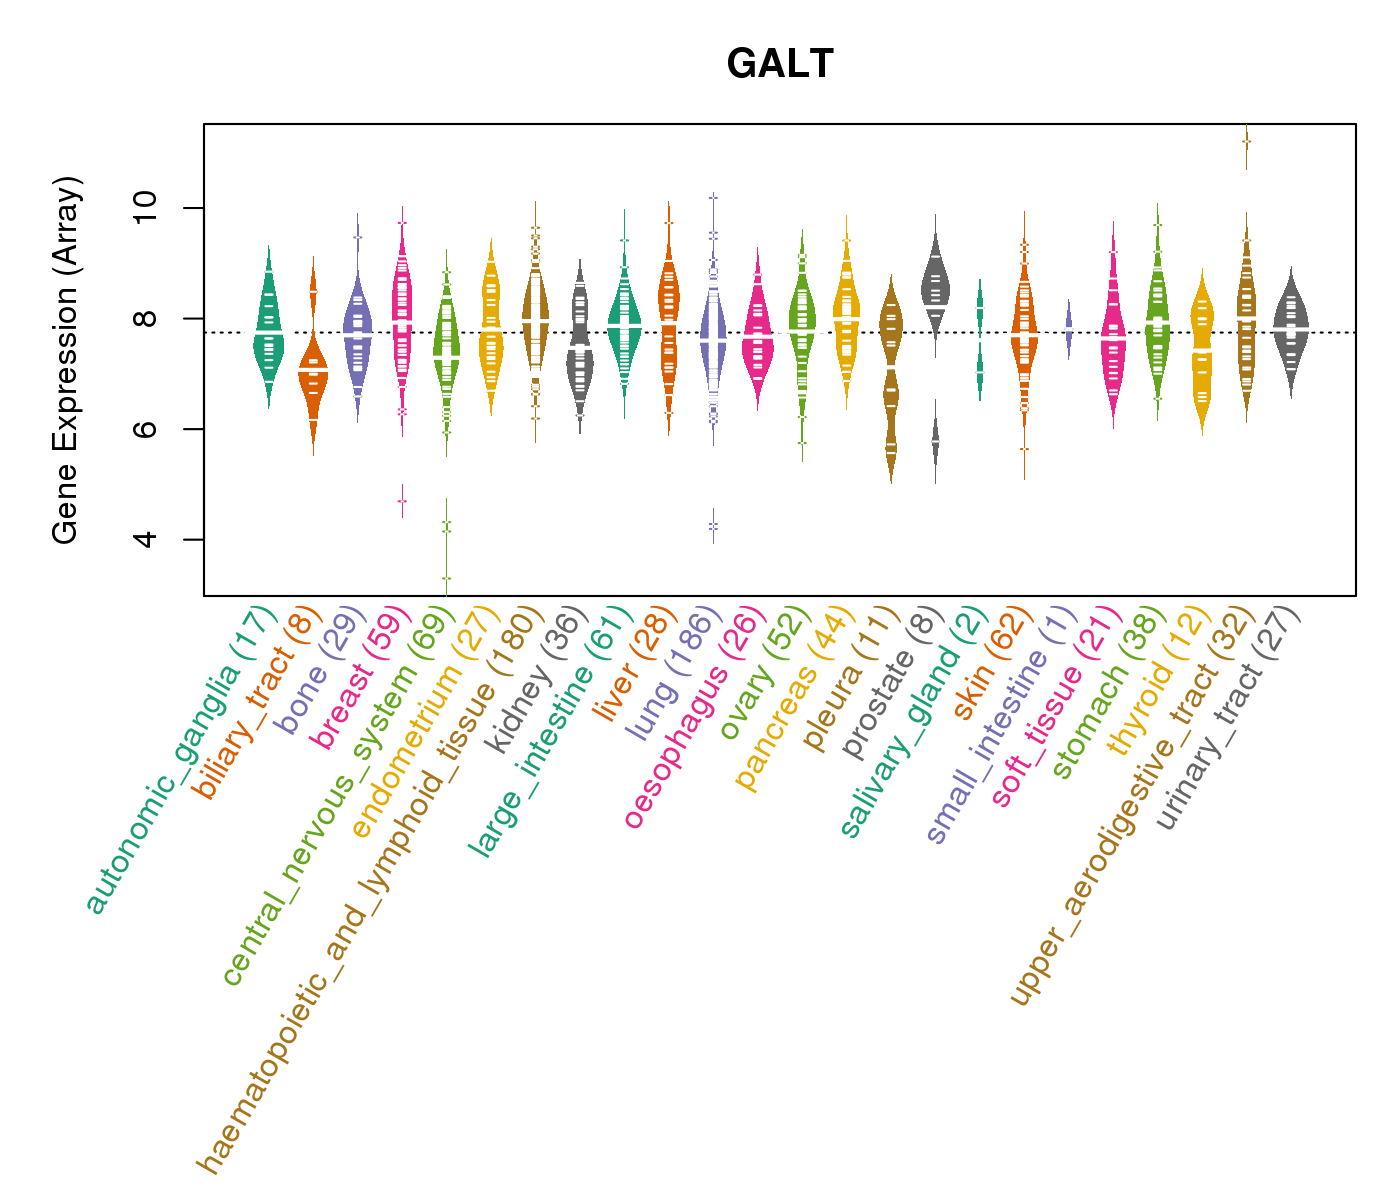
| Gene Expression for GALT |
| * CCLE gene expression data were extracted from CCLE_Expression_Entrez_2012-10-18.res: Gene-centric RMA-normalized mRNA expression data. |
 |
| * Normalized gene expression data of RNASeqV2 was extracted from TCGA using R package TCGA-Assembler. The URLs of all public data files on TCGA DCC data server were gathered at Jan-05-2015. Only eight cancer types have enough normal control samples for differential expression analysis. (t test, adjusted p<0.05 (using Benjamini-Hochberg FDR)) |
 |
| Top |
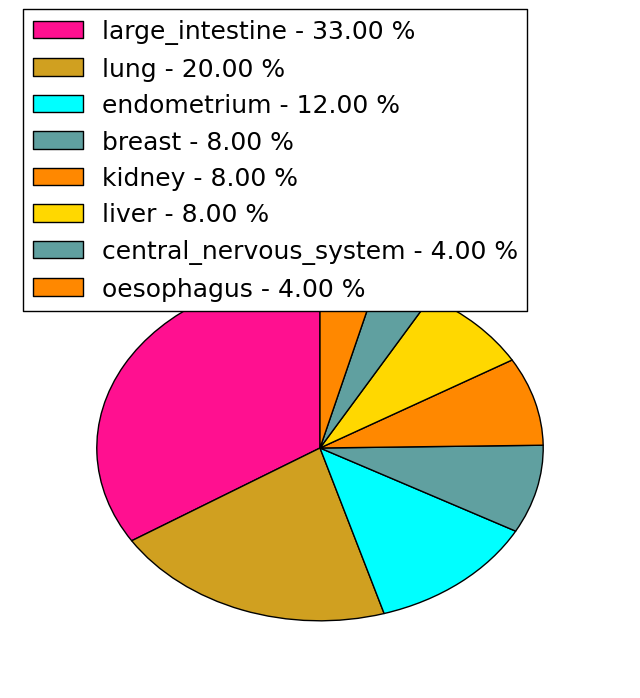
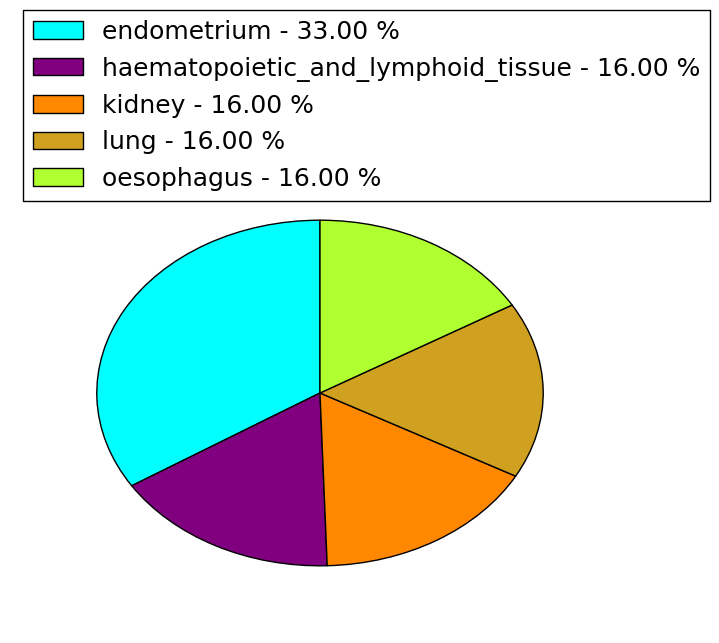
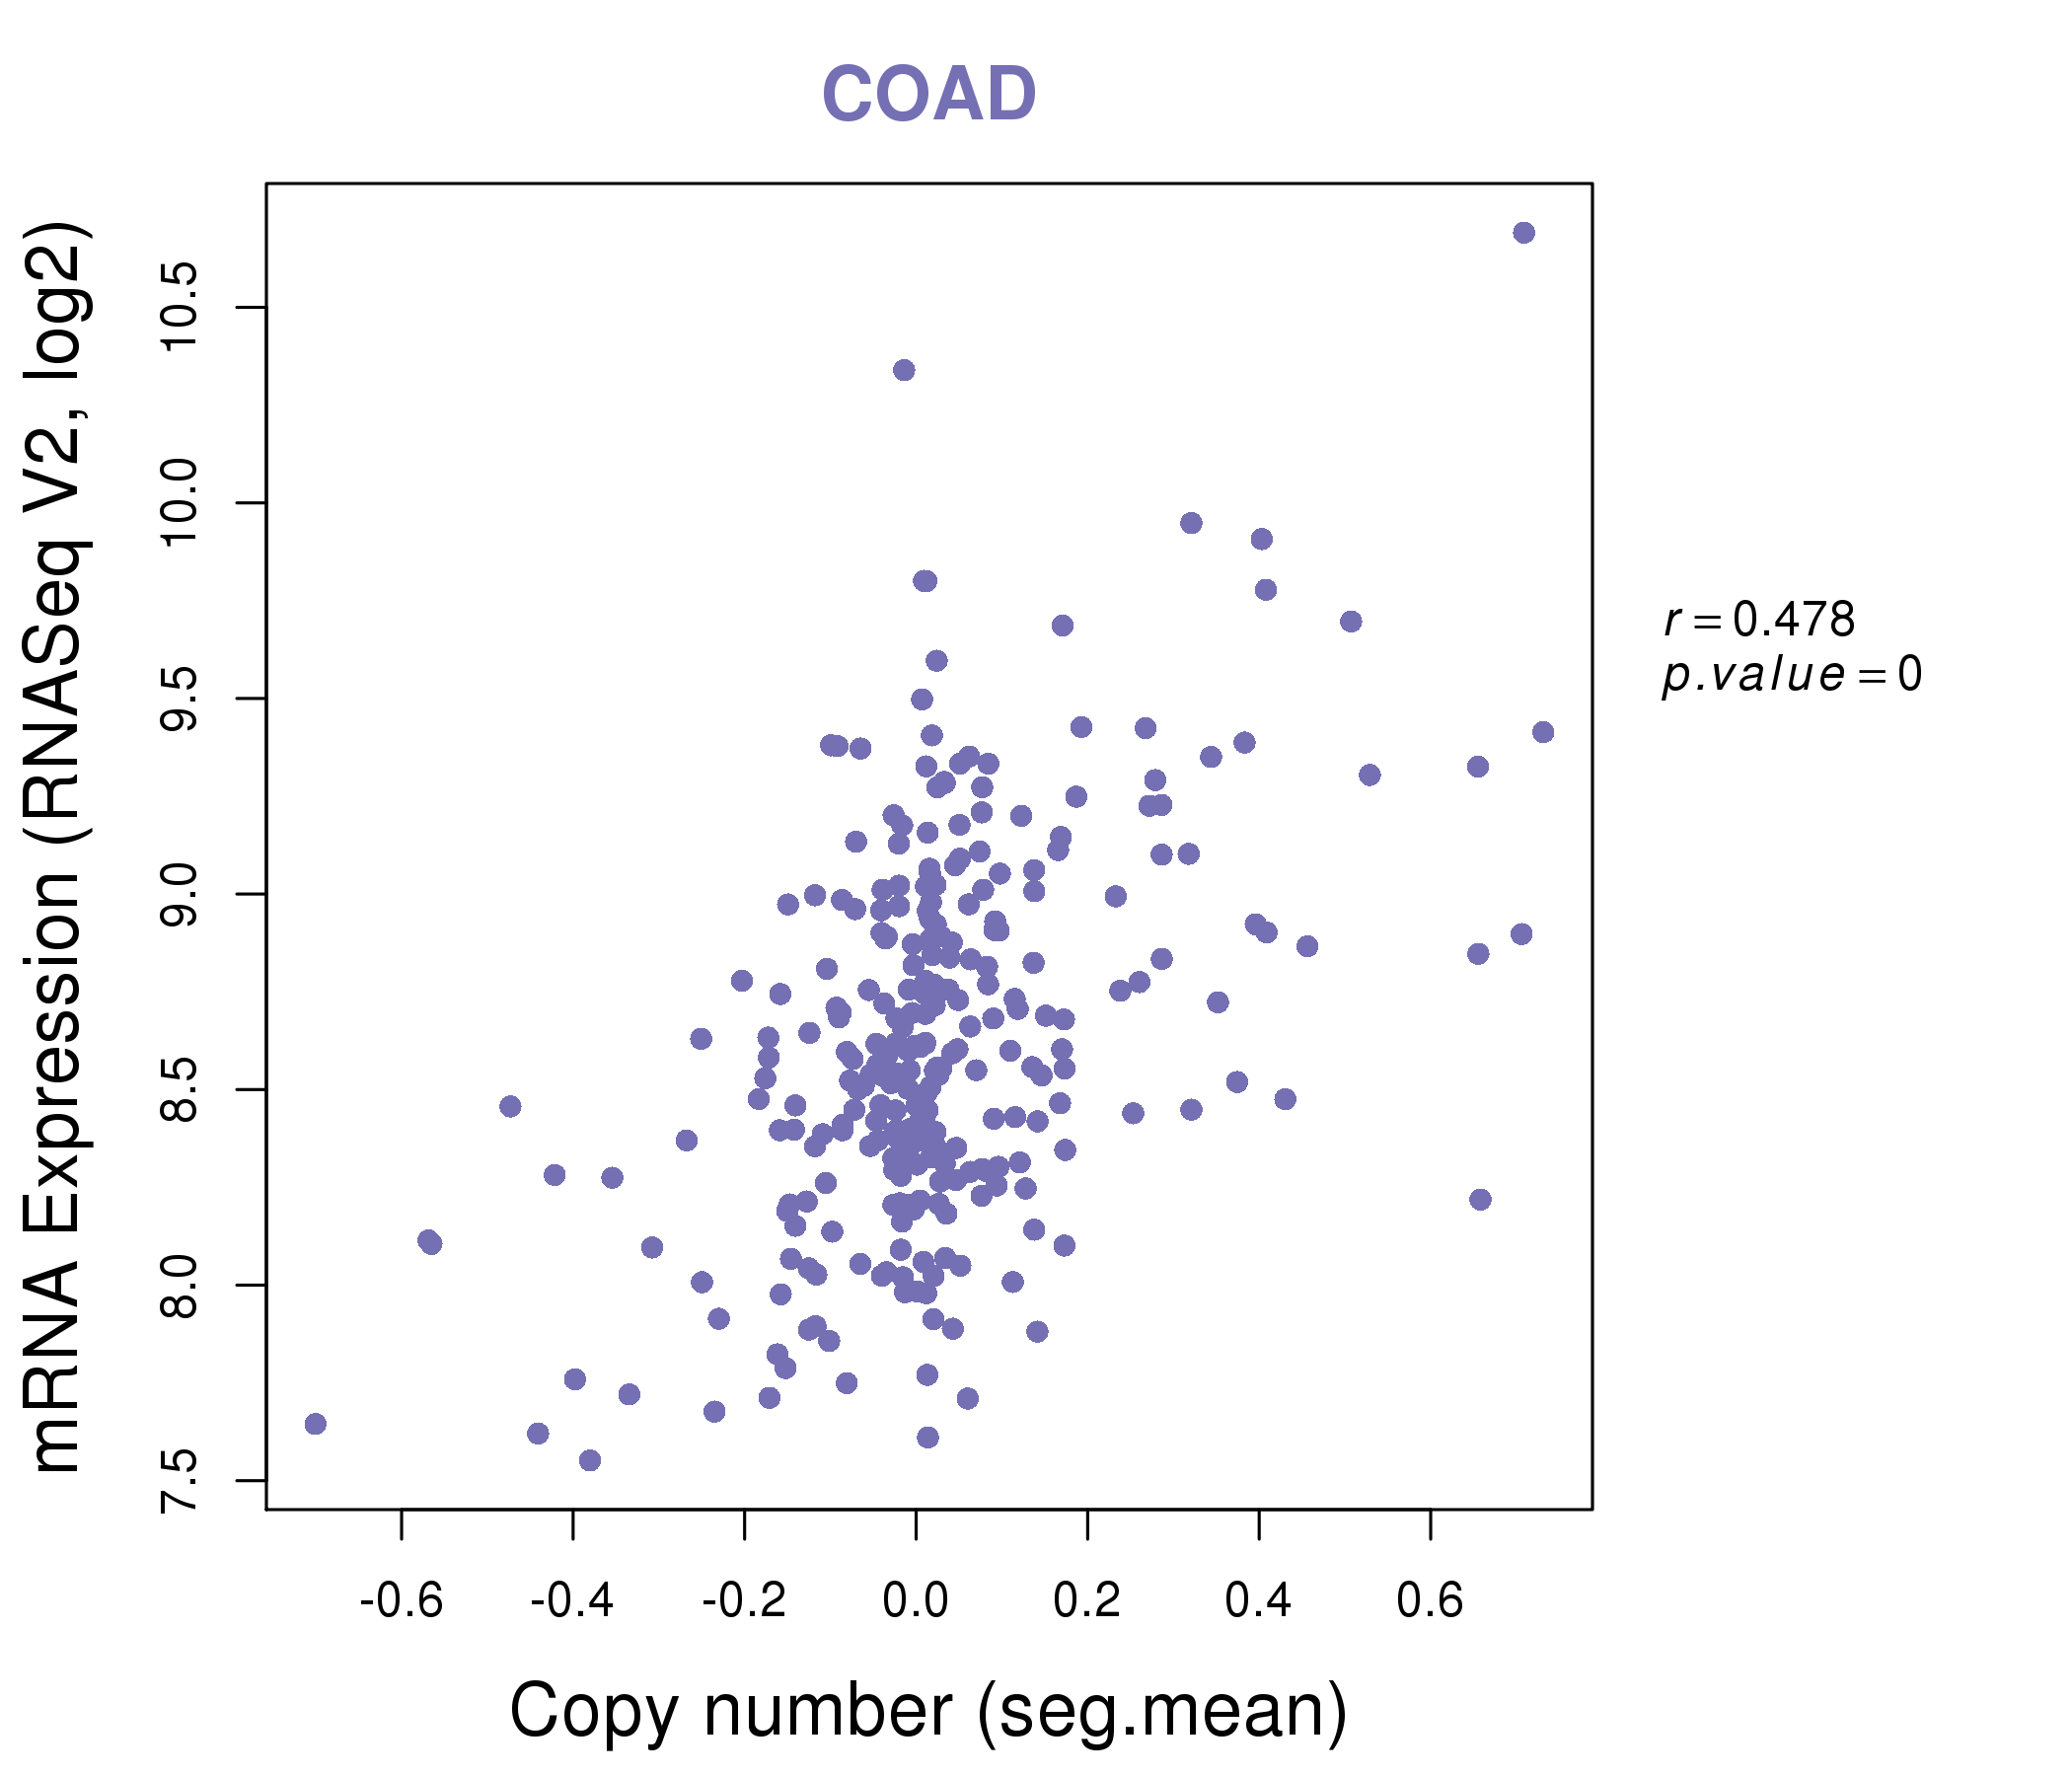
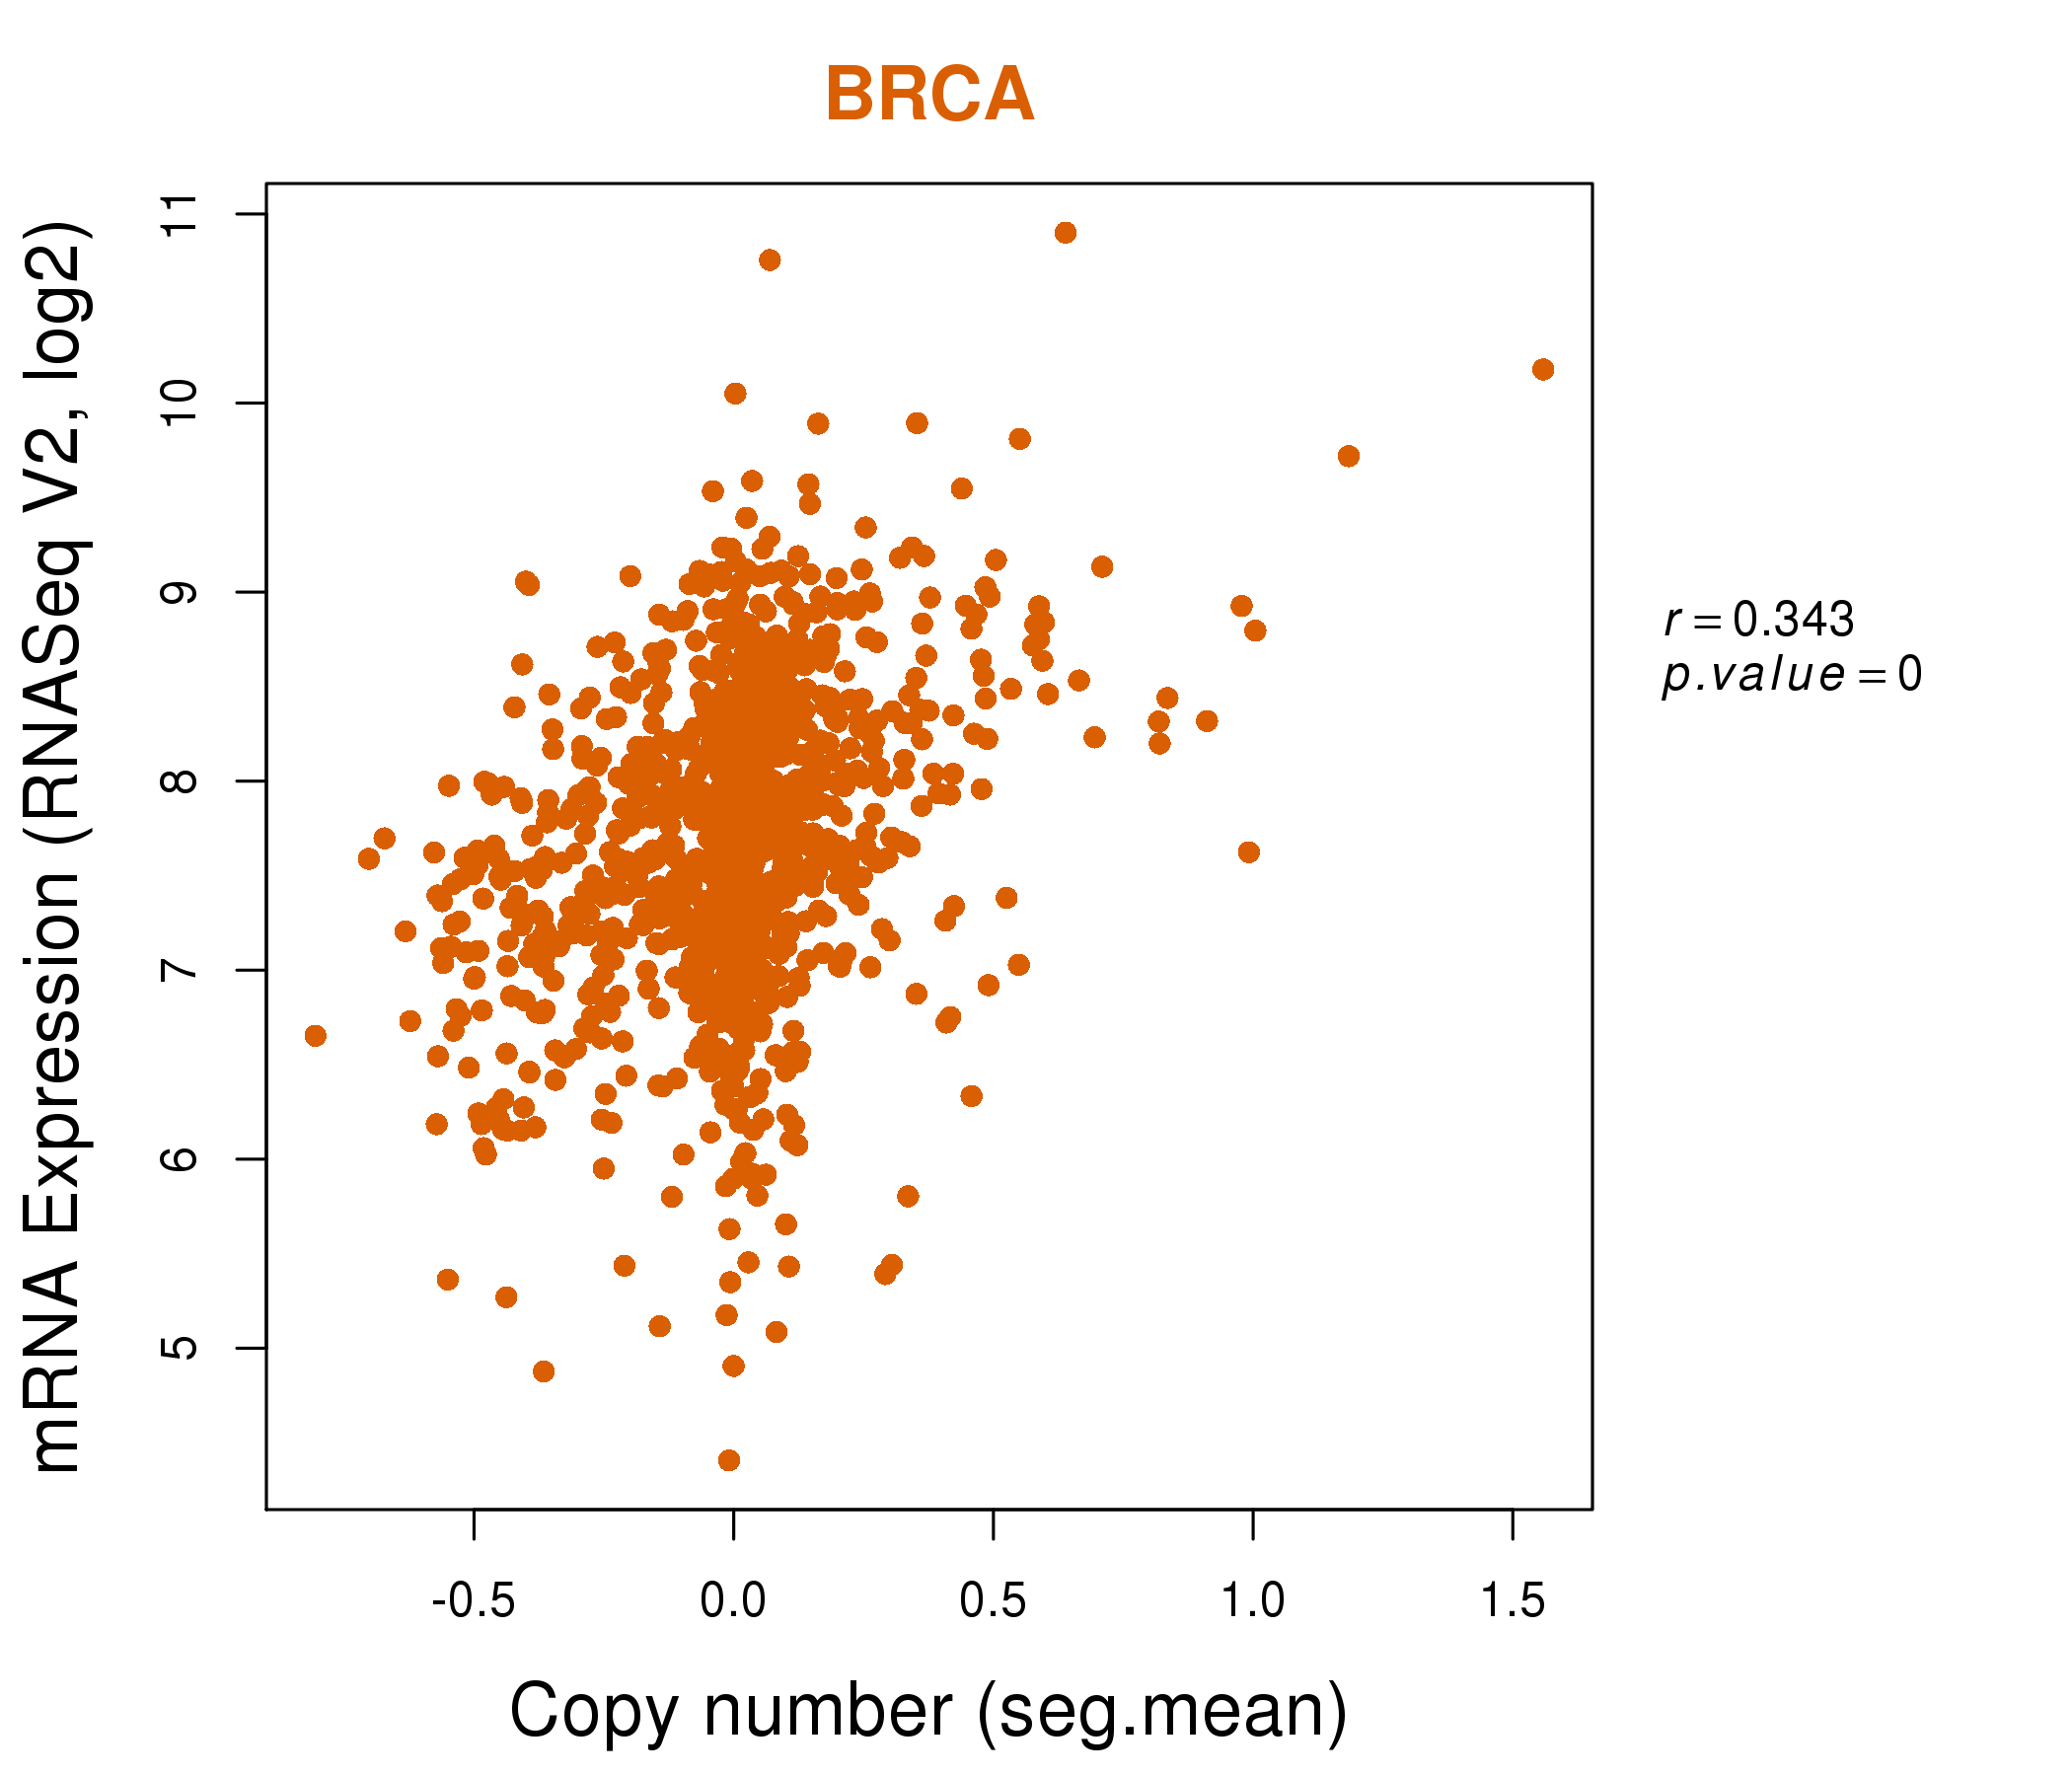
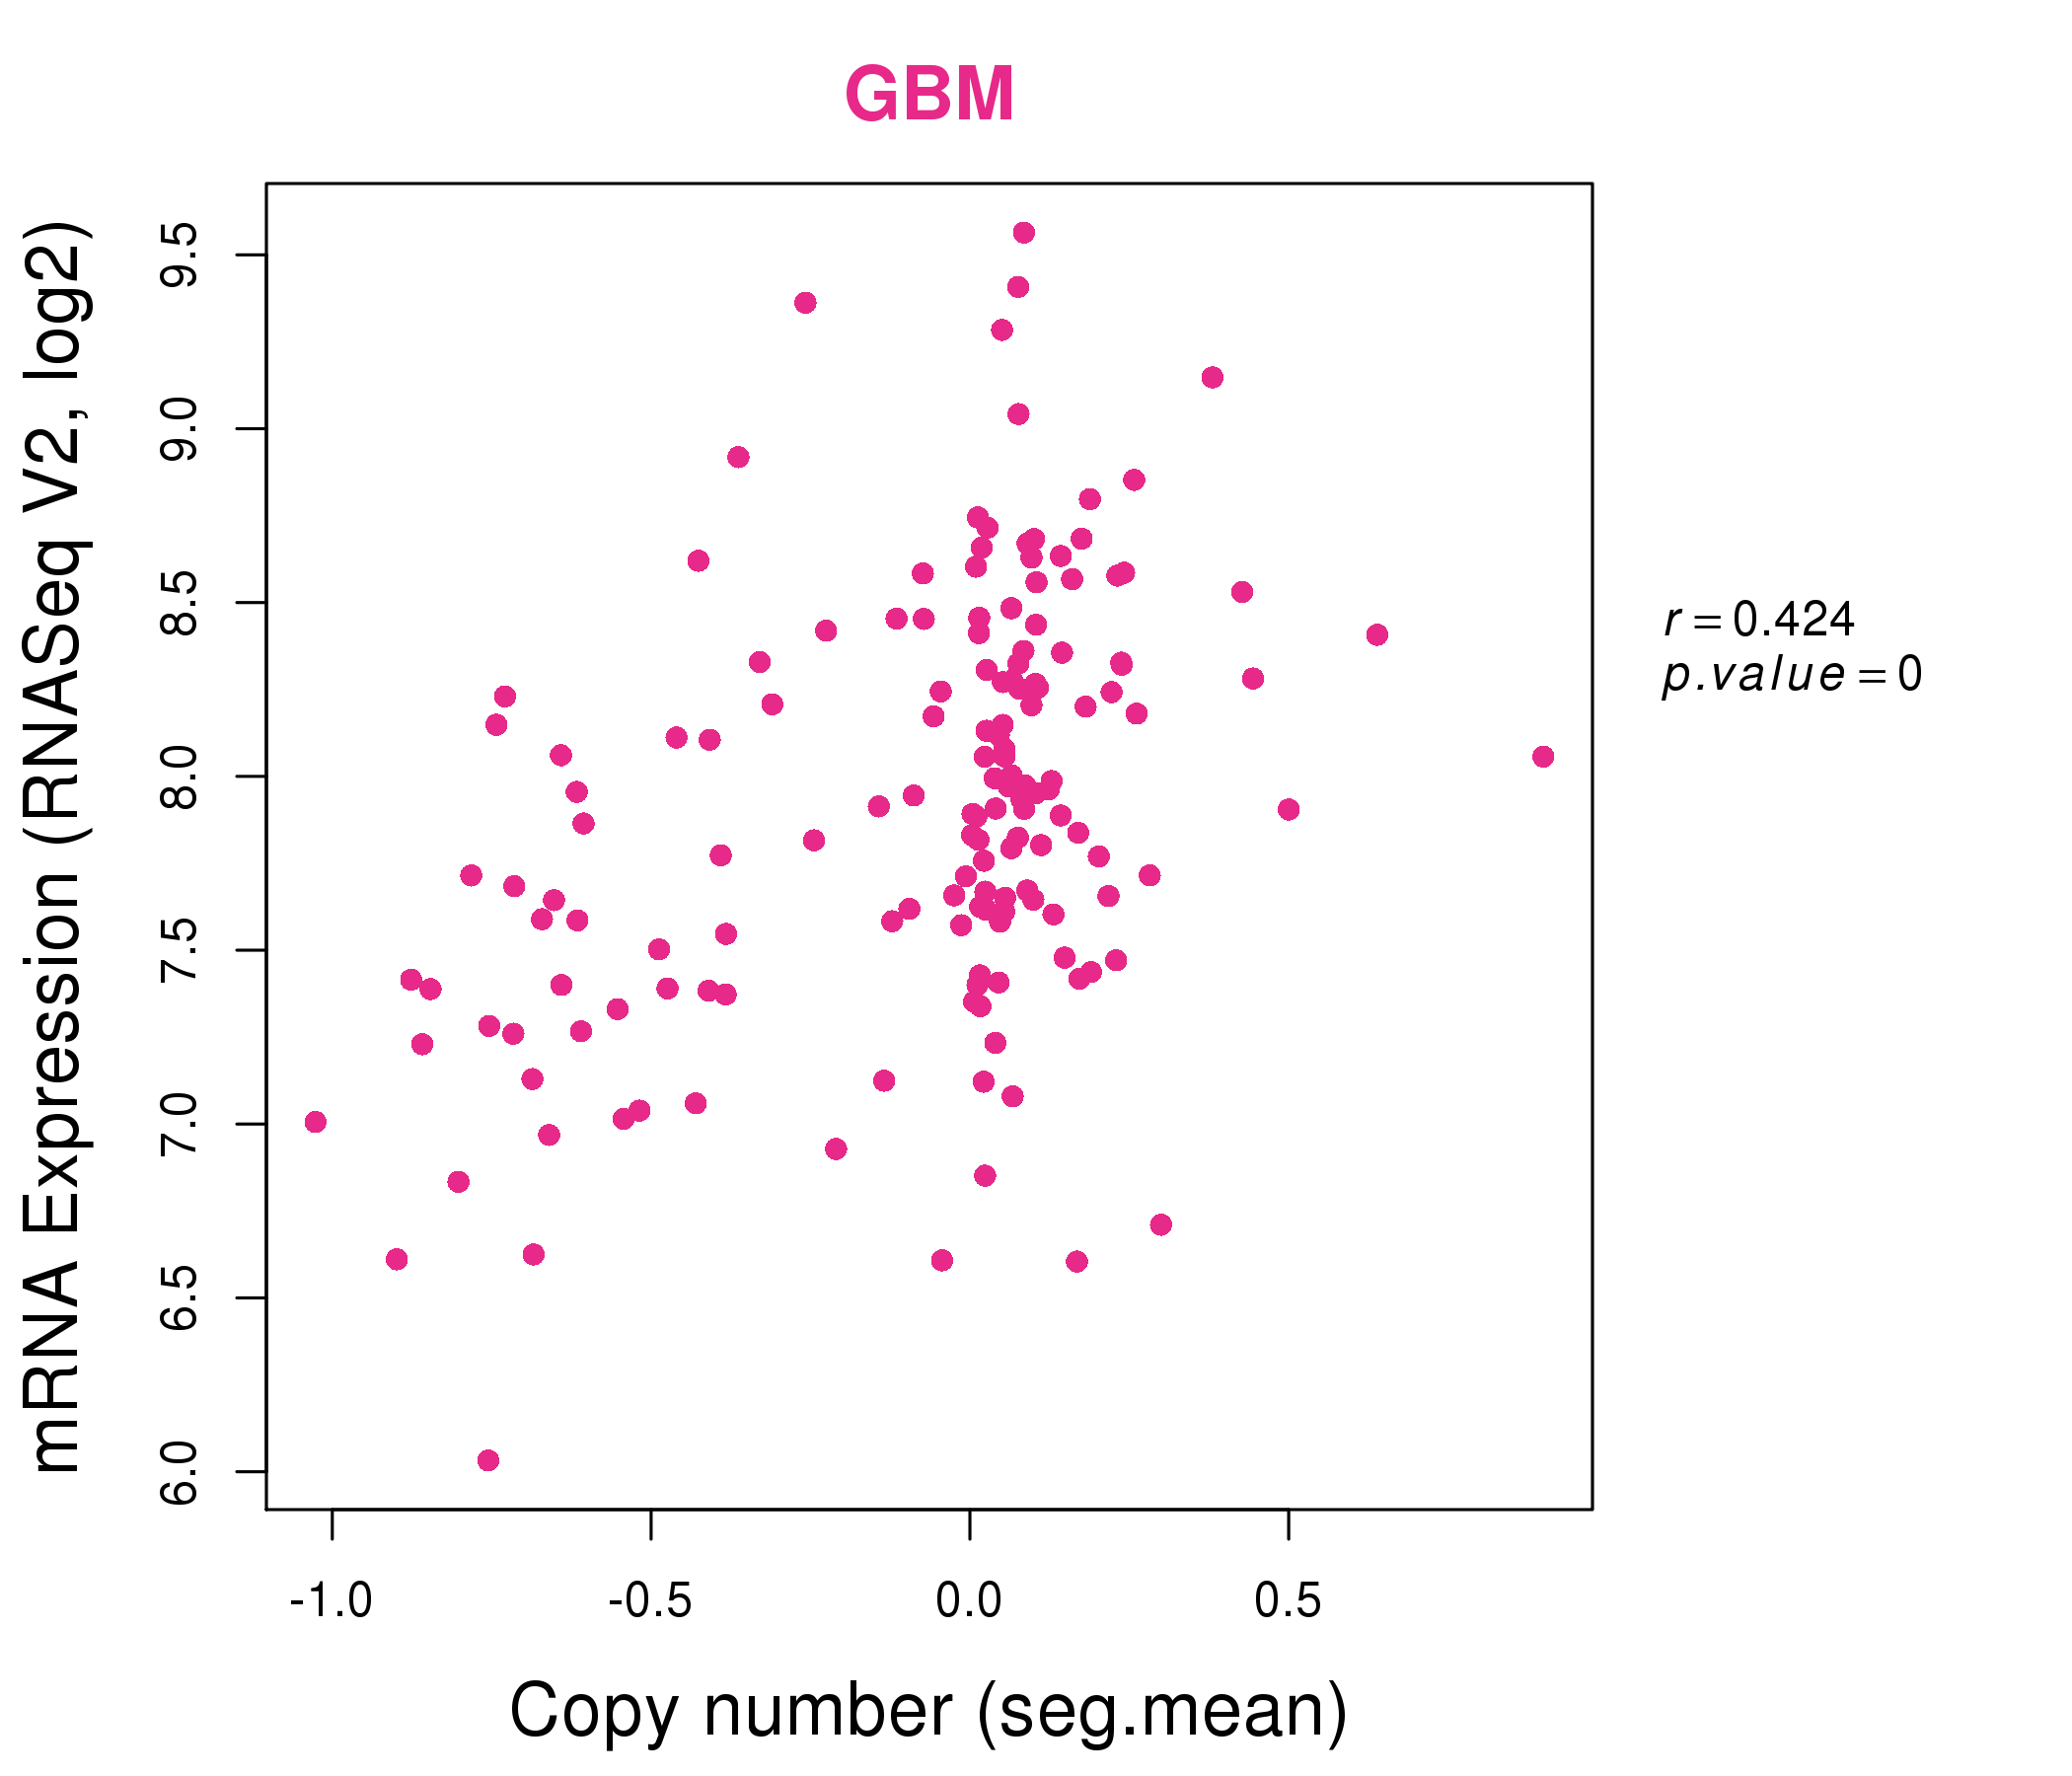
| * This plots show the correlation between CNV and gene expression. |
: Open all plots for all cancer types
 |
|
 |
|
| Top |
| Gene-Gene Network Information |
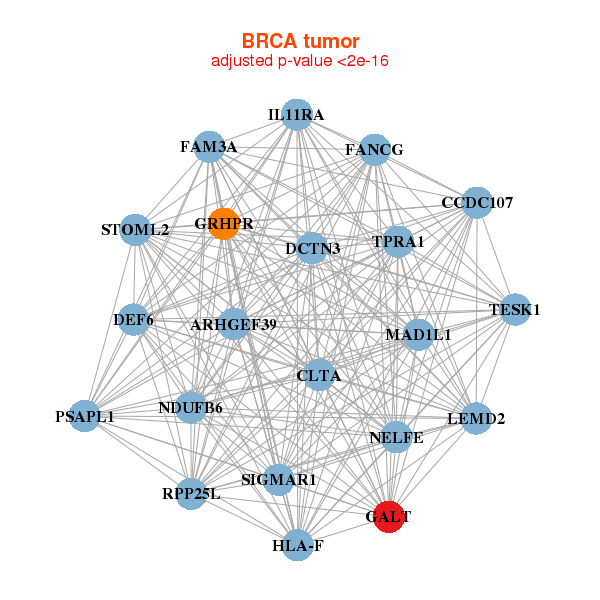
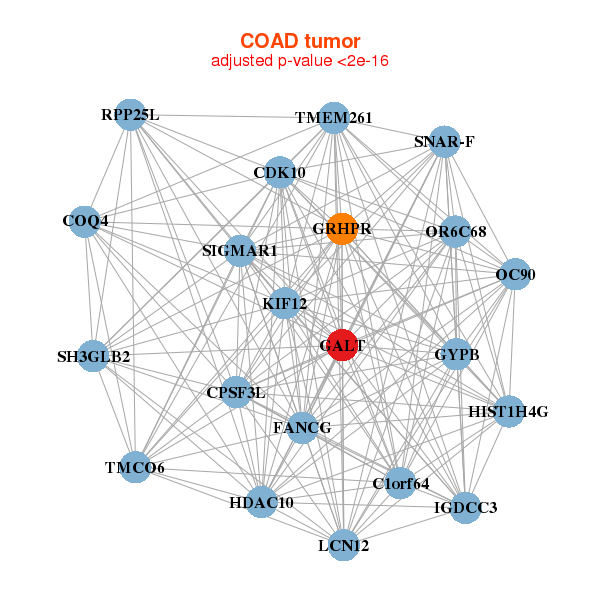
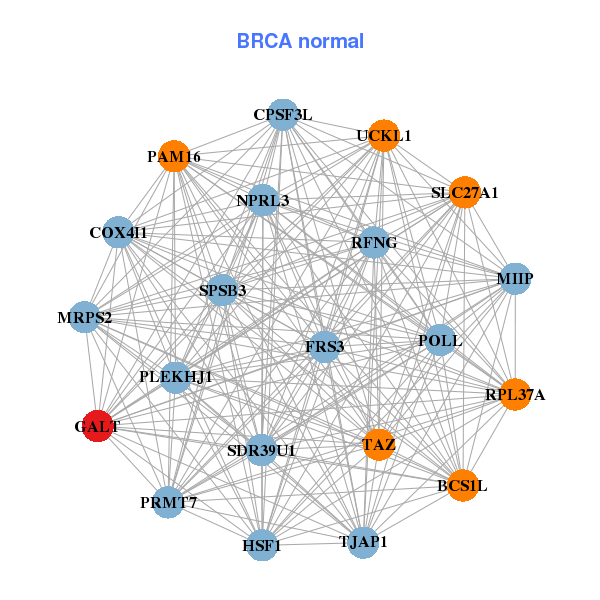
| * Co-Expression network figures were drawn using R package igraph. Only the top 20 genes with the highest correlations were shown. Red circle: input gene, orange circle: cell metabolism gene, sky circle: other gene |
: Open all plots for all cancer types
 |
| ||||
| ARHGEF39,RPP25L,CCDC107,CLTA,DCTN3,DEF6,FAM3A, FANCG,GALT,GRHPR,HLA-F,IL11RA,LEMD2,MAD1L1, NDUFB6,PSAPL1,NELFE,SIGMAR1,STOML2,TESK1,TPRA1 | BCS1L,COX4I1,CPSF3L,FRS3,GALT,HSF1,MIIP, MRPS2,NPRL3,PLEKHJ1,POLL,PRMT7,RFNG,RPL37A, SDR39U1,SLC27A1,SPSB3,TAZ,PAM16,TJAP1,UCKL1 | ||||
 |
| ||||
| C1orf64,TMEM261,RPP25L,CDK10,COQ4,CPSF3L,FANCG, GALT,GRHPR,GYPB,HDAC10,HIST1H4G,IGDCC3,KIF12, LCN12,OC90,OR6C68,SH3GLB2,SIGMAR1,SNAR-F,TMCO6 | ACY3,SLC25A47,DAK,DNASE1,EMB,FAM151A,FOXD1, GALT,HSD17B3,KDM8,LOC647121,MAF,MLXIPL,MMEL1, MST1,PFKFB4,PLB1,SAT2,TM4SF5,TMED4,TMPRSS7 |
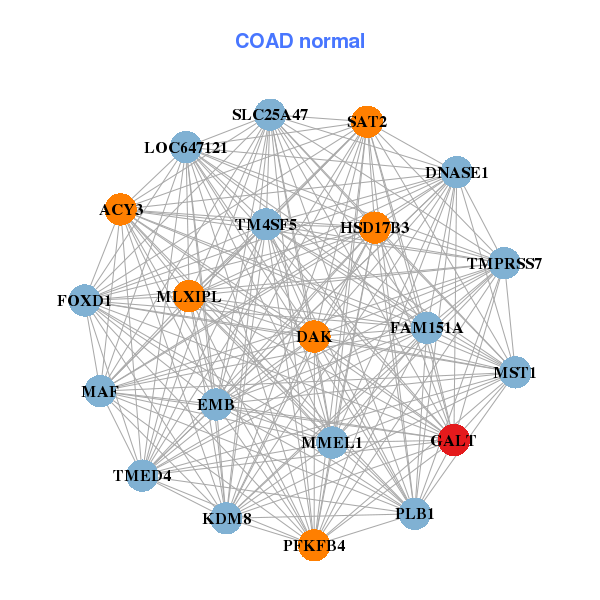
| * Co-Expression network figures were drawn using R package igraph. Only the top 20 genes with the highest correlations were shown. Red circle: input gene, orange circle: cell metabolism gene, sky circle: other gene |
: Open all plots for all cancer types
| Top |
: Open all interacting genes' information including KEGG pathway for all interacting genes from DAVID
| Top |
| Pharmacological Information for GALT |
| DB Category | DB Name | DB's ID and Url link |
| Organism-specific databases | PharmGKB | PA28548; -. |
| Organism-specific databases | PharmGKB | PA28548; -. |
| Organism-specific databases | CTD | 2592; -. |
| Organism-specific databases | CTD | 2592; -. |
| * Gene Centered Interaction Network. |
 |
| * Drug Centered Interaction Network. |
| DrugBank ID | Target Name | Drug Groups | Generic Name | Drug Centered Network | Drug Structure |
| DB01861 | galactose-1-phosphate uridylyltransferase | experimental | Glucose-Uridine-C1,5'-Diphosphate | 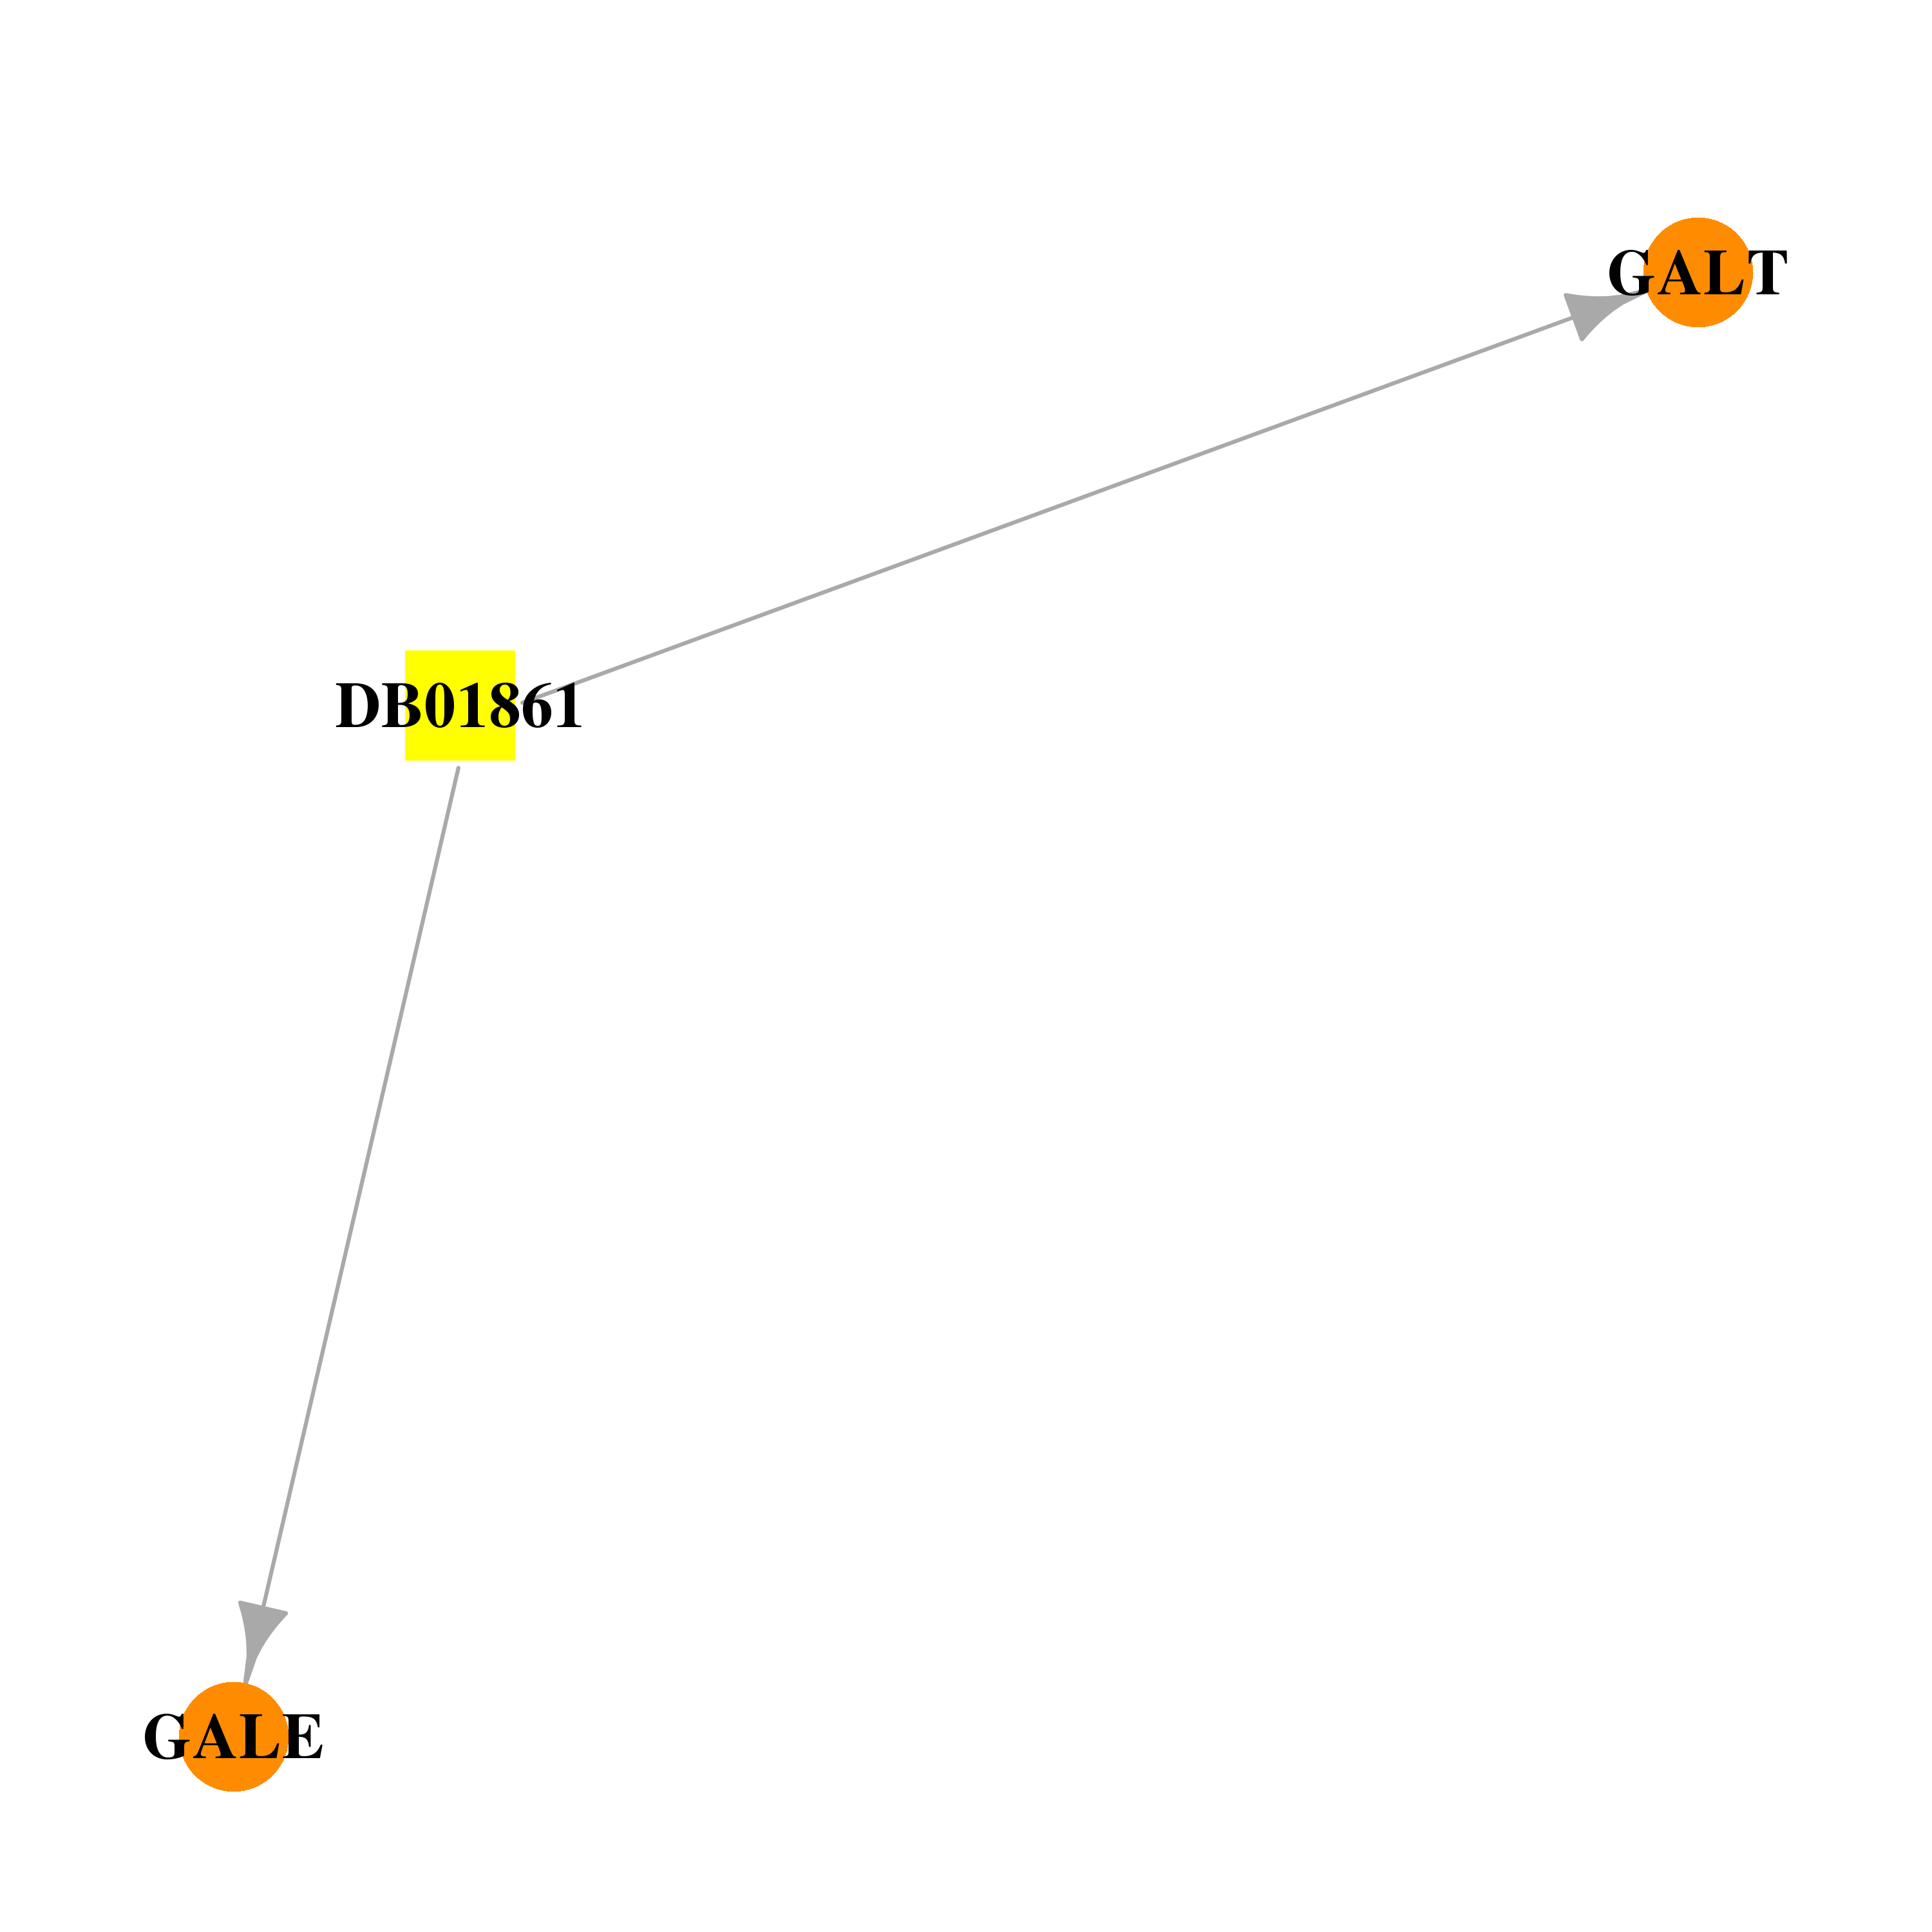 | 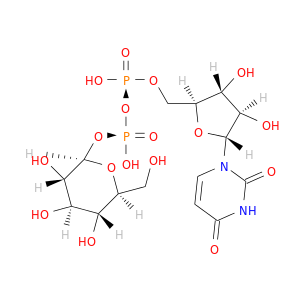 |
| DB03435 | galactose-1-phosphate uridylyltransferase | experimental | Uridine-5'-Diphosphate | 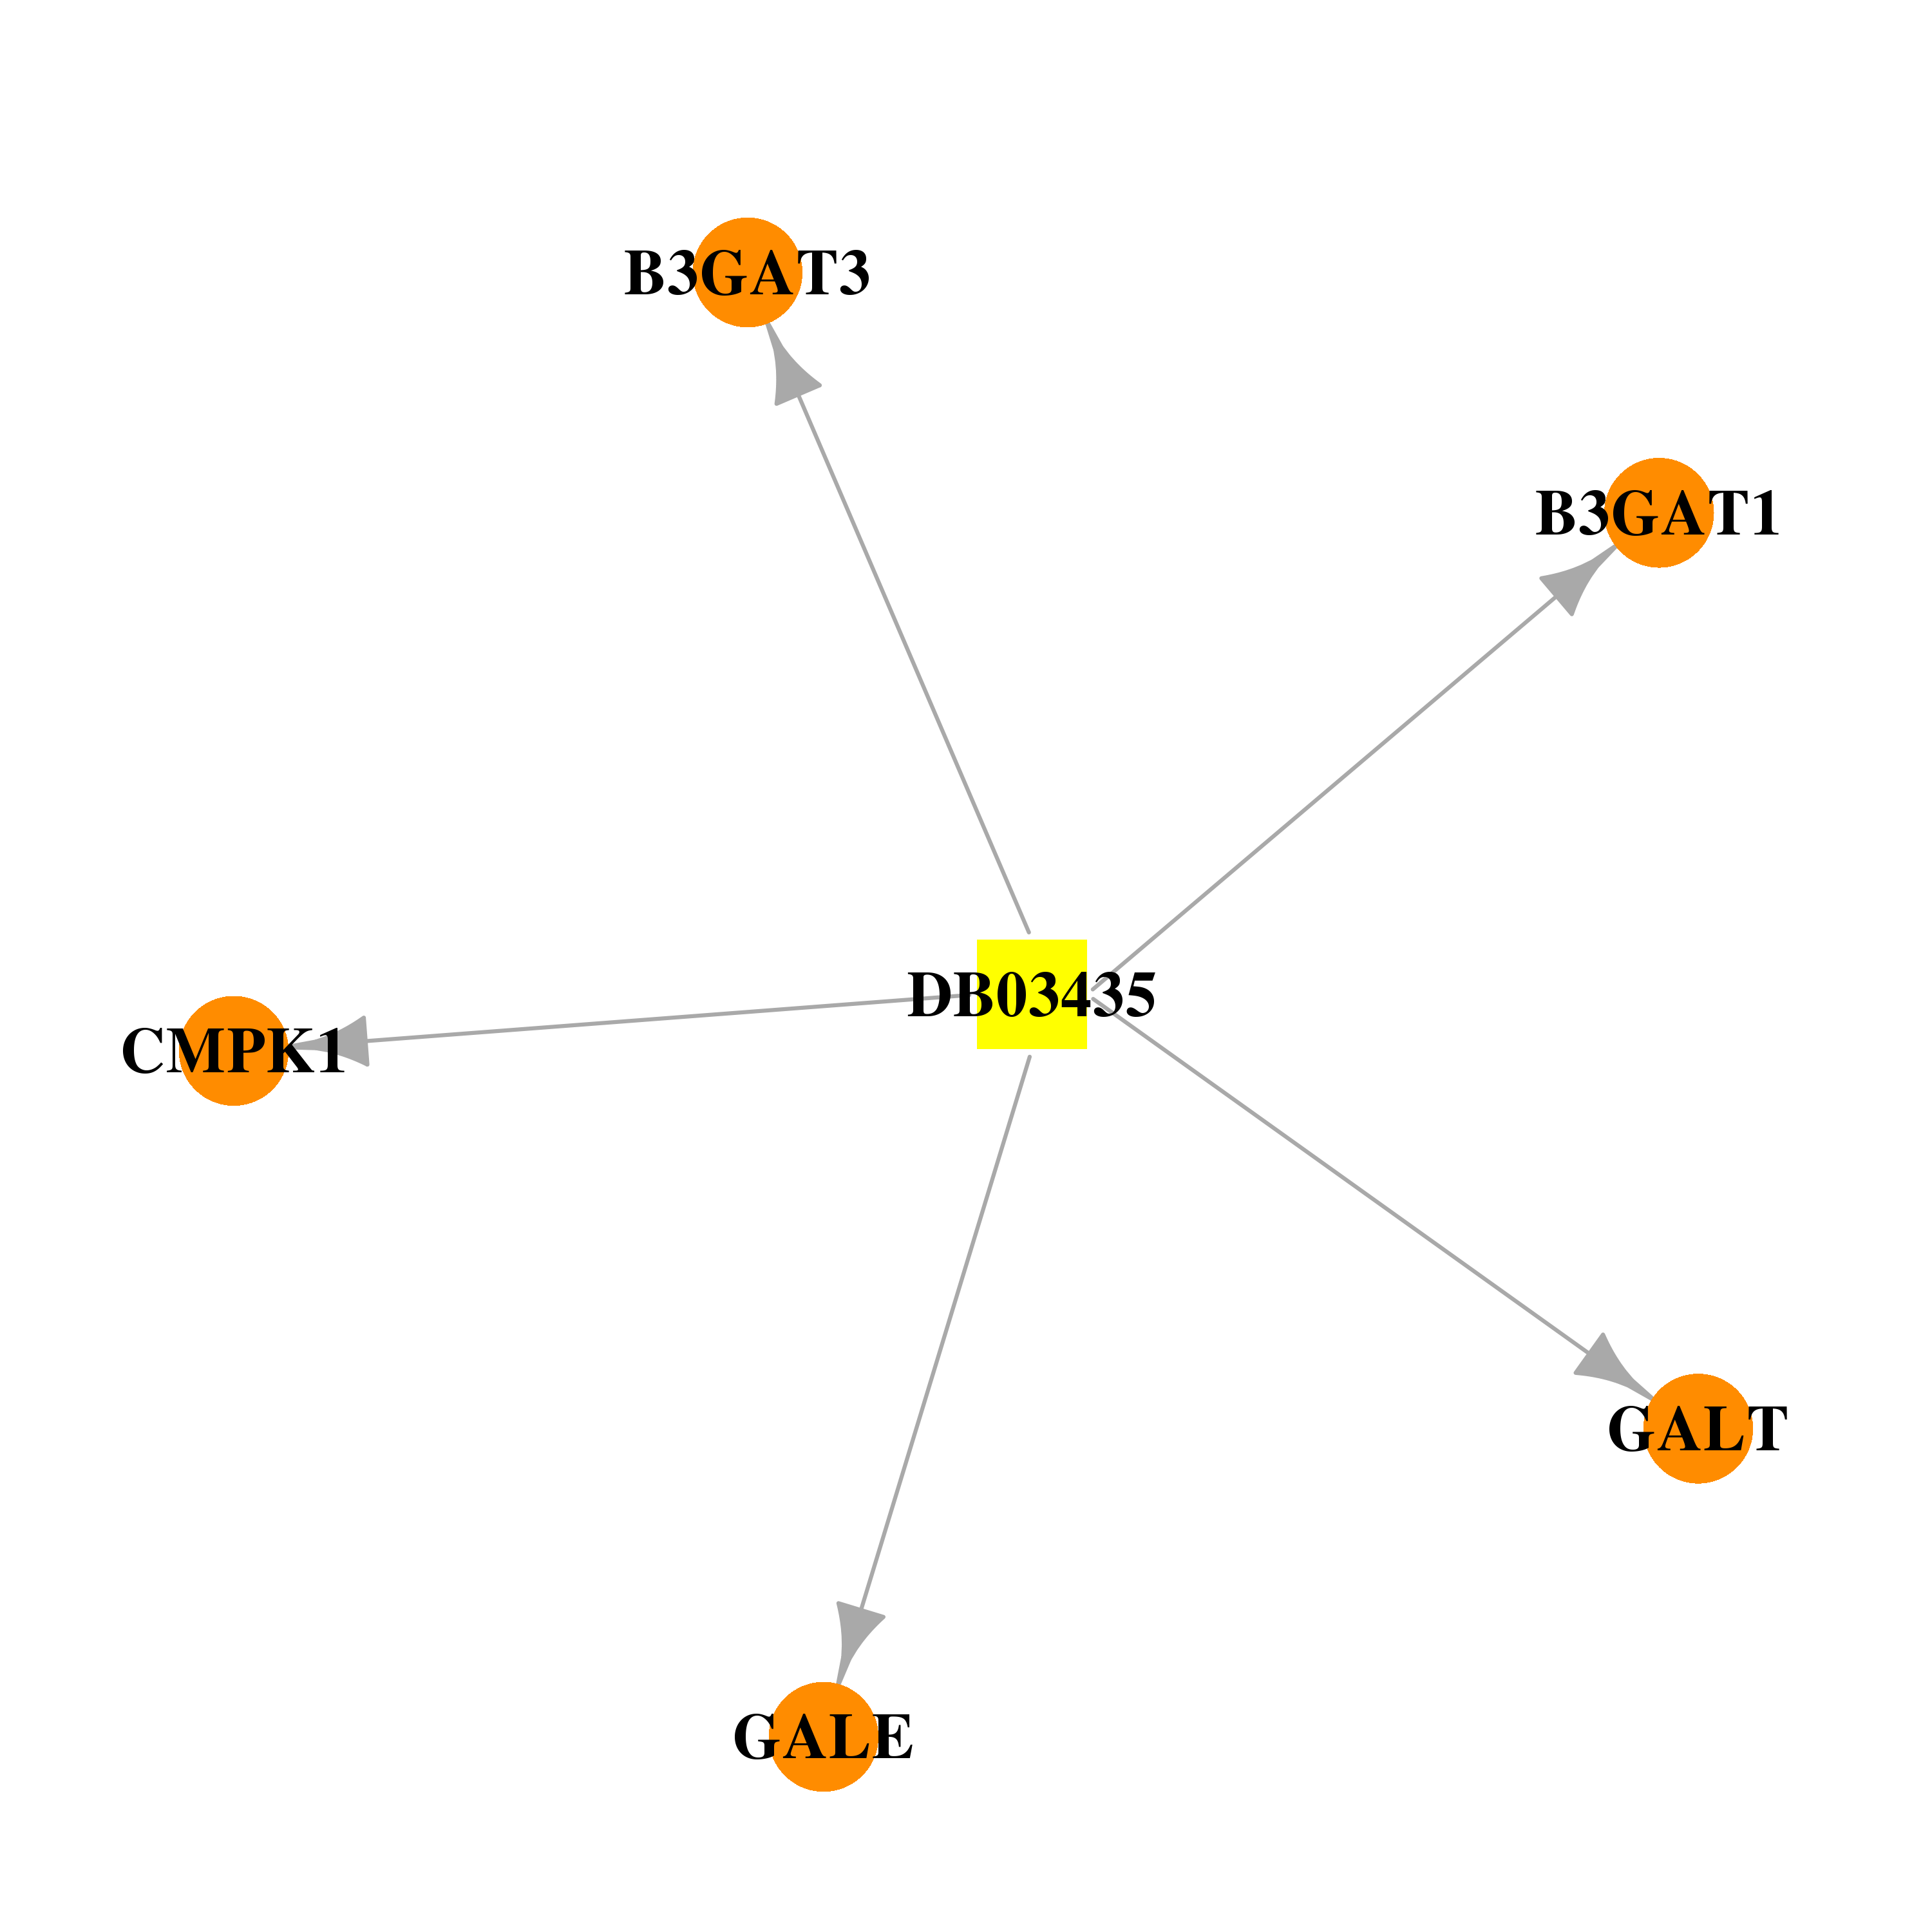 |  |
| DB03685 | galactose-1-phosphate uridylyltransferase | experimental | Uridine-5'-Monophosphate | 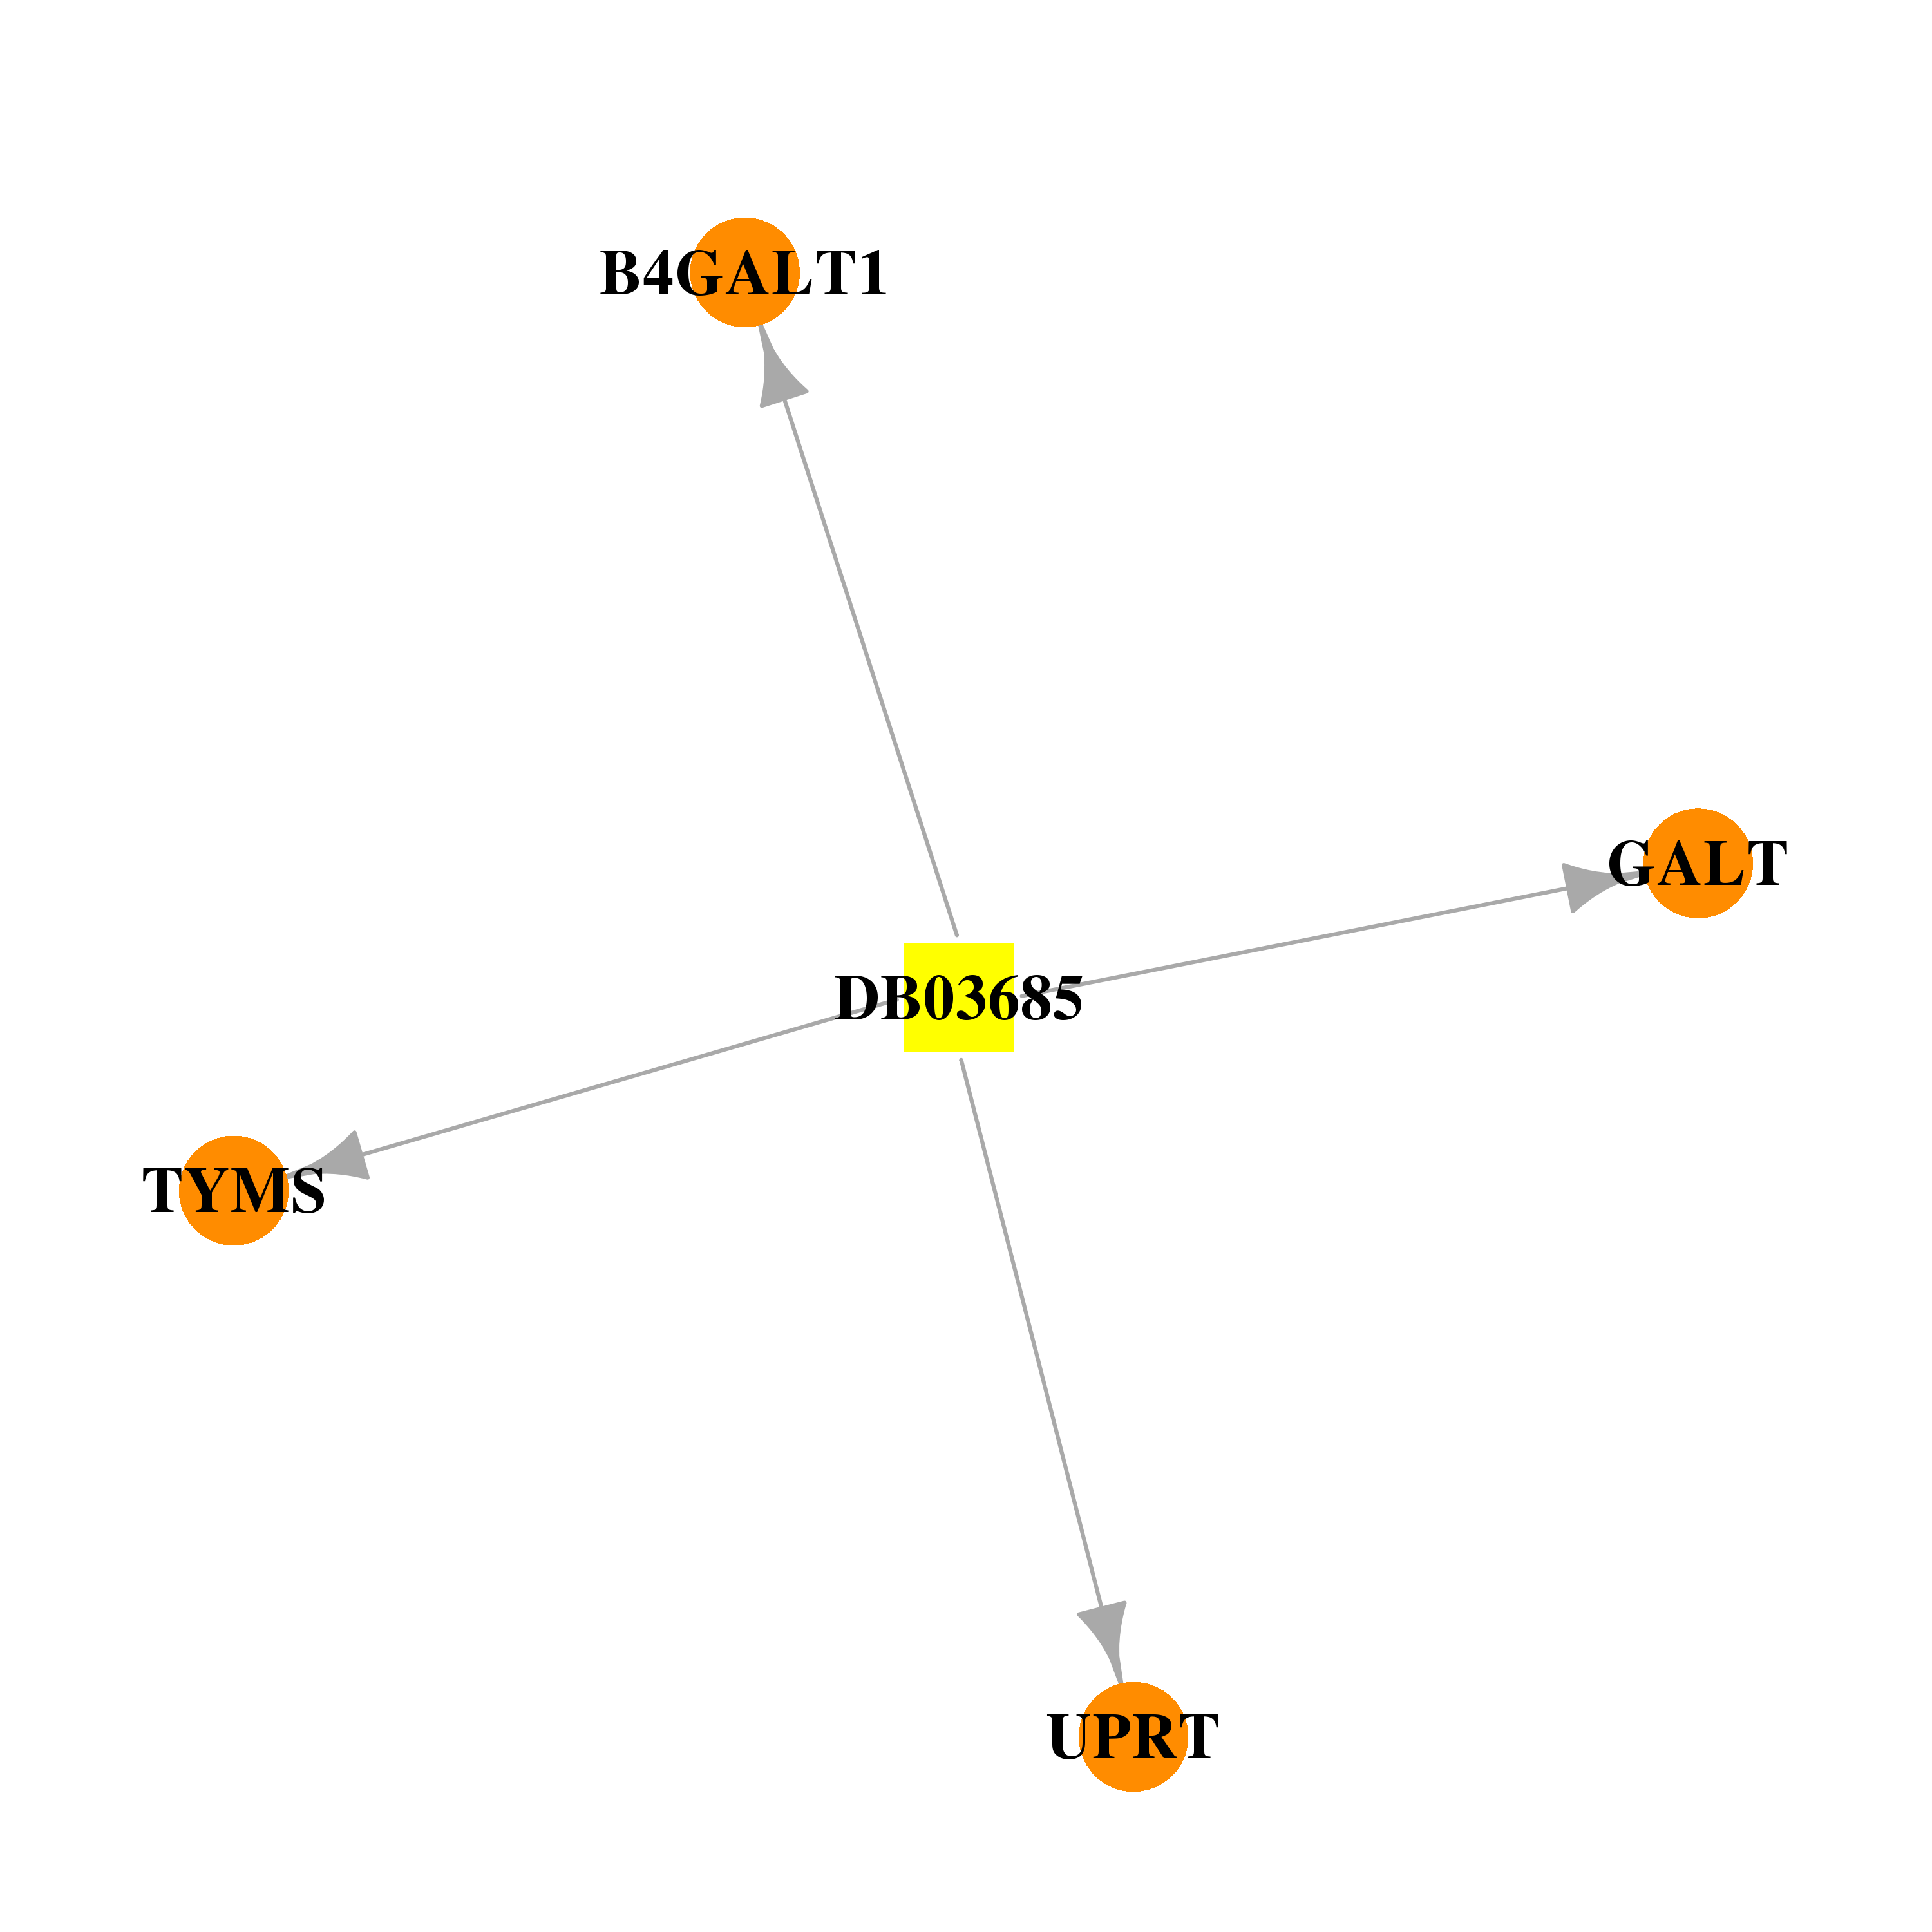 |  |
| Top |
| Cross referenced IDs for GALT |
| * We obtained these cross-references from Uniprot database. It covers 150 different DBs, 18 categories. http://www.uniprot.org/help/cross_references_section |
: Open all cross reference information
|
Copyright © 2016-Present - The Univsersity of Texas Health Science Center at Houston @ |