|
||||||||||||||||||||
| |
| Phenotypic Information (metabolism pathway, cancer, disease, phenome) |
| |
| |
| Gene-Gene Network Information: Co-Expression Network, Interacting Genes & KEGG |
| |
|


| Gene Summary for GEMIN5 |
| Top |
| Phenotypic Information for GEMIN5(metabolism pathway, cancer, disease, phenome) |
| Cancer | CGAP: GEMIN5 |
| Familial Cancer Database: GEMIN5 | |
| * This gene is included in those cancer gene databases. |
|
|
|
|
|
| . | ||||||||||||||
Oncogene 1 | Significant driver gene in | |||||||||||||||||||
| cf) number; DB name 1 Oncogene; http://nar.oxfordjournals.org/content/35/suppl_1/D721.long, 2 Tumor Suppressor gene; https://bioinfo.uth.edu/TSGene/, 3 Cancer Gene Census; http://www.nature.com/nrc/journal/v4/n3/abs/nrc1299.html, 4 CancerGenes; http://nar.oxfordjournals.org/content/35/suppl_1/D721.long, 5 Network of Cancer Gene; http://ncg.kcl.ac.uk/index.php, 1Therapeutic Vulnerabilities in Cancer; http://cbio.mskcc.org/cancergenomics/statius/ |
| REACTOME_METABOLISM_OF_NON_CODING_RNA REACTOME_METABOLISM_OF_RNA | |
| OMIM | |
| Orphanet | |
| Disease | KEGG Disease: GEMIN5 |
| MedGen: GEMIN5 (Human Medical Genetics with Condition) | |
| ClinVar: GEMIN5 | |
| Phenotype | MGI: GEMIN5 (International Mouse Phenotyping Consortium) |
| PhenomicDB: GEMIN5 | |
| Mutations for GEMIN5 |
| * Under tables are showing count per each tissue to give us broad intuition about tissue specific mutation patterns.You can go to the detailed page for each mutation database's web site. |
| - Statistics for Tissue and Mutation type | Top |
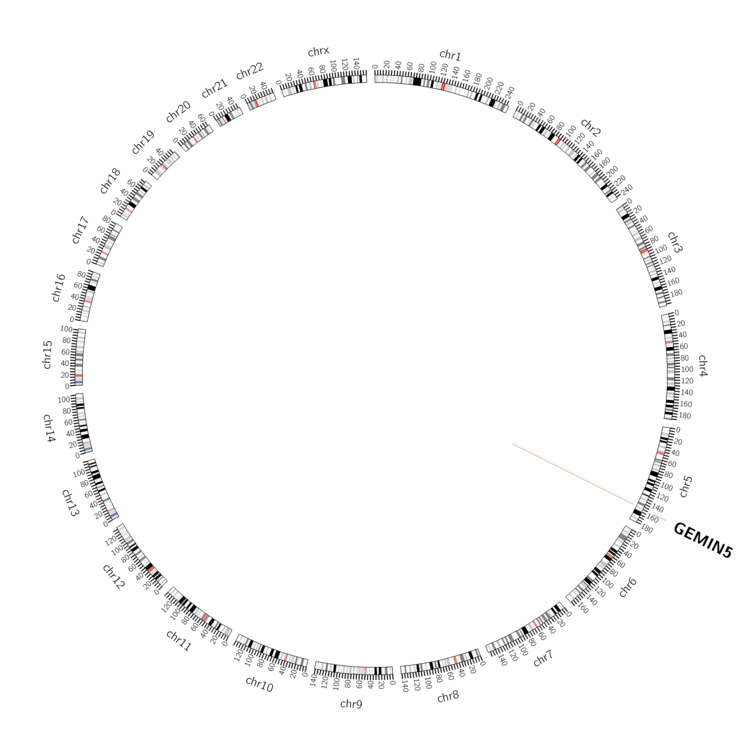 |
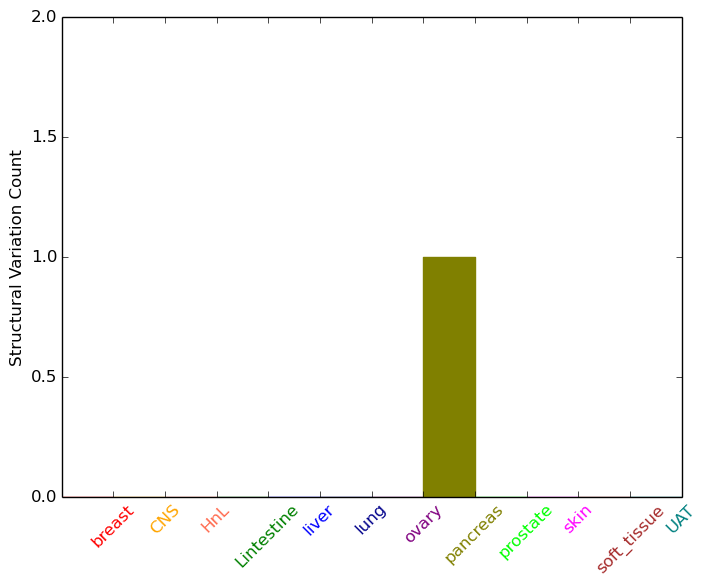
| - For Inter-chromosomal Variations |
| There's no inter-chromosomal structural variation. |
| - For Intra-chromosomal Variations |
| * Intra-chromosomal variantions includes 'intrachromosomal amplicon to amplicon', 'intrachromosomal amplicon to non-amplified dna', 'intrachromosomal deletion', 'intrachromosomal fold-back inversion', 'intrachromosomal inversion', 'intrachromosomal tandem duplication', 'Intrachromosomal unknown type', 'intrachromosomal with inverted orientation', 'intrachromosomal with non-inverted orientation'. |
 |
| Sample | Symbol_a | Chr_a | Start_a | End_a | Symbol_b | Chr_b | Start_b | End_b |
| pancreas | GEMIN5 | chr5 | 154269877 | 154269897 | GEMIN5 | chr5 | 154270197 | 154270217 |
| cf) Tissue number; Tissue name (1;Breast, 2;Central_nervous_system, 3;Haematopoietic_and_lymphoid_tissue, 4;Large_intestine, 5;Liver, 6;Lung, 7;Ovary, 8;Pancreas, 9;Prostate, 10;Skin, 11;Soft_tissue, 12;Upper_aerodigestive_tract) |
| * From mRNA Sanger sequences, Chitars2.0 arranged chimeric transcripts. This table shows GEMIN5 related fusion information. |
| ID | Head Gene | Tail Gene | Accession | Gene_a | qStart_a | qEnd_a | Chromosome_a | tStart_a | tEnd_a | Gene_a | qStart_a | qEnd_a | Chromosome_a | tStart_a | tEnd_a |
| AI749414 | CCL21 | 45 | 136 | 9 | 34709048 | 34709139 | GEMIN5 | 128 | 282 | 5 | 154267757 | 154267910 | |
| BF445444 | GEMIN5 | 1 | 202 | 5 | 154311978 | 154312179 | TACC1 | 199 | 351 | 8 | 38598521 | 38598673 | |
| Top |
| There's no copy number variation information in COSMIC data for this gene. |
| Top |
|
 |
| Top |
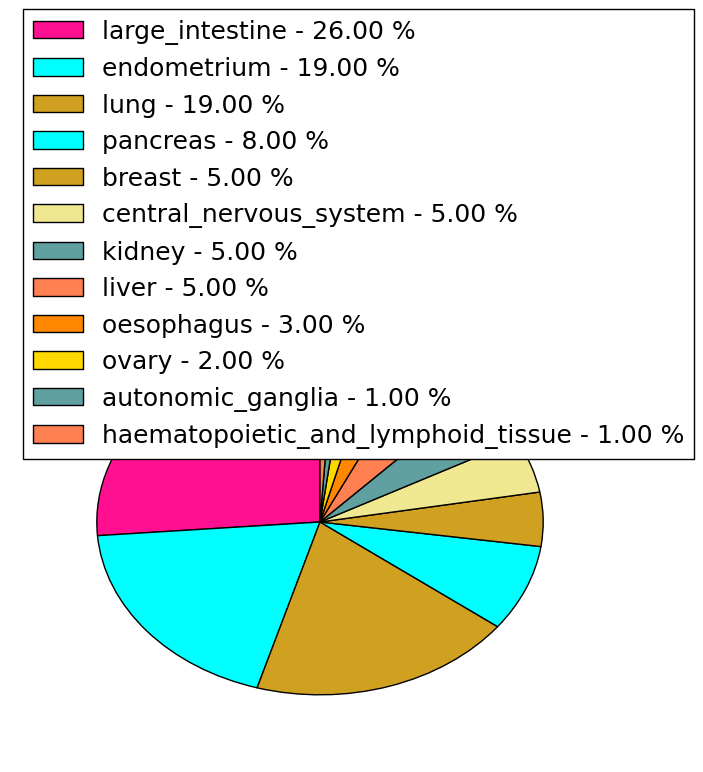
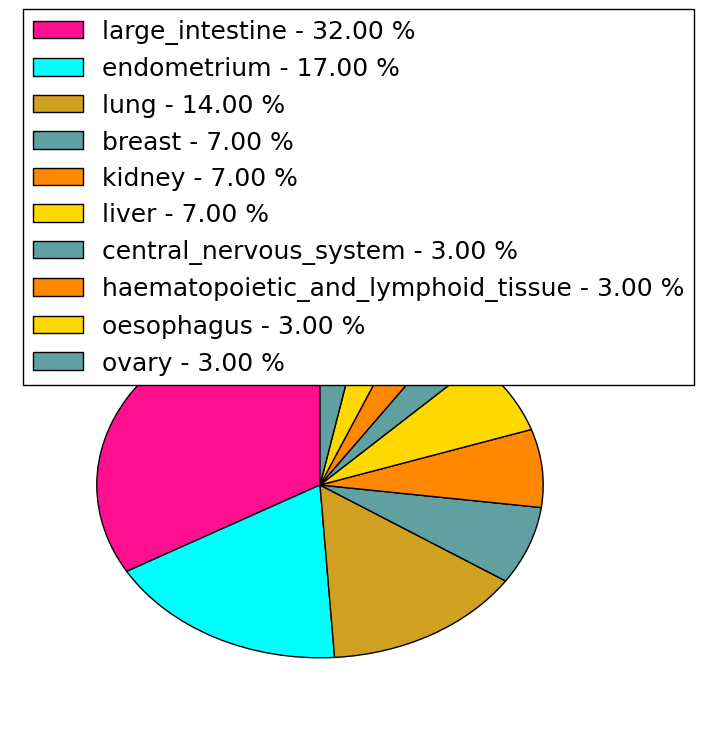
| Stat. for Non-Synonymous SNVs (# total SNVs=99) | (# total SNVs=28) |
 |  |
(# total SNVs=1) | (# total SNVs=0) |
 |
| Top |
| * When you move the cursor on each content, you can see more deailed mutation information on the Tooltip. Those are primary_site,primary_histology,mutation(aa),pubmedID. |
| GRCh37 position | Mutation(aa) | Unique sampleID count |
| chr5:154287276-154287276 | p.S757L | 3 |
| chr5:154308151-154308151 | p.R284C | 3 |
| chr5:154296690-154296690 | p.Q575K | 2 |
| chr5:154308174-154308174 | p.G276V | 2 |
| chr5:154317530-154317530 | p.R55Q | 2 |
| chr5:154300914-154300914 | p.P484L | 2 |
| chr5:154311726-154311726 | p.I198I | 2 |
| chr5:154315577-154315577 | p.T111T | 2 |
| chr5:154281030-154281030 | p.W961* | 2 |
| chr5:154282138-154282138 | p.G943R | 2 |
| Top |
|
 |
| Point Mutation/ Tissue ID | 1 | 2 | 3 | 4 | 5 | 6 | 7 | 8 | 9 | 10 | 11 | 12 | 13 | 14 | 15 | 16 | 17 | 18 | 19 | 20 |
| # sample | 4 | 3 | 1 | 21 | 2 | 4 | 7 | 7 | 5 | 1 | 13 | 5 | 1 | 14 | ||||||
| # mutation | 4 | 3 | 1 | 25 | 2 | 4 | 7 | 7 | 5 | 1 | 16 | 6 | 1 | 21 | ||||||
| nonsynonymous SNV | 1 | 2 | 18 | 1 | 2 | 4 | 5 | 4 | 1 | 12 | 5 | 1 | 16 | |||||||
| synonymous SNV | 3 | 1 | 1 | 7 | 1 | 2 | 3 | 2 | 1 | 4 | 1 | 5 |
| cf) Tissue ID; Tissue type (1; BLCA[Bladder Urothelial Carcinoma], 2; BRCA[Breast invasive carcinoma], 3; CESC[Cervical squamous cell carcinoma and endocervical adenocarcinoma], 4; COAD[Colon adenocarcinoma], 5; GBM[Glioblastoma multiforme], 6; Glioma Low Grade, 7; HNSC[Head and Neck squamous cell carcinoma], 8; KICH[Kidney Chromophobe], 9; KIRC[Kidney renal clear cell carcinoma], 10; KIRP[Kidney renal papillary cell carcinoma], 11; LAML[Acute Myeloid Leukemia], 12; LUAD[Lung adenocarcinoma], 13; LUSC[Lung squamous cell carcinoma], 14; OV[Ovarian serous cystadenocarcinoma ], 15; PAAD[Pancreatic adenocarcinoma], 16; PRAD[Prostate adenocarcinoma], 17; SKCM[Skin Cutaneous Melanoma], 18:STAD[Stomach adenocarcinoma], 19:THCA[Thyroid carcinoma], 20:UCEC[Uterine Corpus Endometrial Carcinoma]) |
| Top |
| * We represented just top 10 SNVs. When you move the cursor on each content, you can see more deailed mutation information on the Tooltip. Those are primary_site, primary_histology, mutation(aa), pubmedID. |
| Genomic Position | Mutation(aa) | Unique sampleID count |
| chr5:154272068 | p.S756L,GEMIN5 | 2 |
| chr5:154287276 | p.L1212L,GEMIN5 | 2 |
| chr5:154275815 | p.K459R,GEMIN5 | 1 |
| chr5:154287306 | p.S200C,GEMIN5 | 1 |
| chr5:154311726 | p.A1364V,GEMIN5 | 1 |
| chr5:154270801 | p.H1145D,GEMIN5 | 1 |
| chr5:154280932 | p.V934V,GEMIN5 | 1 |
| chr5:154296726 | p.G423G,GEMIN5 | 1 |
| chr5:154271173 | p.I198I,GEMIN5 | 1 |
| chr5:154284938 | p.S1360L,GEMIN5 | 1 |
| * Copy number data were extracted from TCGA using R package TCGA-Assembler. The URLs of all public data files on TCGA DCC data server were gathered on Jan-05-2015. Function ProcessCNAData in TCGA-Assembler package was used to obtain gene-level copy number value which is calculated as the average copy number of the genomic region of a gene. |
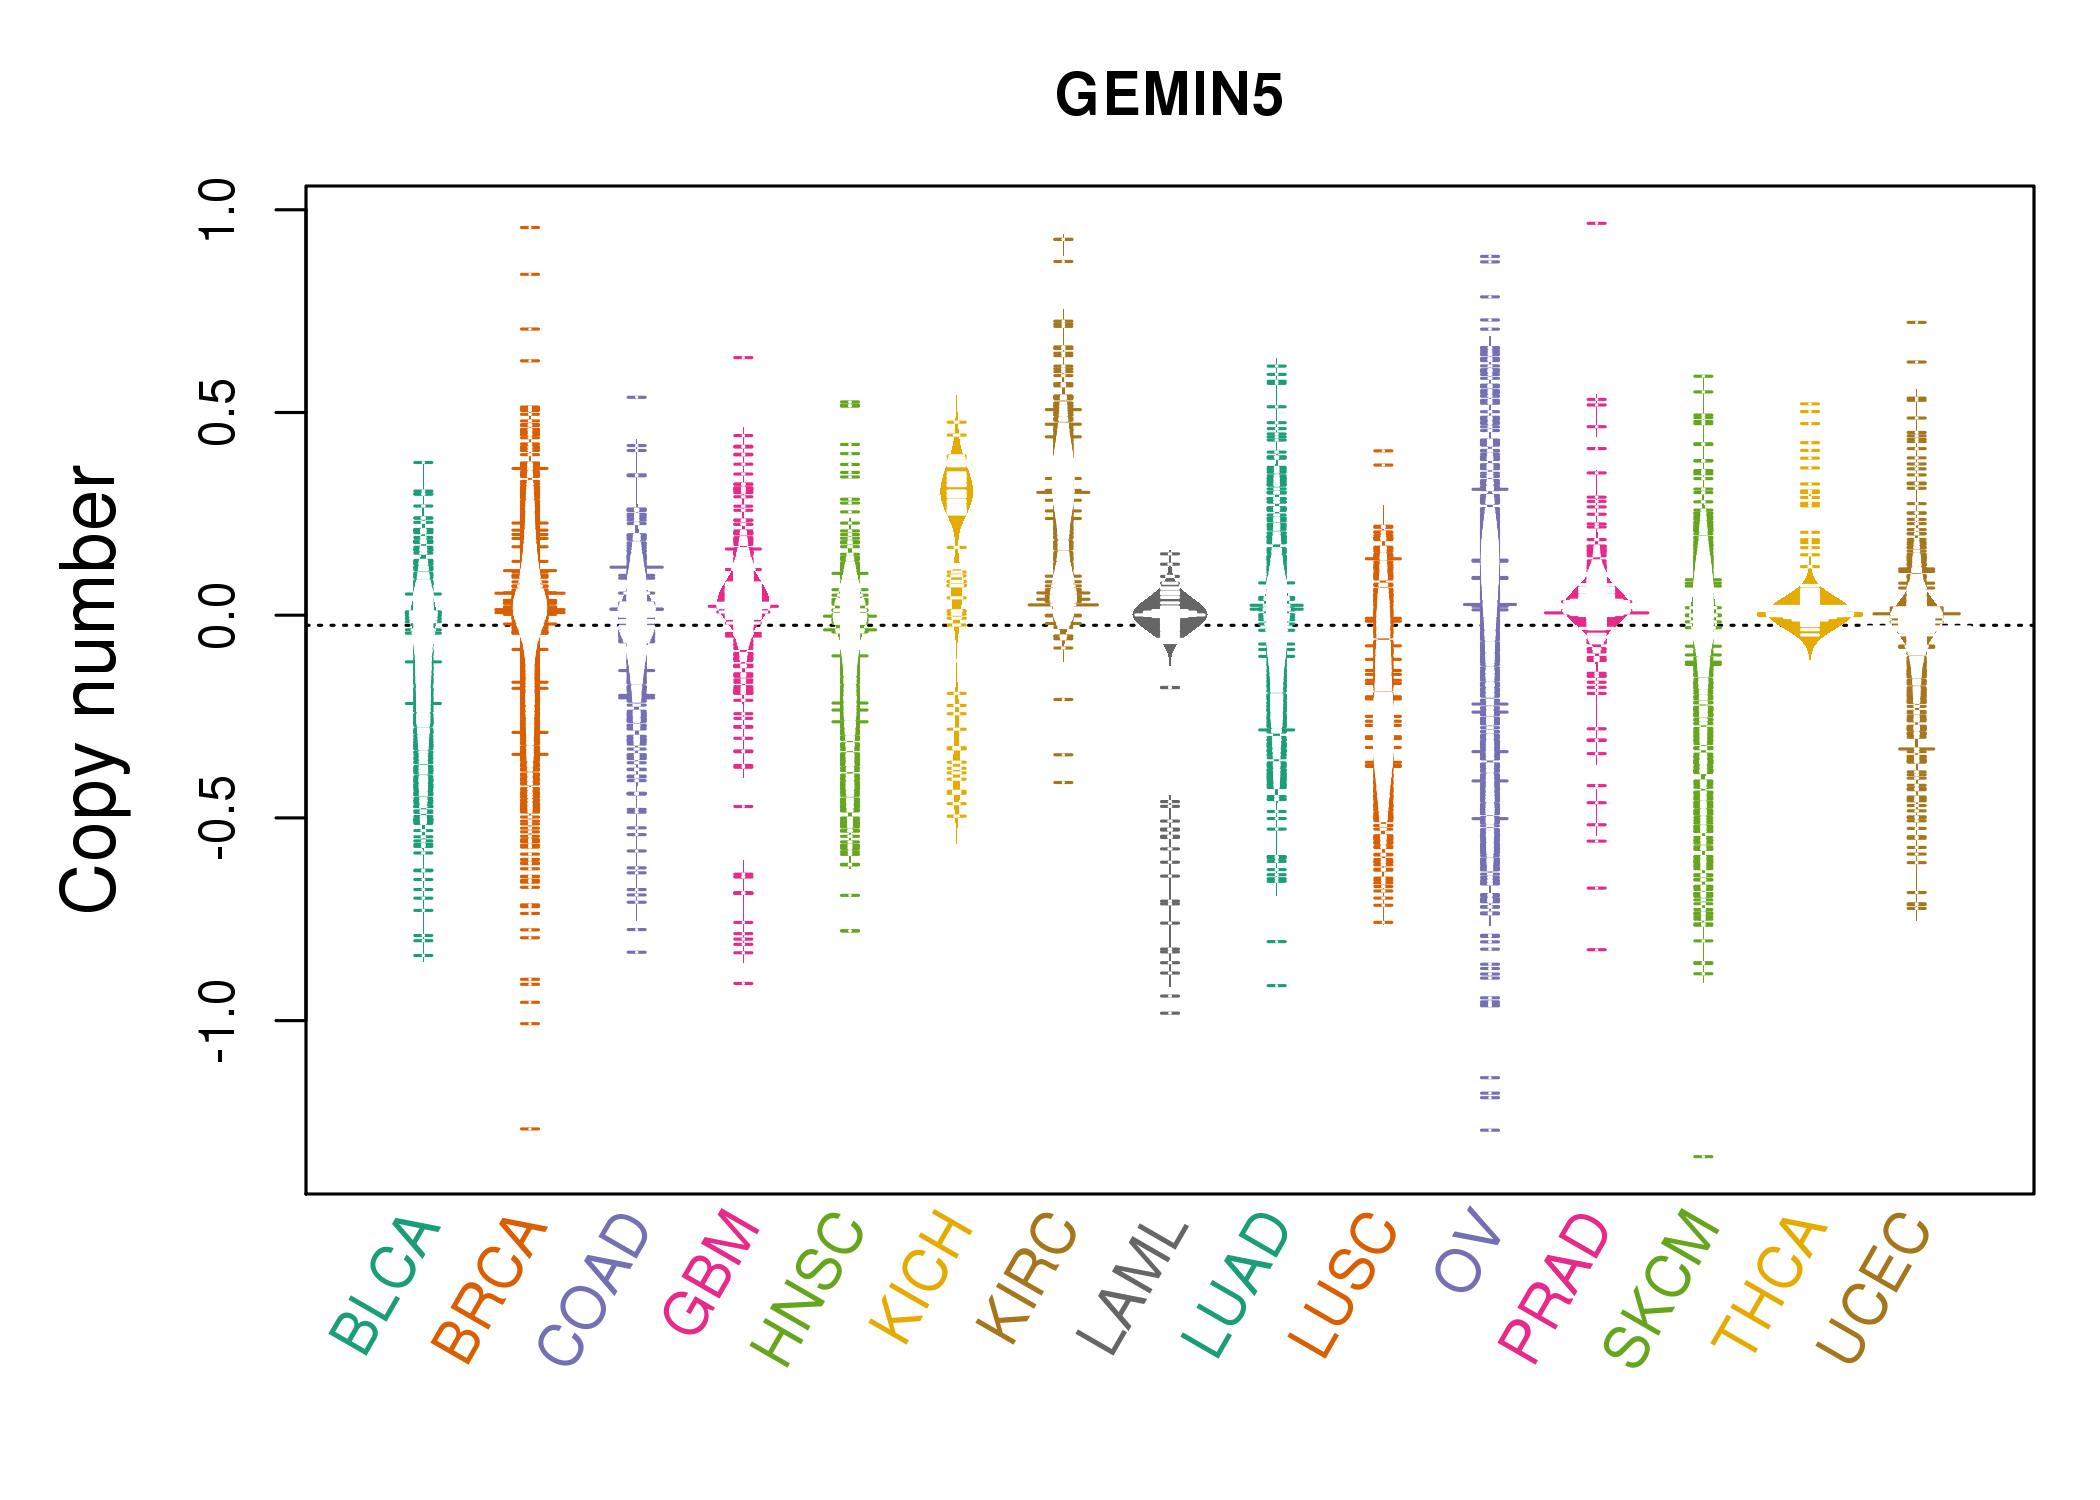 |
| cf) Tissue ID[Tissue type]: BLCA[Bladder Urothelial Carcinoma], BRCA[Breast invasive carcinoma], CESC[Cervical squamous cell carcinoma and endocervical adenocarcinoma], COAD[Colon adenocarcinoma], GBM[Glioblastoma multiforme], Glioma Low Grade, HNSC[Head and Neck squamous cell carcinoma], KICH[Kidney Chromophobe], KIRC[Kidney renal clear cell carcinoma], KIRP[Kidney renal papillary cell carcinoma], LAML[Acute Myeloid Leukemia], LUAD[Lung adenocarcinoma], LUSC[Lung squamous cell carcinoma], OV[Ovarian serous cystadenocarcinoma ], PAAD[Pancreatic adenocarcinoma], PRAD[Prostate adenocarcinoma], SKCM[Skin Cutaneous Melanoma], STAD[Stomach adenocarcinoma], THCA[Thyroid carcinoma], UCEC[Uterine Corpus Endometrial Carcinoma] |
| Top |
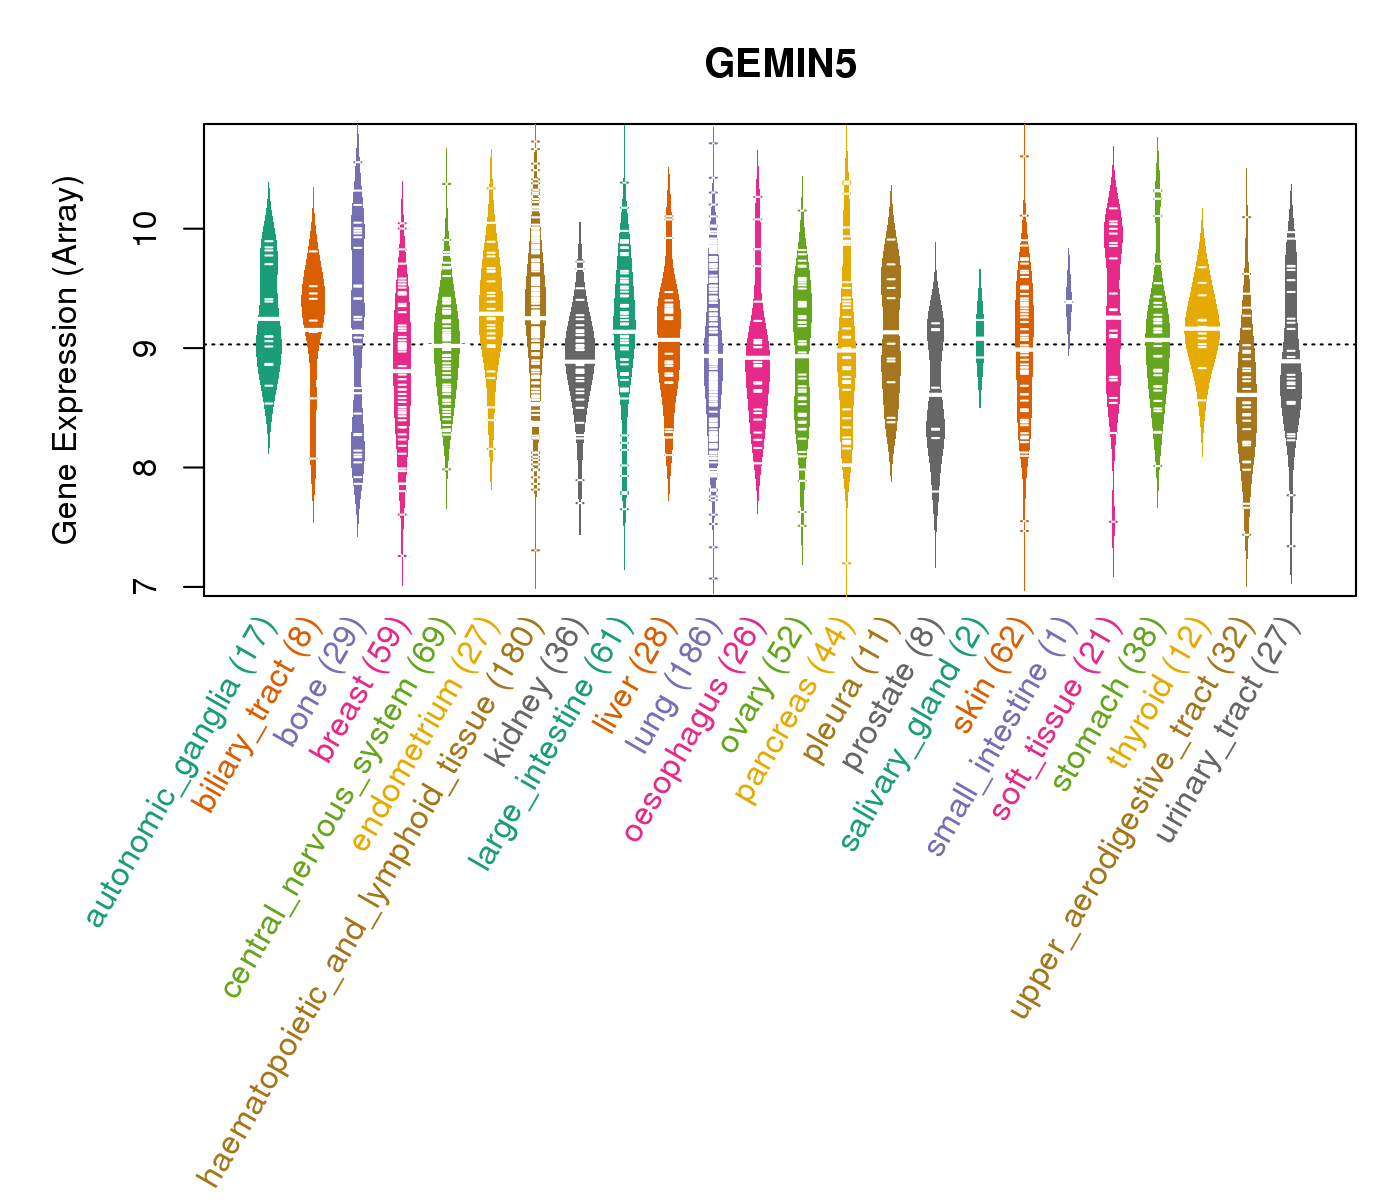
| Gene Expression for GEMIN5 |
| * CCLE gene expression data were extracted from CCLE_Expression_Entrez_2012-10-18.res: Gene-centric RMA-normalized mRNA expression data. |
 |
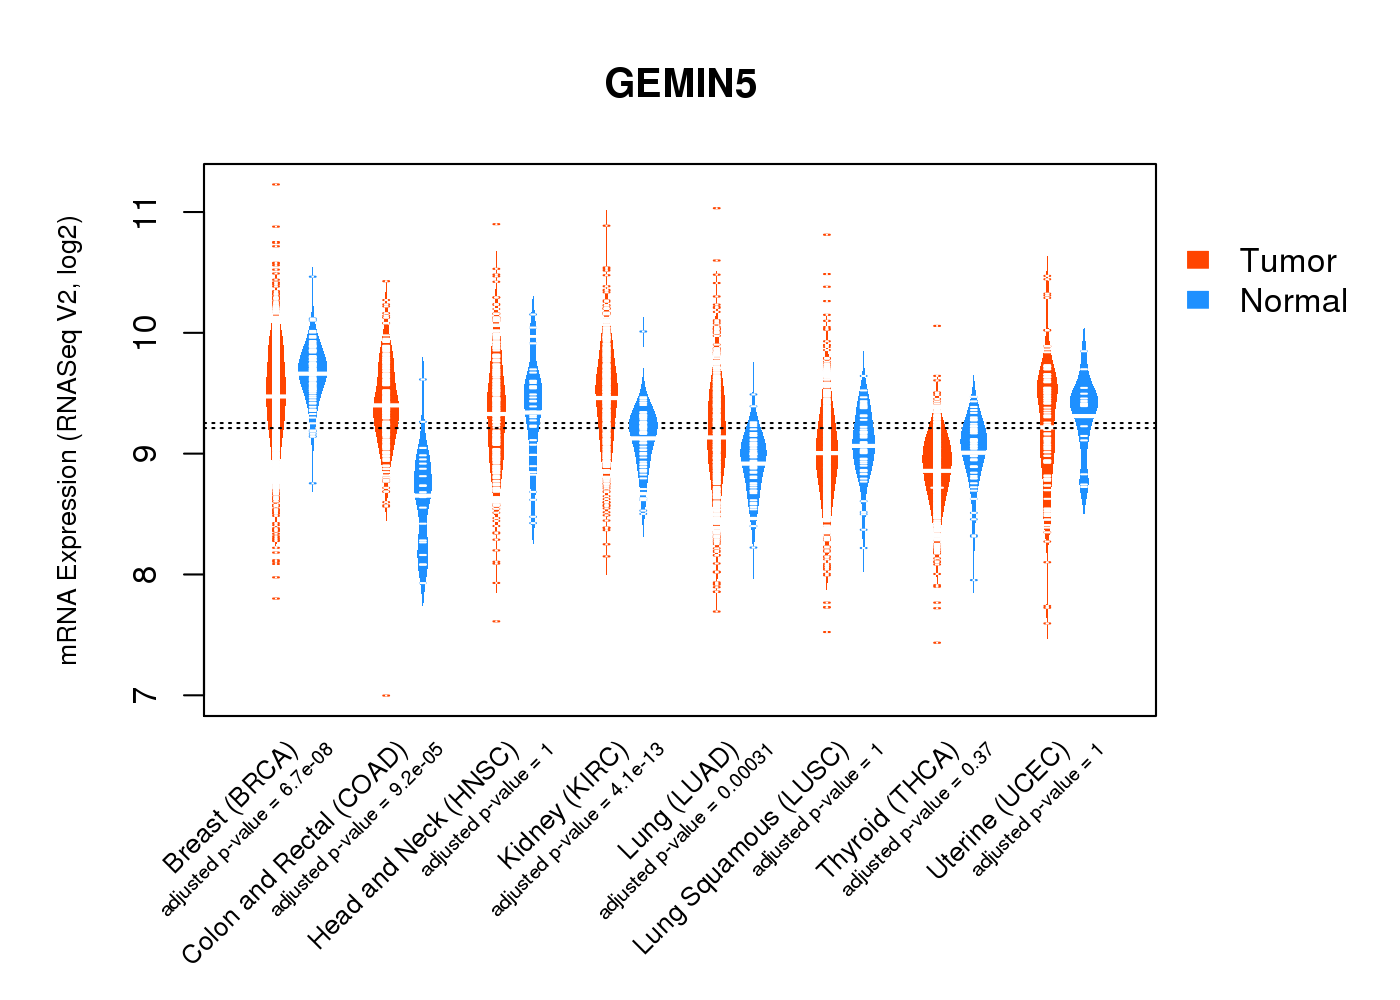
| * Normalized gene expression data of RNASeqV2 was extracted from TCGA using R package TCGA-Assembler. The URLs of all public data files on TCGA DCC data server were gathered at Jan-05-2015. Only eight cancer types have enough normal control samples for differential expression analysis. (t test, adjusted p<0.05 (using Benjamini-Hochberg FDR)) |
 |
| Top |
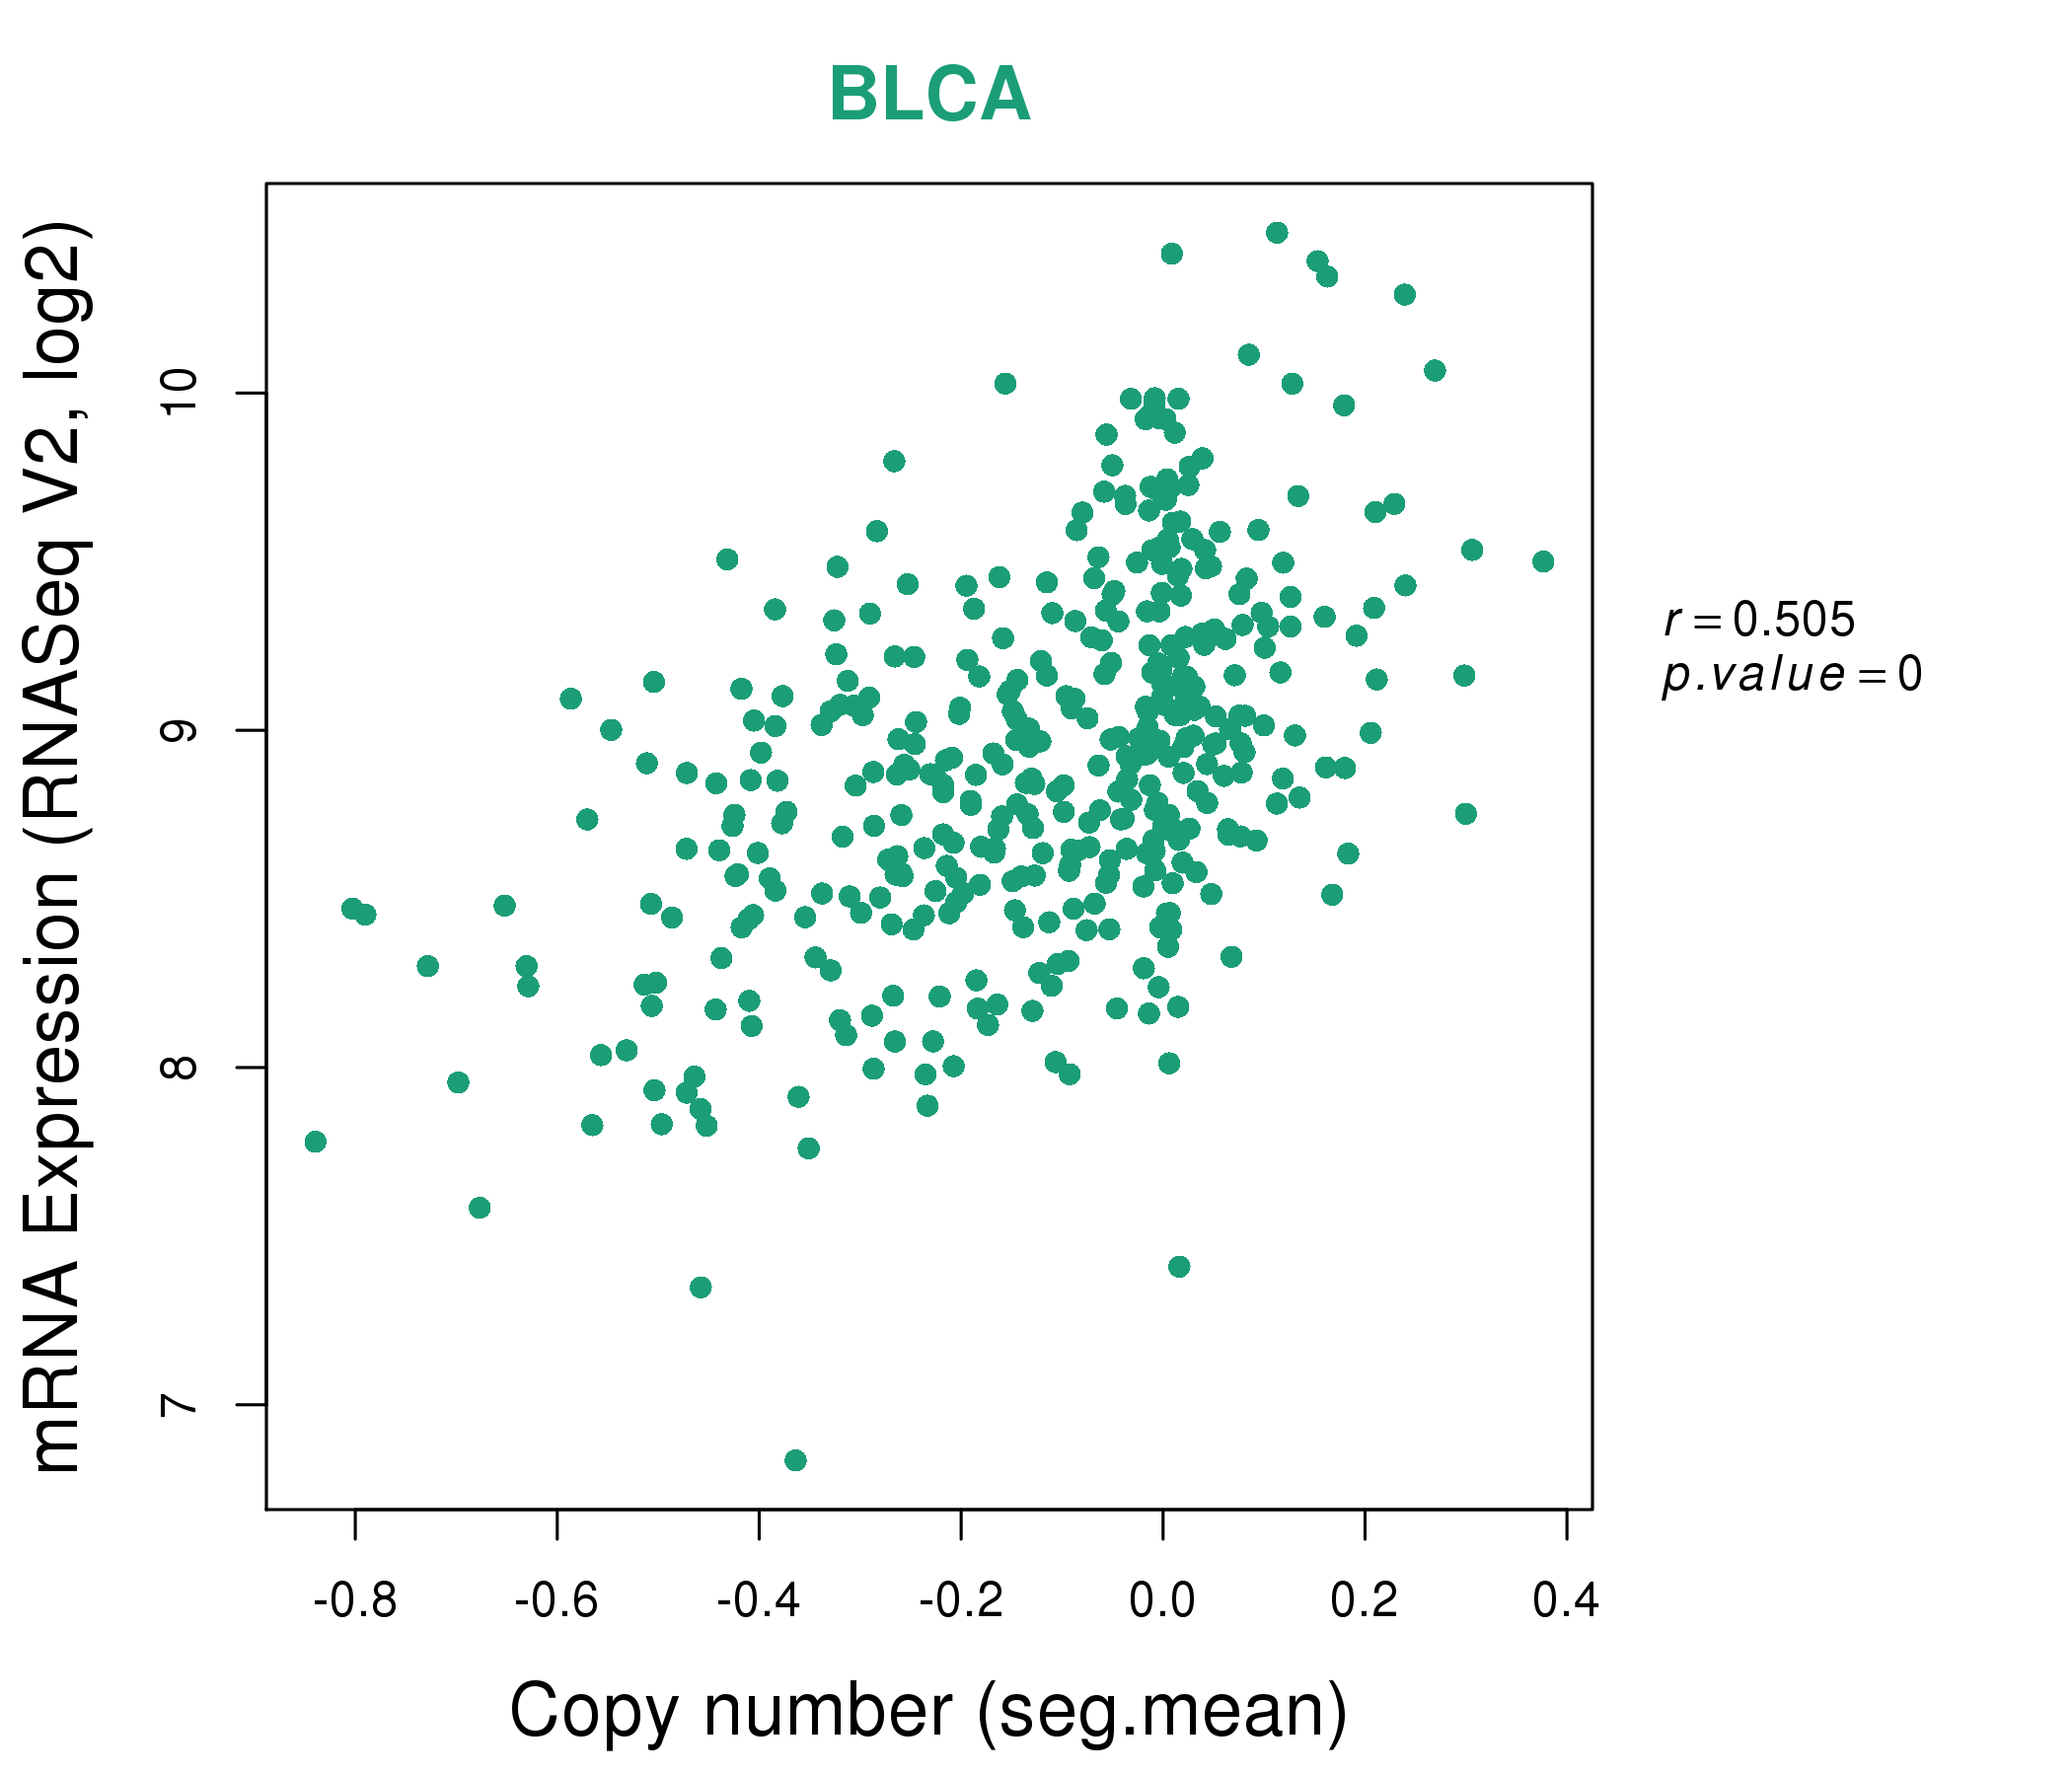
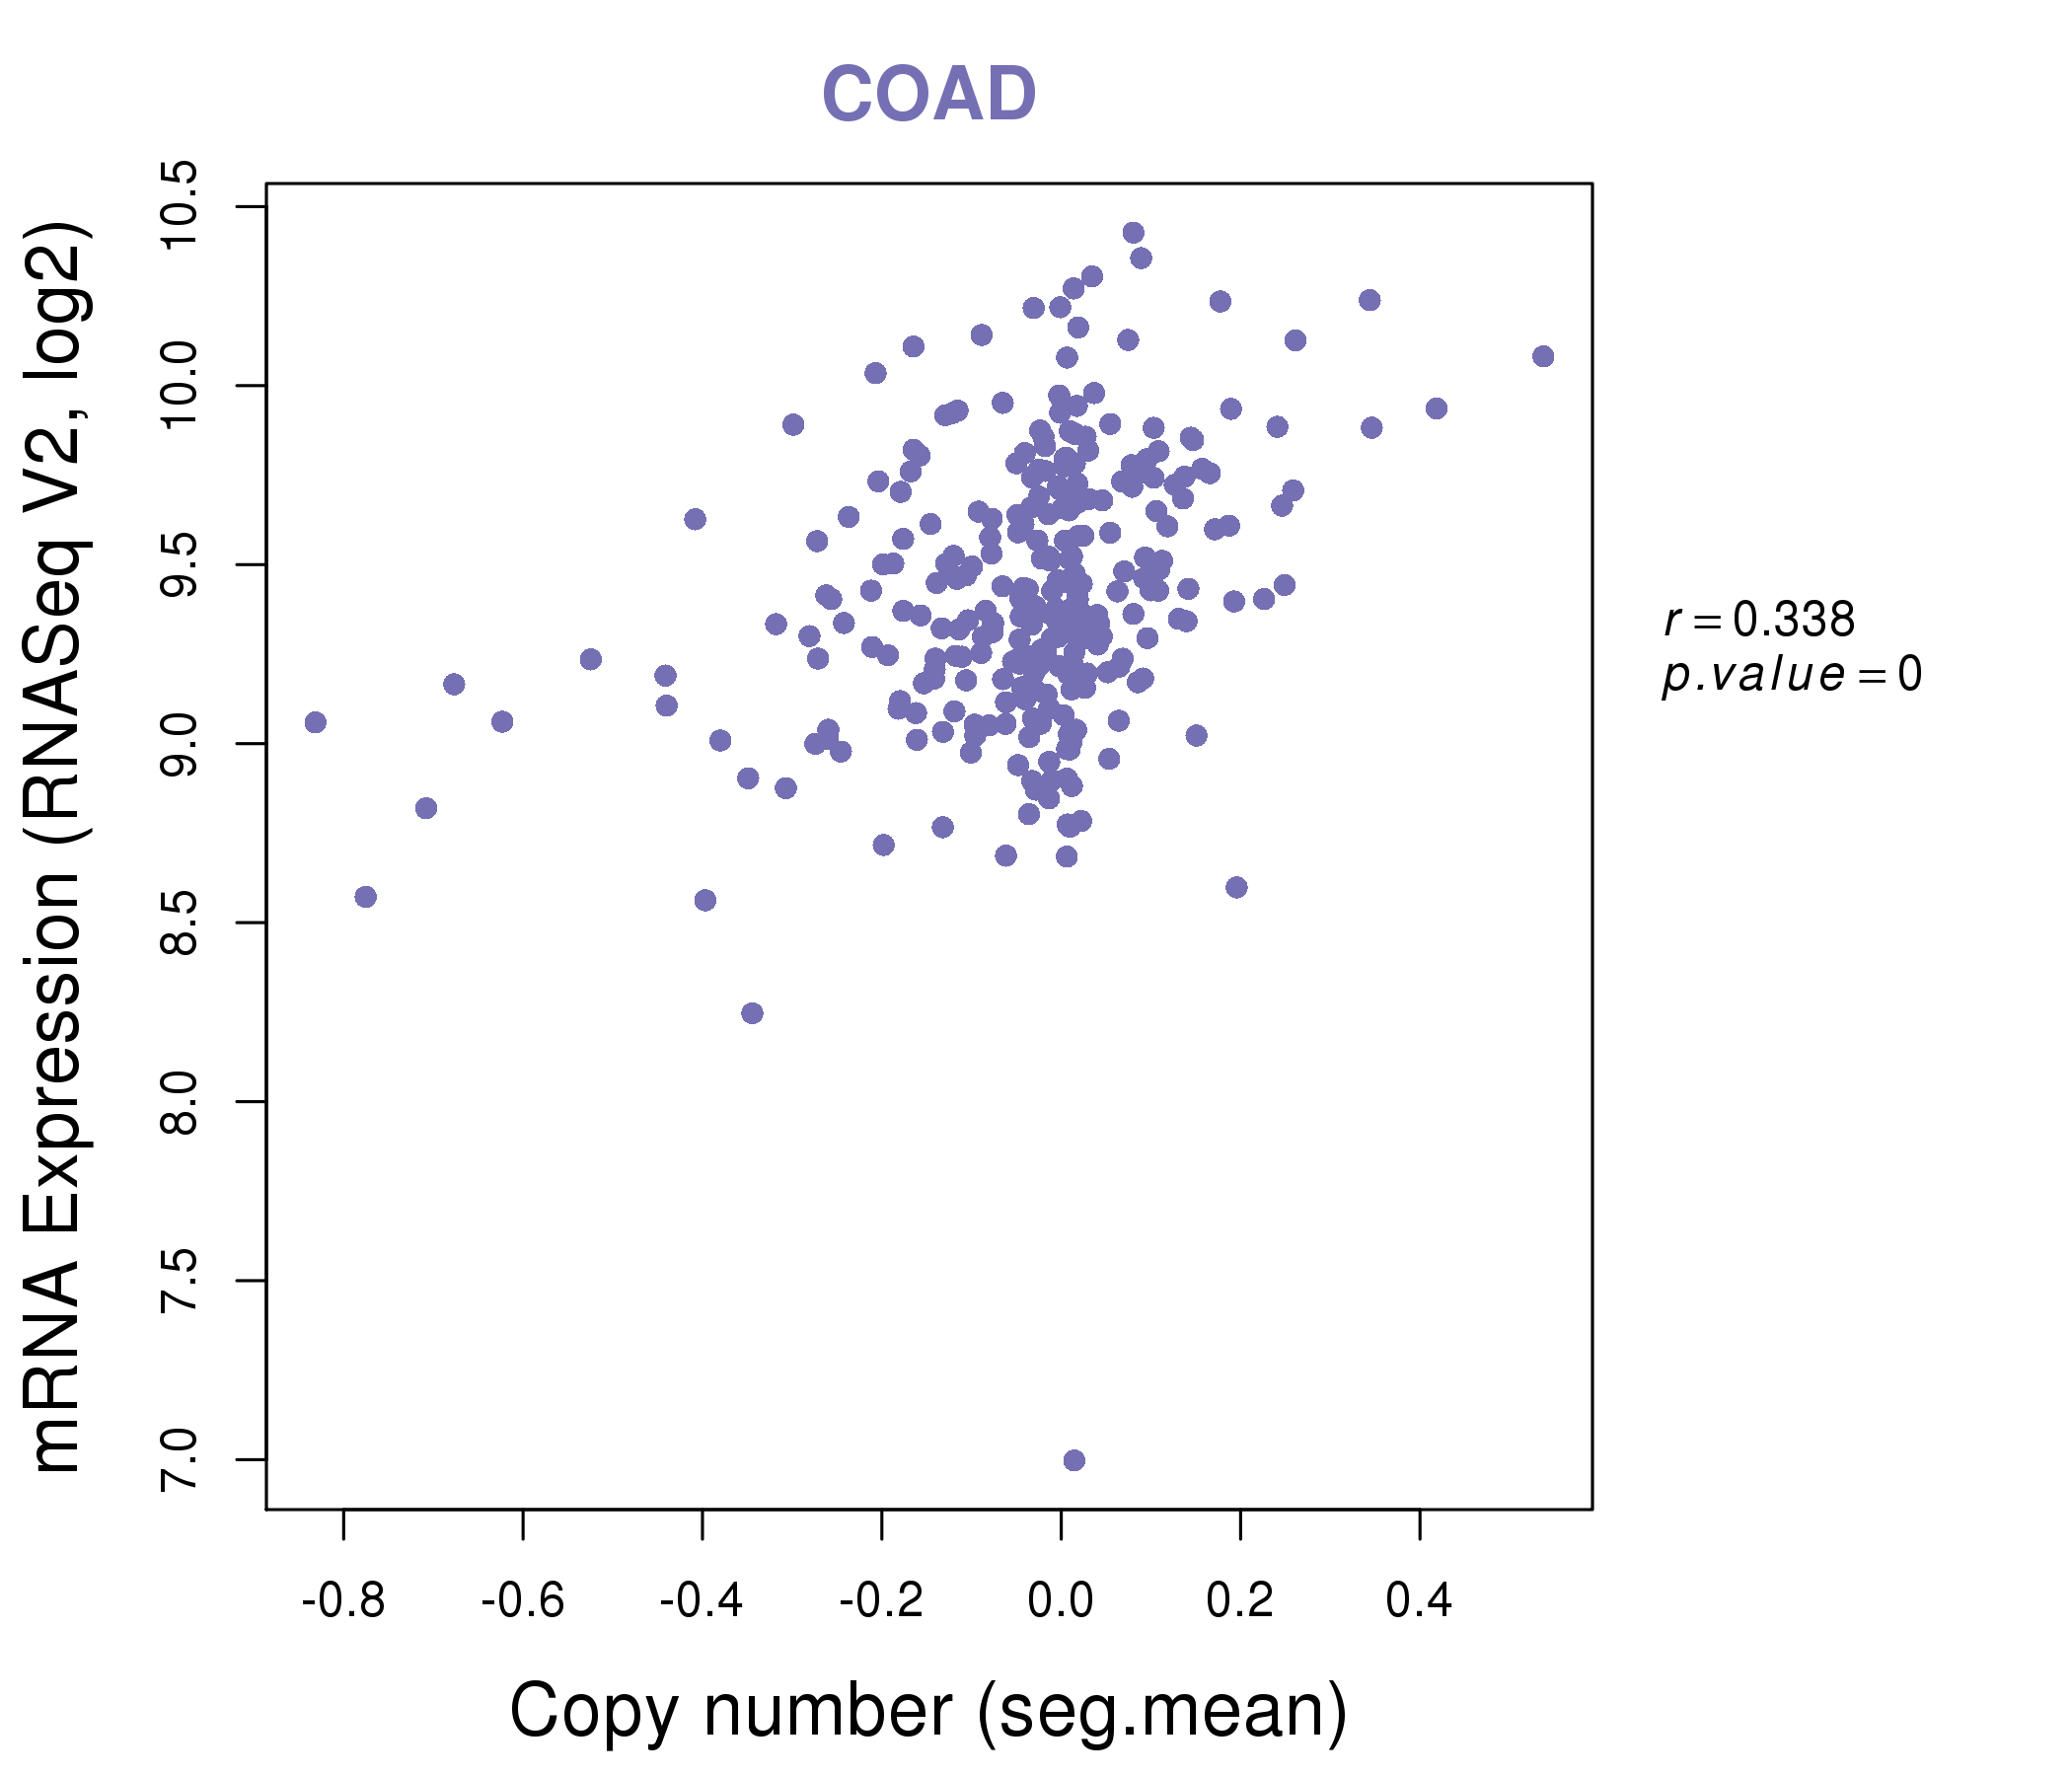
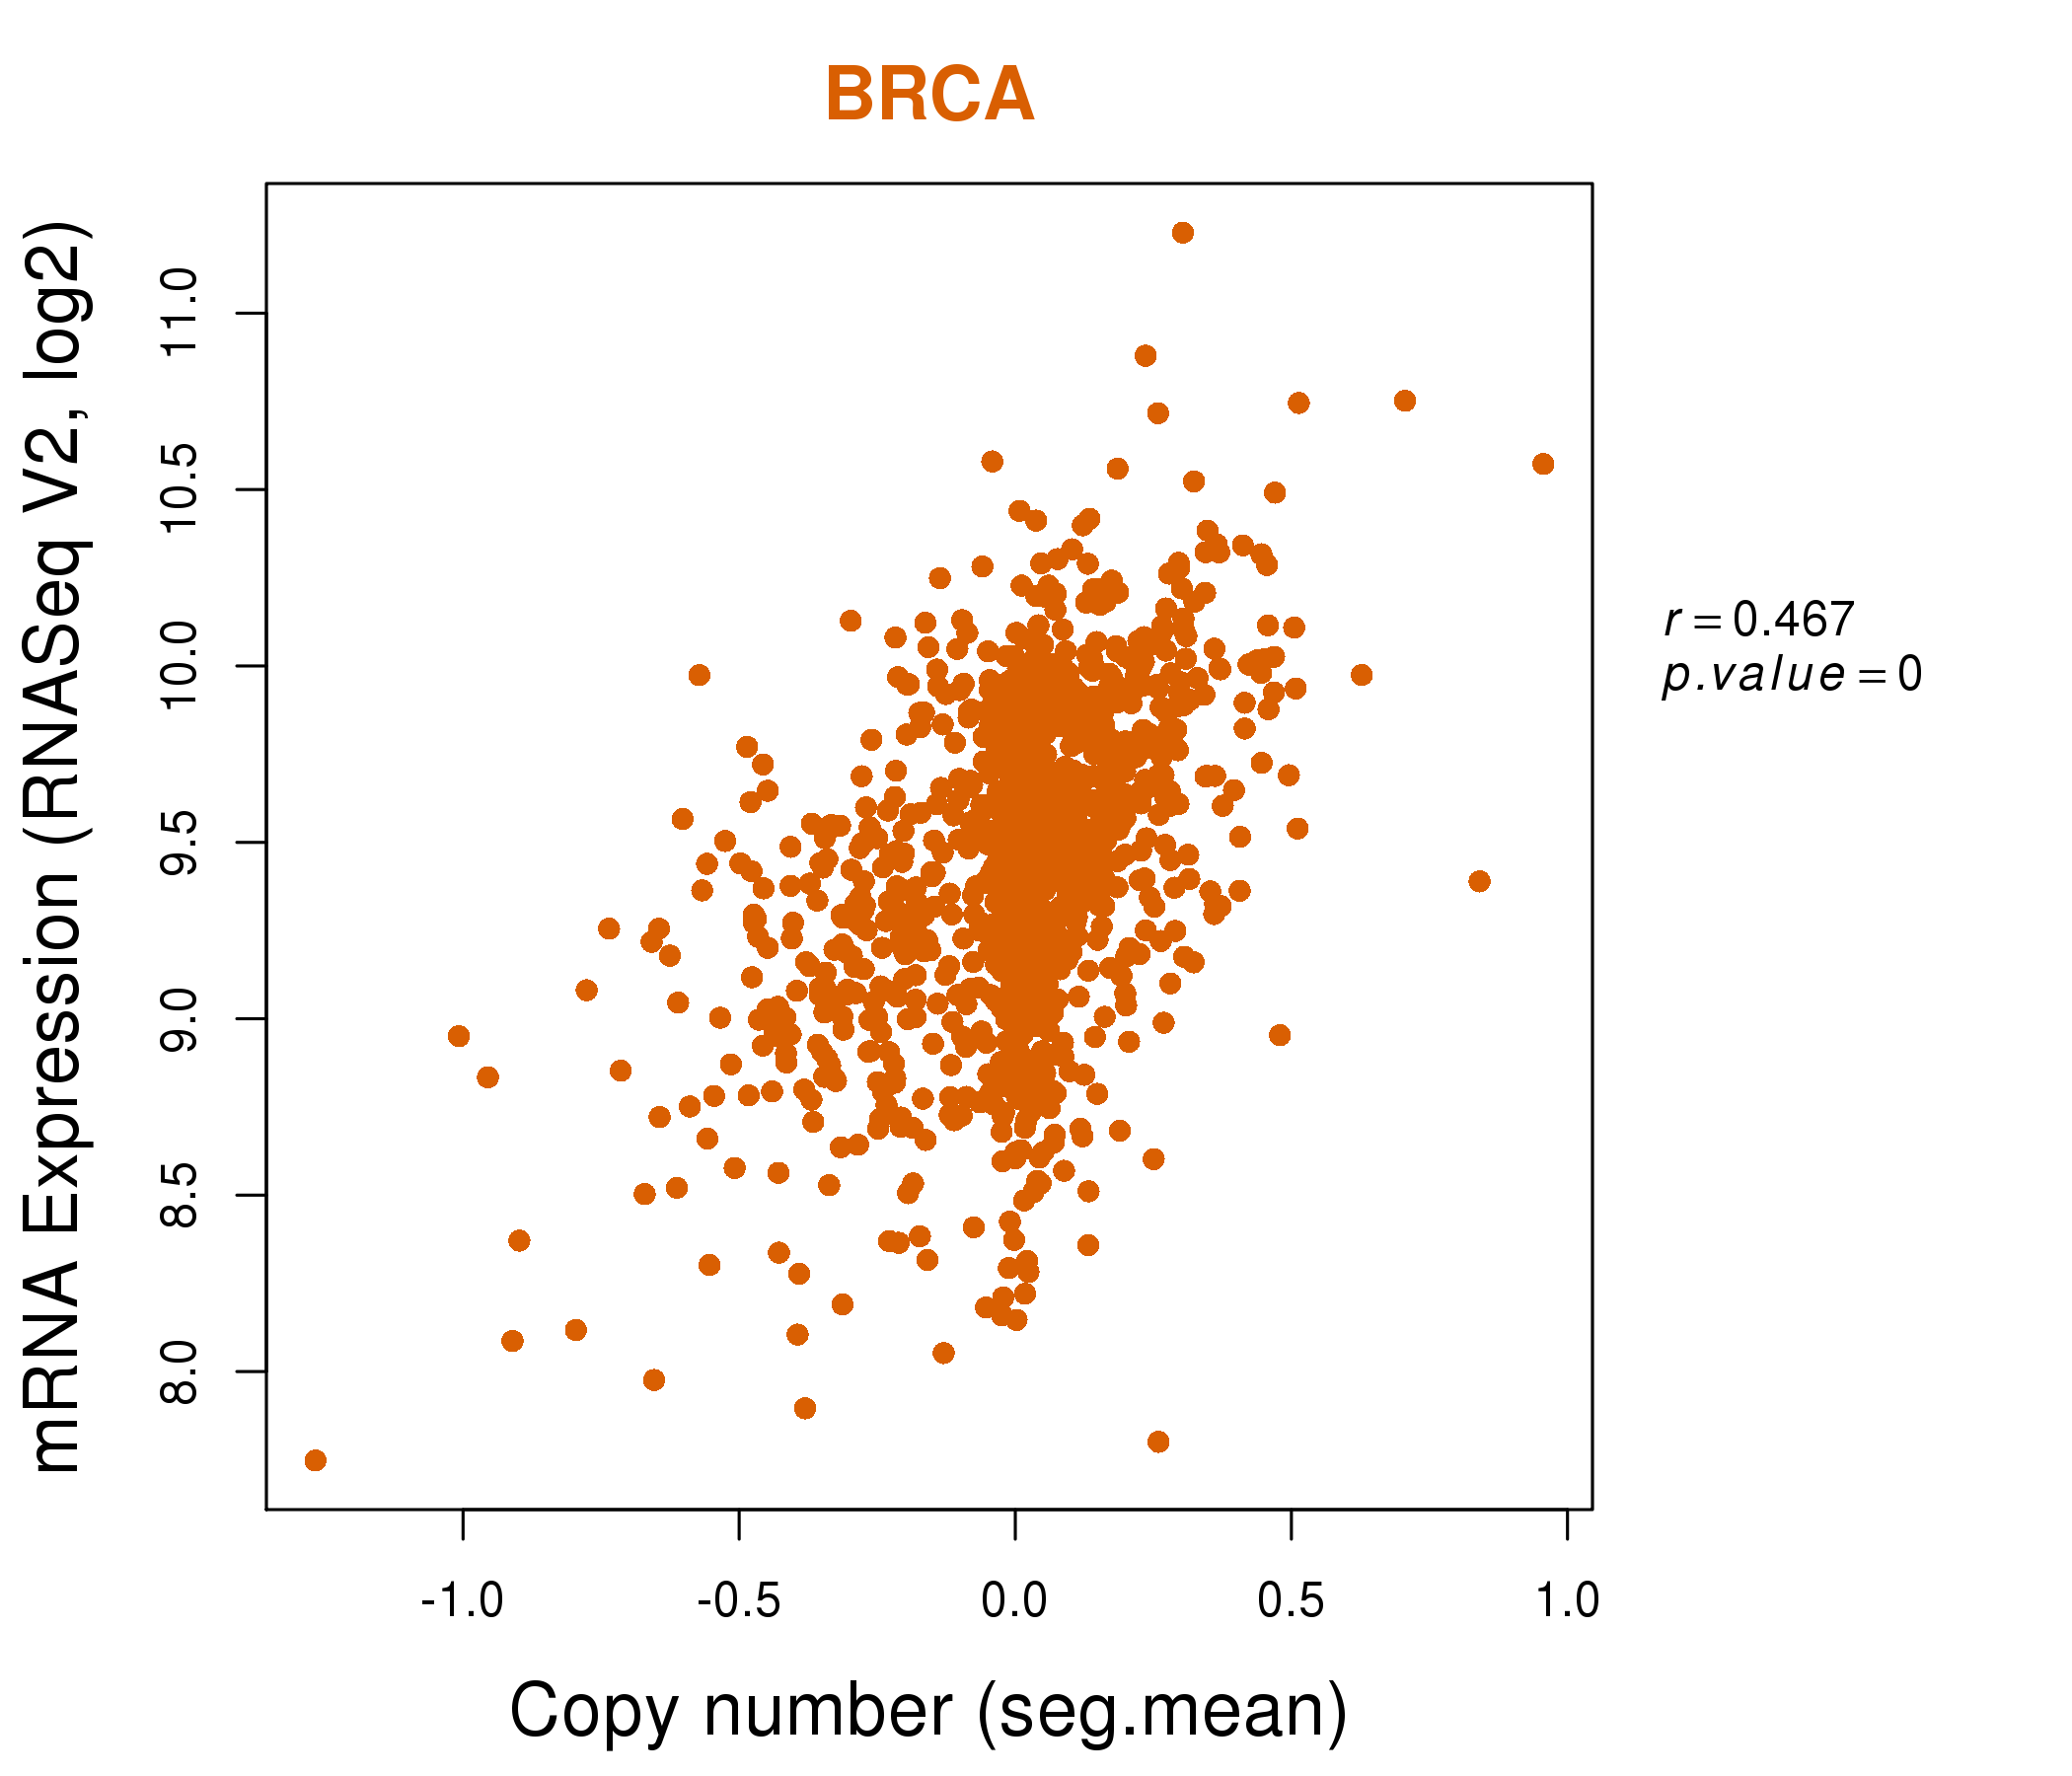
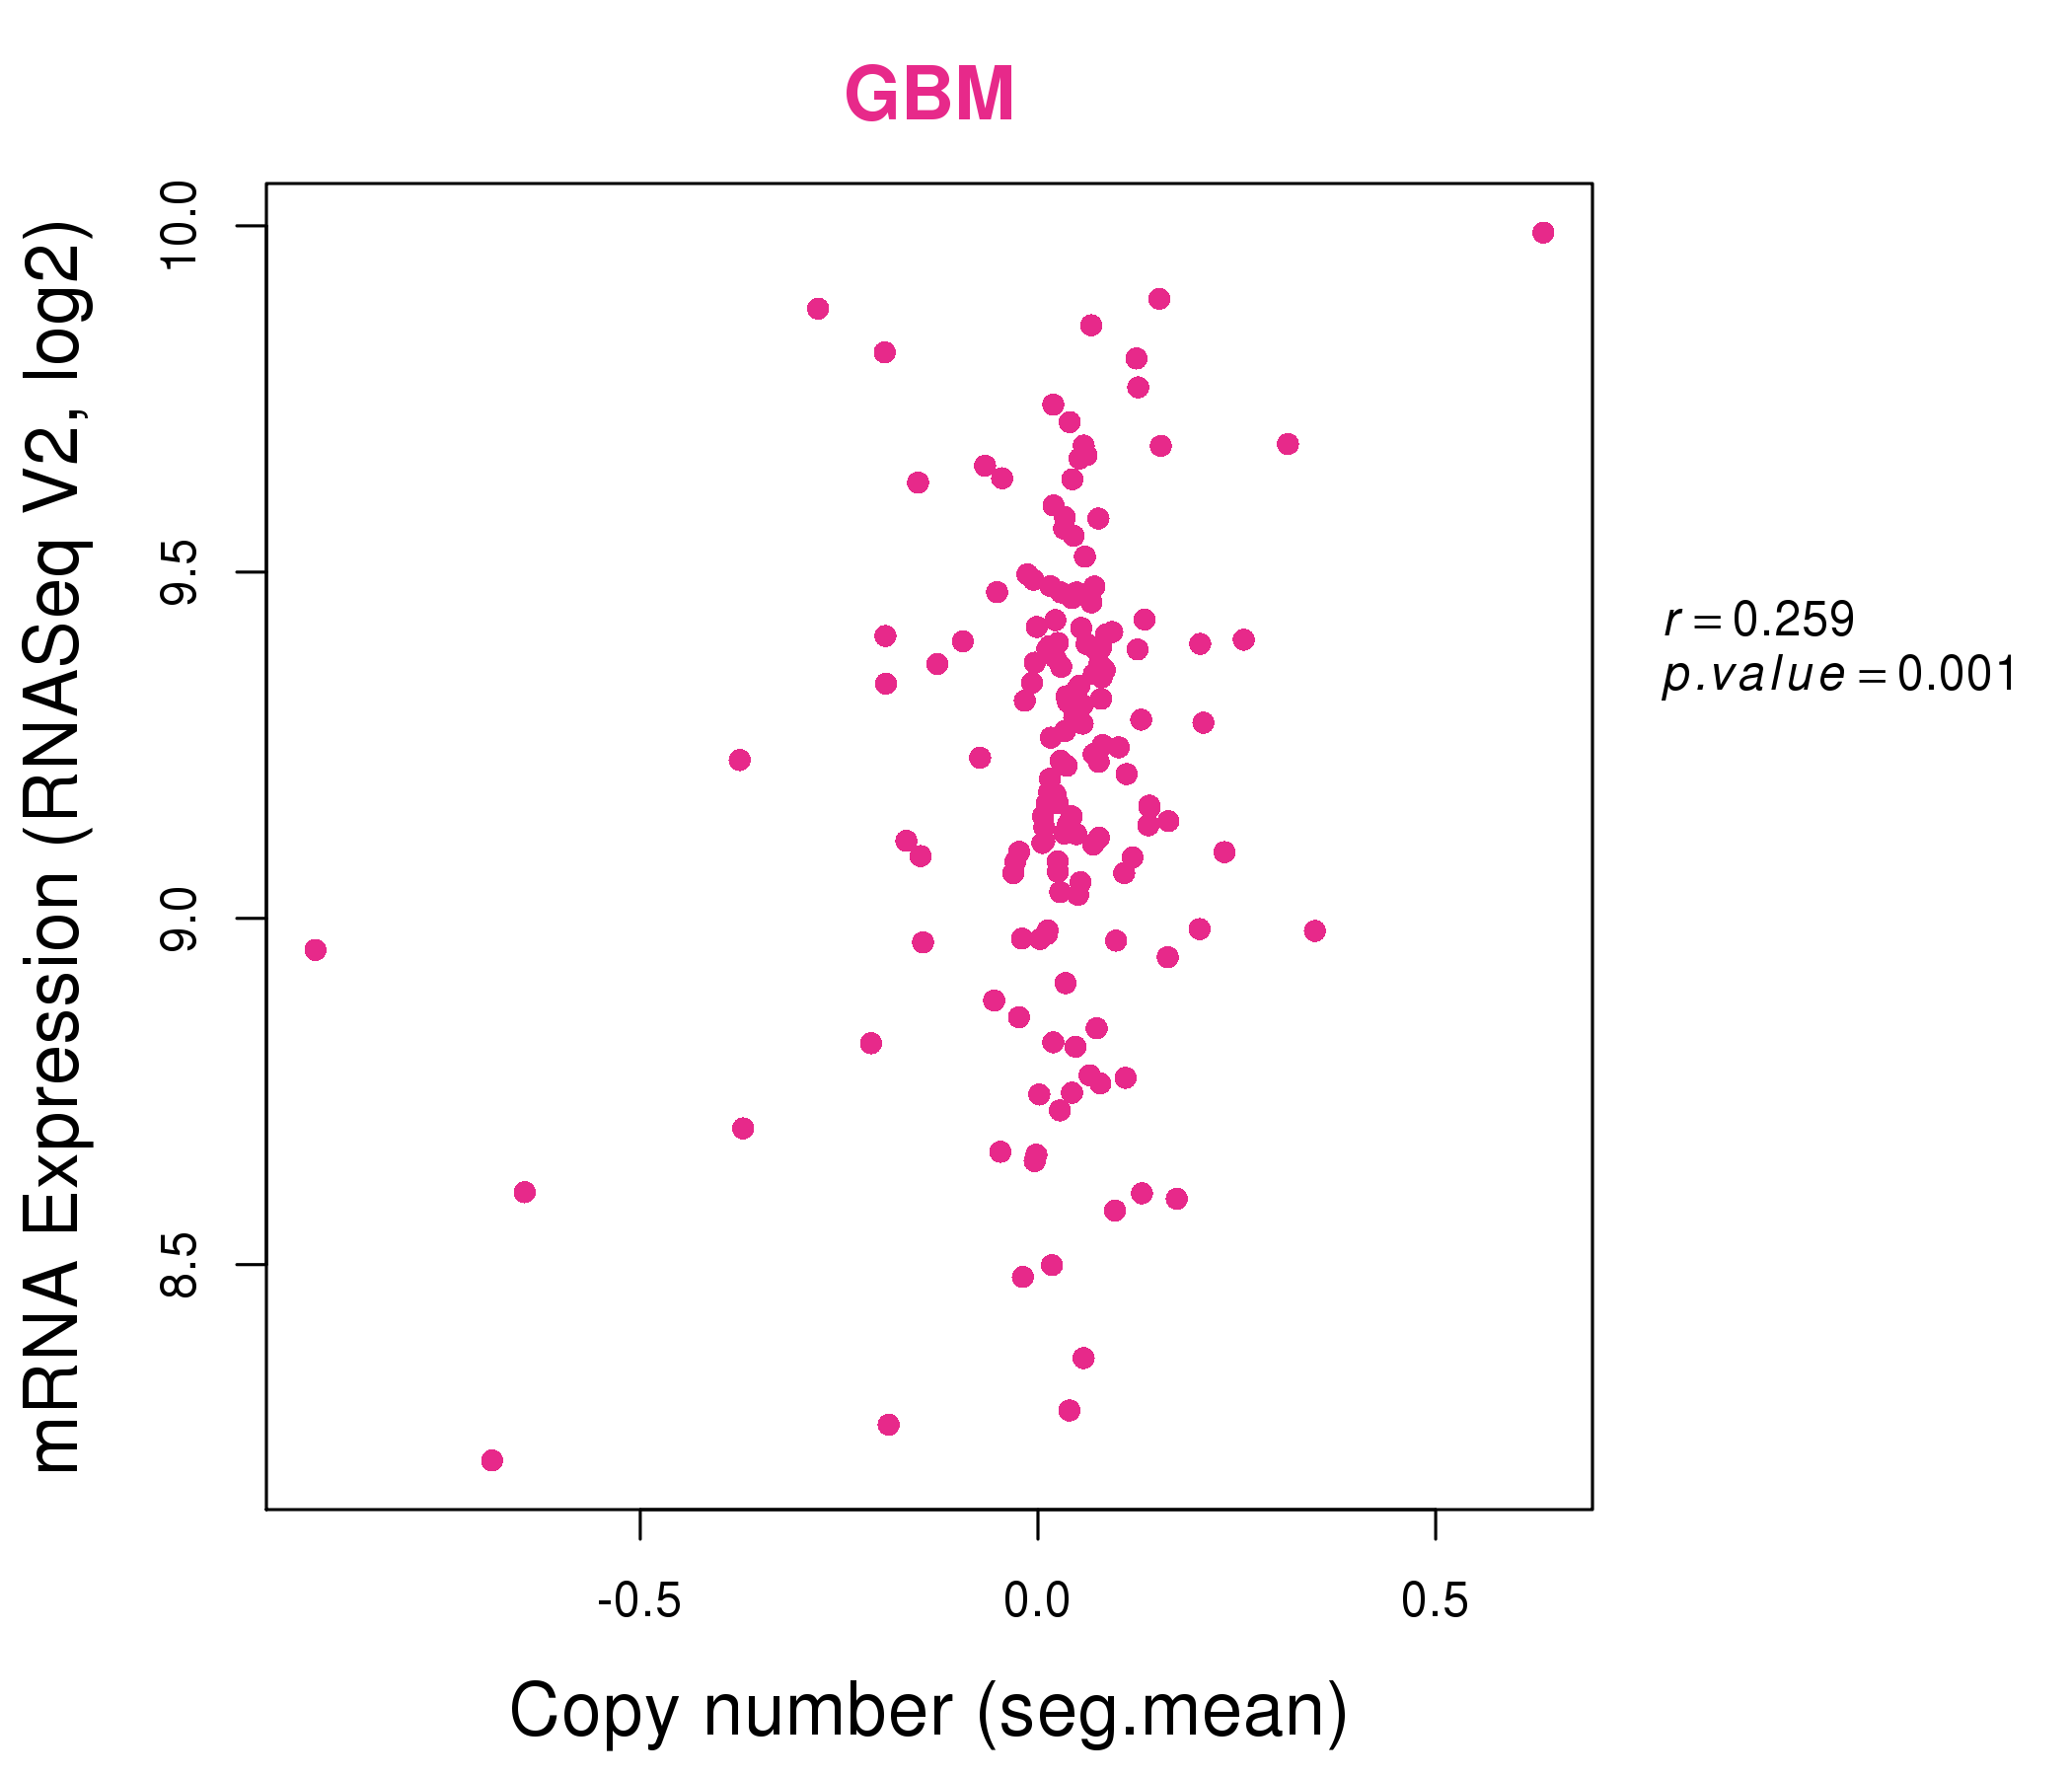
| * This plots show the correlation between CNV and gene expression. |
: Open all plots for all cancer types
 |
|
 |
|
| Top |
| Gene-Gene Network Information |
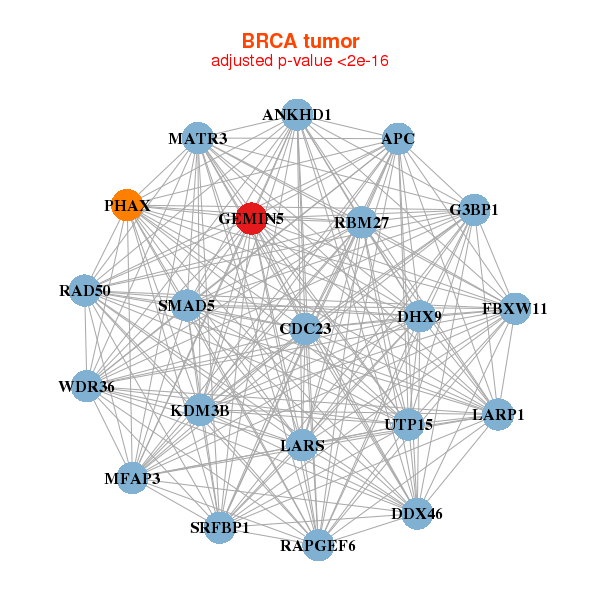
| * Co-Expression network figures were drawn using R package igraph. Only the top 20 genes with the highest correlations were shown. Red circle: input gene, orange circle: cell metabolism gene, sky circle: other gene |
: Open all plots for all cancer types
 |
|
| ANKHD1,APC,CDC23,DDX46,DHX9,FBXW11,G3BP1, GEMIN5,KDM3B,LARP1,LARS,MATR3,MFAP3,PHAX, RAD50,RAPGEF6,RBM27,SMAD5,SRFBP1,UTP15,WDR36 | ATE1,ATF7IP,CKAP5,CLPX,CSNK2A1,CSNK2A3,EPRS, AMER1,GANC,GEMIN5,HECTD1,IPO7,FAN1,RBL1, TNPO3,TUBGCP4,UBR2,VPRBP,ZFR,ZFYVE9,ZNF41 |
 |
|
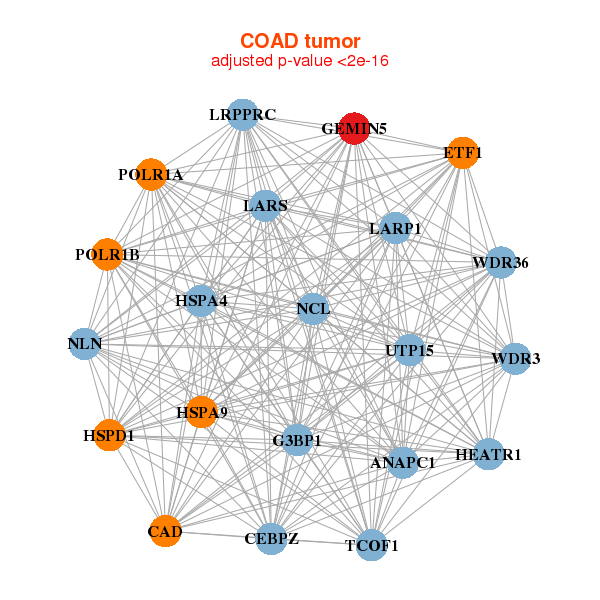
| ANAPC1,CAD,CEBPZ,ETF1,G3BP1,GEMIN5,HEATR1, HSPA4,HSPA9,HSPD1,LARP1,LARS,LRPPRC,NCL, NLN,POLR1A,POLR1B,TCOF1,UTP15,WDR3,WDR36 | AFAP1,AKAP2,BCL9,C17orf51,CAMSAP1,CELF2,DHX57, ERC1,EXTL3,GEMIN5,HIP1,IPO9,KANK1,MCC, MTR,NEK1,PHF20,ROCK1,RPTOR,TP53BP1,ZFHX3 |
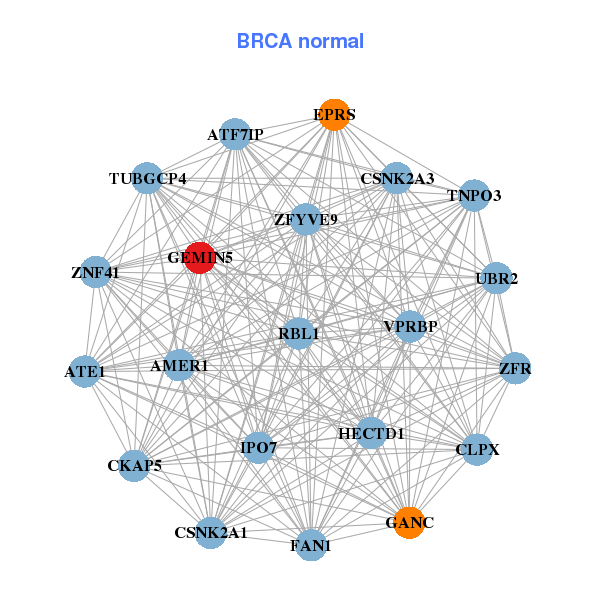
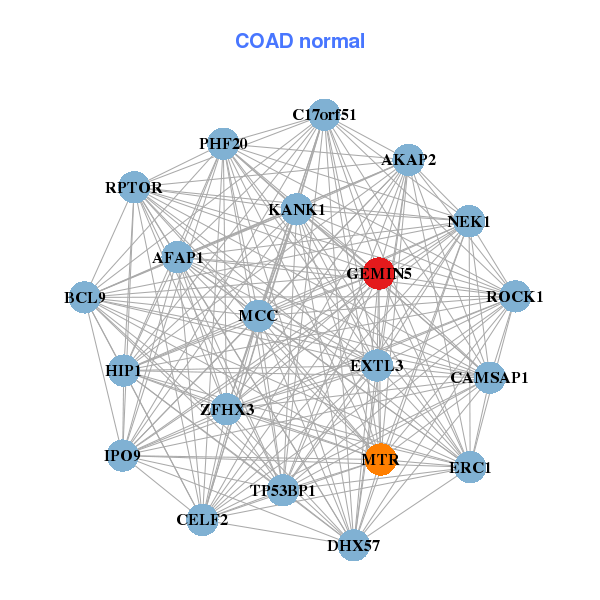
| * Co-Expression network figures were drawn using R package igraph. Only the top 20 genes with the highest correlations were shown. Red circle: input gene, orange circle: cell metabolism gene, sky circle: other gene |
: Open all plots for all cancer types
| Top |
: Open all interacting genes' information including KEGG pathway for all interacting genes from DAVID
| Top |
| Pharmacological Information for GEMIN5 |
| There's no related Drug. |
| Top |
| Cross referenced IDs for GEMIN5 |
| * We obtained these cross-references from Uniprot database. It covers 150 different DBs, 18 categories. http://www.uniprot.org/help/cross_references_section |
: Open all cross reference information
|
Copyright © 2016-Present - The Univsersity of Texas Health Science Center at Houston @ |