|
||||||||||||||||||||||||||||||||||||||||||||||||||||||||||||||||||||||||||||||||||||||||||||||||||||||||||||||||||||||||||||||||||||||||||||||||||||||||||||||||||||||||||||||||||||||||||||||||||||||||||||||||||||||||||||||||||||||||||||||||||||||||||||||||||||||||||||||||||||||||||||||||||||||||||||||||||||||||||||||
| |
| Phenotypic Information (metabolism pathway, cancer, disease, phenome) |
| |
| |
| Gene-Gene Network Information: Co-Expression Network, Interacting Genes & KEGG |
| |
|


| Gene Summary for WWTR1 |
| Basic gene info. | Gene symbol | WWTR1 |
| Gene name | WW domain containing transcription regulator 1 | |
| Synonyms | TAZ | |
| Cytomap | UCSC genome browser: 3q23-q24 | |
| Genomic location | chr3 :149235021-149421060 | |
| Type of gene | protein-coding | |
| RefGenes | NM_001168278.1, NM_001168280.1,NM_015472.4, | |
| Ensembl id | ENSG00000018408 | |
| Description | WW domain-containing transcription regulator protein 1transcriptional co-activator with PDZ-binding motiftranscriptional coactivator with PDZ-binding motif | |
| Modification date | 20141207 | |
| dbXrefs | MIM : 607392 | |
| HGNC : HGNC | ||
| Ensembl : ENSG00000018408 | ||
| HPRD : 09580 | ||
| Vega : OTTHUMG00000159614 | ||
| Protein | UniProt: Q9GZV5 go to UniProt's Cross Reference DB Table | |
| Expression | CleanEX: HS_WWTR1 | |
| BioGPS: 25937 | ||
| Gene Expression Atlas: ENSG00000018408 | ||
| The Human Protein Atlas: ENSG00000018408 | ||
| Pathway | NCI Pathway Interaction Database: WWTR1 | |
| KEGG: WWTR1 | ||
| REACTOME: WWTR1 | ||
| ConsensusPathDB | ||
| Pathway Commons: WWTR1 | ||
| Metabolism | MetaCyc: WWTR1 | |
| HUMANCyc: WWTR1 | ||
| Regulation | Ensembl's Regulation: ENSG00000018408 | |
| miRBase: chr3 :149,235,021-149,421,060 | ||
| TargetScan: NM_001168278 | ||
| cisRED: ENSG00000018408 | ||
| Context | iHOP: WWTR1 | |
| cancer metabolism search in PubMed: WWTR1 | ||
| UCL Cancer Institute: WWTR1 | ||
| Assigned class in ccmGDB | B - This gene belongs to cancer gene. | |
| Top |
| Phenotypic Information for WWTR1(metabolism pathway, cancer, disease, phenome) |
| Cancer | CGAP: WWTR1 |
| Familial Cancer Database: WWTR1 | |
| * This gene is included in those cancer gene databases. |
|
|
|
|
|
| . | ||||||||||||||||||||||||||||||||||||||||||||||||||||||||||||||||||||||||||||||||||||||||||||||||||||||||||||||||||||||||||||||||||||||||||||||||||||||||||||||||||||||||||||||||||||||||||||||||||||||||||||||||||||||||||||||||||||||||||||||||||||||||||||||||||||||||||||||||||||||||||||||||||||||||||||||||||||||||
Oncogene 1 | Significant driver gene in | |||||||||||||||||||||||||||||||||||||||||||||||||||||||||||||||||||||||||||||||||||||||||||||||||||||||||||||||||||||||||||||||||||||||||||||||||||||||||||||||||||||||||||||||||||||||||||||||||||||||||||||||||||||||||||||||||||||||||||||||||||||||||||||||||||||||||||||||||||||||||||||||||||||||||||||||||||||||||||||
| cf) number; DB name 1 Oncogene; http://nar.oxfordjournals.org/content/35/suppl_1/D721.long, 2 Tumor Suppressor gene; https://bioinfo.uth.edu/TSGene/, 3 Cancer Gene Census; http://www.nature.com/nrc/journal/v4/n3/abs/nrc1299.html, 4 CancerGenes; http://nar.oxfordjournals.org/content/35/suppl_1/D721.long, 5 Network of Cancer Gene; http://ncg.kcl.ac.uk/index.php, 1Therapeutic Vulnerabilities in Cancer; http://cbio.mskcc.org/cancergenomics/statius/ |
| REACTOME_METABOLISM_OF_LIPIDS_AND_LIPOPROTEINS | |
| OMIM | 607392; gene. |
| Orphanet | |
| Disease | KEGG Disease: WWTR1 |
| MedGen: WWTR1 (Human Medical Genetics with Condition) | |
| ClinVar: WWTR1 | |
| Phenotype | MGI: WWTR1 (International Mouse Phenotyping Consortium) |
| PhenomicDB: WWTR1 | |
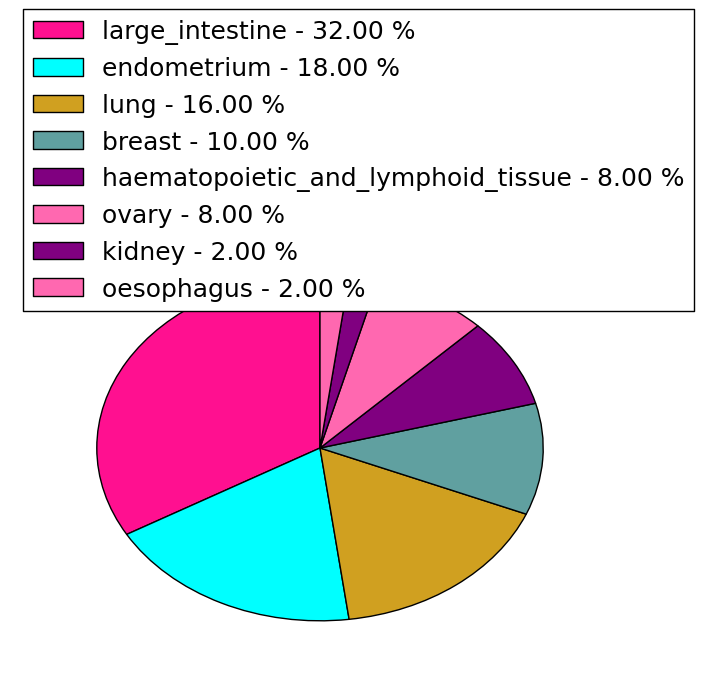
| Mutations for WWTR1 |
| * Under tables are showing count per each tissue to give us broad intuition about tissue specific mutation patterns.You can go to the detailed page for each mutation database's web site. |
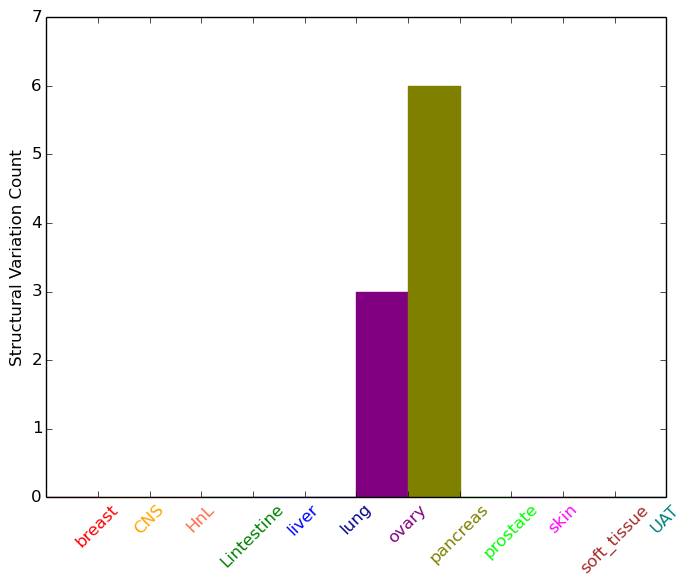
| - Statistics for Tissue and Mutation type | Top |
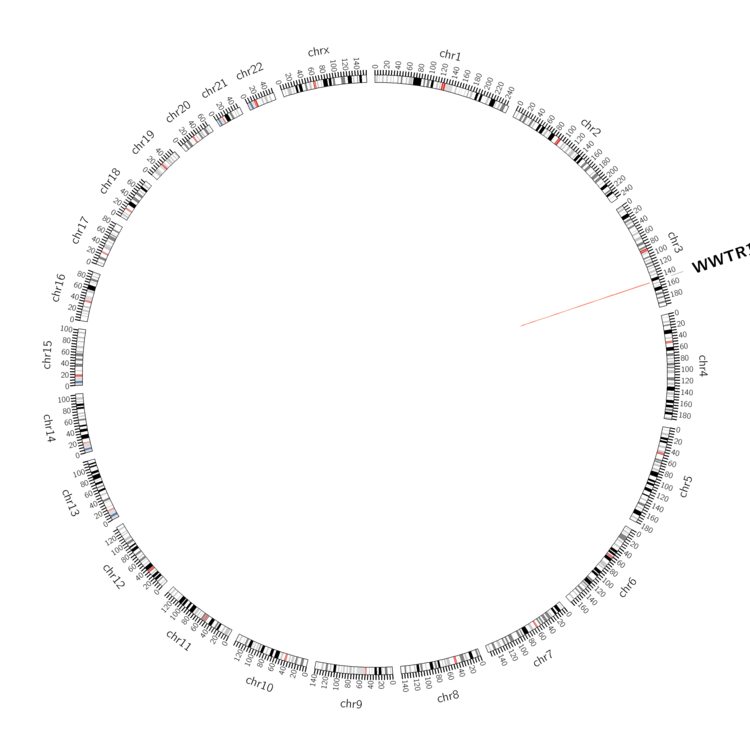 |
| - For Inter-chromosomal Variations |
| There's no inter-chromosomal structural variation. |
| - For Intra-chromosomal Variations |
| * Intra-chromosomal variantions includes 'intrachromosomal amplicon to amplicon', 'intrachromosomal amplicon to non-amplified dna', 'intrachromosomal deletion', 'intrachromosomal fold-back inversion', 'intrachromosomal inversion', 'intrachromosomal tandem duplication', 'Intrachromosomal unknown type', 'intrachromosomal with inverted orientation', 'intrachromosomal with non-inverted orientation'. |
 |
| Sample | Symbol_a | Chr_a | Start_a | End_a | Symbol_b | Chr_b | Start_b | End_b |
| ovary | WWTR1 | chr3 | 149257088 | 149257288 | WWTR1 | chr3 | 149276983 | 149277183 |
| ovary | WWTR1 | chr3 | 149275503 | 149275523 | chr3 | 149068802 | 149068822 | |
| ovary | WWTR1 | chr3 | 149389010 | 149389030 | WWTR1 | chr3 | 149339224 | 149339244 |
| pancreas | WWTR1 | chr3 | 149255298 | 149255318 | WWTR1 | chr3 | 149255360 | 149255380 |
| pancreas | WWTR1 | chr3 | 149282154 | 149282174 | WWTR1 | chr3 | 149283008 | 149283028 |
| cf) Tissue number; Tissue name (1;Breast, 2;Central_nervous_system, 3;Haematopoietic_and_lymphoid_tissue, 4;Large_intestine, 5;Liver, 6;Lung, 7;Ovary, 8;Pancreas, 9;Prostate, 10;Skin, 11;Soft_tissue, 12;Upper_aerodigestive_tract) |
| * From mRNA Sanger sequences, Chitars2.0 arranged chimeric transcripts. This table shows WWTR1 related fusion information. |
| ID | Head Gene | Tail Gene | Accession | Gene_a | qStart_a | qEnd_a | Chromosome_a | tStart_a | tEnd_a | Gene_a | qStart_a | qEnd_a | Chromosome_a | tStart_a | tEnd_a |
| CA311460 | WWTR1 | 17 | 293 | 3 | 149238377 | 149238653 | WWTR1 | 290 | 460 | 3 | 149238671 | 149243864 | |
| Top |
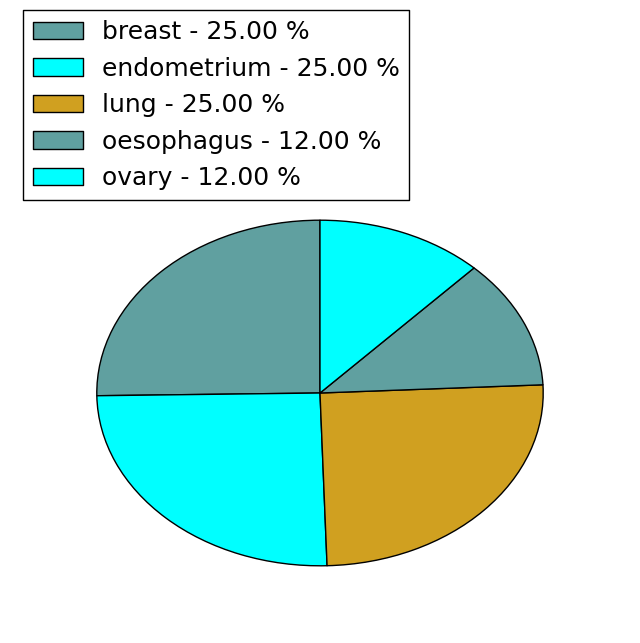
| Mutation type/ Tissue ID | brca | cns | cerv | endome | haematopo | kidn | Lintest | liver | lung | ns | ovary | pancre | prost | skin | stoma | thyro | urina | |||
| Total # sample | 2 | 3 | 2 | 3 | ||||||||||||||||
| GAIN (# sample) | 2 | 3 | 2 | 2 | ||||||||||||||||
| LOSS (# sample) | 1 |
| cf) Tissue ID; Tissue type (1; Breast, 2; Central_nervous_system, 3; Cervix, 4; Endometrium, 5; Haematopoietic_and_lymphoid_tissue, 6; Kidney, 7; Large_intestine, 8; Liver, 9; Lung, 10; NS, 11; Ovary, 12; Pancreas, 13; Prostate, 14; Skin, 15; Stomach, 16; Thyroid, 17; Urinary_tract) |
| Top |
|
 |
| Top |
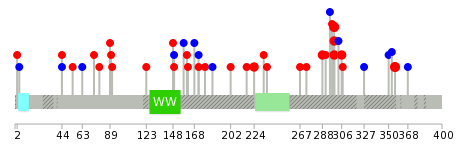
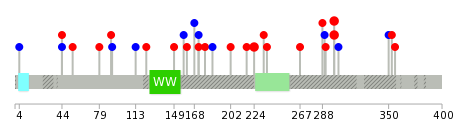
| Stat. for Non-Synonymous SNVs (# total SNVs=37) | (# total SNVs=8) |
 |  |
(# total SNVs=0) | (# total SNVs=0) |
| Top |
| * When you move the cursor on each content, you can see more deailed mutation information on the Tooltip. Those are primary_site,primary_histology,mutation(aa),pubmedID. |
| GRCh37 position | Mutation(aa) | Unique sampleID count |
| chr3:149260151-149260151 | p.R248* | 5 |
| chr3:149245633-149245633 | p.F299V | 5 |
| chr3:149238728-149238728 | p.R356H | 3 |
| chr3:149245664-149245664 | p.M288I | 2 |
| chr3:149243902-149243902 | p.H306Y | 2 |
| chr3:149245632-149245632 | p.F299S | 2 |
| chr3:149260222-149260222 | p.A224V | 2 |
| chr3:149374963-149374963 | p.R44L | 1 |
| chr3:149245643-149245643 | p.S295S | 1 |
| chr3:149290664-149290664 | p.S185S | 1 |
| Top |
|
 |
| Point Mutation/ Tissue ID | 1 | 2 | 3 | 4 | 5 | 6 | 7 | 8 | 9 | 10 | 11 | 12 | 13 | 14 | 15 | 16 | 17 | 18 | 19 | 20 |
| # sample | 2 | 1 | 1 | 6 | 4 | 4 | 2 | 5 | 2 | 5 | ||||||||||
| # mutation | 2 | 1 | 1 | 4 | 5 | 4 | 2 | 6 | 2 | 5 | ||||||||||
| nonsynonymous SNV | 2 | 4 | 3 | 2 | 1 | 3 | 2 | 4 | ||||||||||||
| synonymous SNV | 1 | 1 | 2 | 2 | 1 | 3 | 1 |
| cf) Tissue ID; Tissue type (1; BLCA[Bladder Urothelial Carcinoma], 2; BRCA[Breast invasive carcinoma], 3; CESC[Cervical squamous cell carcinoma and endocervical adenocarcinoma], 4; COAD[Colon adenocarcinoma], 5; GBM[Glioblastoma multiforme], 6; Glioma Low Grade, 7; HNSC[Head and Neck squamous cell carcinoma], 8; KICH[Kidney Chromophobe], 9; KIRC[Kidney renal clear cell carcinoma], 10; KIRP[Kidney renal papillary cell carcinoma], 11; LAML[Acute Myeloid Leukemia], 12; LUAD[Lung adenocarcinoma], 13; LUSC[Lung squamous cell carcinoma], 14; OV[Ovarian serous cystadenocarcinoma ], 15; PAAD[Pancreatic adenocarcinoma], 16; PRAD[Prostate adenocarcinoma], 17; SKCM[Skin Cutaneous Melanoma], 18:STAD[Stomach adenocarcinoma], 19:THCA[Thyroid carcinoma], 20:UCEC[Uterine Corpus Endometrial Carcinoma]) |
| Top |
| * We represented just top 10 SNVs. When you move the cursor on each content, you can see more deailed mutation information on the Tooltip. Those are primary_site, primary_histology, mutation(aa), pubmedID. |
| Genomic Position | Mutation(aa) | Unique sampleID count |
| chr3:149260222 | p.F299S,WWTR1 | 2 |
| chr3:149245632 | p.F299L,WWTR1 | 2 |
| chr3:149245633 | p.A224V,WWTR1 | 2 |
| chr3:149374727 | p.G217R,WWTR1 | 1 |
| chr3:149238745 | p.R44R,WWTR1 | 1 |
| chr3:149260244 | p.S202I,WWTR1 | 1 |
| chr3:149374755 | p.R44L,WWTR1 | 1 |
| chr3:149243909 | p.S185S,WWTR1 | 1 |
| chr3:149260288 | p.A4A,WWTR1 | 1 |
| chr3:149374821 | p.R356S,WWTR1 | 1 |
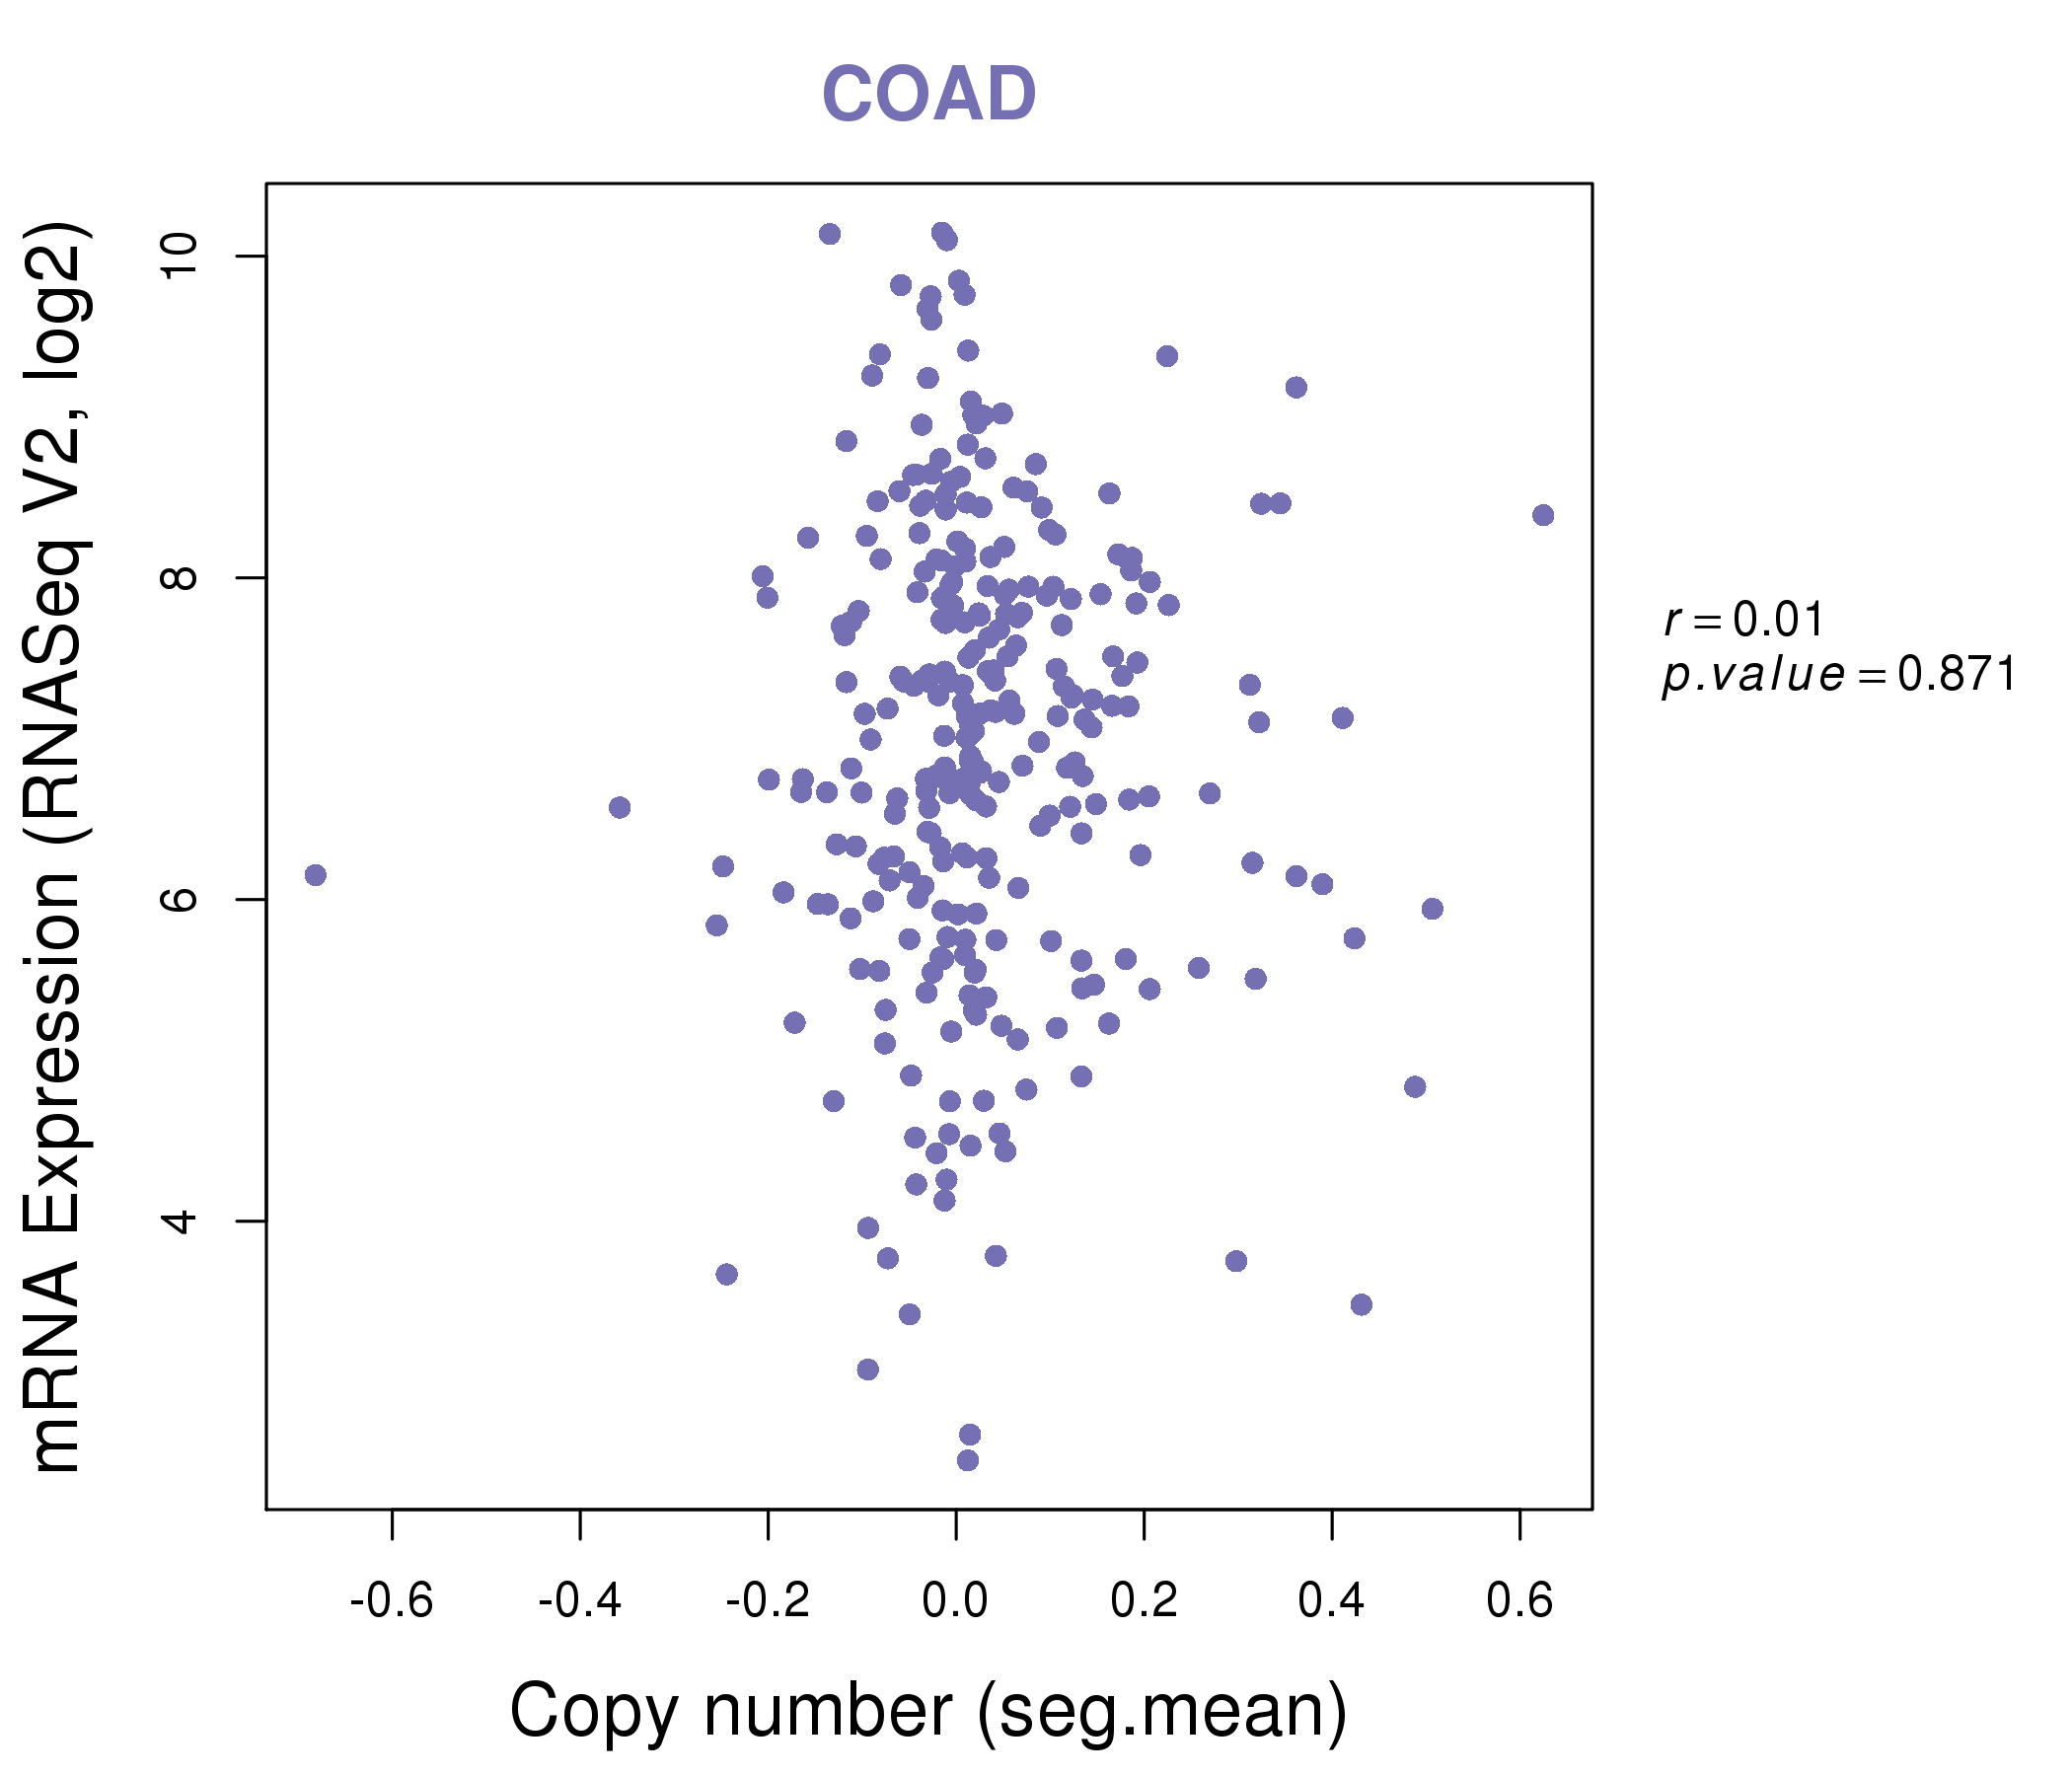
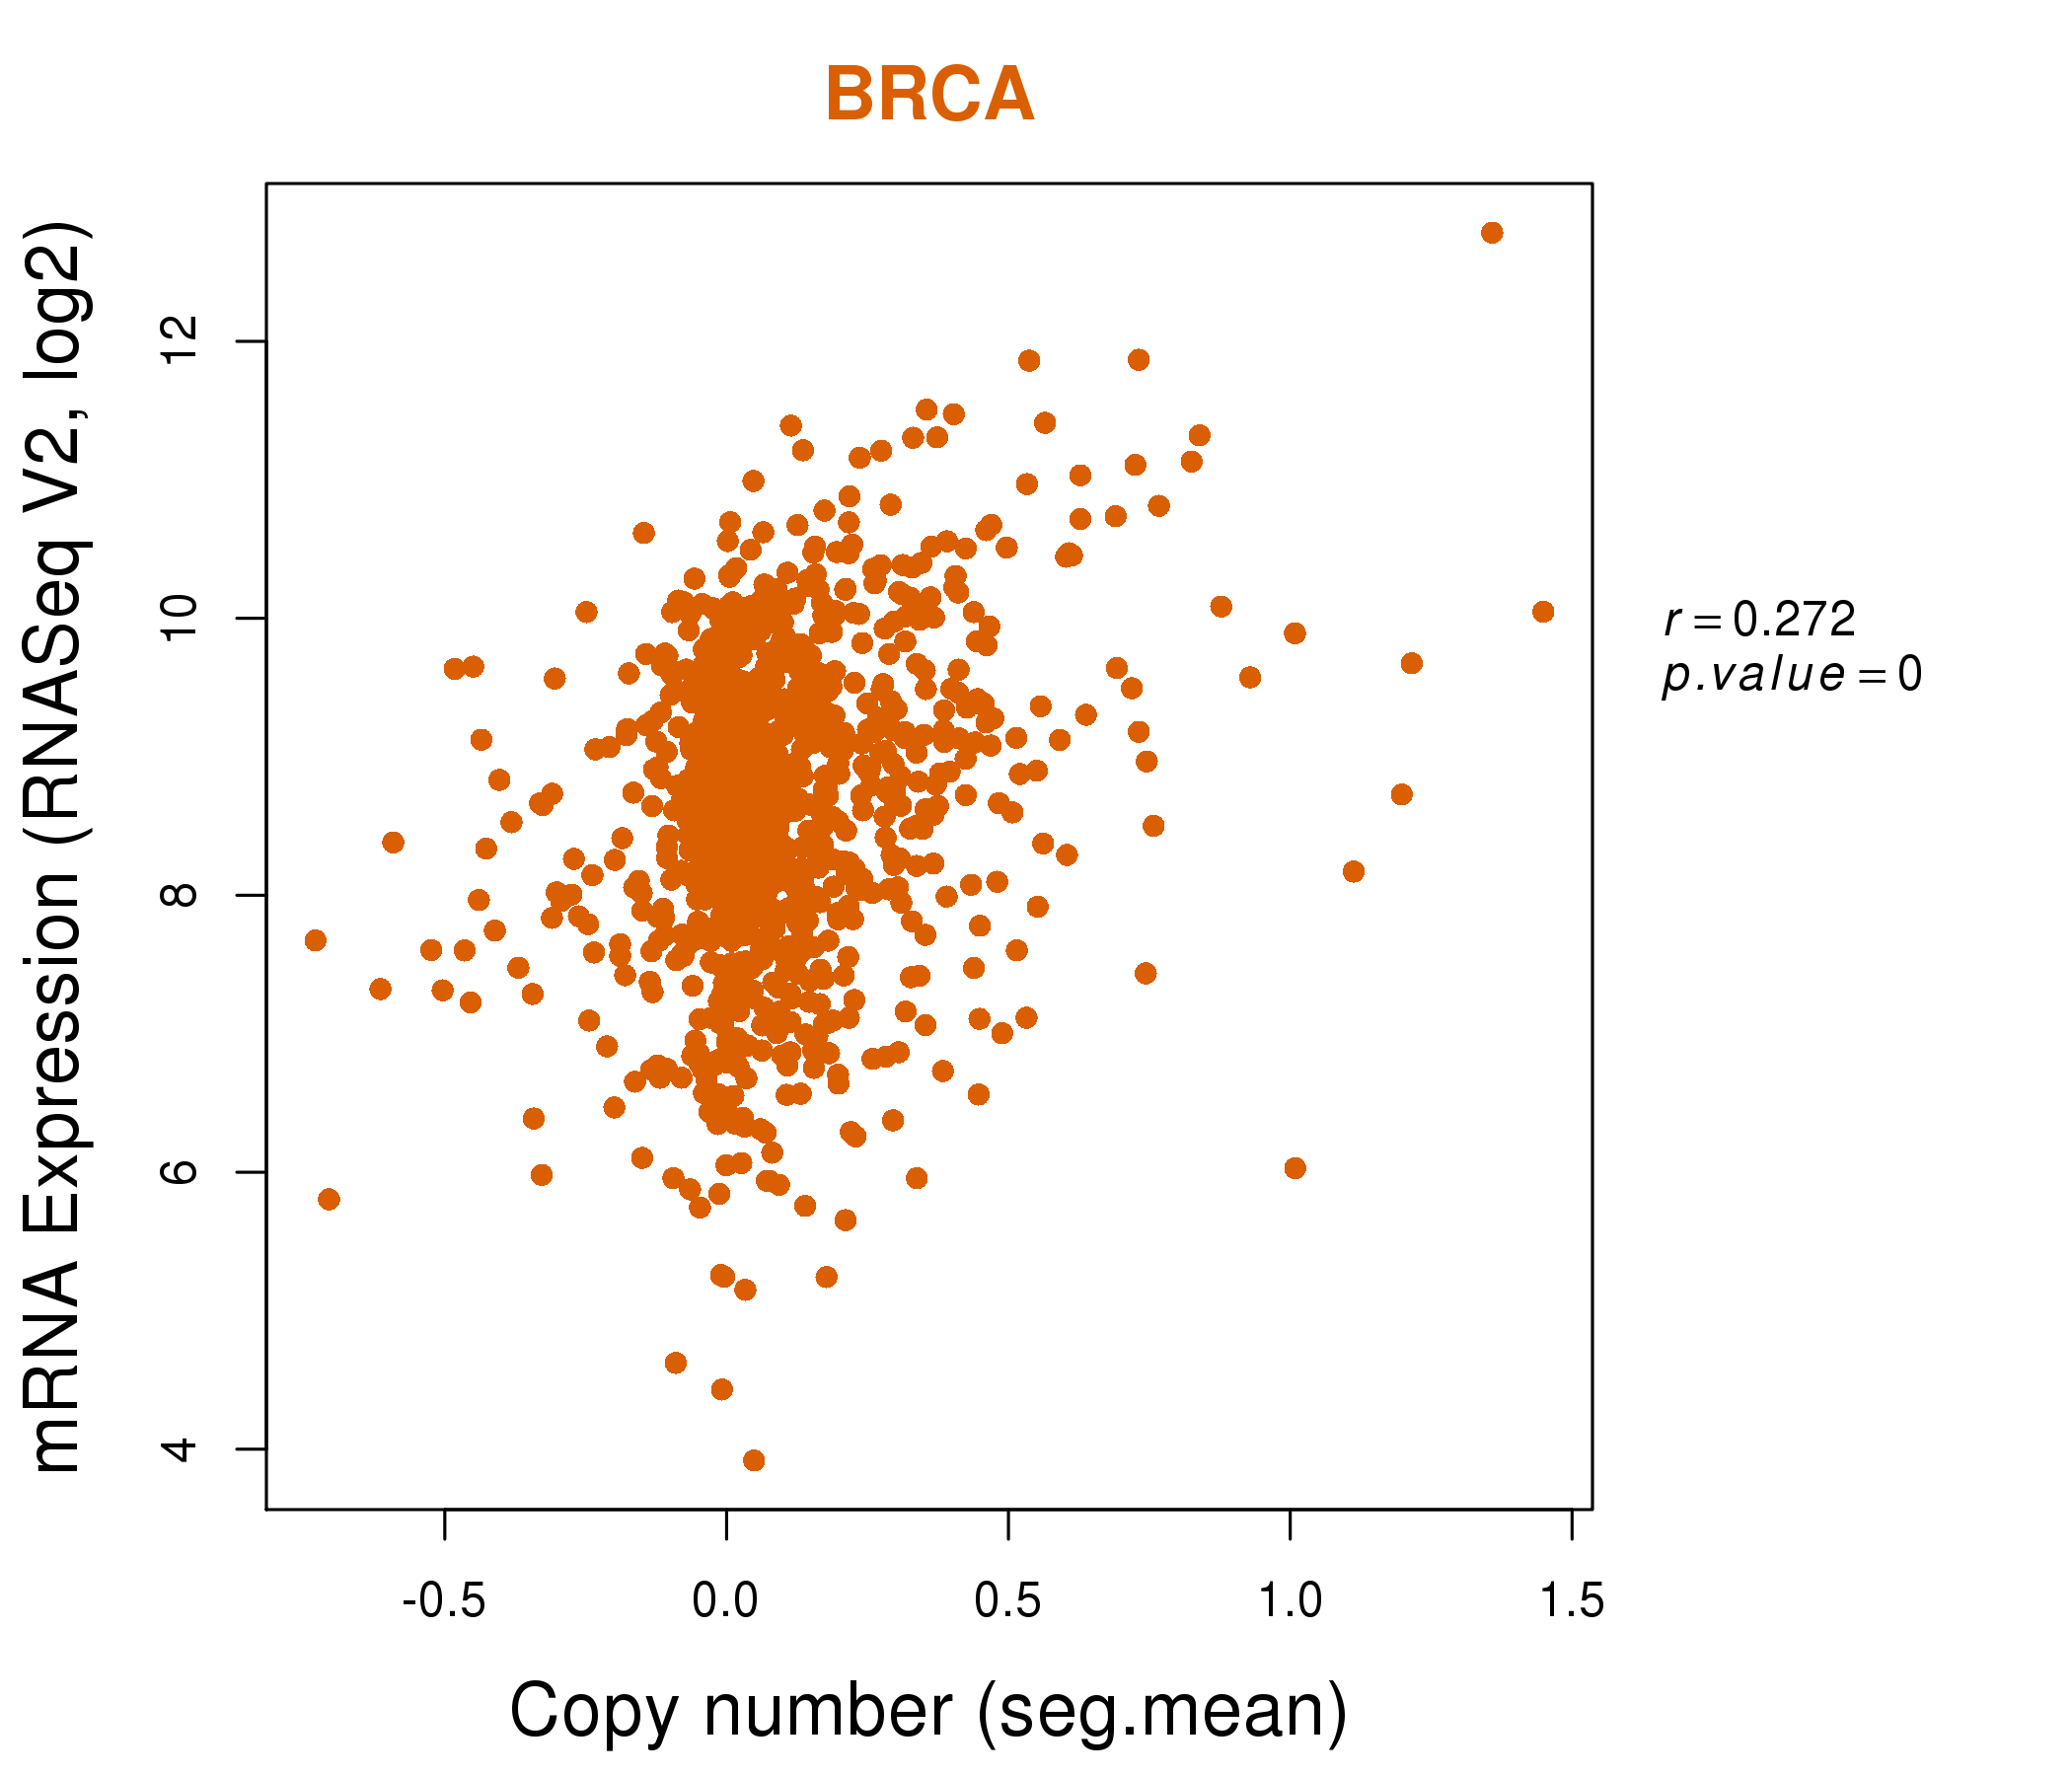
| * Copy number data were extracted from TCGA using R package TCGA-Assembler. The URLs of all public data files on TCGA DCC data server were gathered on Jan-05-2015. Function ProcessCNAData in TCGA-Assembler package was used to obtain gene-level copy number value which is calculated as the average copy number of the genomic region of a gene. |
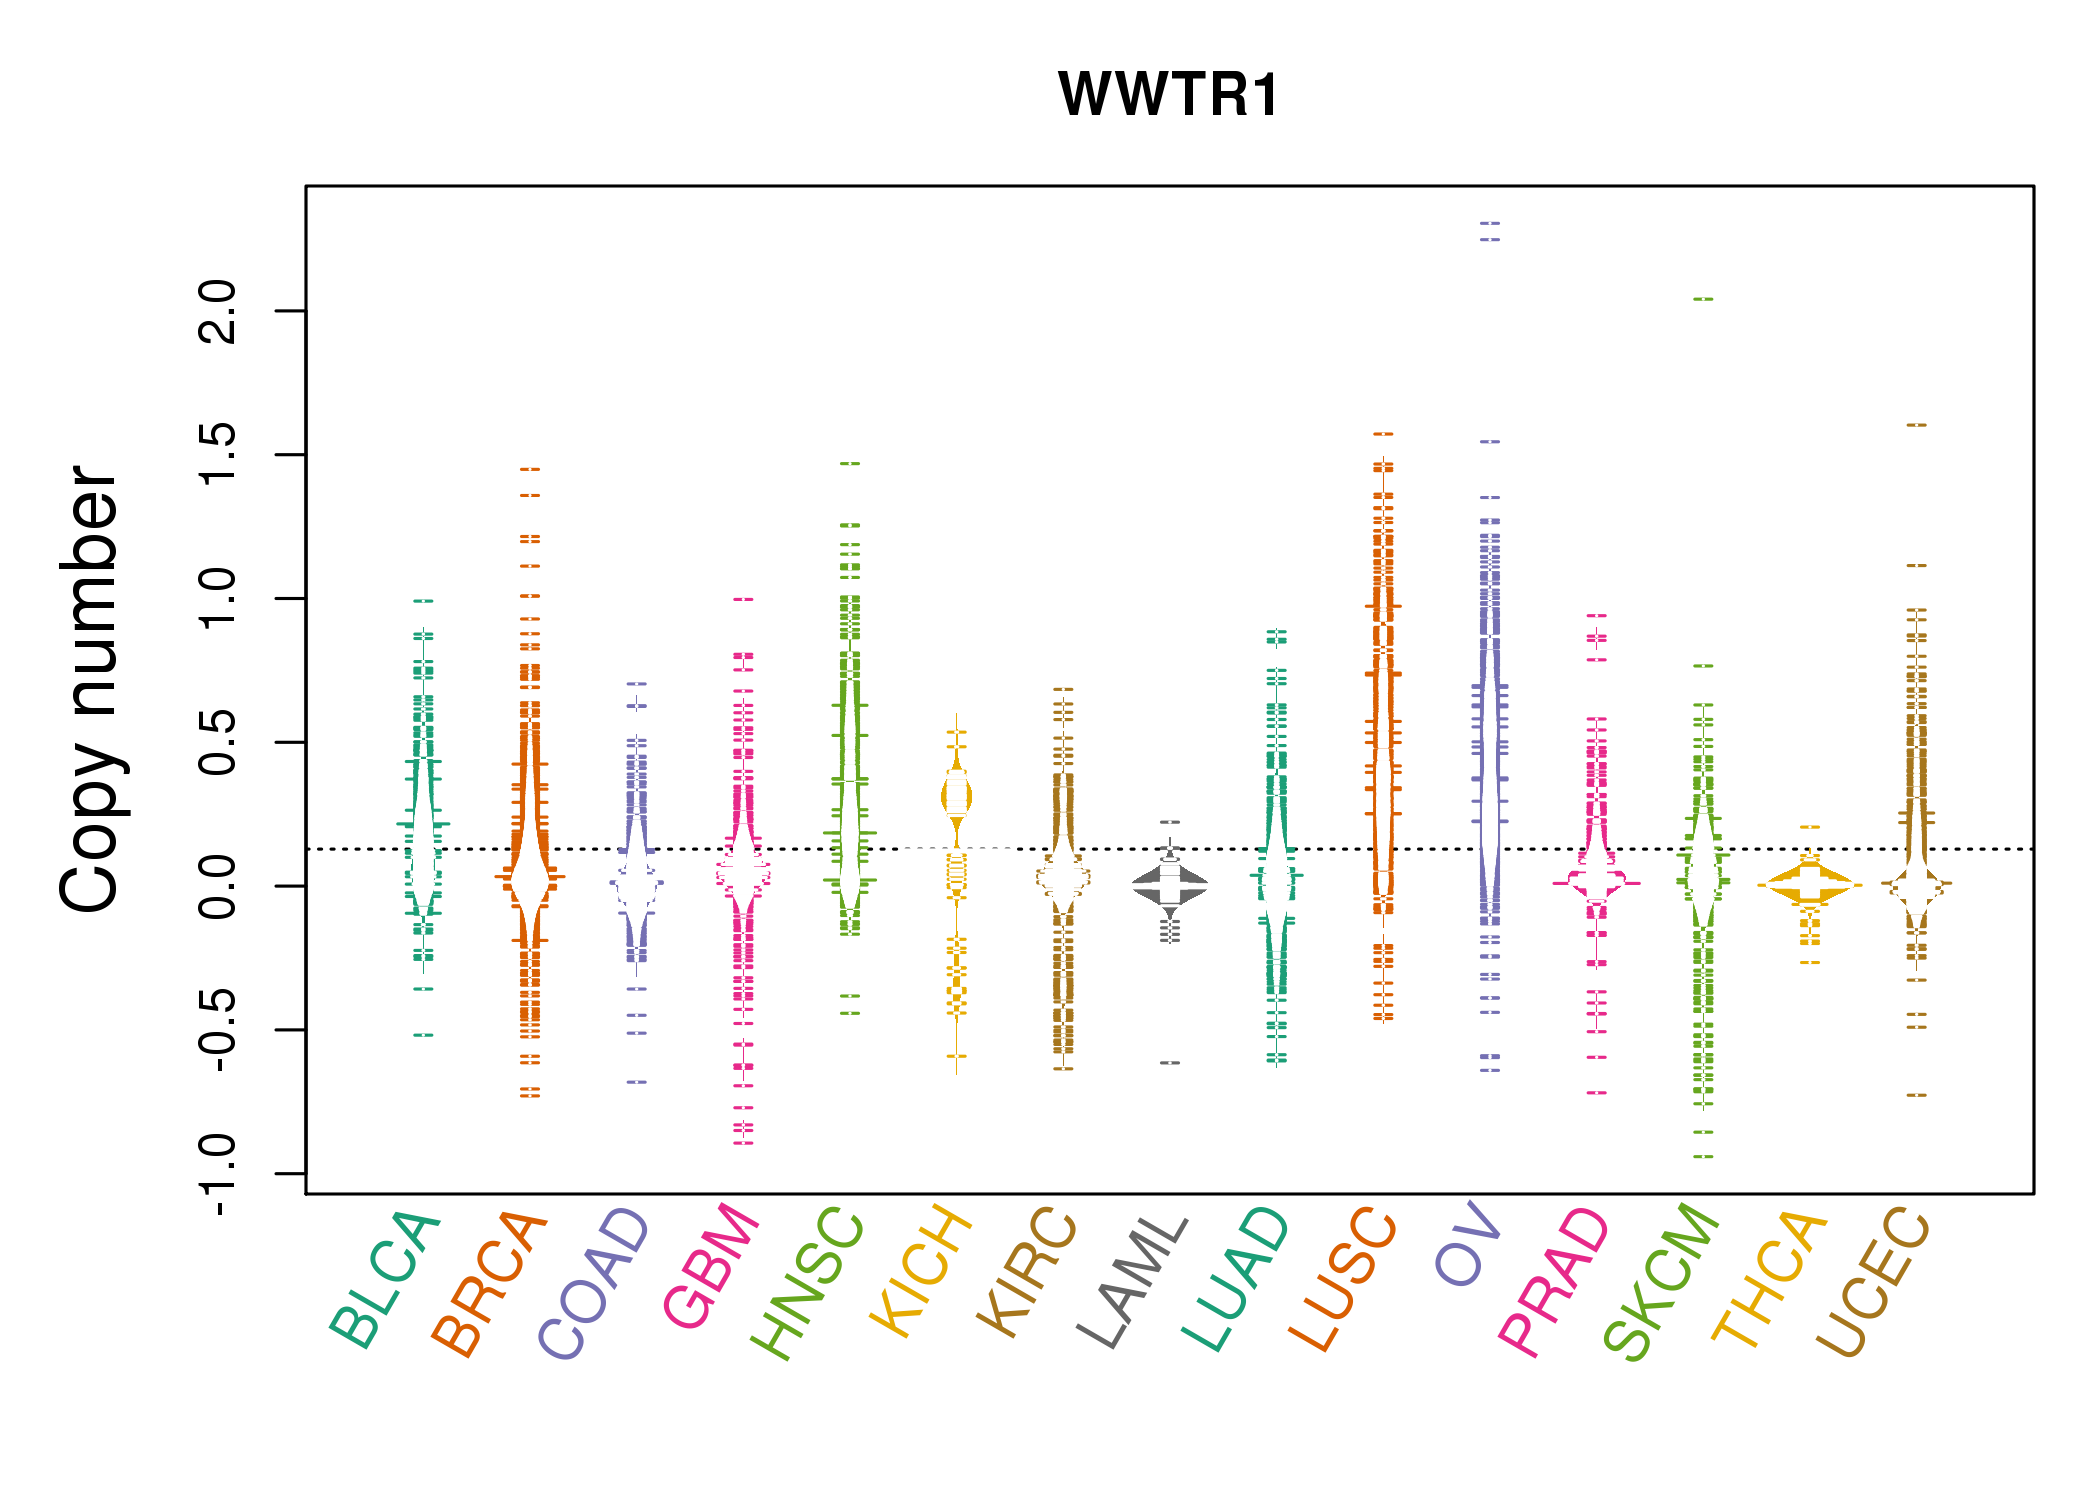 |
| cf) Tissue ID[Tissue type]: BLCA[Bladder Urothelial Carcinoma], BRCA[Breast invasive carcinoma], CESC[Cervical squamous cell carcinoma and endocervical adenocarcinoma], COAD[Colon adenocarcinoma], GBM[Glioblastoma multiforme], Glioma Low Grade, HNSC[Head and Neck squamous cell carcinoma], KICH[Kidney Chromophobe], KIRC[Kidney renal clear cell carcinoma], KIRP[Kidney renal papillary cell carcinoma], LAML[Acute Myeloid Leukemia], LUAD[Lung adenocarcinoma], LUSC[Lung squamous cell carcinoma], OV[Ovarian serous cystadenocarcinoma ], PAAD[Pancreatic adenocarcinoma], PRAD[Prostate adenocarcinoma], SKCM[Skin Cutaneous Melanoma], STAD[Stomach adenocarcinoma], THCA[Thyroid carcinoma], UCEC[Uterine Corpus Endometrial Carcinoma] |
| Top |
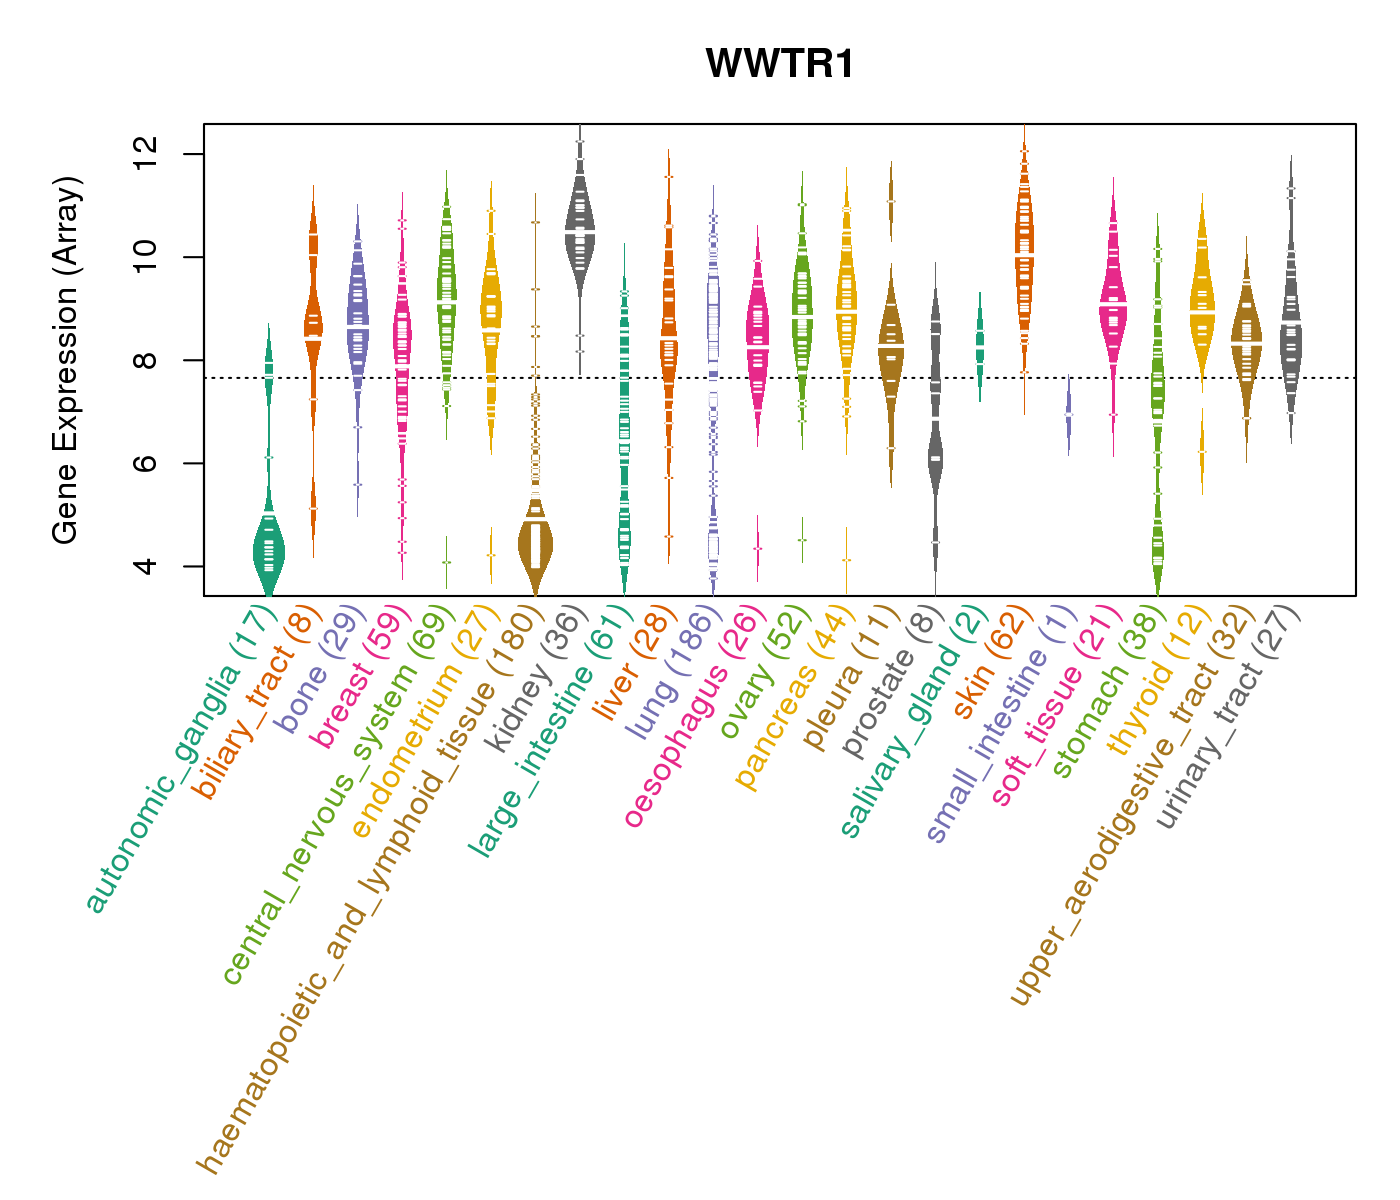
| Gene Expression for WWTR1 |
| * CCLE gene expression data were extracted from CCLE_Expression_Entrez_2012-10-18.res: Gene-centric RMA-normalized mRNA expression data. |
 |
| Top |
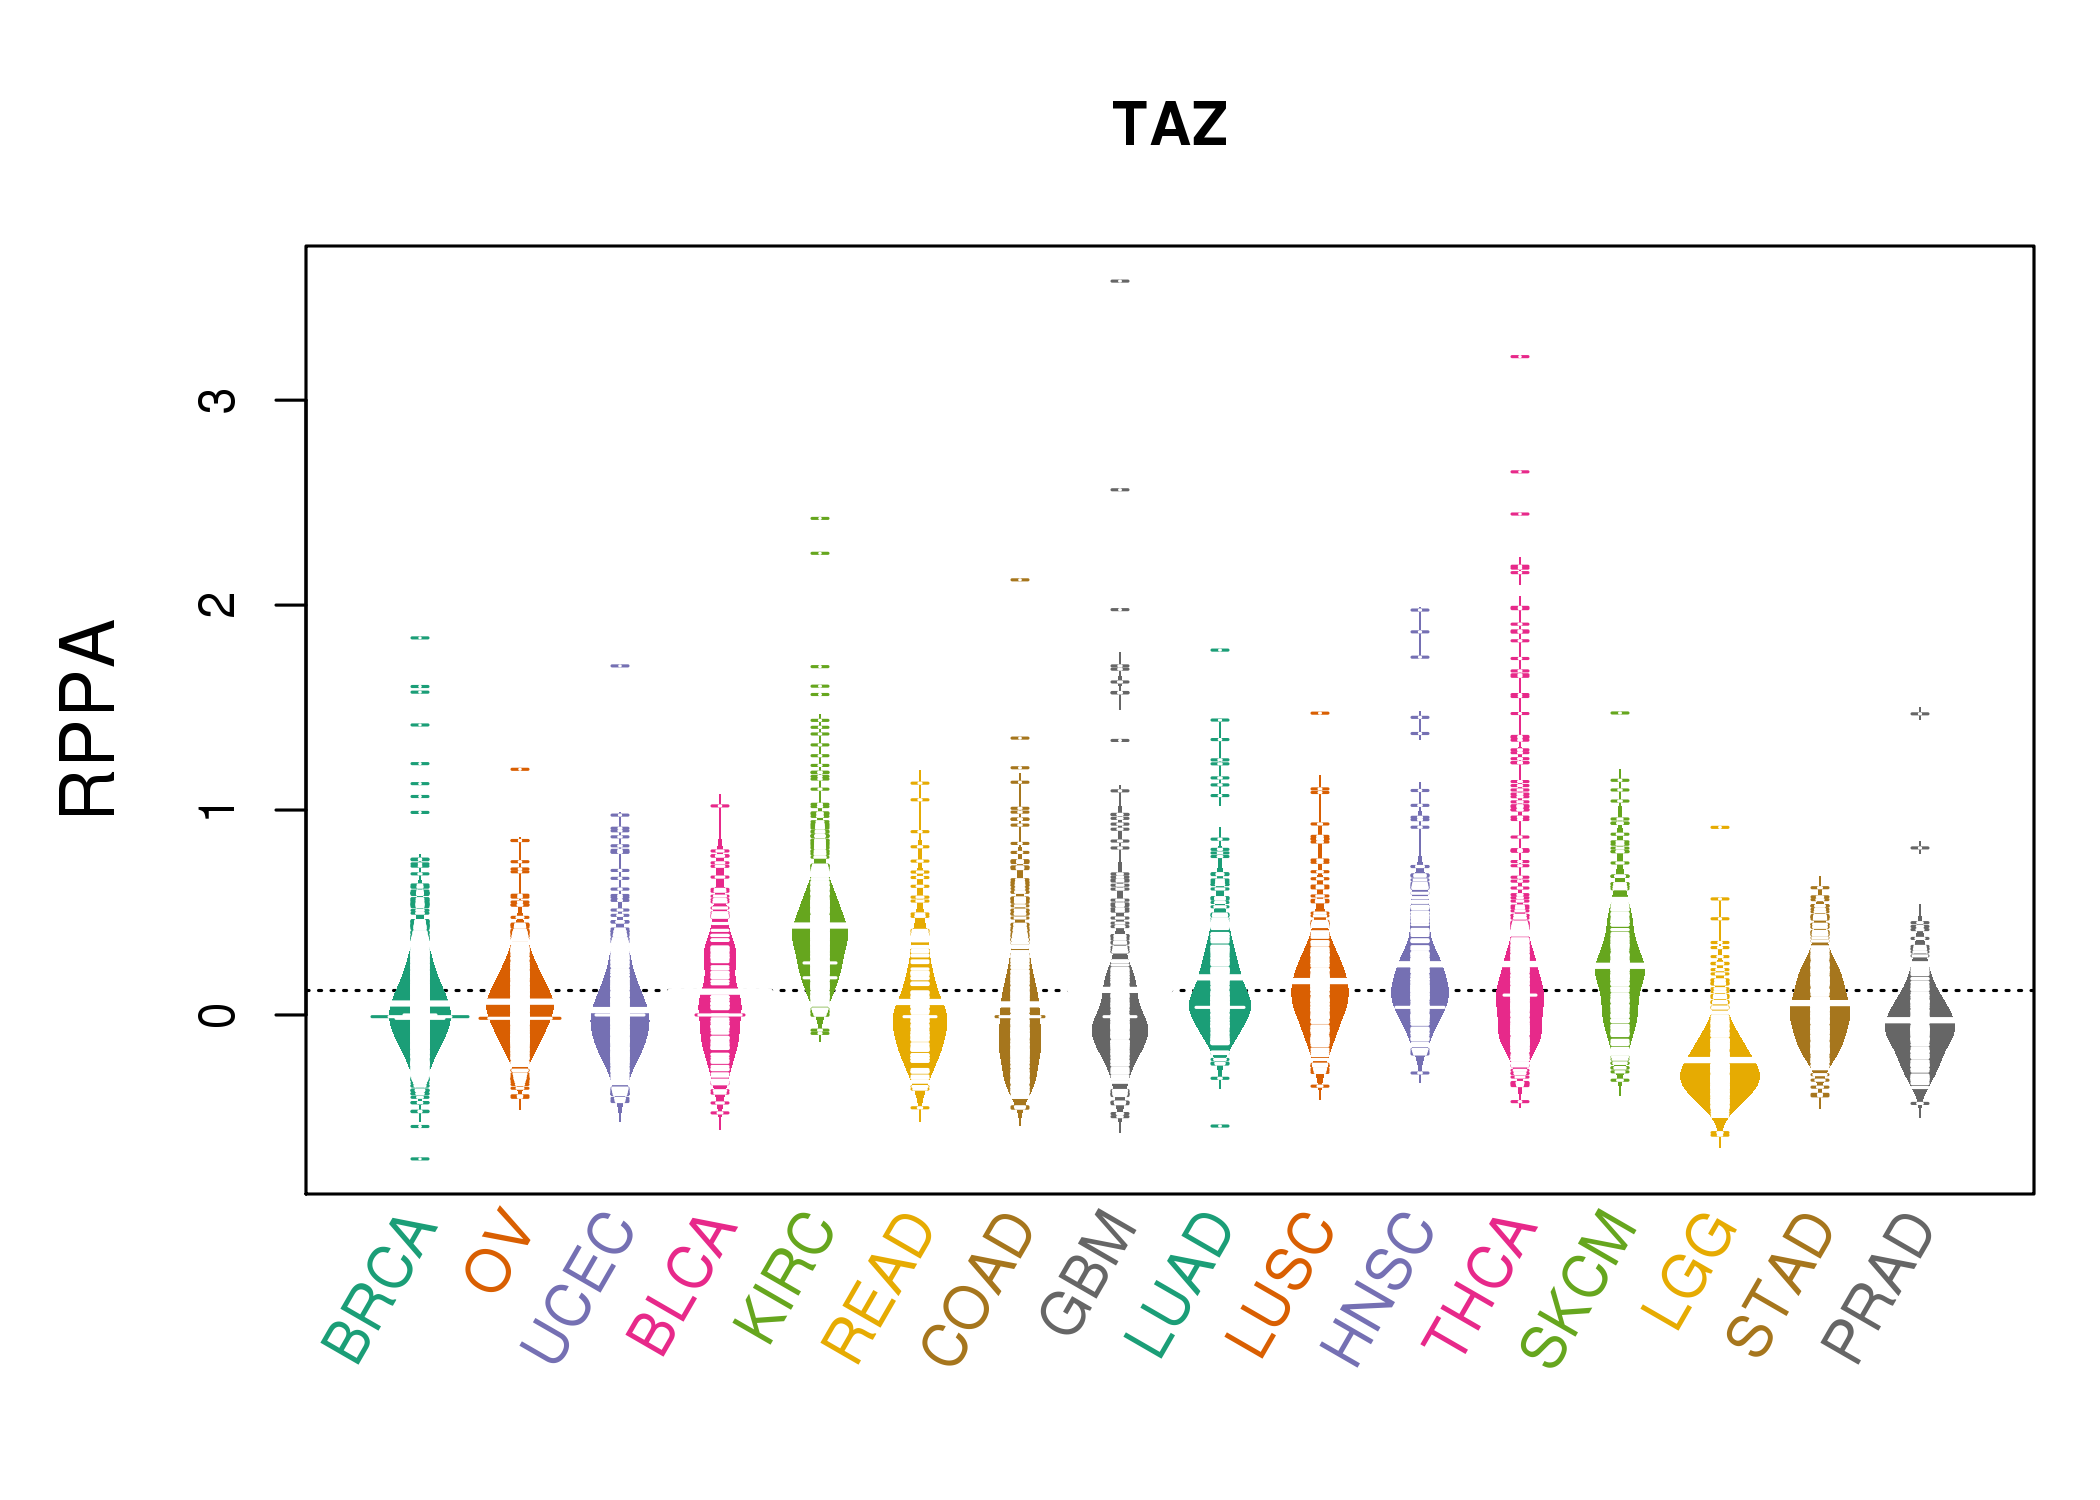
| *RPPA protein expression data were extracted from TCPA (The Cancer Proteome Atlas). Normalized data based on replicated based normalization (RBN) was used to draw following figures. |
 |
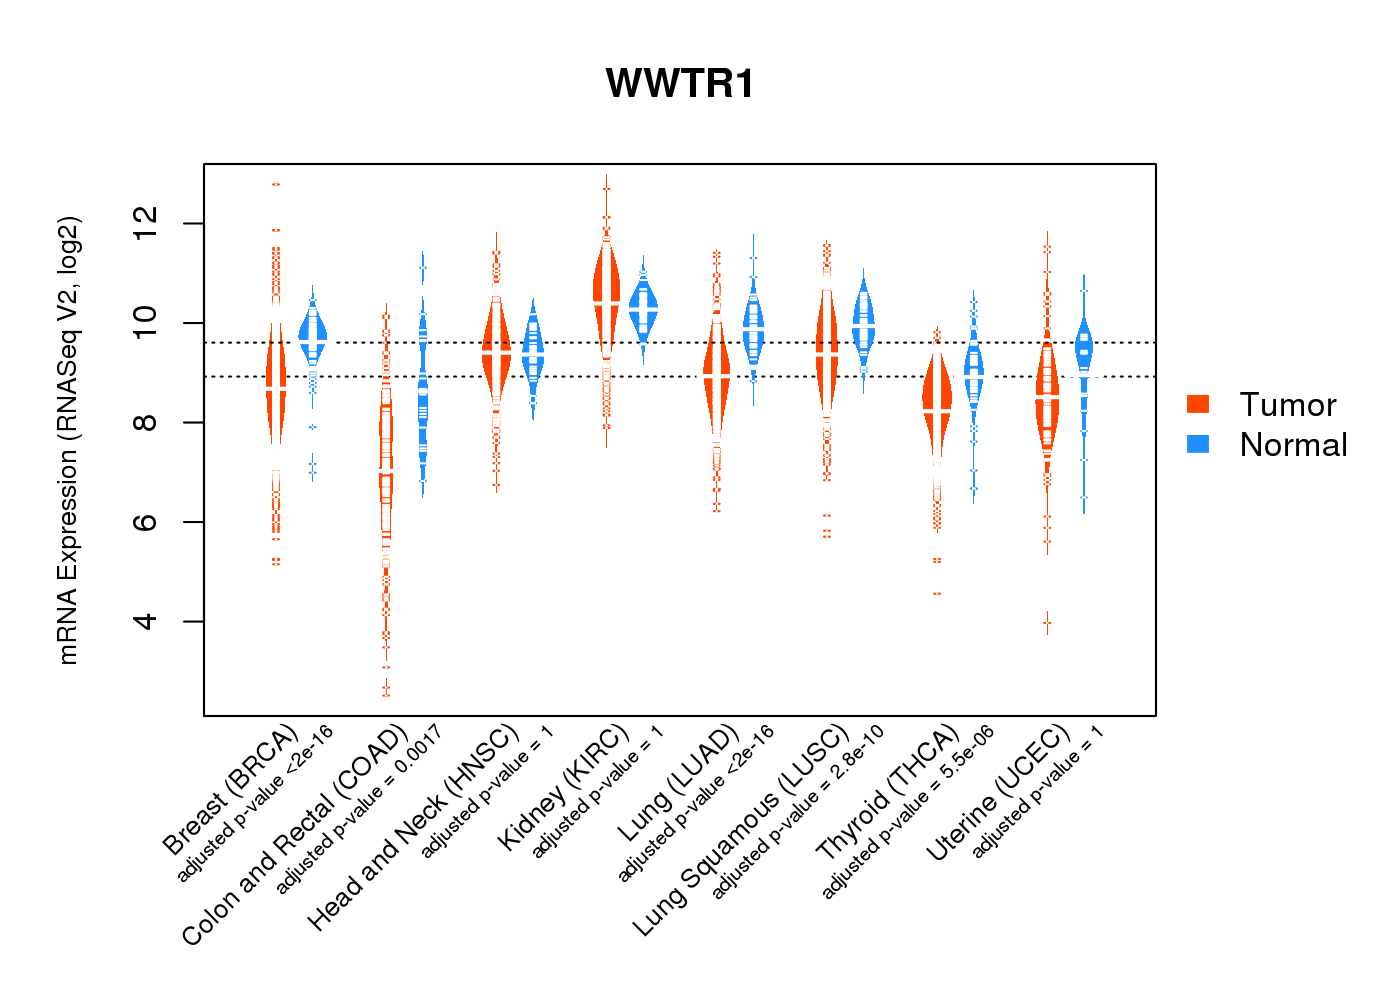
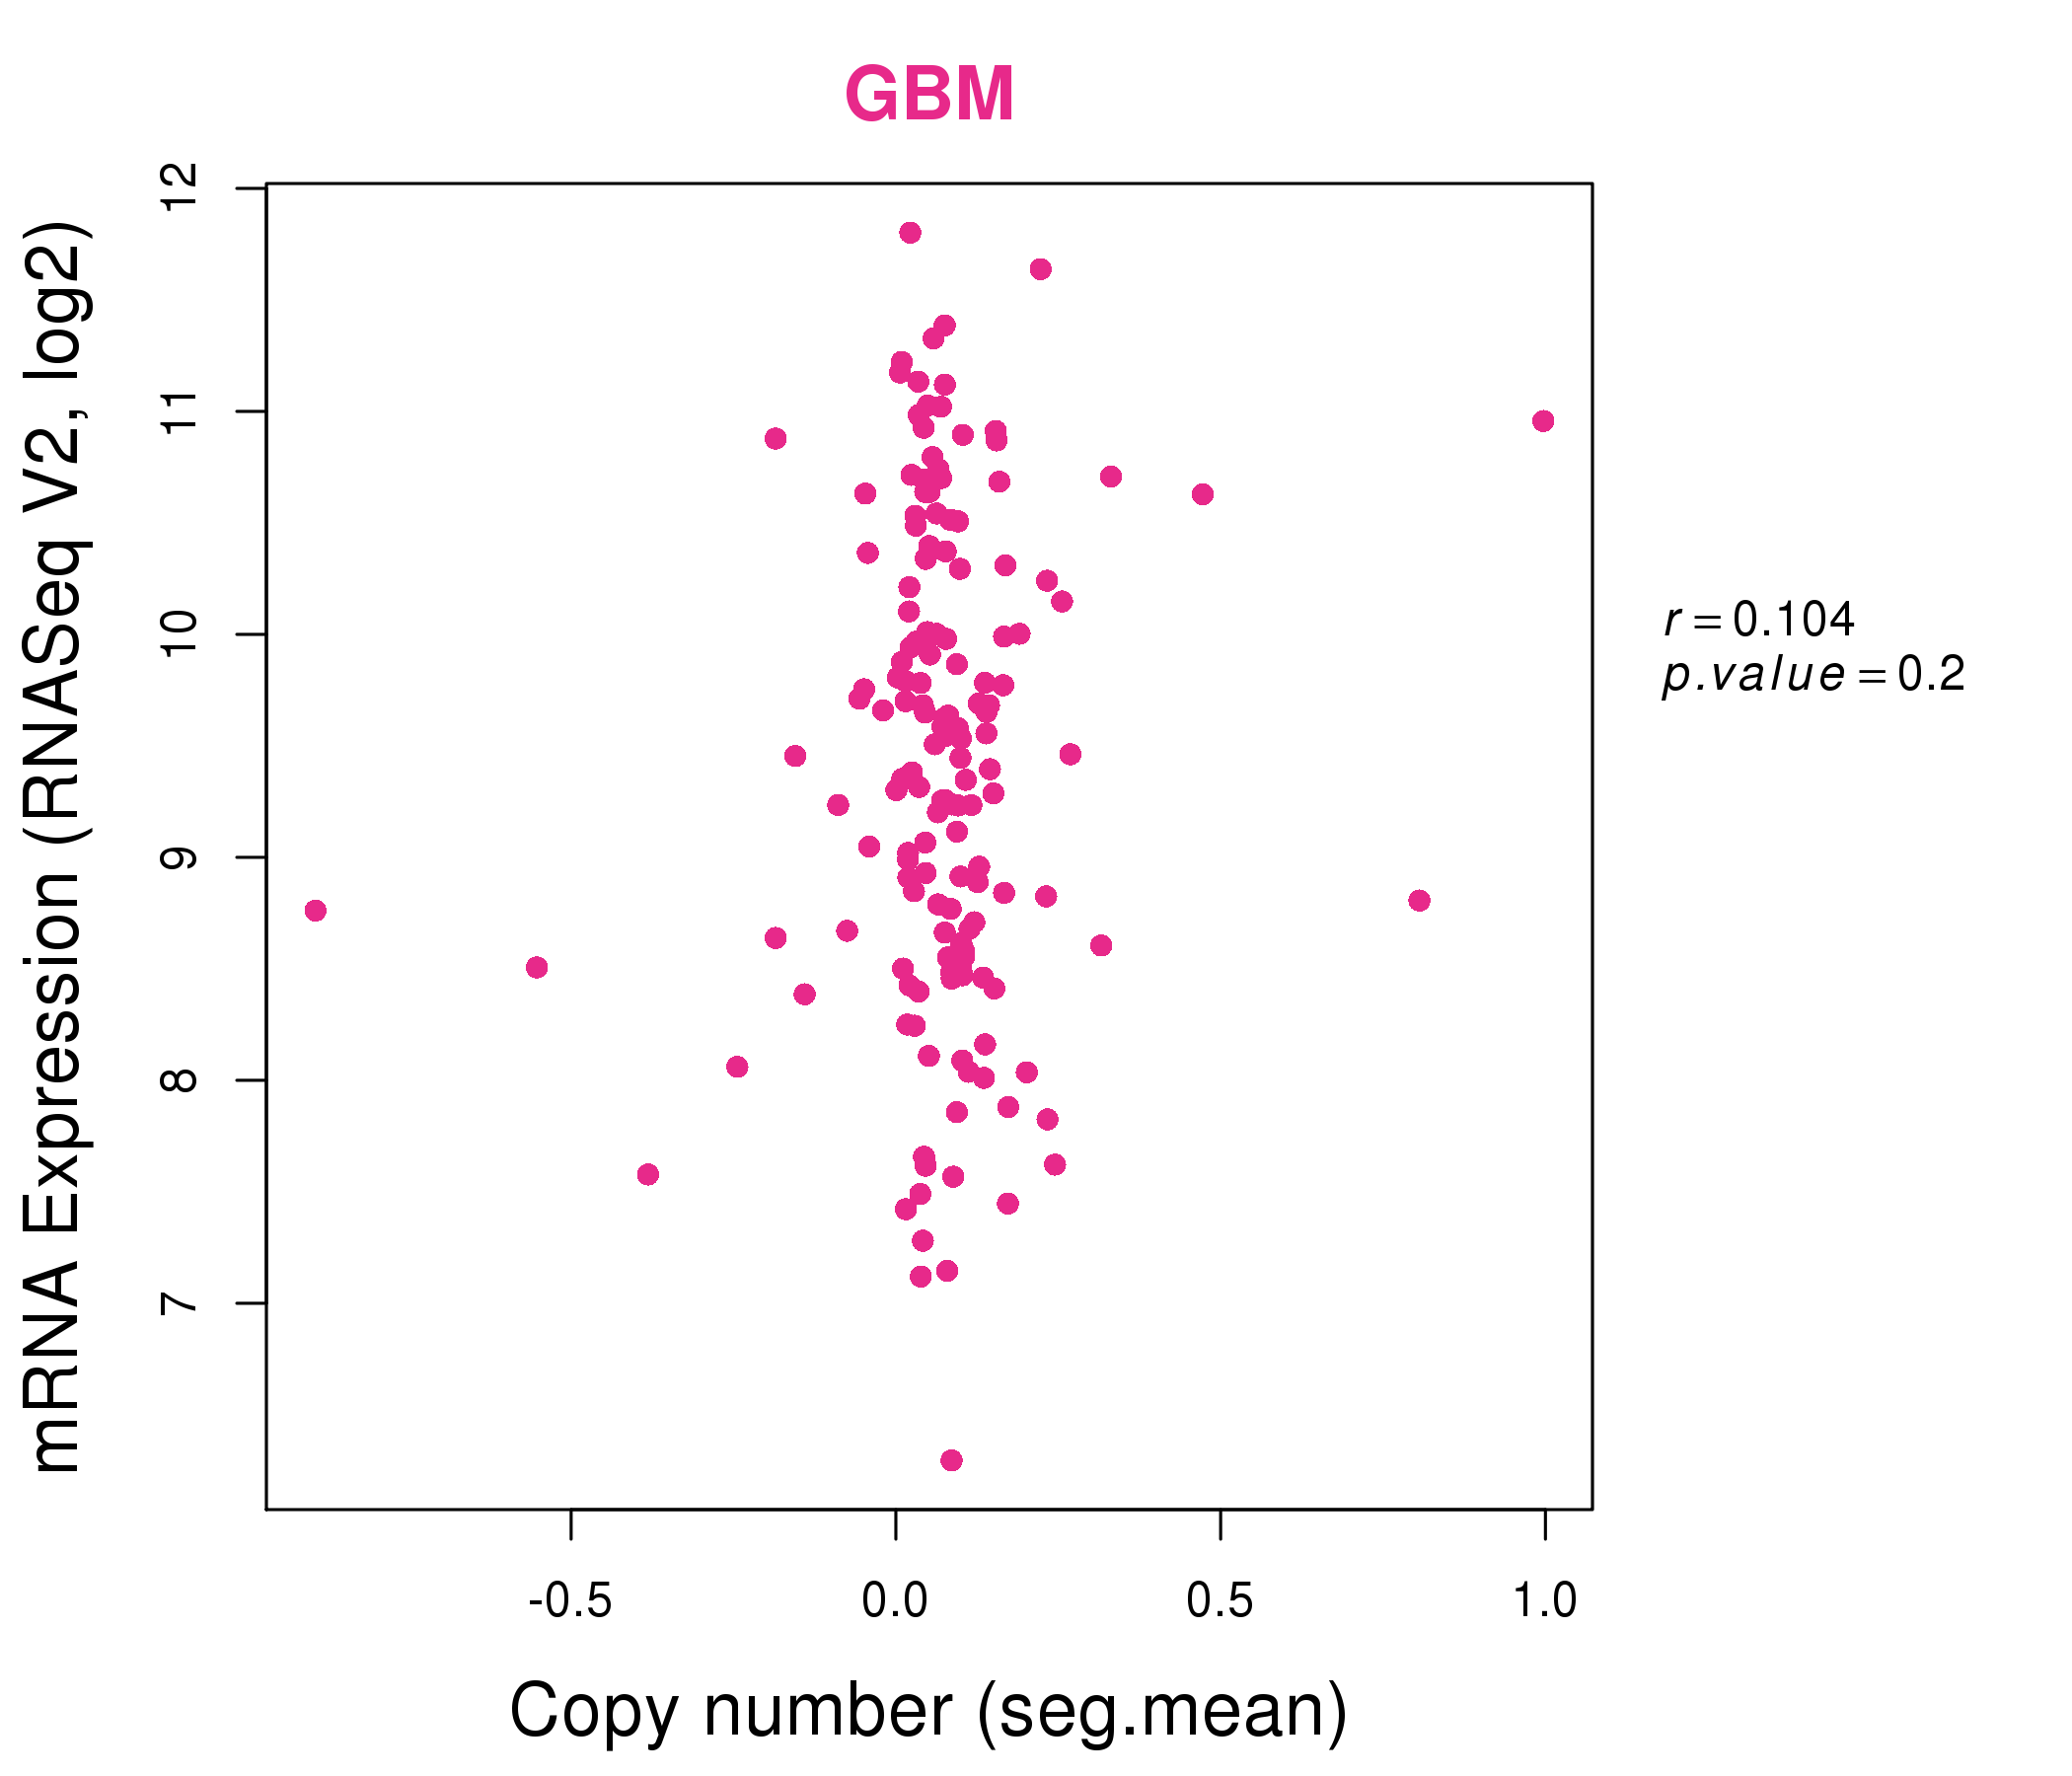
| * Normalized gene expression data of RNASeqV2 was extracted from TCGA using R package TCGA-Assembler. The URLs of all public data files on TCGA DCC data server were gathered at Jan-05-2015. Only eight cancer types have enough normal control samples for differential expression analysis. (t test, adjusted p<0.05 (using Benjamini-Hochberg FDR)) |
 |
| Top |
| * This plots show the correlation between CNV and gene expression. |
: Open all plots for all cancer types
 |
|
 |
|
| Top |
| Gene-Gene Network Information |
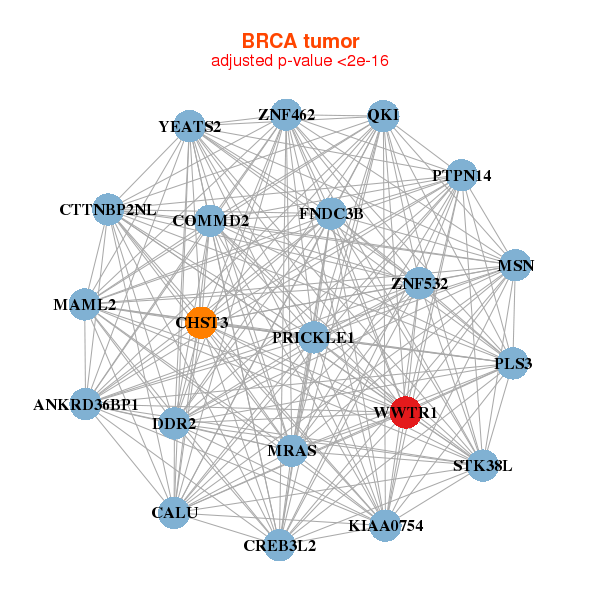
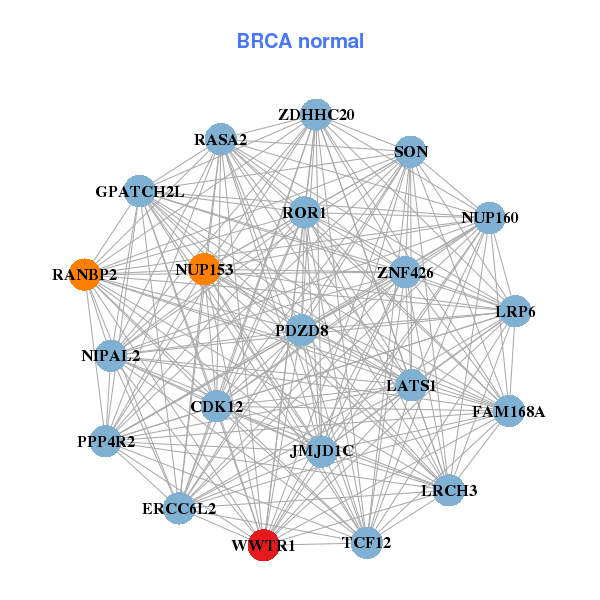
| * Co-Expression network figures were drawn using R package igraph. Only the top 20 genes with the highest correlations were shown. Red circle: input gene, orange circle: cell metabolism gene, sky circle: other gene |
: Open all plots for all cancer types
 |
|
| ANKRD36BP1,CALU,CHST3,COMMD2,CREB3L2,CTTNBP2NL,DDR2, FNDC3B,KIAA0754,MAML2,MRAS,MSN,PLS3,PRICKLE1, PTPN14,QKI,STK38L,WWTR1,YEATS2,ZNF462,ZNF532 | GPATCH2L,ERCC6L2,CDK12,FAM168A,JMJD1C,LATS1,LRCH3, LRP6,NIPAL2,NUP153,NUP160,PDZD8,PPP4R2,RANBP2, RASA2,ROR1,SON,TCF12,WWTR1,ZDHHC20,ZNF426 |
 |
|
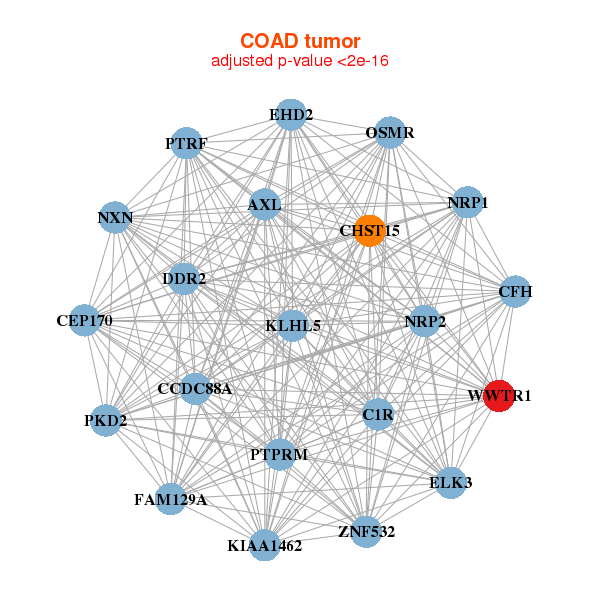
| AXL,C1R,CCDC88A,CEP170,CFH,CHST15,DDR2, EHD2,ELK3,FAM129A,KIAA1462,KLHL5,NRP1,NRP2, NXN,OSMR,PKD2,PTPRM,PTRF,WWTR1,ZNF532 | AKT3,AMOTL1,C16orf45,FAXC,DMD,EML1,FILIP1, FOXP2,ICA1L,KANK2,PALLD,PARVA,PPP1R12B,PRKG1, RAB9B,SCN7A,SOBP,SORBS1,SORBS2,TEAD1,WWTR1 |
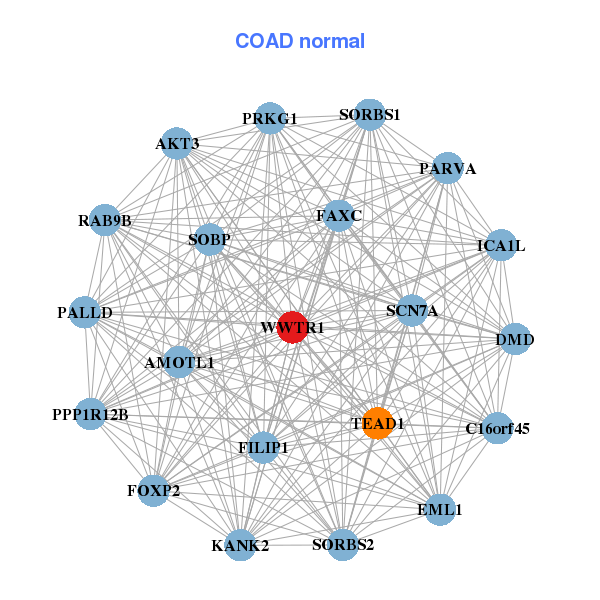
| * Co-Expression network figures were drawn using R package igraph. Only the top 20 genes with the highest correlations were shown. Red circle: input gene, orange circle: cell metabolism gene, sky circle: other gene |
: Open all plots for all cancer types
| Top |
: Open all interacting genes' information including KEGG pathway for all interacting genes from DAVID
| Top |
| Pharmacological Information for WWTR1 |
| There's no related Drug. |
| Top |
| Cross referenced IDs for WWTR1 |
| * We obtained these cross-references from Uniprot database. It covers 150 different DBs, 18 categories. http://www.uniprot.org/help/cross_references_section |
: Open all cross reference information
|
Copyright © 2016-Present - The Univsersity of Texas Health Science Center at Houston @ |