|
||||||||||||||||||||
| |
| Phenotypic Information (metabolism pathway, cancer, disease, phenome) |
| |
| |
| Gene-Gene Network Information: Co-Expression Network, Interacting Genes & KEGG |
| |
|


| Gene Summary for GANC |
| Basic gene info. | Gene symbol | GANC |
| Gene name | glucosidase, alpha; neutral C | |
| Synonyms | - | |
| Cytomap | UCSC genome browser: 15q15.2 | |
| Genomic location | chr15 :42566365-42645864 | |
| Type of gene | protein-coding | |
| RefGenes | NM_001301409.1, NM_001301410.1,NM_198141.2, | |
| Ensembl id | ENSG00000214013 | |
| Description | neutral alpha-glucosidase C | |
| Modification date | 20141207 | |
| dbXrefs | MIM : 104180 | |
| HGNC : HGNC | ||
| HPRD : 00077 | ||
| Protein | UniProt: go to UniProt's Cross Reference DB Table | |
| Expression | CleanEX: HS_GANC | |
| BioGPS: 2595 | ||
| Gene Expression Atlas: ENSG00000214013 | ||
| The Human Protein Atlas: ENSG00000214013 | ||
| Pathway | NCI Pathway Interaction Database: GANC | |
| KEGG: GANC | ||
| REACTOME: GANC | ||
| ConsensusPathDB | ||
| Pathway Commons: GANC | ||
| Metabolism | MetaCyc: GANC | |
| HUMANCyc: GANC | ||
| Regulation | Ensembl's Regulation: ENSG00000214013 | |
| miRBase: chr15 :42,566,365-42,645,864 | ||
| TargetScan: NM_001301409 | ||
| cisRED: ENSG00000214013 | ||
| Context | iHOP: GANC | |
| cancer metabolism search in PubMed: GANC | ||
| UCL Cancer Institute: GANC | ||
| Assigned class in ccmGDB | C | |
| Top |
| Phenotypic Information for GANC(metabolism pathway, cancer, disease, phenome) |
| Cancer | CGAP: GANC |
| Familial Cancer Database: GANC | |
| * This gene is included in those cancer gene databases. |
|
|
|
|
|
|
| ||||||||||||||
Oncogene 1 | Significant driver gene in | |||||||||||||||||||
| cf) number; DB name 1 Oncogene; http://nar.oxfordjournals.org/content/35/suppl_1/D721.long, 2 Tumor Suppressor gene; https://bioinfo.uth.edu/TSGene/, 3 Cancer Gene Census; http://www.nature.com/nrc/journal/v4/n3/abs/nrc1299.html, 4 CancerGenes; http://nar.oxfordjournals.org/content/35/suppl_1/D721.long, 5 Network of Cancer Gene; http://ncg.kcl.ac.uk/index.php, 1Therapeutic Vulnerabilities in Cancer; http://cbio.mskcc.org/cancergenomics/statius/ |
| KEGG_GALACTOSE_METABOLISM KEGG_STARCH_AND_SUCROSE_METABOLISM | |
| OMIM | |
| Orphanet | |
| Disease | KEGG Disease: GANC |
| MedGen: GANC (Human Medical Genetics with Condition) | |
| ClinVar: GANC | |
| Phenotype | MGI: GANC (International Mouse Phenotyping Consortium) |
| PhenomicDB: GANC | |
| Mutations for GANC |
| * Under tables are showing count per each tissue to give us broad intuition about tissue specific mutation patterns.You can go to the detailed page for each mutation database's web site. |
| - Statistics for Tissue and Mutation type | Top |
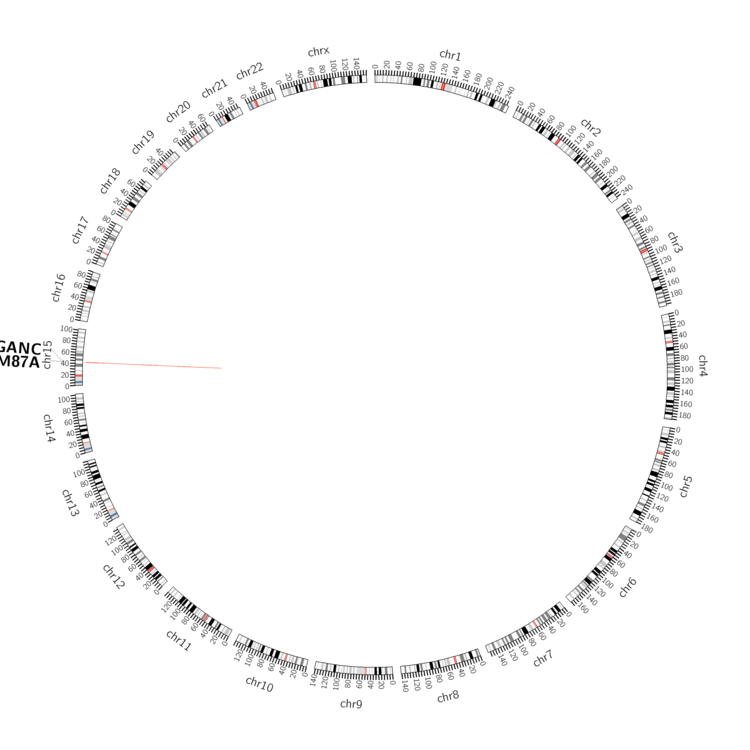 |
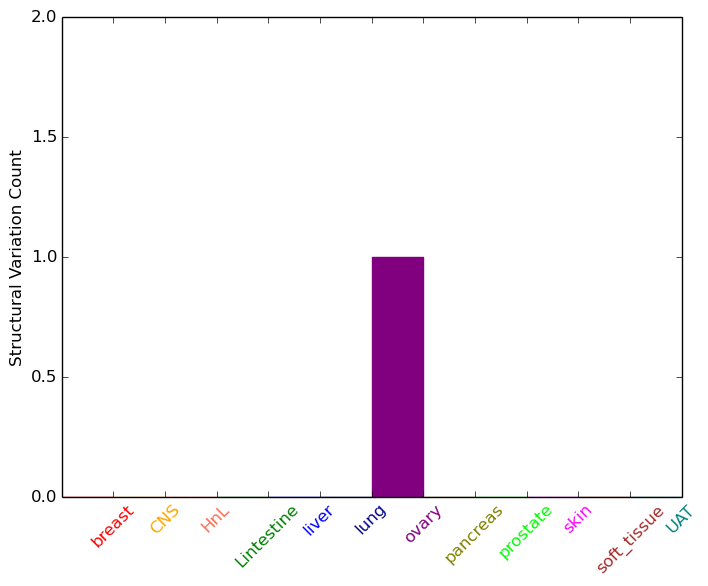
| - For Inter-chromosomal Variations |
| There's no inter-chromosomal structural variation. |
| - For Intra-chromosomal Variations |
| * Intra-chromosomal variantions includes 'intrachromosomal amplicon to amplicon', 'intrachromosomal amplicon to non-amplified dna', 'intrachromosomal deletion', 'intrachromosomal fold-back inversion', 'intrachromosomal inversion', 'intrachromosomal tandem duplication', 'Intrachromosomal unknown type', 'intrachromosomal with inverted orientation', 'intrachromosomal with non-inverted orientation'. |
 |
| Sample | Symbol_a | Chr_a | Start_a | End_a | Symbol_b | Chr_b | Start_b | End_b |
| ovary | GANC | chr15 | 42605762 | 42605782 | TMEM87A | chr15 | 42506230 | 42506250 |
| cf) Tissue number; Tissue name (1;Breast, 2;Central_nervous_system, 3;Haematopoietic_and_lymphoid_tissue, 4;Large_intestine, 5;Liver, 6;Lung, 7;Ovary, 8;Pancreas, 9;Prostate, 10;Skin, 11;Soft_tissue, 12;Upper_aerodigestive_tract) |
| * From mRNA Sanger sequences, Chitars2.0 arranged chimeric transcripts. This table shows GANC related fusion information. |
| ID | Head Gene | Tail Gene | Accession | Gene_a | qStart_a | qEnd_a | Chromosome_a | tStart_a | tEnd_a | Gene_a | qStart_a | qEnd_a | Chromosome_a | tStart_a | tEnd_a |
| AW572233 | GANC | 13 | 87 | 15 | 42645790 | 42645864 | GANC | 84 | 214 | 15 | 42645704 | 42645834 | |
| Top |
| There's no copy number variation information in COSMIC data for this gene. |
| Top |
|
 |
| Top |
| Stat. for Non-Synonymous SNVs (# total SNVs=47) | (# total SNVs=12) |
 |  |
(# total SNVs=0) | (# total SNVs=0) |
| Top |
| * When you move the cursor on each content, you can see more deailed mutation information on the Tooltip. Those are primary_site,primary_histology,mutation(aa),pubmedID. |
| GRCh37 position | Mutation(aa) | Unique sampleID count |
| chr15:42619578-42619578 | p.D480N | 2 |
| chr15:42602622-42602622 | p.S288S | 2 |
| chr15:42632010-42632010 | p.T663A | 2 |
| chr15:42614179-42614179 | p.P418P | 2 |
| chr15:42614213-42614213 | p.R430C | 2 |
| chr15:42602943-42602943 | p.R319H | 2 |
| chr15:42632088-42632088 | p.V689M | 1 |
| chr15:42568593-42568593 | p.K26R | 1 |
| chr15:42618582-42618582 | p.K460K | 1 |
| chr15:42641671-42641671 | p.C837G | 1 |
| Top |
|
 |
| Point Mutation/ Tissue ID | 1 | 2 | 3 | 4 | 5 | 6 | 7 | 8 | 9 | 10 | 11 | 12 | 13 | 14 | 15 | 16 | 17 | 18 | 19 | 20 |
| # sample | 3 | 2 | 7 | 5 | 3 | 1 | 3 | 4 | 1 | 7 | 7 | 10 | ||||||||
| # mutation | 3 | 2 | 7 | 5 | 3 | 1 | 3 | 4 | 1 | 9 | 7 | 16 | ||||||||
| nonsynonymous SNV | 2 | 2 | 6 | 3 | 2 | 1 | 3 | 4 | 5 | 7 | 13 | |||||||||
| synonymous SNV | 1 | 1 | 2 | 1 | 1 | 4 | 3 |
| cf) Tissue ID; Tissue type (1; BLCA[Bladder Urothelial Carcinoma], 2; BRCA[Breast invasive carcinoma], 3; CESC[Cervical squamous cell carcinoma and endocervical adenocarcinoma], 4; COAD[Colon adenocarcinoma], 5; GBM[Glioblastoma multiforme], 6; Glioma Low Grade, 7; HNSC[Head and Neck squamous cell carcinoma], 8; KICH[Kidney Chromophobe], 9; KIRC[Kidney renal clear cell carcinoma], 10; KIRP[Kidney renal papillary cell carcinoma], 11; LAML[Acute Myeloid Leukemia], 12; LUAD[Lung adenocarcinoma], 13; LUSC[Lung squamous cell carcinoma], 14; OV[Ovarian serous cystadenocarcinoma ], 15; PAAD[Pancreatic adenocarcinoma], 16; PRAD[Prostate adenocarcinoma], 17; SKCM[Skin Cutaneous Melanoma], 18:STAD[Stomach adenocarcinoma], 19:THCA[Thyroid carcinoma], 20:UCEC[Uterine Corpus Endometrial Carcinoma]) |
| Top |
| * We represented just top 10 SNVs. When you move the cursor on each content, you can see more deailed mutation information on the Tooltip. Those are primary_site, primary_histology, mutation(aa), pubmedID. |
| Genomic Position | Mutation(aa) | Unique sampleID count |
| chr15:42619578 | p.D480N | 2 |
| chr15:42632908 | p.R671T | 2 |
| chr15:42632035 | p.P703H | 2 |
| chr15:42568598 | p.R800Q | 1 |
| chr15:42622841 | p.R32H | 1 |
| chr15:42600445 | p.R319C | 1 |
| chr15:42632043 | p.A582V | 1 |
| chr15:42643552 | p.E812K | 1 |
| chr15:42570682 | p.V50A | 1 |
| chr15:42630590 | p.P339P | 1 |
| * Copy number data were extracted from TCGA using R package TCGA-Assembler. The URLs of all public data files on TCGA DCC data server were gathered on Jan-05-2015. Function ProcessCNAData in TCGA-Assembler package was used to obtain gene-level copy number value which is calculated as the average copy number of the genomic region of a gene. |
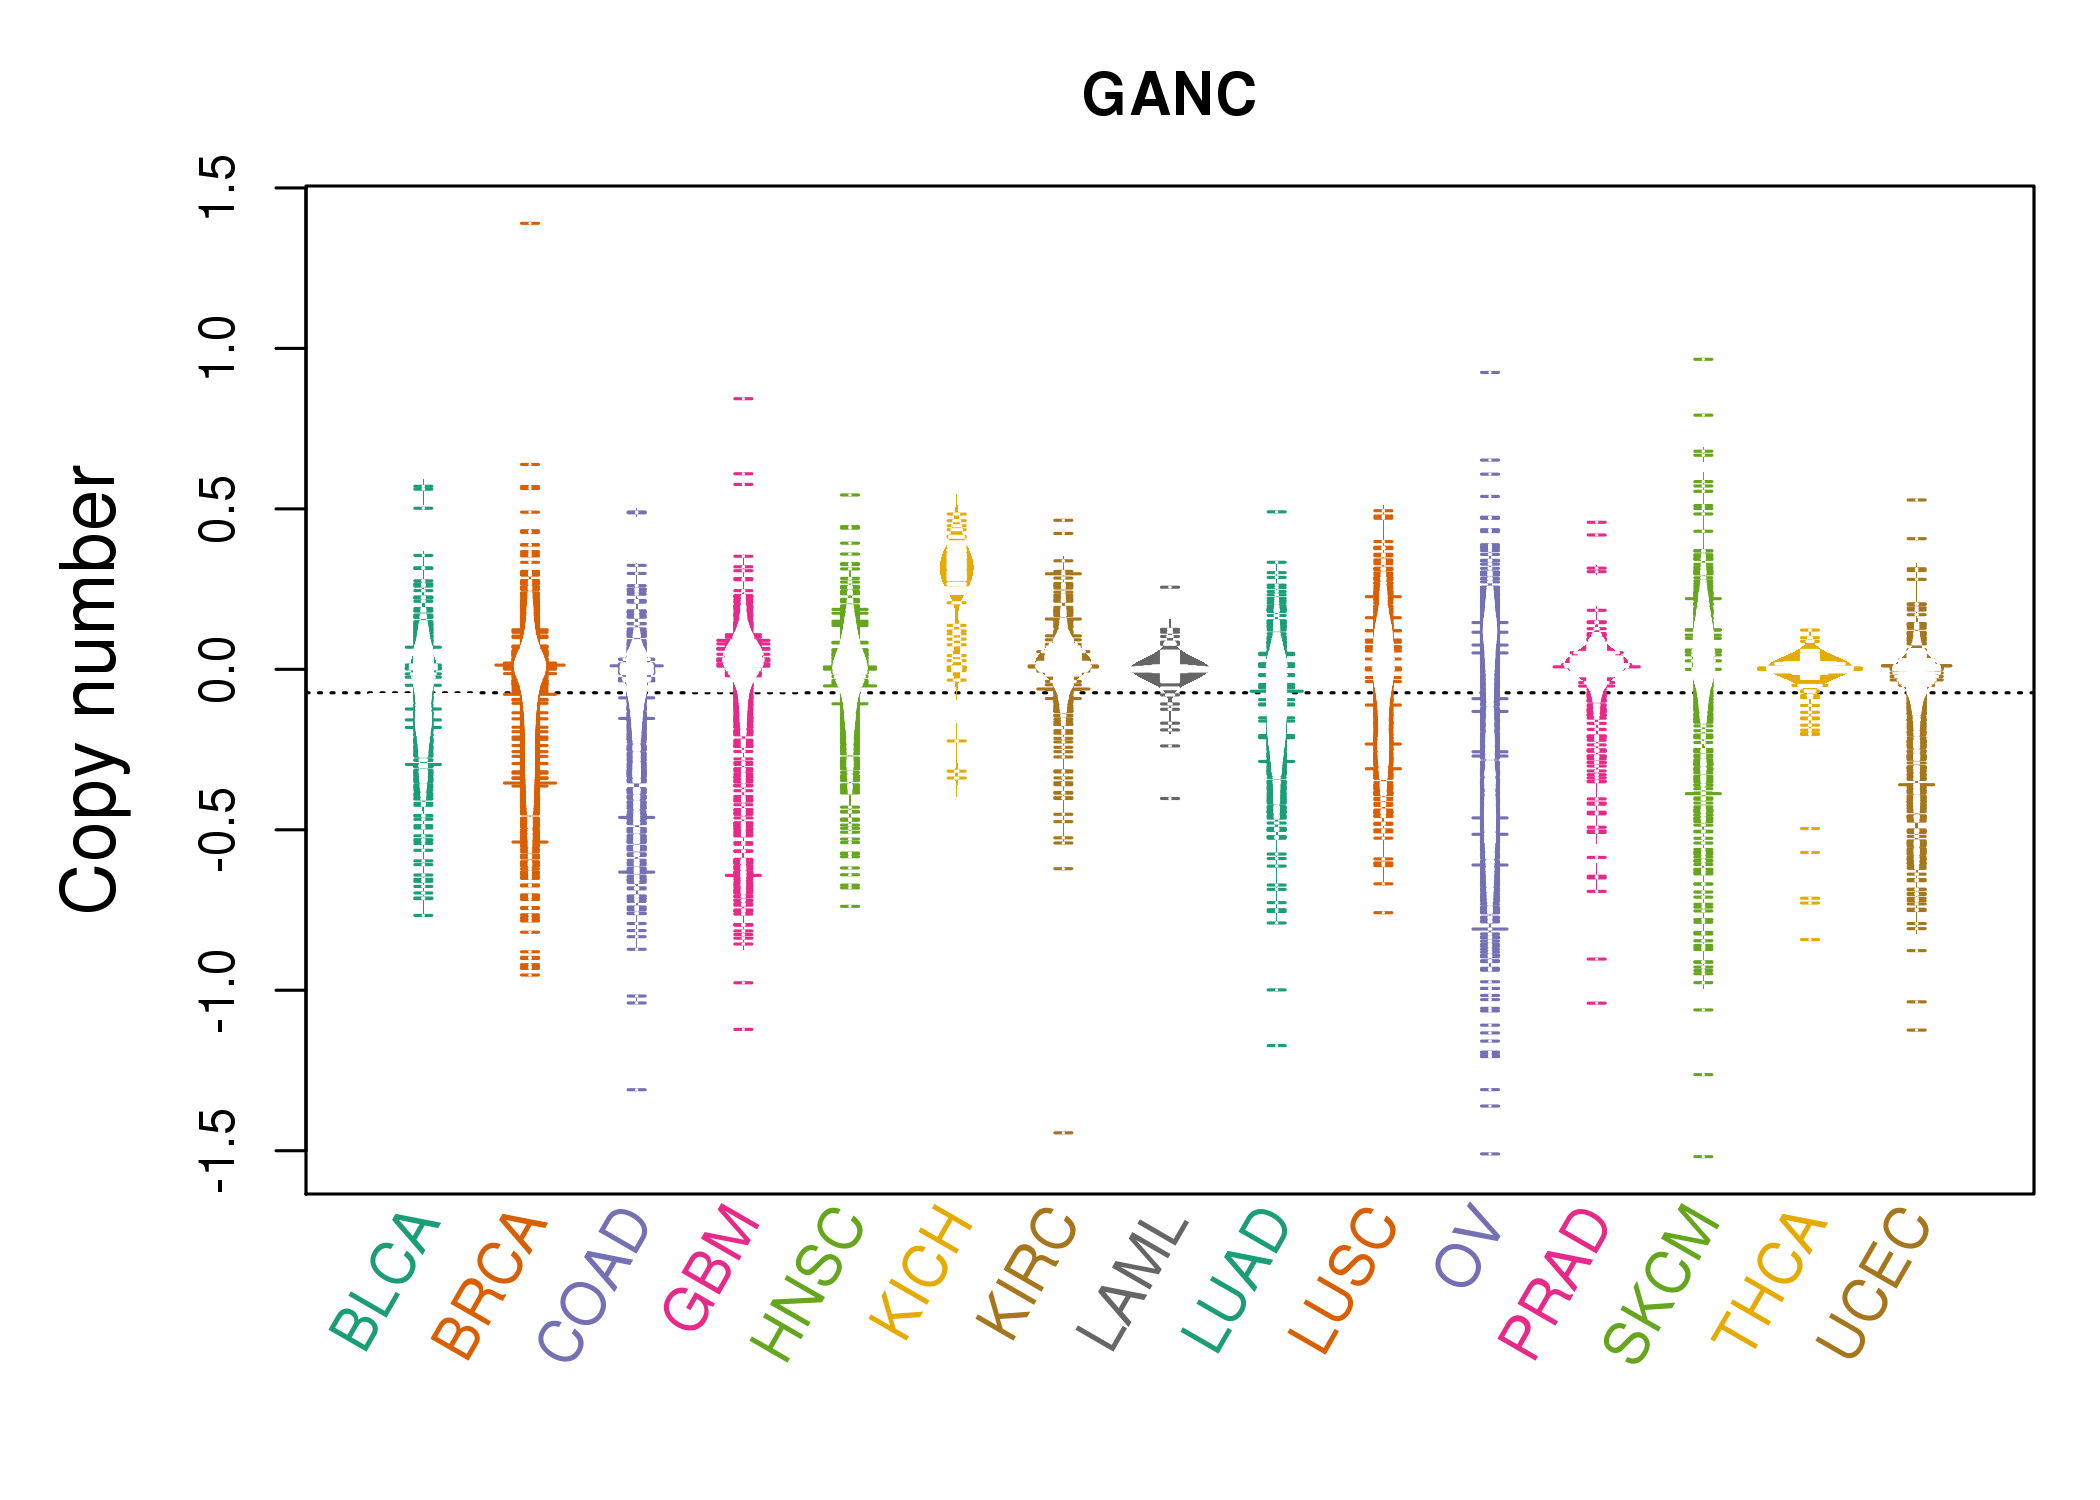 |
| cf) Tissue ID[Tissue type]: BLCA[Bladder Urothelial Carcinoma], BRCA[Breast invasive carcinoma], CESC[Cervical squamous cell carcinoma and endocervical adenocarcinoma], COAD[Colon adenocarcinoma], GBM[Glioblastoma multiforme], Glioma Low Grade, HNSC[Head and Neck squamous cell carcinoma], KICH[Kidney Chromophobe], KIRC[Kidney renal clear cell carcinoma], KIRP[Kidney renal papillary cell carcinoma], LAML[Acute Myeloid Leukemia], LUAD[Lung adenocarcinoma], LUSC[Lung squamous cell carcinoma], OV[Ovarian serous cystadenocarcinoma ], PAAD[Pancreatic adenocarcinoma], PRAD[Prostate adenocarcinoma], SKCM[Skin Cutaneous Melanoma], STAD[Stomach adenocarcinoma], THCA[Thyroid carcinoma], UCEC[Uterine Corpus Endometrial Carcinoma] |
| Top |
| Gene Expression for GANC |
| * CCLE gene expression data were extracted from CCLE_Expression_Entrez_2012-10-18.res: Gene-centric RMA-normalized mRNA expression data. |
 |
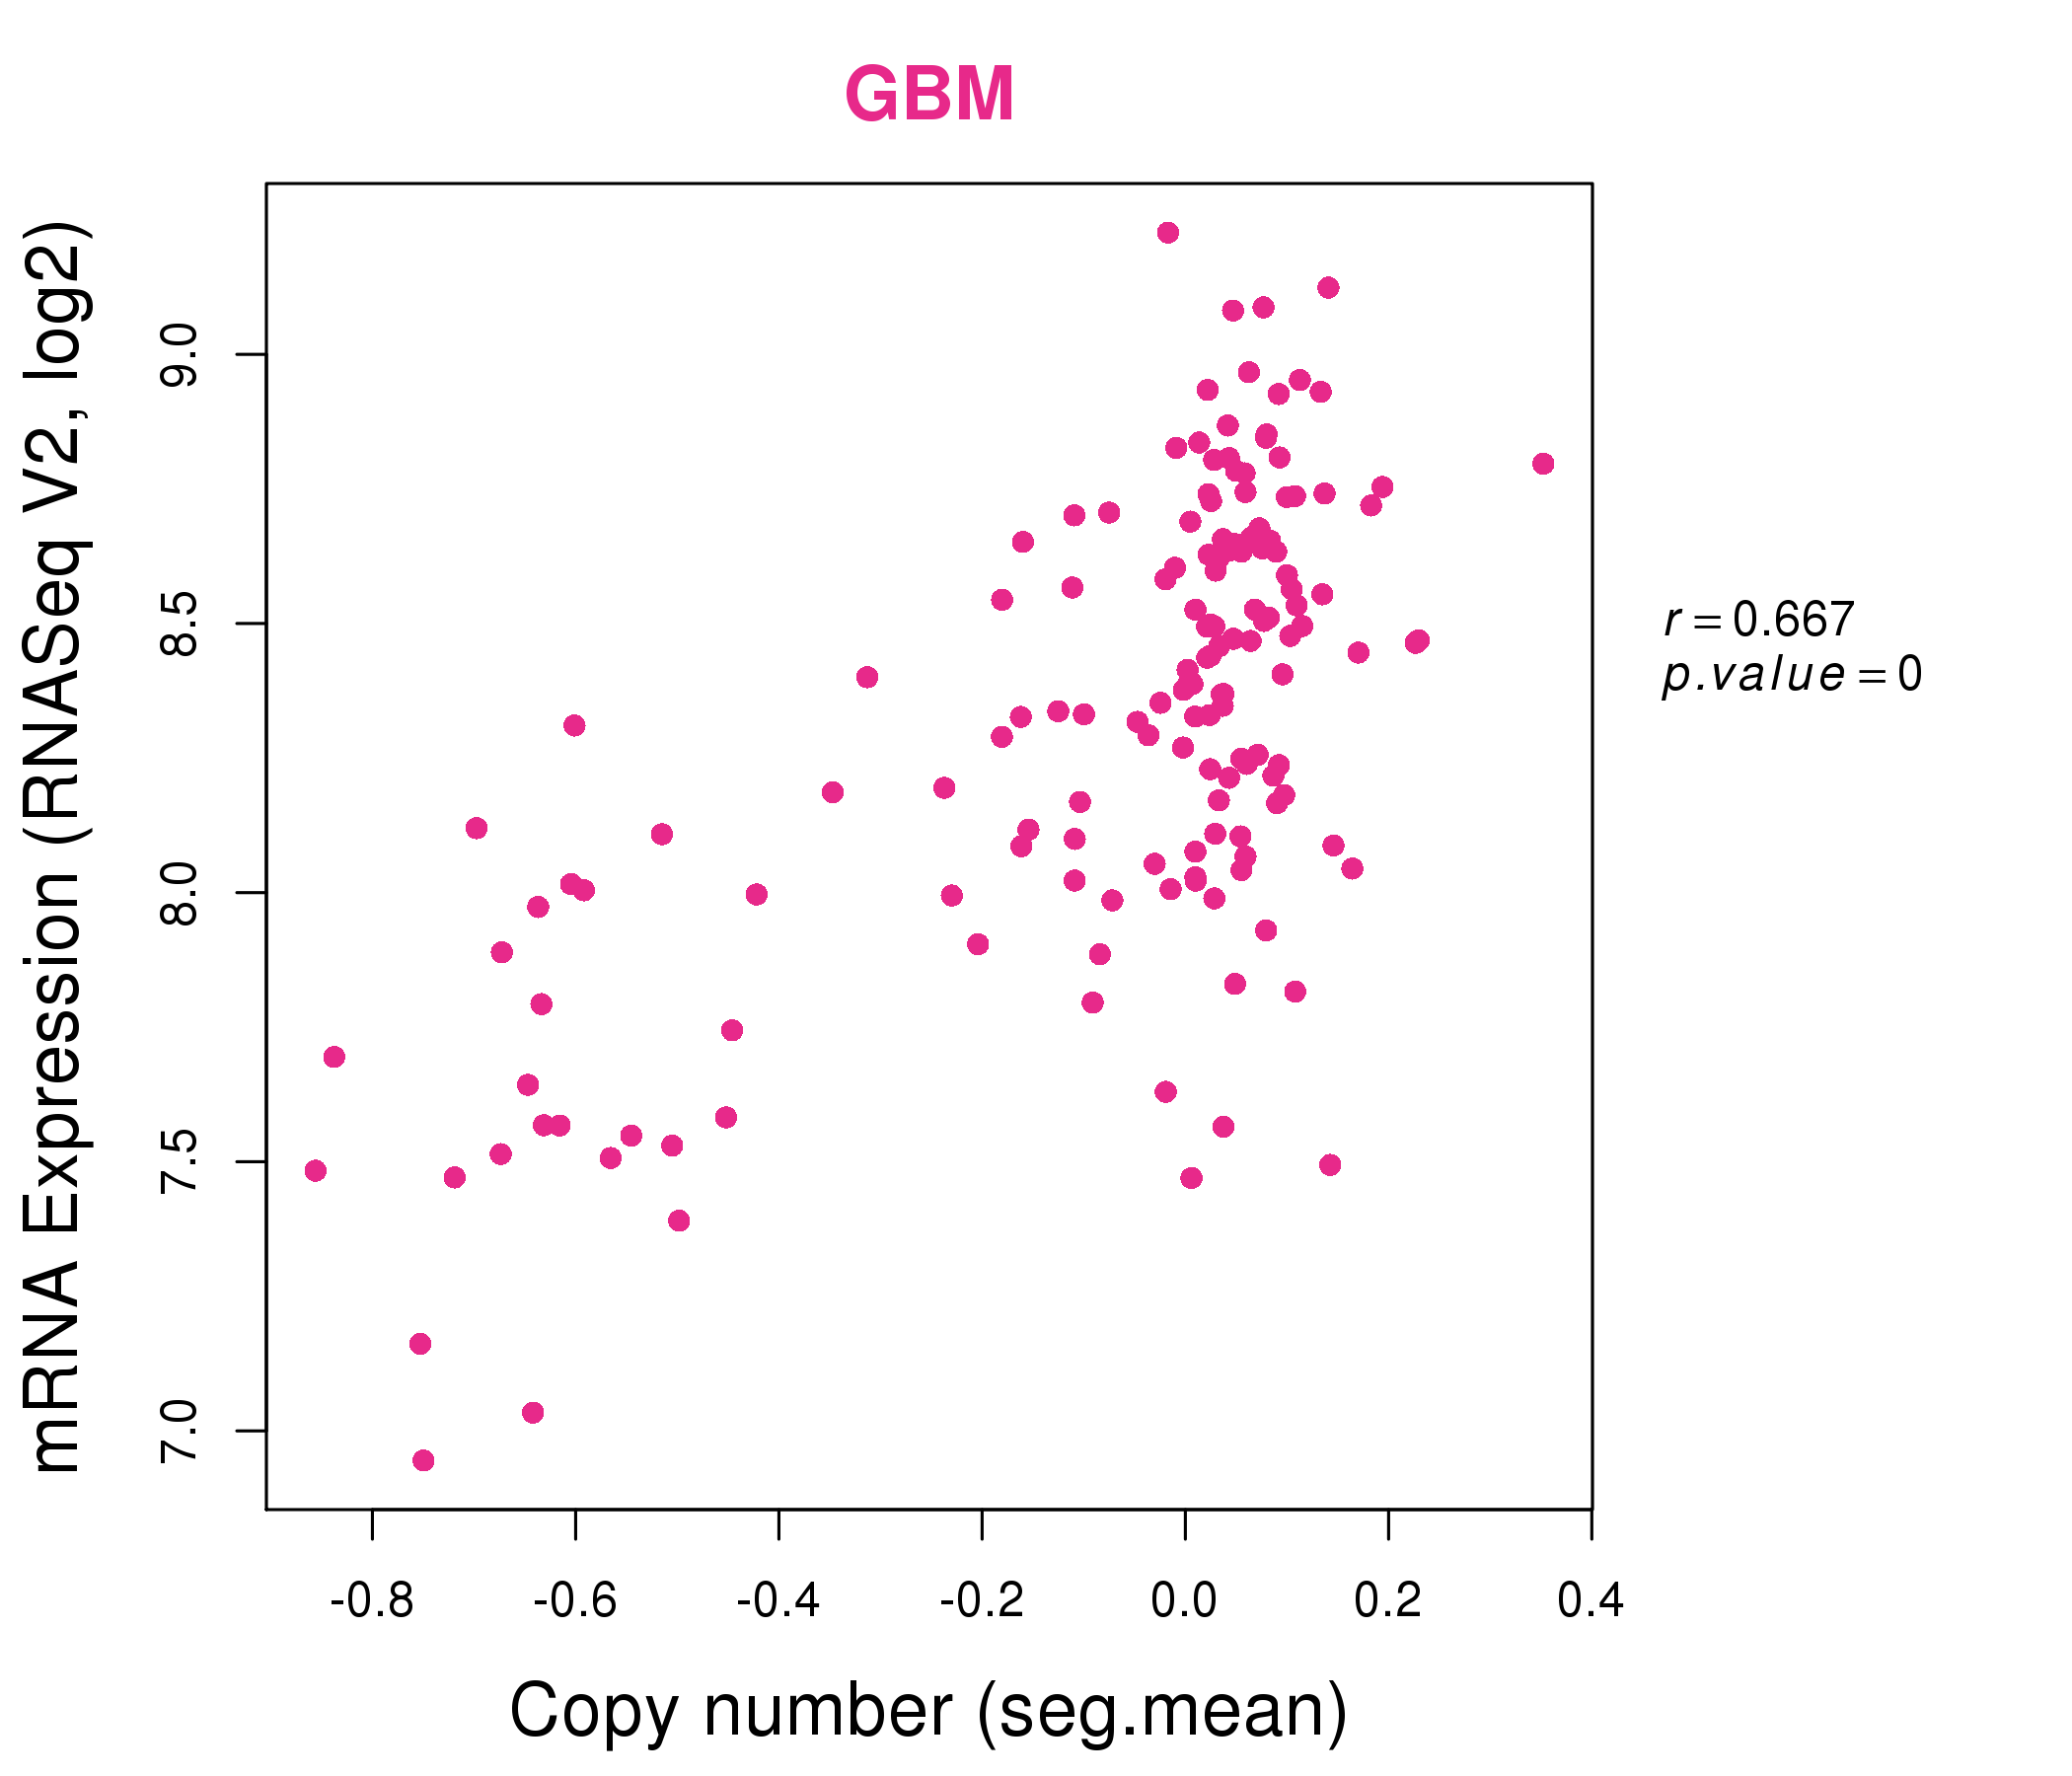
| * Normalized gene expression data of RNASeqV2 was extracted from TCGA using R package TCGA-Assembler. The URLs of all public data files on TCGA DCC data server were gathered at Jan-05-2015. Only eight cancer types have enough normal control samples for differential expression analysis. (t test, adjusted p<0.05 (using Benjamini-Hochberg FDR)) |
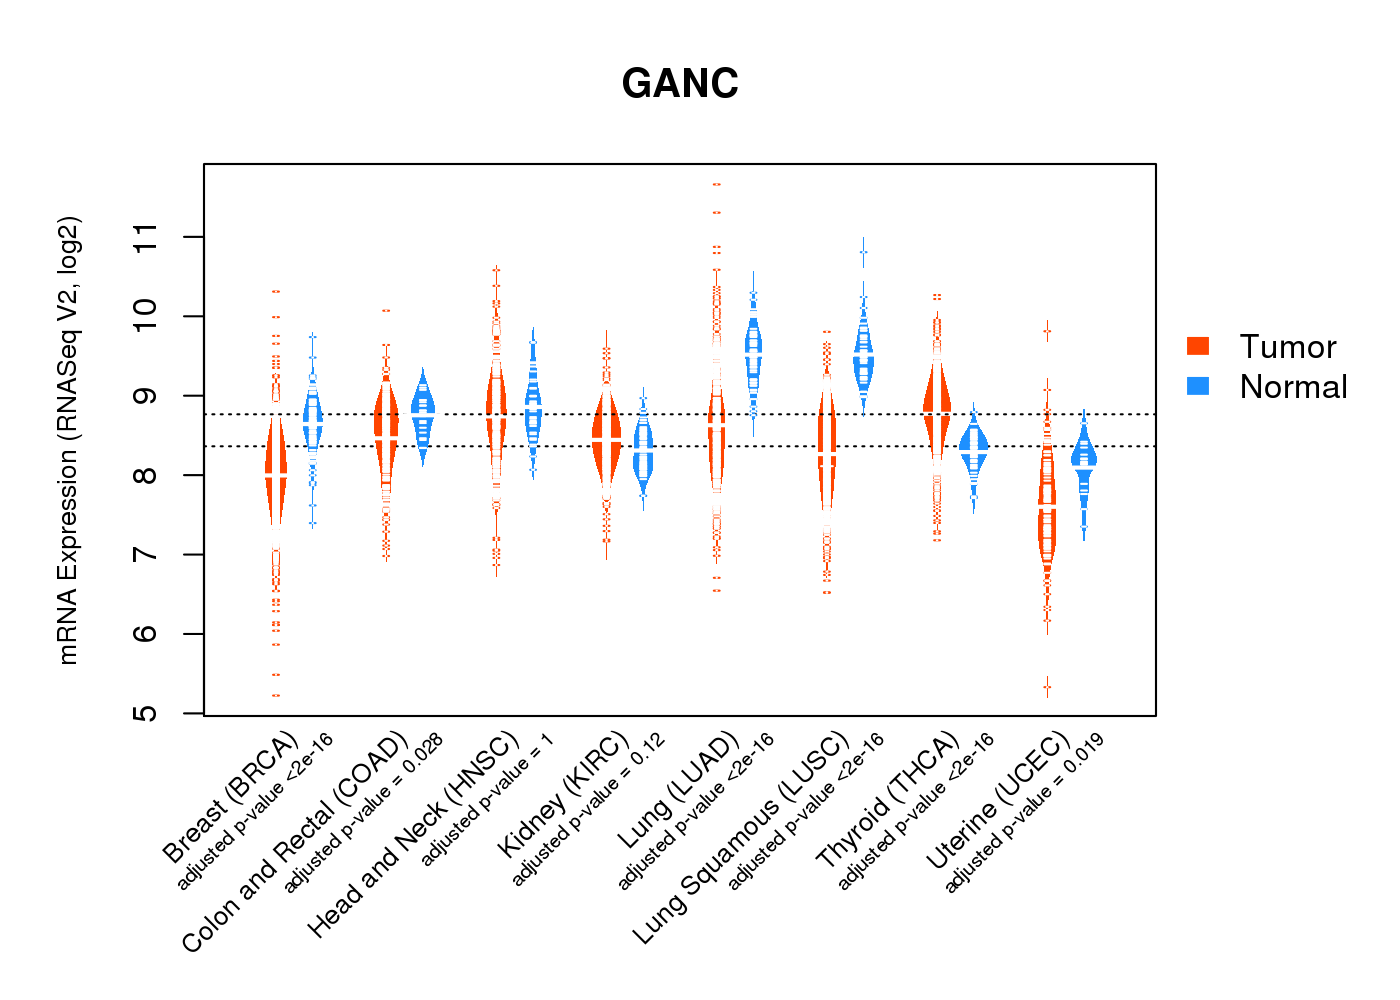 |
| Top |
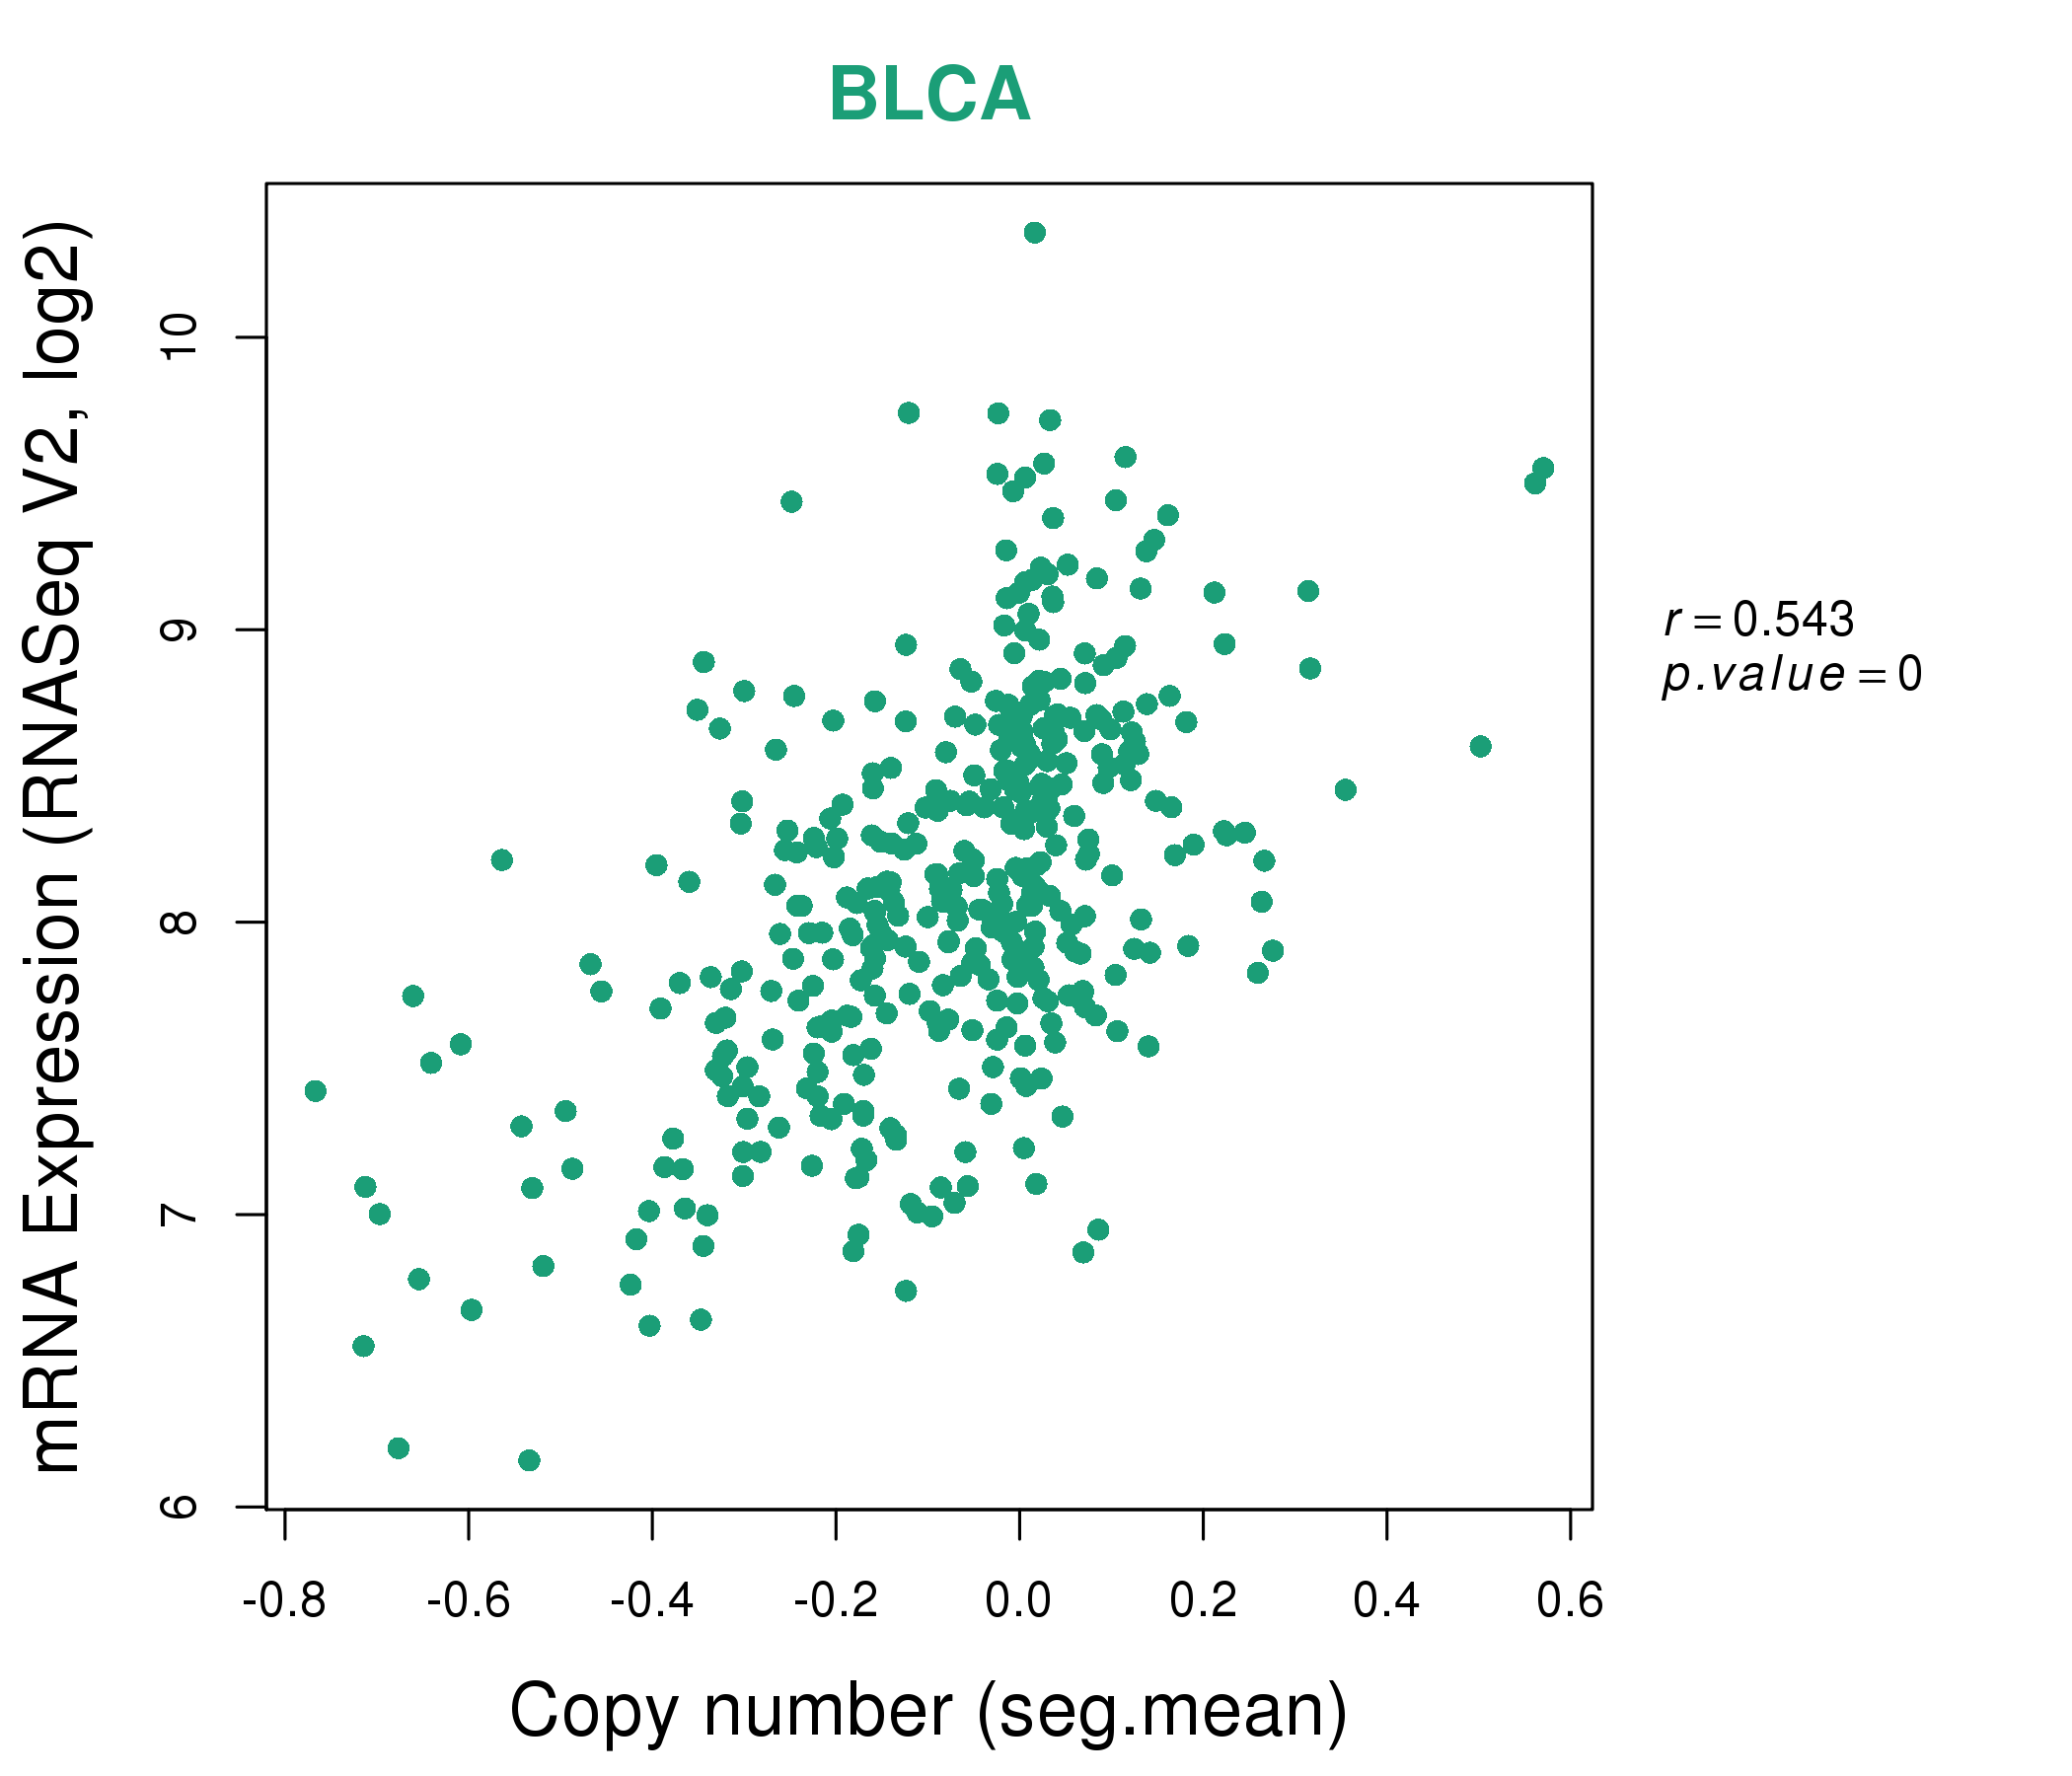
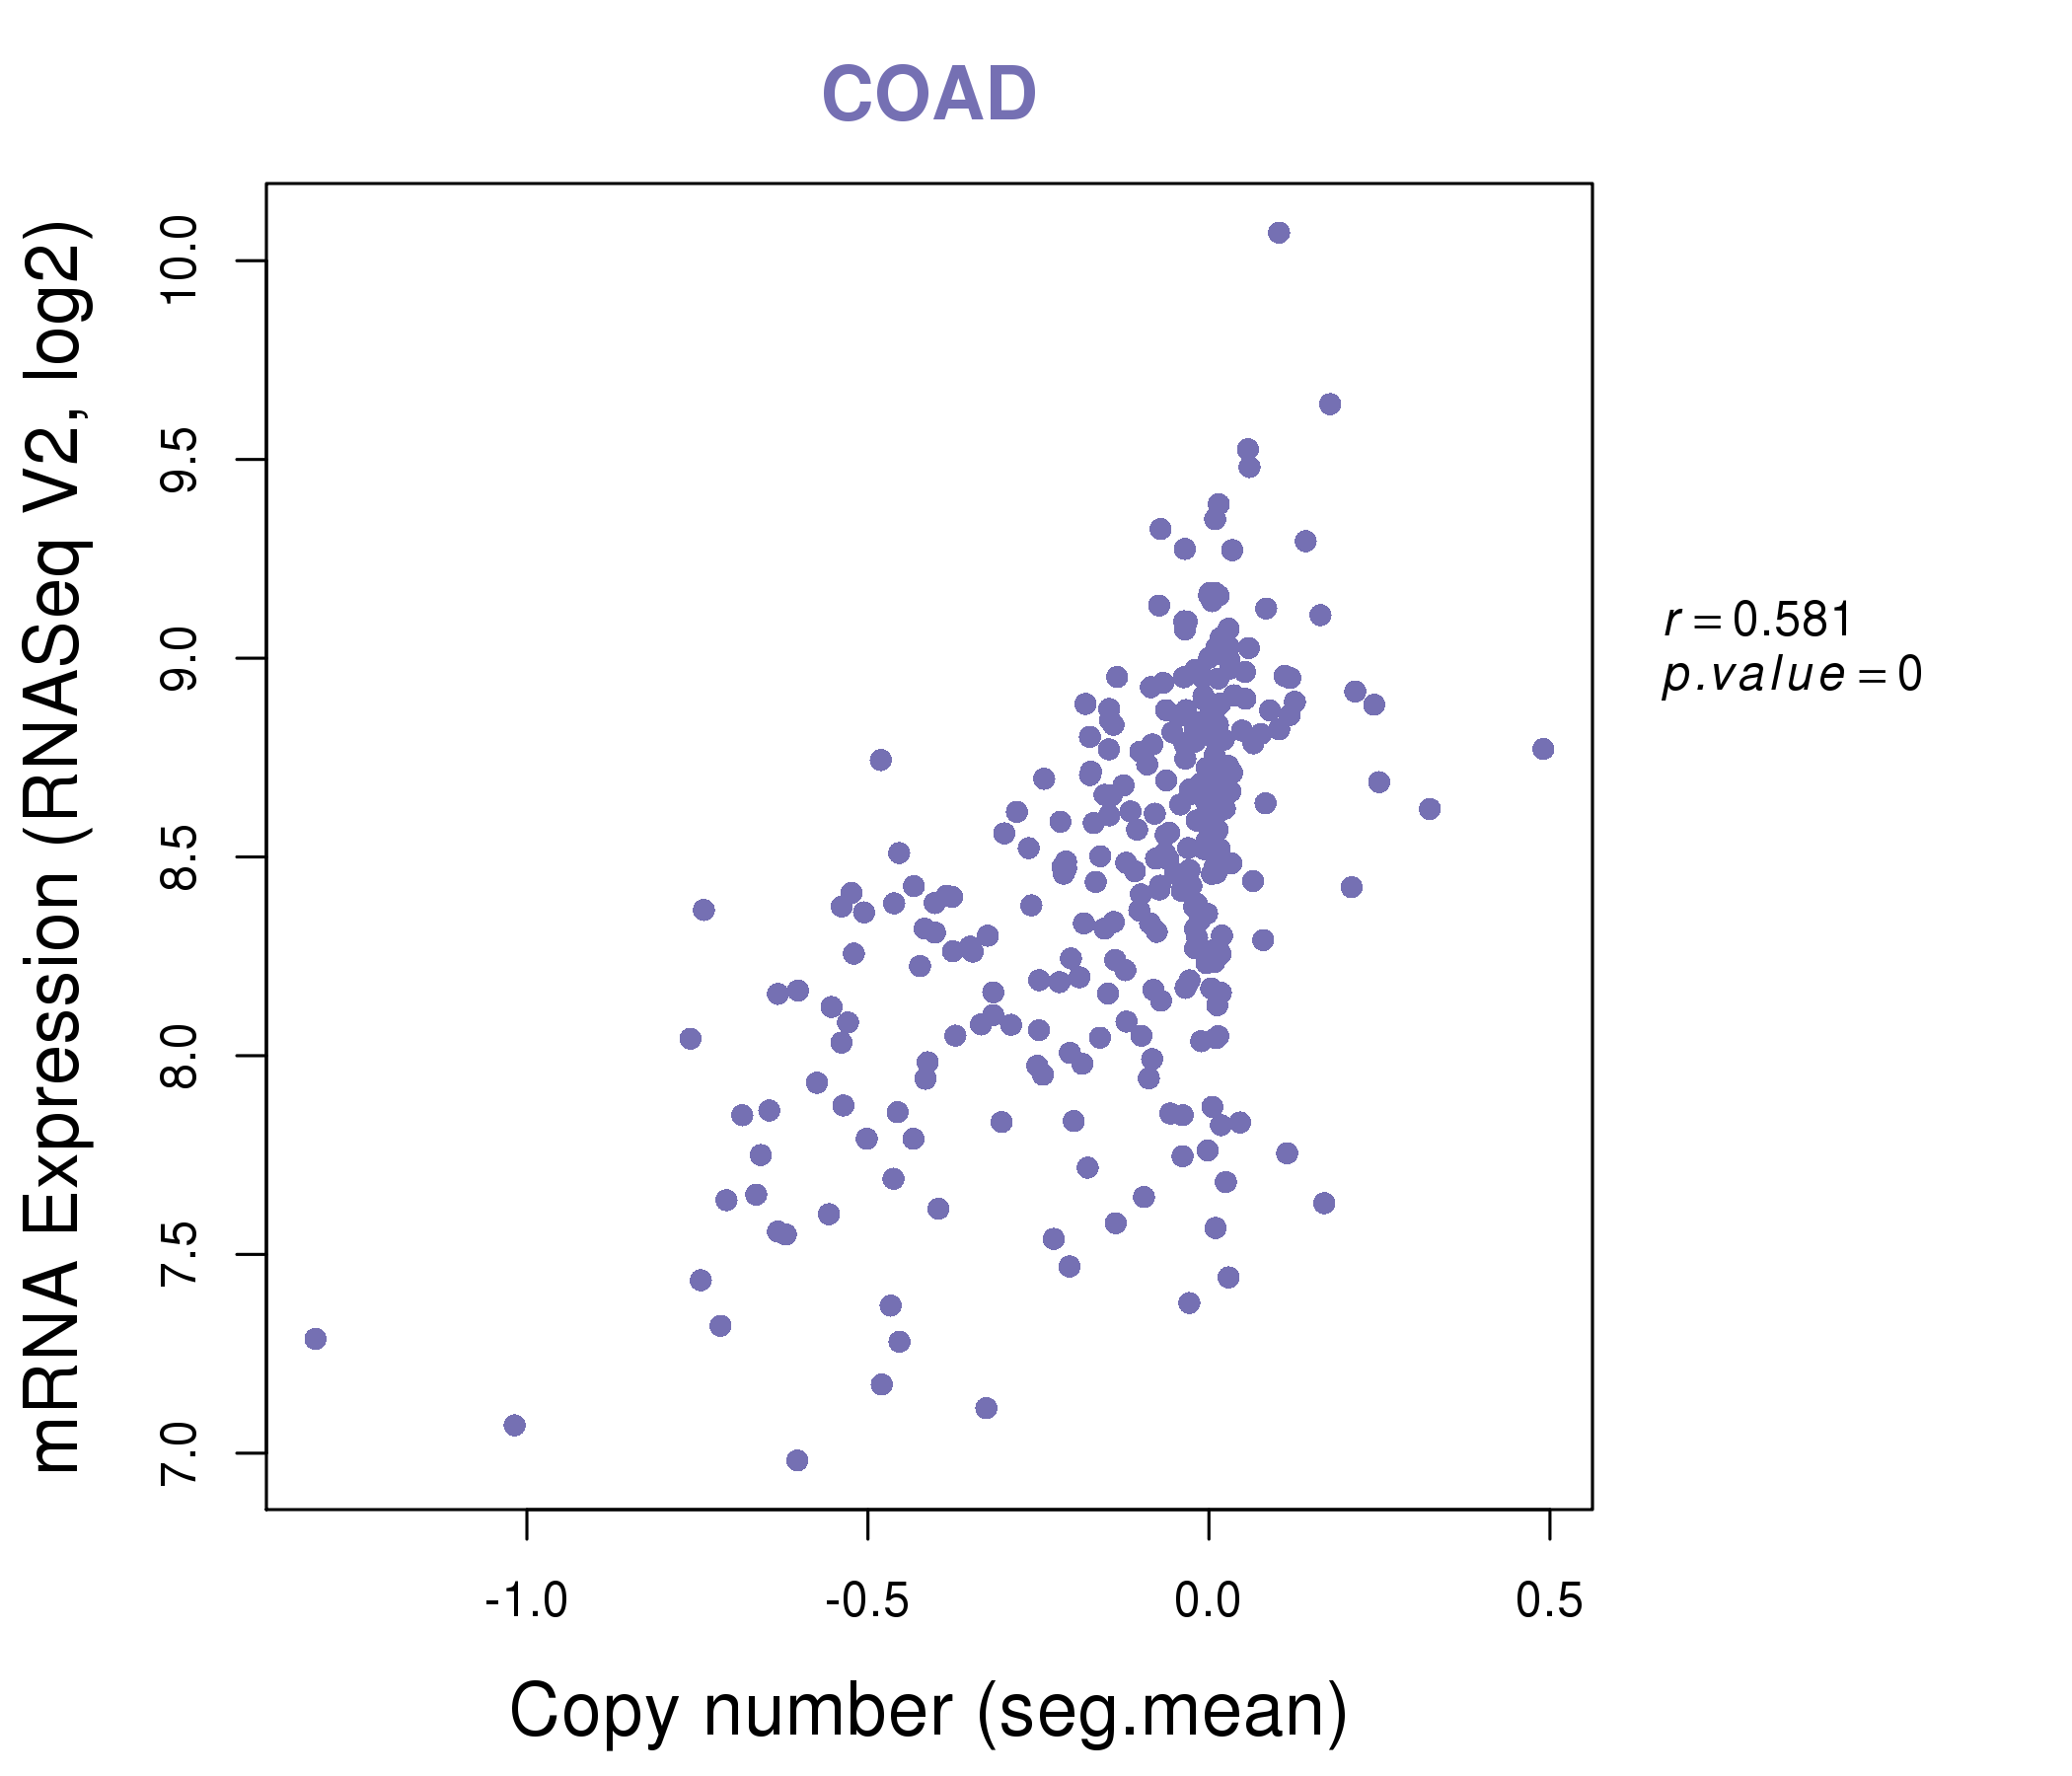
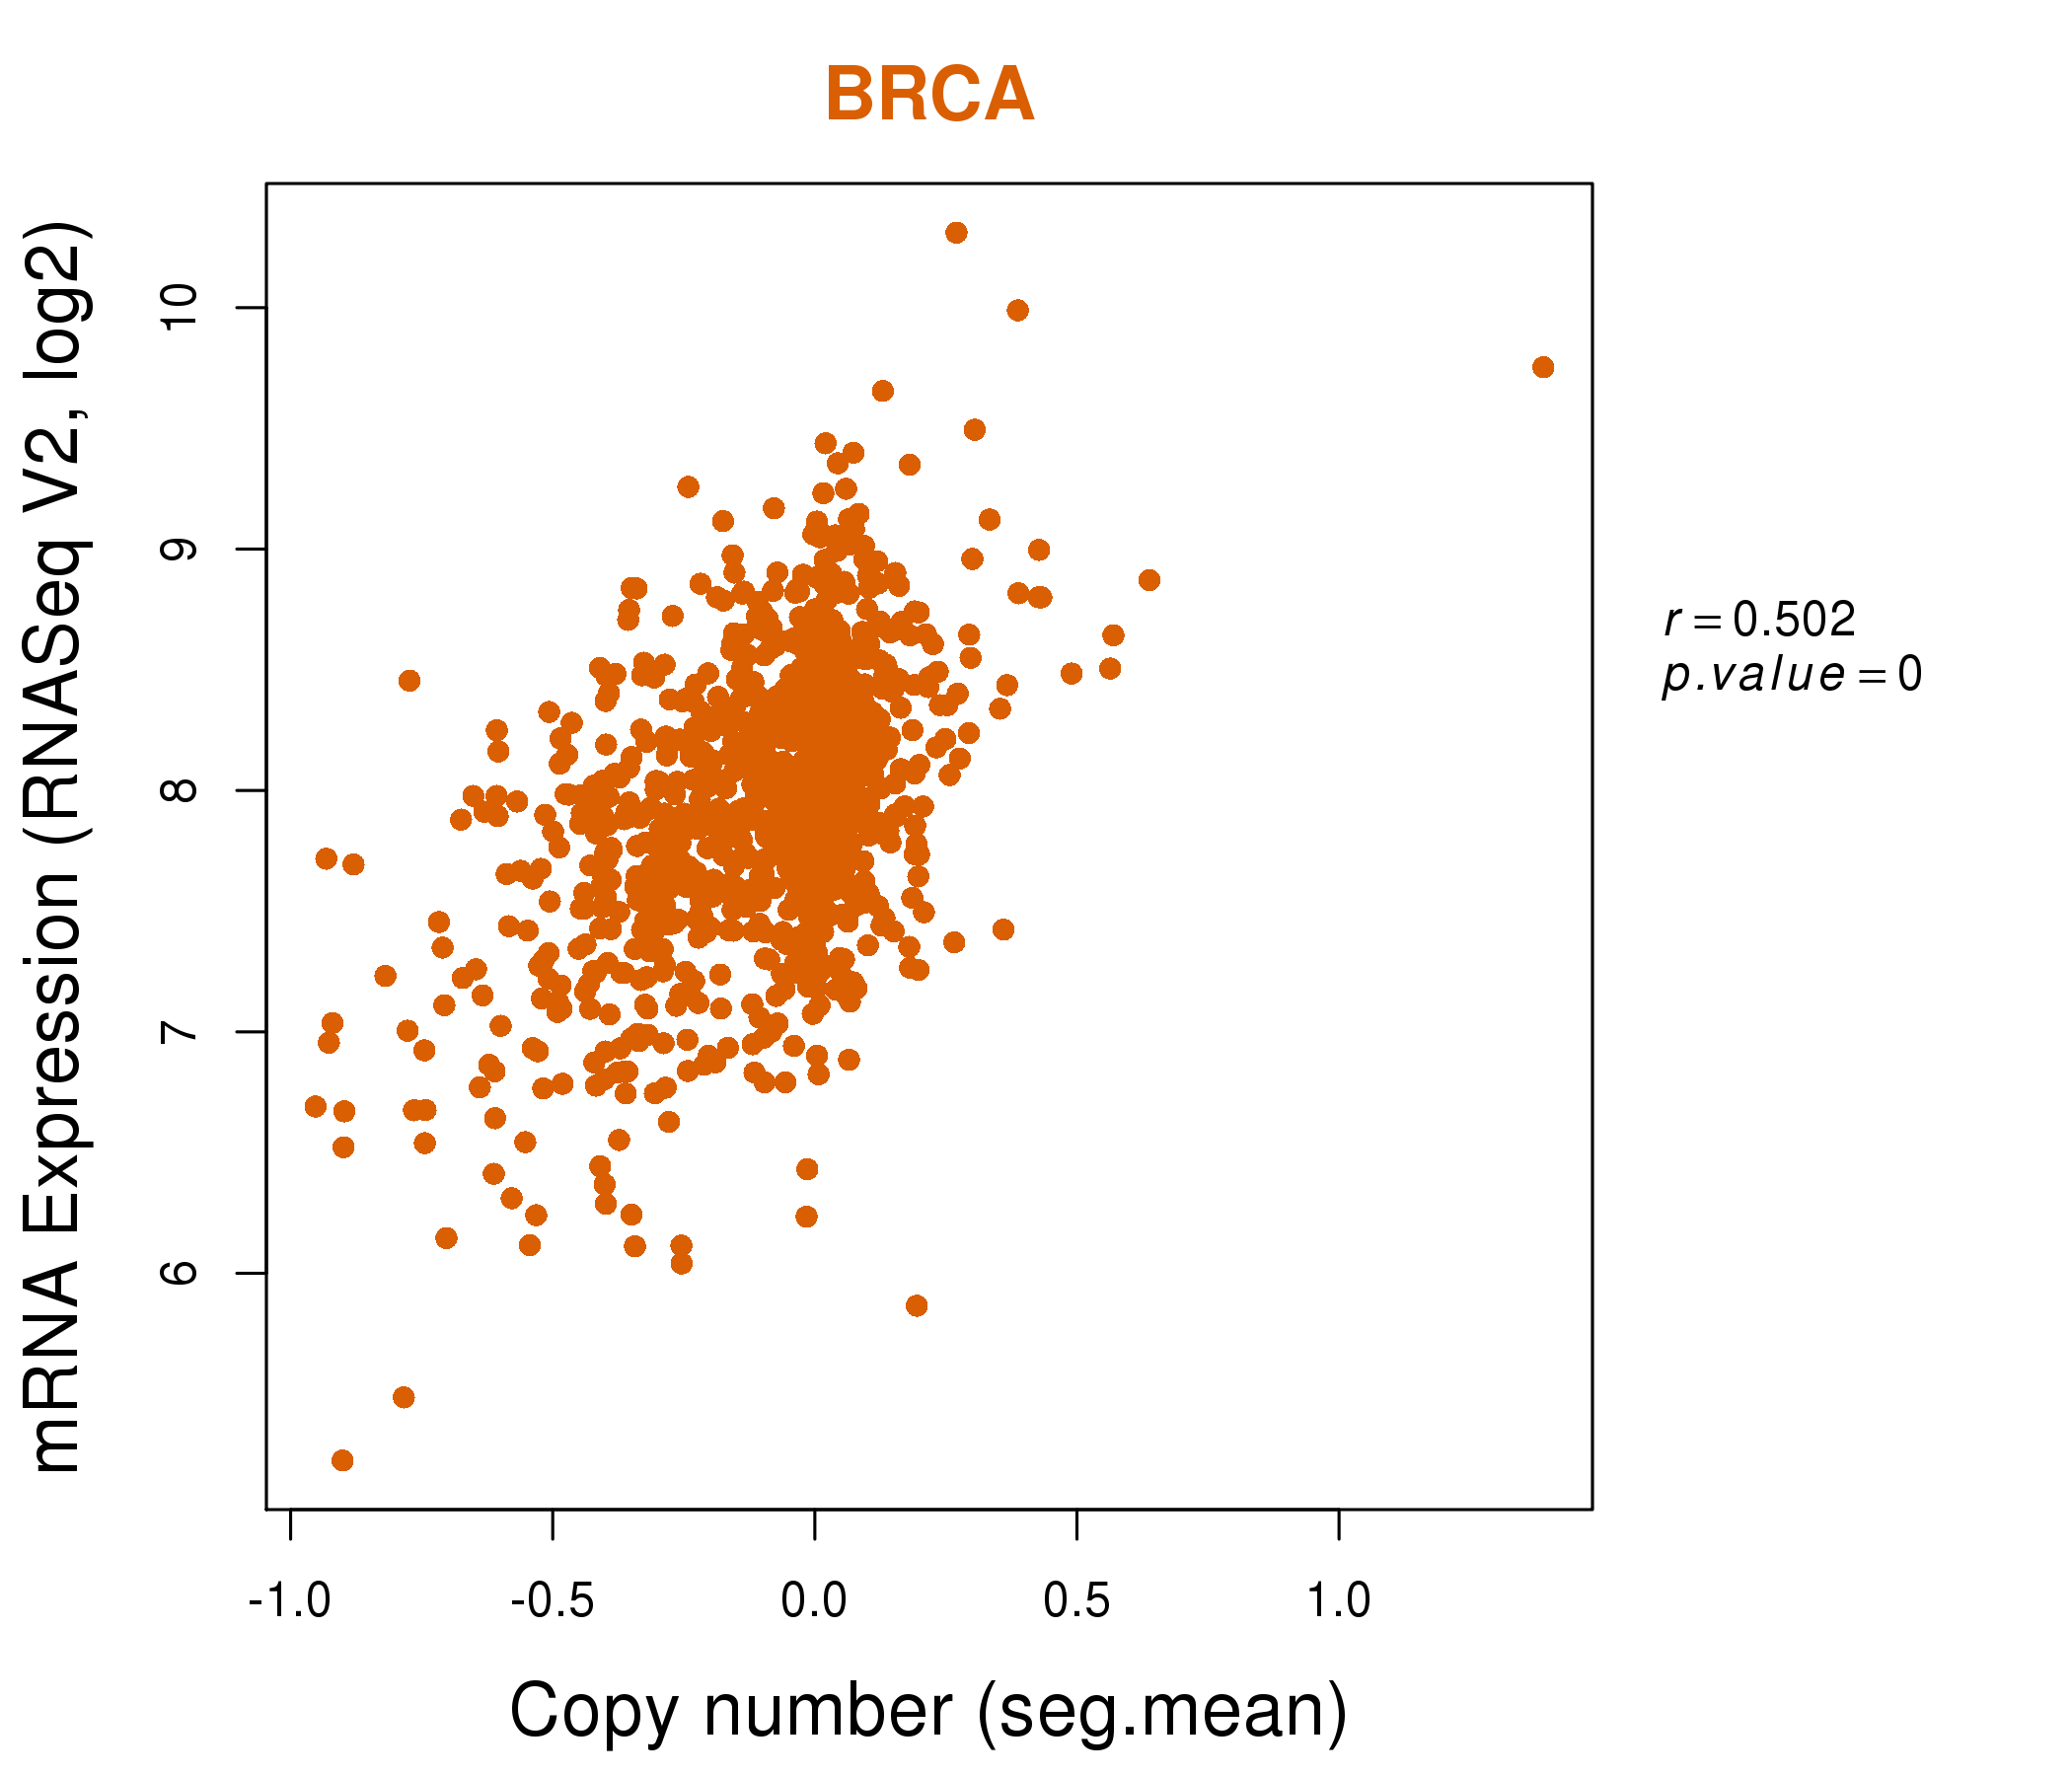
| * This plots show the correlation between CNV and gene expression. |
: Open all plots for all cancer types
 |
|
 |
|
| Top |
| Gene-Gene Network Information |
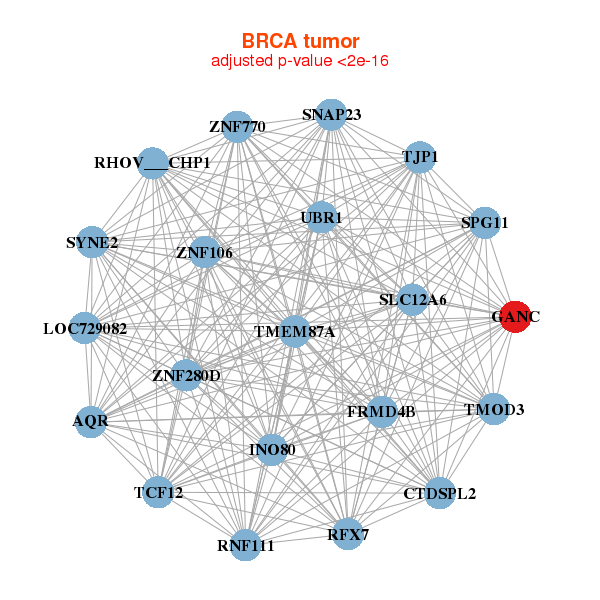
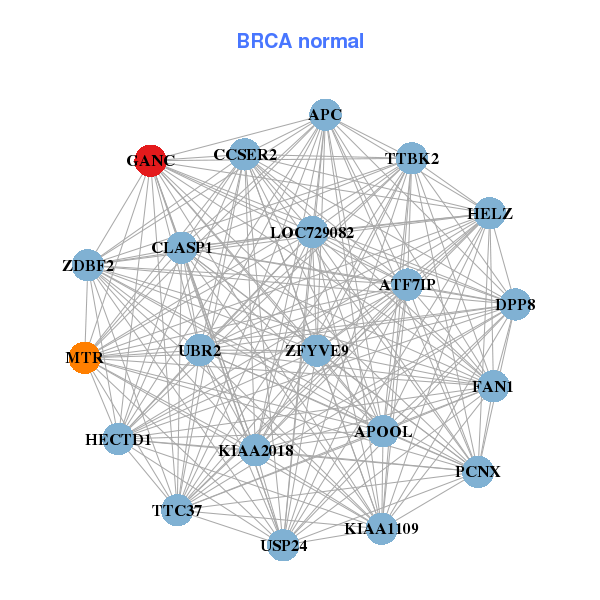
| * Co-Expression network figures were drawn using R package igraph. Only the top 20 genes with the highest correlations were shown. Red circle: input gene, orange circle: cell metabolism gene, sky circle: other gene |
: Open all plots for all cancer types
 |
|
| AQR,RHOV___CHP1,CTDSPL2,FRMD4B,GANC,INO80,LOC729082, RFX7,RNF111,SLC12A6,SNAP23,SPG11,SYNE2,TCF12, TJP1,TMEM87A,TMOD3,UBR1,ZNF106,ZNF280D,ZNF770 | APC,APOOL,ATF7IP,CLASP1,DPP8,CCSER2,GANC, HECTD1,HELZ,KIAA1109,KIAA2018,LOC729082,FAN1,MTR, PCNX,TTBK2,TTC37,UBR2,USP24,ZDBF2,ZFYVE9 |
 |
|
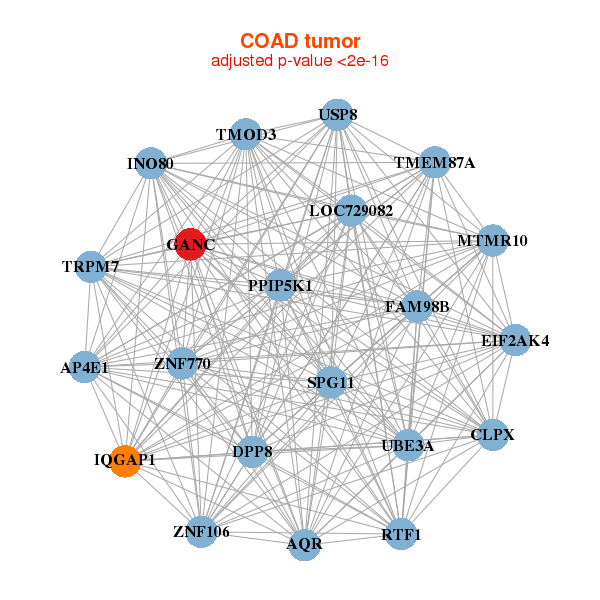
| AP4E1,AQR,CLPX,DPP8,EIF2AK4,FAM98B,GANC, INO80,IQGAP1,LOC729082,MTMR10,PPIP5K1,RTF1,SPG11, TMEM87A,TMOD3,TRPM7,UBE3A,USP8,ZNF106,ZNF770 | AIFM3,ASAP3,C1orf159,CAMK1D,CAPN3,CWH43,D2HGDH, DHTKD1,ENGASE,NXPE2,FUK,GANC,KREMEN1,MRPS5, PROM2,ARHGAP44,SH2B1,SIRT5,STEAP3,TMEM87A,ZNF808 |
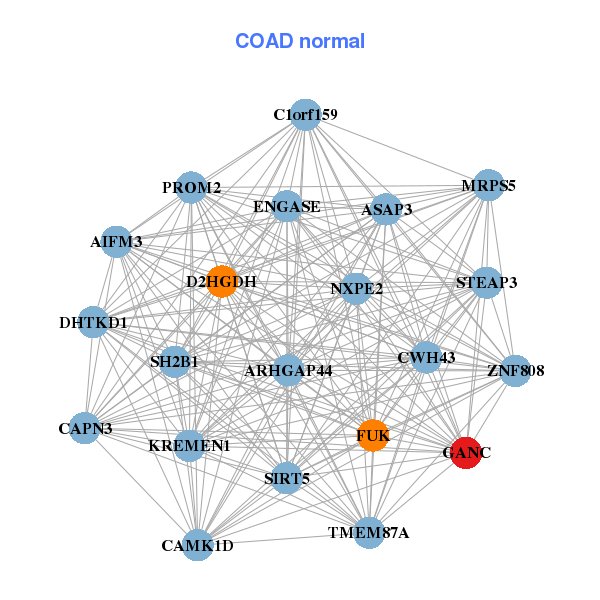
| * Co-Expression network figures were drawn using R package igraph. Only the top 20 genes with the highest correlations were shown. Red circle: input gene, orange circle: cell metabolism gene, sky circle: other gene |
: Open all plots for all cancer types
| Top |
: Open all interacting genes' information including KEGG pathway for all interacting genes from DAVID
| Top |
| Pharmacological Information for GANC |
| There's no related Drug. |
| Top |
| Cross referenced IDs for GANC |
| * We obtained these cross-references from Uniprot database. It covers 150 different DBs, 18 categories. http://www.uniprot.org/help/cross_references_section |
: Open all cross reference information
|
Copyright © 2016-Present - The Univsersity of Texas Health Science Center at Houston @ |