|
||||||||||||||||||||||||||||||||||||||||||||||||||||||||||||||||||||||||||||||||||||||||||||||||||||||||||||||||||||||||||||||||||||||||||||||||||||||||||||||||||||||||||||||||||||||||||||||||||||||||||||||||||||||||||||||||||||||||||||||||||||||||||||||||||||||||||||||||||||||||||||||||||||||||||||||||||||||||||
| |
| Phenotypic Information (metabolism pathway, cancer, disease, phenome) |
| |
| |
| Gene-Gene Network Information: Co-Expression Network, Interacting Genes & KEGG |
| |
|


| Gene Summary for GLCE |
| Basic gene info. | Gene symbol | GLCE |
| Gene name | glucuronic acid epimerase | |
| Synonyms | HSEPI | |
| Cytomap | UCSC genome browser: 15q23 | |
| Genomic location | chr15 :69452972-69564544 | |
| Type of gene | protein-coding | |
| RefGenes | NM_015554.1, | |
| Ensembl id | ENSG00000138604 | |
| Description | D-glucuronyl C5-epimeraseUDP-glucuronic acid epimeraseglucuronyl C5-epimeraseheparan sulfate C5-epimeraseheparan sulfate epimeraseheparin/heparan sulfate-glucuronic acid C5-epimeraseheparin/heparan sulfate:glucuronic acid C5-epimeraseheparosan-N-su | |
| Modification date | 20141207 | |
| dbXrefs | MIM : 612134 | |
| HGNC : HGNC | ||
| Ensembl : ENSG00000138604 | ||
| HPRD : 07020 | ||
| Vega : OTTHUMG00000172084 | ||
| Protein | UniProt: go to UniProt's Cross Reference DB Table | |
| Expression | CleanEX: HS_GLCE | |
| BioGPS: 26035 | ||
| Gene Expression Atlas: ENSG00000138604 | ||
| The Human Protein Atlas: ENSG00000138604 | ||
| Pathway | NCI Pathway Interaction Database: GLCE | |
| KEGG: GLCE | ||
| REACTOME: GLCE | ||
| ConsensusPathDB | ||
| Pathway Commons: GLCE | ||
| Metabolism | MetaCyc: GLCE | |
| HUMANCyc: GLCE | ||
| Regulation | Ensembl's Regulation: ENSG00000138604 | |
| miRBase: chr15 :69,452,972-69,564,544 | ||
| TargetScan: NM_015554 | ||
| cisRED: ENSG00000138604 | ||
| Context | iHOP: GLCE | |
| cancer metabolism search in PubMed: GLCE | ||
| UCL Cancer Institute: GLCE | ||
| Assigned class in ccmGDB | C | |
| Top |
| Phenotypic Information for GLCE(metabolism pathway, cancer, disease, phenome) |
| Cancer | CGAP: GLCE |
| Familial Cancer Database: GLCE | |
| * This gene is included in those cancer gene databases. |
|
|
|
|
|
| . | ||||||||||||||||||||||||||||||||||||||||||||||||||||||||||||||||||||||||||||||||||||||||||||||||||||||||||||||||||||||||||||||||||||||||||||||||||||||||||||||||||||||||||||||||||||||||||||||||||||||||||||||||||||||||||||||||||||||||||||||||||||||||||||||||||||||||||||||||||||||||||||||||||||||||||||||||||||
Oncogene 1 | Significant driver gene in | |||||||||||||||||||||||||||||||||||||||||||||||||||||||||||||||||||||||||||||||||||||||||||||||||||||||||||||||||||||||||||||||||||||||||||||||||||||||||||||||||||||||||||||||||||||||||||||||||||||||||||||||||||||||||||||||||||||||||||||||||||||||||||||||||||||||||||||||||||||||||||||||||||||||||||||||||||||||||
| cf) number; DB name 1 Oncogene; http://nar.oxfordjournals.org/content/35/suppl_1/D721.long, 2 Tumor Suppressor gene; https://bioinfo.uth.edu/TSGene/, 3 Cancer Gene Census; http://www.nature.com/nrc/journal/v4/n3/abs/nrc1299.html, 4 CancerGenes; http://nar.oxfordjournals.org/content/35/suppl_1/D721.long, 5 Network of Cancer Gene; http://ncg.kcl.ac.uk/index.php, 1Therapeutic Vulnerabilities in Cancer; http://cbio.mskcc.org/cancergenomics/statius/ |
| REACTOME_METABOLISM_OF_CARBOHYDRATES | |
| OMIM | |
| Orphanet | |
| Disease | KEGG Disease: GLCE |
| MedGen: GLCE (Human Medical Genetics with Condition) | |
| ClinVar: GLCE | |
| Phenotype | MGI: GLCE (International Mouse Phenotyping Consortium) |
| PhenomicDB: GLCE | |
| Mutations for GLCE |
| * Under tables are showing count per each tissue to give us broad intuition about tissue specific mutation patterns.You can go to the detailed page for each mutation database's web site. |
| - Statistics for Tissue and Mutation type | Top |
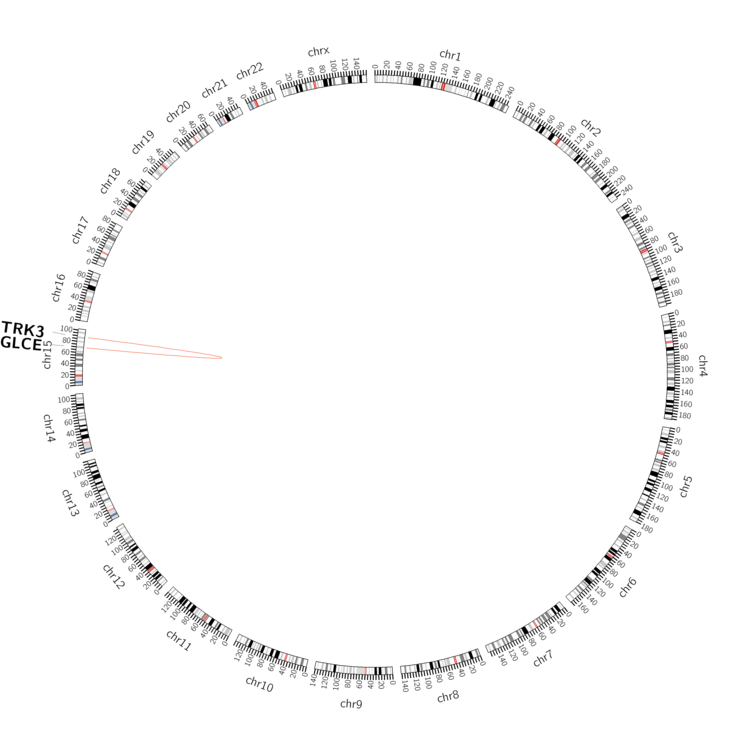 |
| - For Inter-chromosomal Variations |
| There's no inter-chromosomal structural variation. |
| - For Intra-chromosomal Variations |
| * Intra-chromosomal variantions includes 'intrachromosomal amplicon to amplicon', 'intrachromosomal amplicon to non-amplified dna', 'intrachromosomal deletion', 'intrachromosomal fold-back inversion', 'intrachromosomal inversion', 'intrachromosomal tandem duplication', 'Intrachromosomal unknown type', 'intrachromosomal with inverted orientation', 'intrachromosomal with non-inverted orientation'. |
 |
| Sample | Symbol_a | Chr_a | Start_a | End_a | Symbol_b | Chr_b | Start_b | End_b |
| NS | GLCE | chr15 | 69480132 | 69480132 | NTRK3 | chr15 | 88773166 | 88773166 |
| cf) Tissue number; Tissue name (1;Breast, 2;Central_nervous_system, 3;Haematopoietic_and_lymphoid_tissue, 4;Large_intestine, 5;Liver, 6;Lung, 7;Ovary, 8;Pancreas, 9;Prostate, 10;Skin, 11;Soft_tissue, 12;Upper_aerodigestive_tract) |
| * From mRNA Sanger sequences, Chitars2.0 arranged chimeric transcripts. This table shows GLCE related fusion information. |
| ID | Head Gene | Tail Gene | Accession | Gene_a | qStart_a | qEnd_a | Chromosome_a | tStart_a | tEnd_a | Gene_a | qStart_a | qEnd_a | Chromosome_a | tStart_a | tEnd_a |
| Top |
| Mutation type/ Tissue ID | brca | cns | cerv | endome | haematopo | kidn | Lintest | liver | lung | ns | ovary | pancre | prost | skin | stoma | thyro | urina | |||
| Total # sample | 1 | 1 | 1 | |||||||||||||||||
| GAIN (# sample) | 1 | 1 | 1 | |||||||||||||||||
| LOSS (# sample) |
| cf) Tissue ID; Tissue type (1; Breast, 2; Central_nervous_system, 3; Cervix, 4; Endometrium, 5; Haematopoietic_and_lymphoid_tissue, 6; Kidney, 7; Large_intestine, 8; Liver, 9; Lung, 10; NS, 11; Ovary, 12; Pancreas, 13; Prostate, 14; Skin, 15; Stomach, 16; Thyroid, 17; Urinary_tract) |
| Top |
|
 |
| Top |
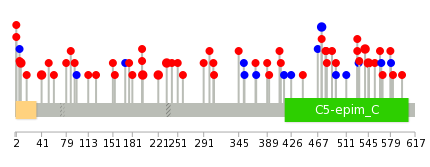
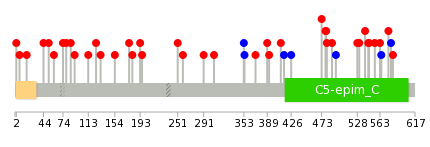
| Stat. for Non-Synonymous SNVs (# total SNVs=44) | (# total SNVs=9) |
 |  |
(# total SNVs=1) | (# total SNVs=0) |
 |
| Top |
| * When you move the cursor on each content, you can see more deailed mutation information on the Tooltip. Those are primary_site,primary_histology,mutation(aa),pubmedID. |
| GRCh37 position | Mutation(aa) | Unique sampleID count |
| chr15:69548164-69548164 | p.R7R | 2 |
| chr15:69553539-69553539 | p.E234K | 2 |
| chr15:69548171-69548171 | p.N9S | 2 |
| chr15:69561148-69561148 | p.A473A | 2 |
| chr15:69548267-69548267 | p.R41Q | 2 |
| chr15:69561347-69561347 | p.R540C | 2 |
| chr15:69561363-69561363 | p.L545P | 2 |
| chr15:69553428-69553428 | p.V197M | 2 |
| chr15:69553500-69553500 | p.H221Y | 2 |
| chr15:69560791-69560791 | p.L354L | 1 |
| Top |
|
 |
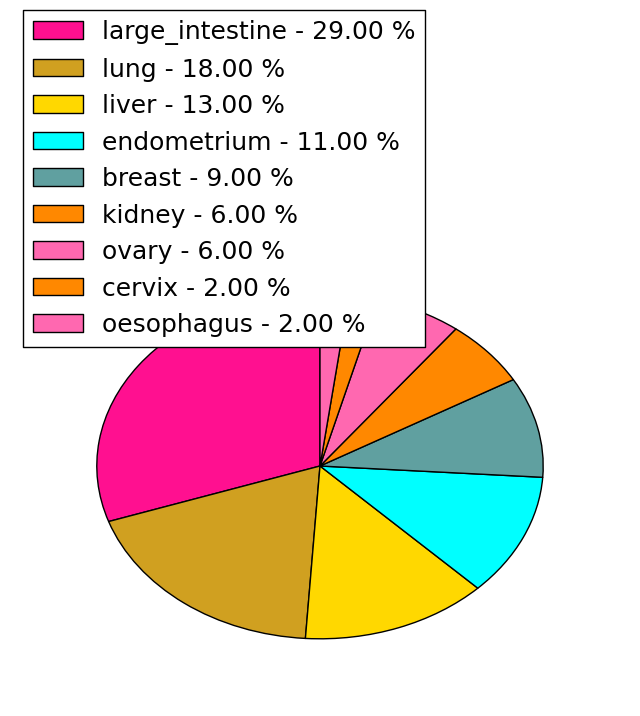
| Point Mutation/ Tissue ID | 1 | 2 | 3 | 4 | 5 | 6 | 7 | 8 | 9 | 10 | 11 | 12 | 13 | 14 | 15 | 16 | 17 | 18 | 19 | 20 |
| # sample | 2 | 3 | 1 | 7 | 1 | 3 | 4 | 3 | 9 | 3 | 1 | 5 | ||||||||
| # mutation | 3 | 3 | 1 | 9 | 1 | 3 | 5 | 3 | 9 | 3 | 1 | 6 | ||||||||
| nonsynonymous SNV | 2 | 3 | 1 | 8 | 1 | 3 | 5 | 2 | 7 | 3 | 5 | |||||||||
| synonymous SNV | 1 | 1 | 1 | 2 | 1 | 1 |
| cf) Tissue ID; Tissue type (1; BLCA[Bladder Urothelial Carcinoma], 2; BRCA[Breast invasive carcinoma], 3; CESC[Cervical squamous cell carcinoma and endocervical adenocarcinoma], 4; COAD[Colon adenocarcinoma], 5; GBM[Glioblastoma multiforme], 6; Glioma Low Grade, 7; HNSC[Head and Neck squamous cell carcinoma], 8; KICH[Kidney Chromophobe], 9; KIRC[Kidney renal clear cell carcinoma], 10; KIRP[Kidney renal papillary cell carcinoma], 11; LAML[Acute Myeloid Leukemia], 12; LUAD[Lung adenocarcinoma], 13; LUSC[Lung squamous cell carcinoma], 14; OV[Ovarian serous cystadenocarcinoma ], 15; PAAD[Pancreatic adenocarcinoma], 16; PRAD[Prostate adenocarcinoma], 17; SKCM[Skin Cutaneous Melanoma], 18:STAD[Stomach adenocarcinoma], 19:THCA[Thyroid carcinoma], 20:UCEC[Uterine Corpus Endometrial Carcinoma]) |
| Top |
| * We represented just top 10 SNVs. When you move the cursor on each content, you can see more deailed mutation information on the Tooltip. Those are primary_site, primary_histology, mutation(aa), pubmedID. |
| Genomic Position | Mutation(aa) | Unique sampleID count |
| chr15:69548197 | p.F154L | 1 |
| chr15:69561195 | p.V426V | 1 |
| chr15:69548607 | p.T580T | 1 |
| chr15:69561469 | p.S176Y | 1 |
| chr15:69560841 | p.A473V | 1 |
| chr15:69548276 | p.I583M | 1 |
| chr15:69561214 | p.N181S | 1 |
| chr15:69548672 | p.F479V | 1 |
| chr15:69561478 | p.R2C | 1 |
| chr15:69560895 | p.G193W | 1 |
| * Copy number data were extracted from TCGA using R package TCGA-Assembler. The URLs of all public data files on TCGA DCC data server were gathered on Jan-05-2015. Function ProcessCNAData in TCGA-Assembler package was used to obtain gene-level copy number value which is calculated as the average copy number of the genomic region of a gene. |
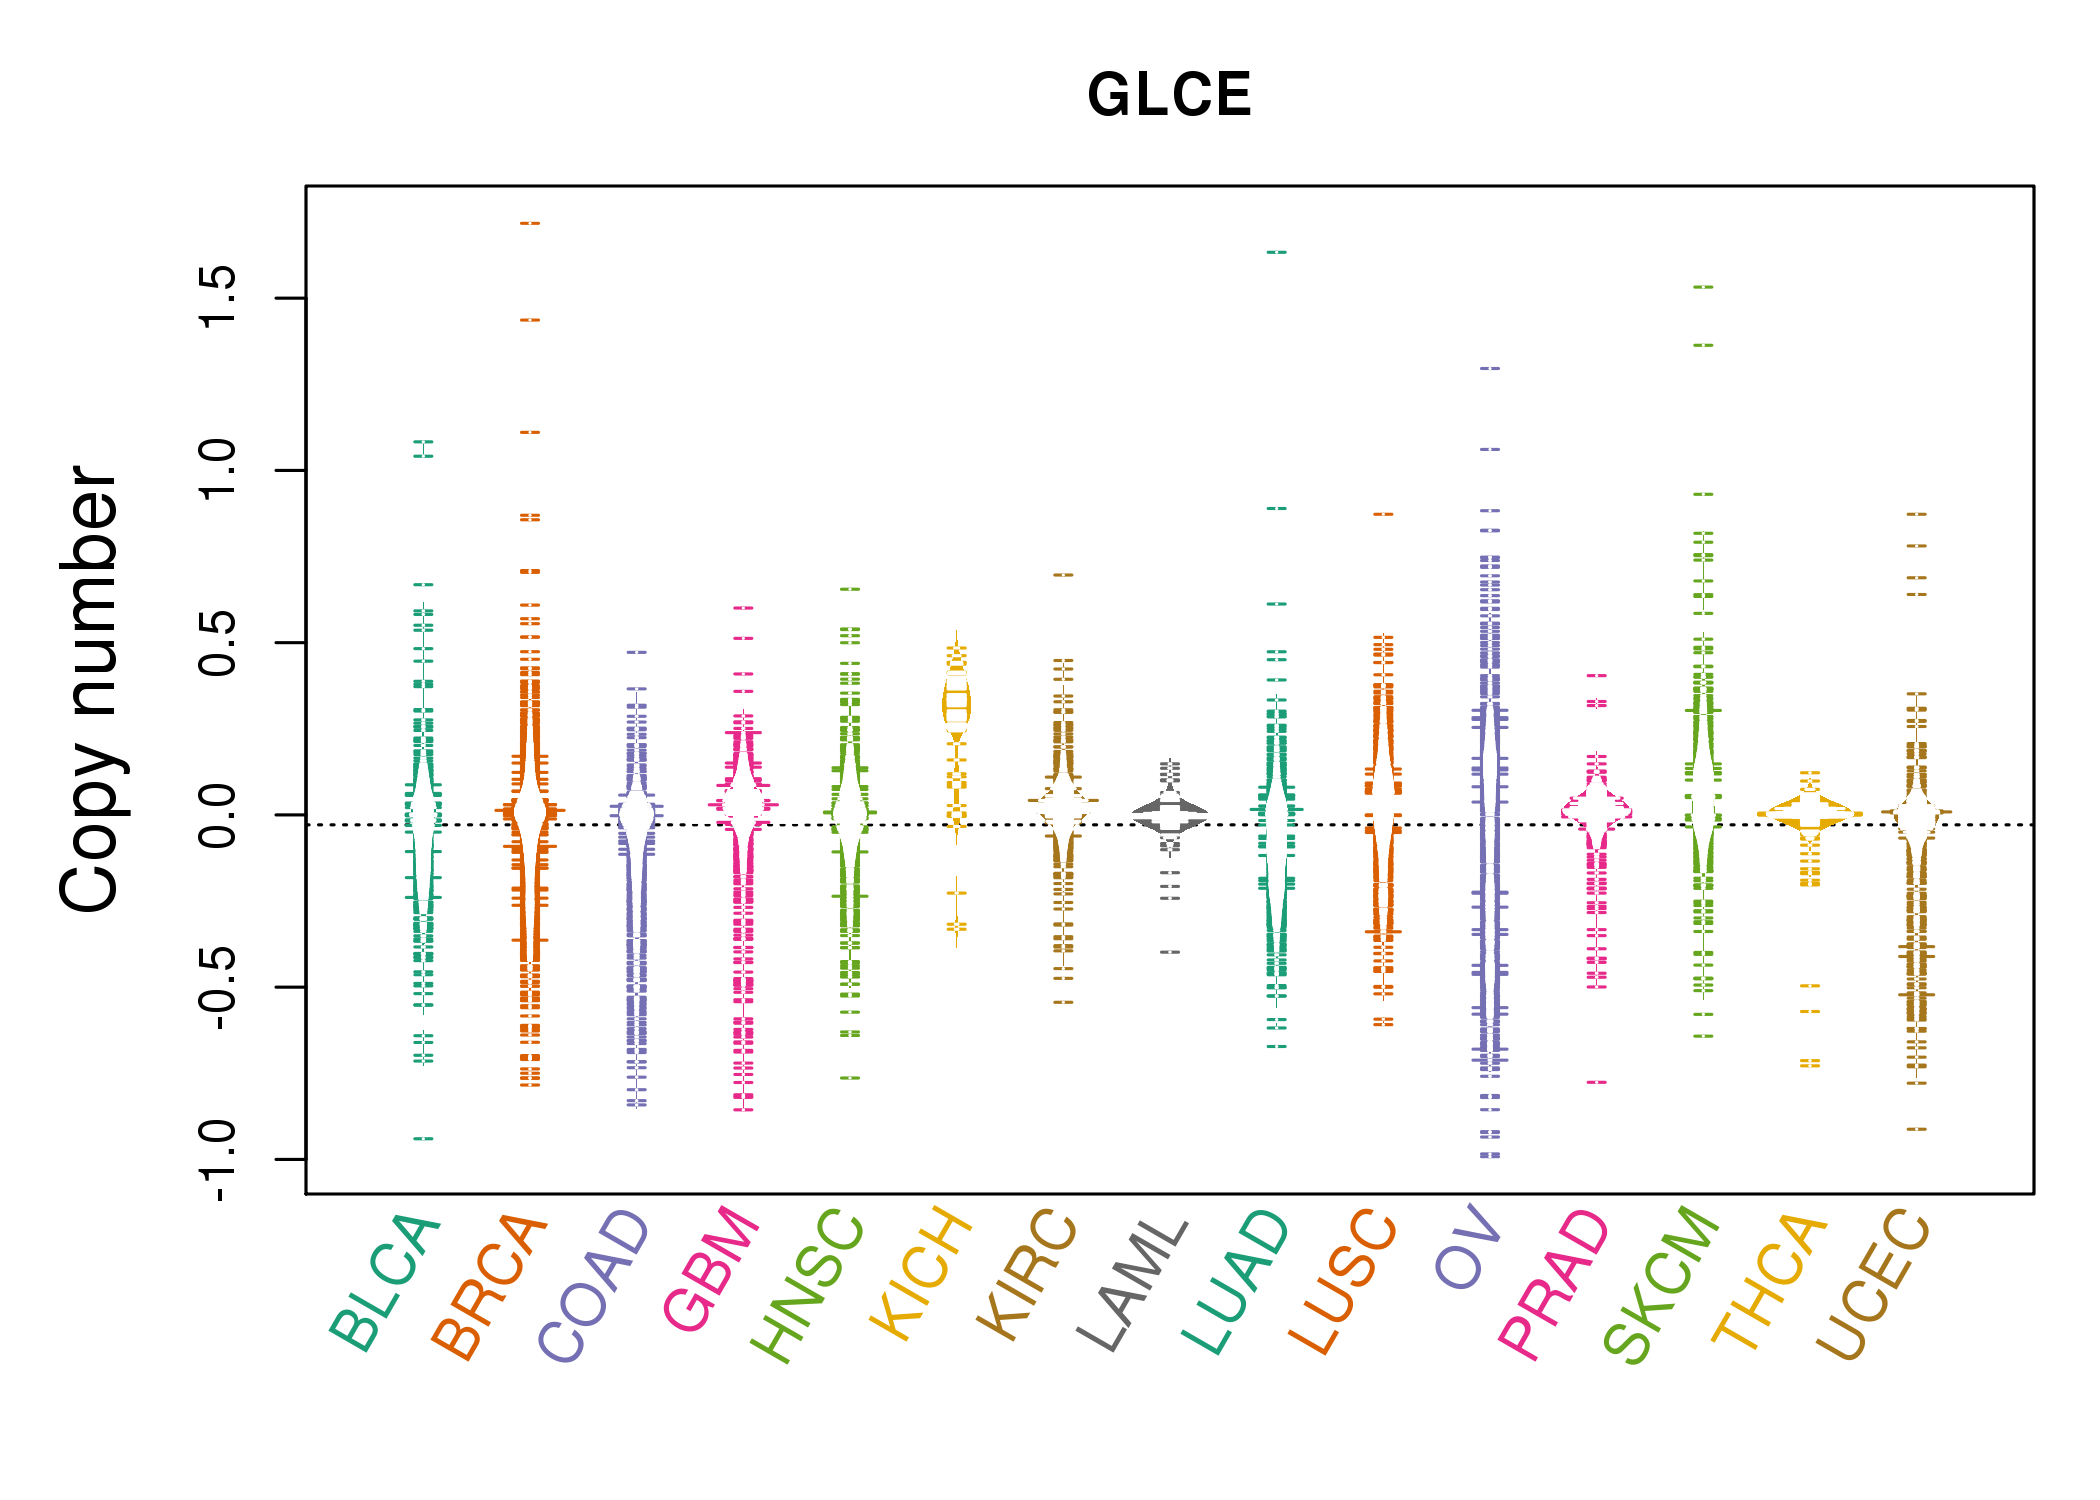 |
| cf) Tissue ID[Tissue type]: BLCA[Bladder Urothelial Carcinoma], BRCA[Breast invasive carcinoma], CESC[Cervical squamous cell carcinoma and endocervical adenocarcinoma], COAD[Colon adenocarcinoma], GBM[Glioblastoma multiforme], Glioma Low Grade, HNSC[Head and Neck squamous cell carcinoma], KICH[Kidney Chromophobe], KIRC[Kidney renal clear cell carcinoma], KIRP[Kidney renal papillary cell carcinoma], LAML[Acute Myeloid Leukemia], LUAD[Lung adenocarcinoma], LUSC[Lung squamous cell carcinoma], OV[Ovarian serous cystadenocarcinoma ], PAAD[Pancreatic adenocarcinoma], PRAD[Prostate adenocarcinoma], SKCM[Skin Cutaneous Melanoma], STAD[Stomach adenocarcinoma], THCA[Thyroid carcinoma], UCEC[Uterine Corpus Endometrial Carcinoma] |
| Top |
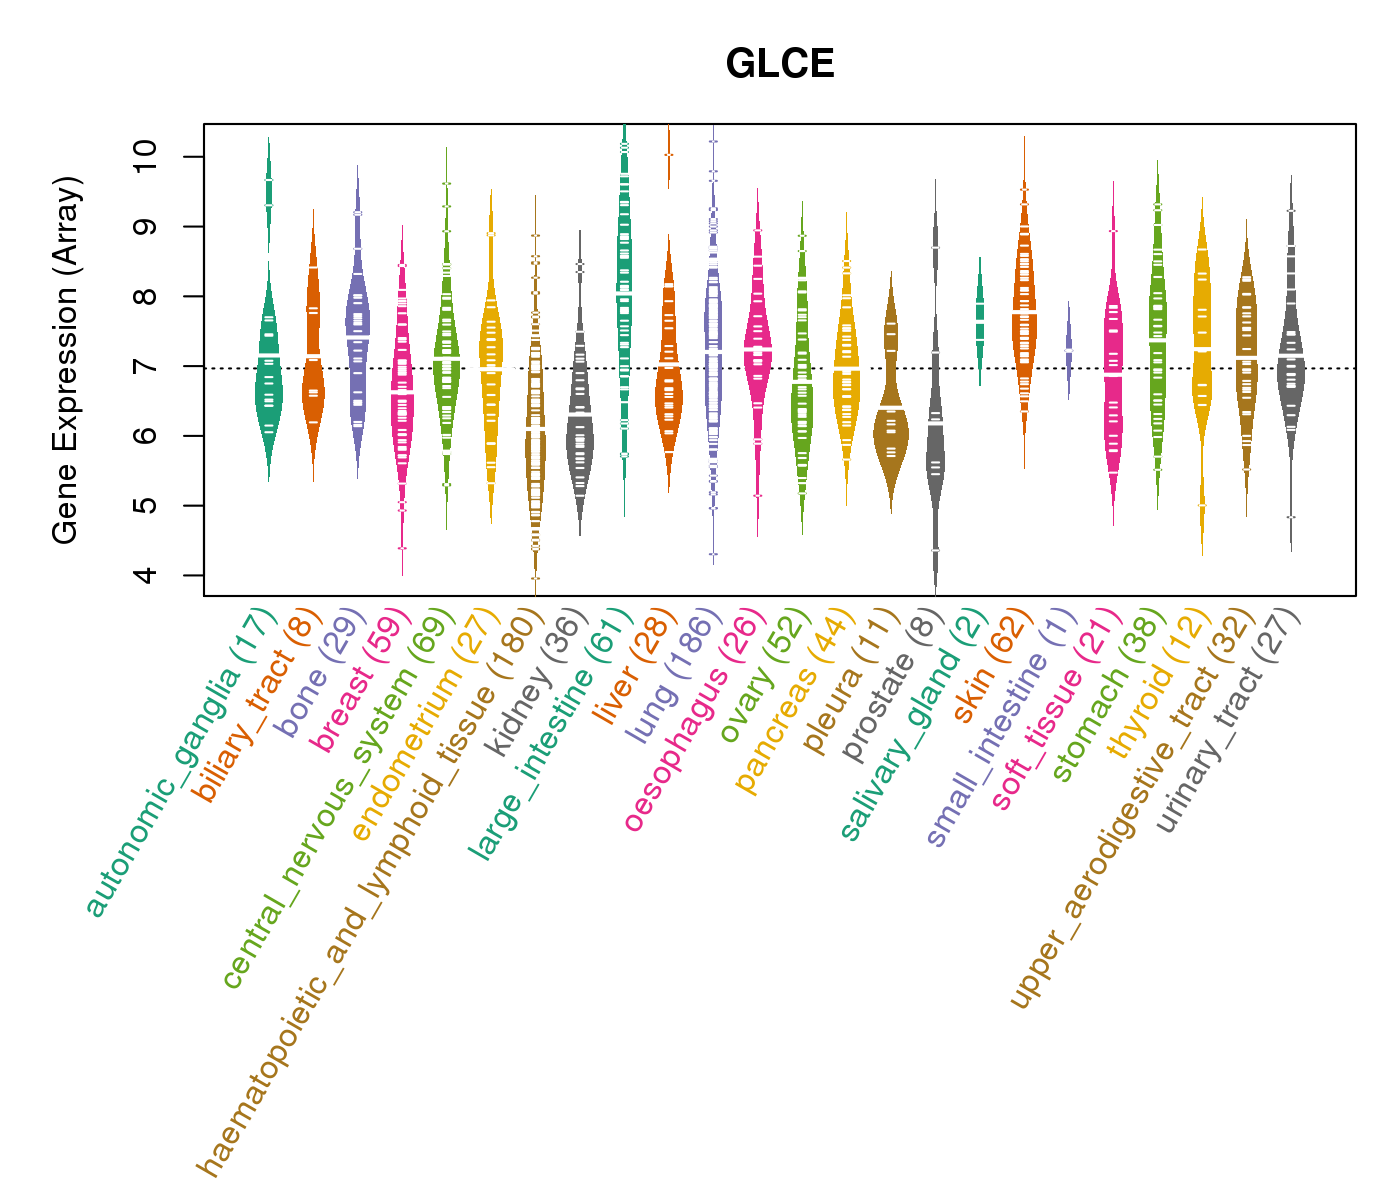
| Gene Expression for GLCE |
| * CCLE gene expression data were extracted from CCLE_Expression_Entrez_2012-10-18.res: Gene-centric RMA-normalized mRNA expression data. |
 |
| * Normalized gene expression data of RNASeqV2 was extracted from TCGA using R package TCGA-Assembler. The URLs of all public data files on TCGA DCC data server were gathered at Jan-05-2015. Only eight cancer types have enough normal control samples for differential expression analysis. (t test, adjusted p<0.05 (using Benjamini-Hochberg FDR)) |
 |
| Top |
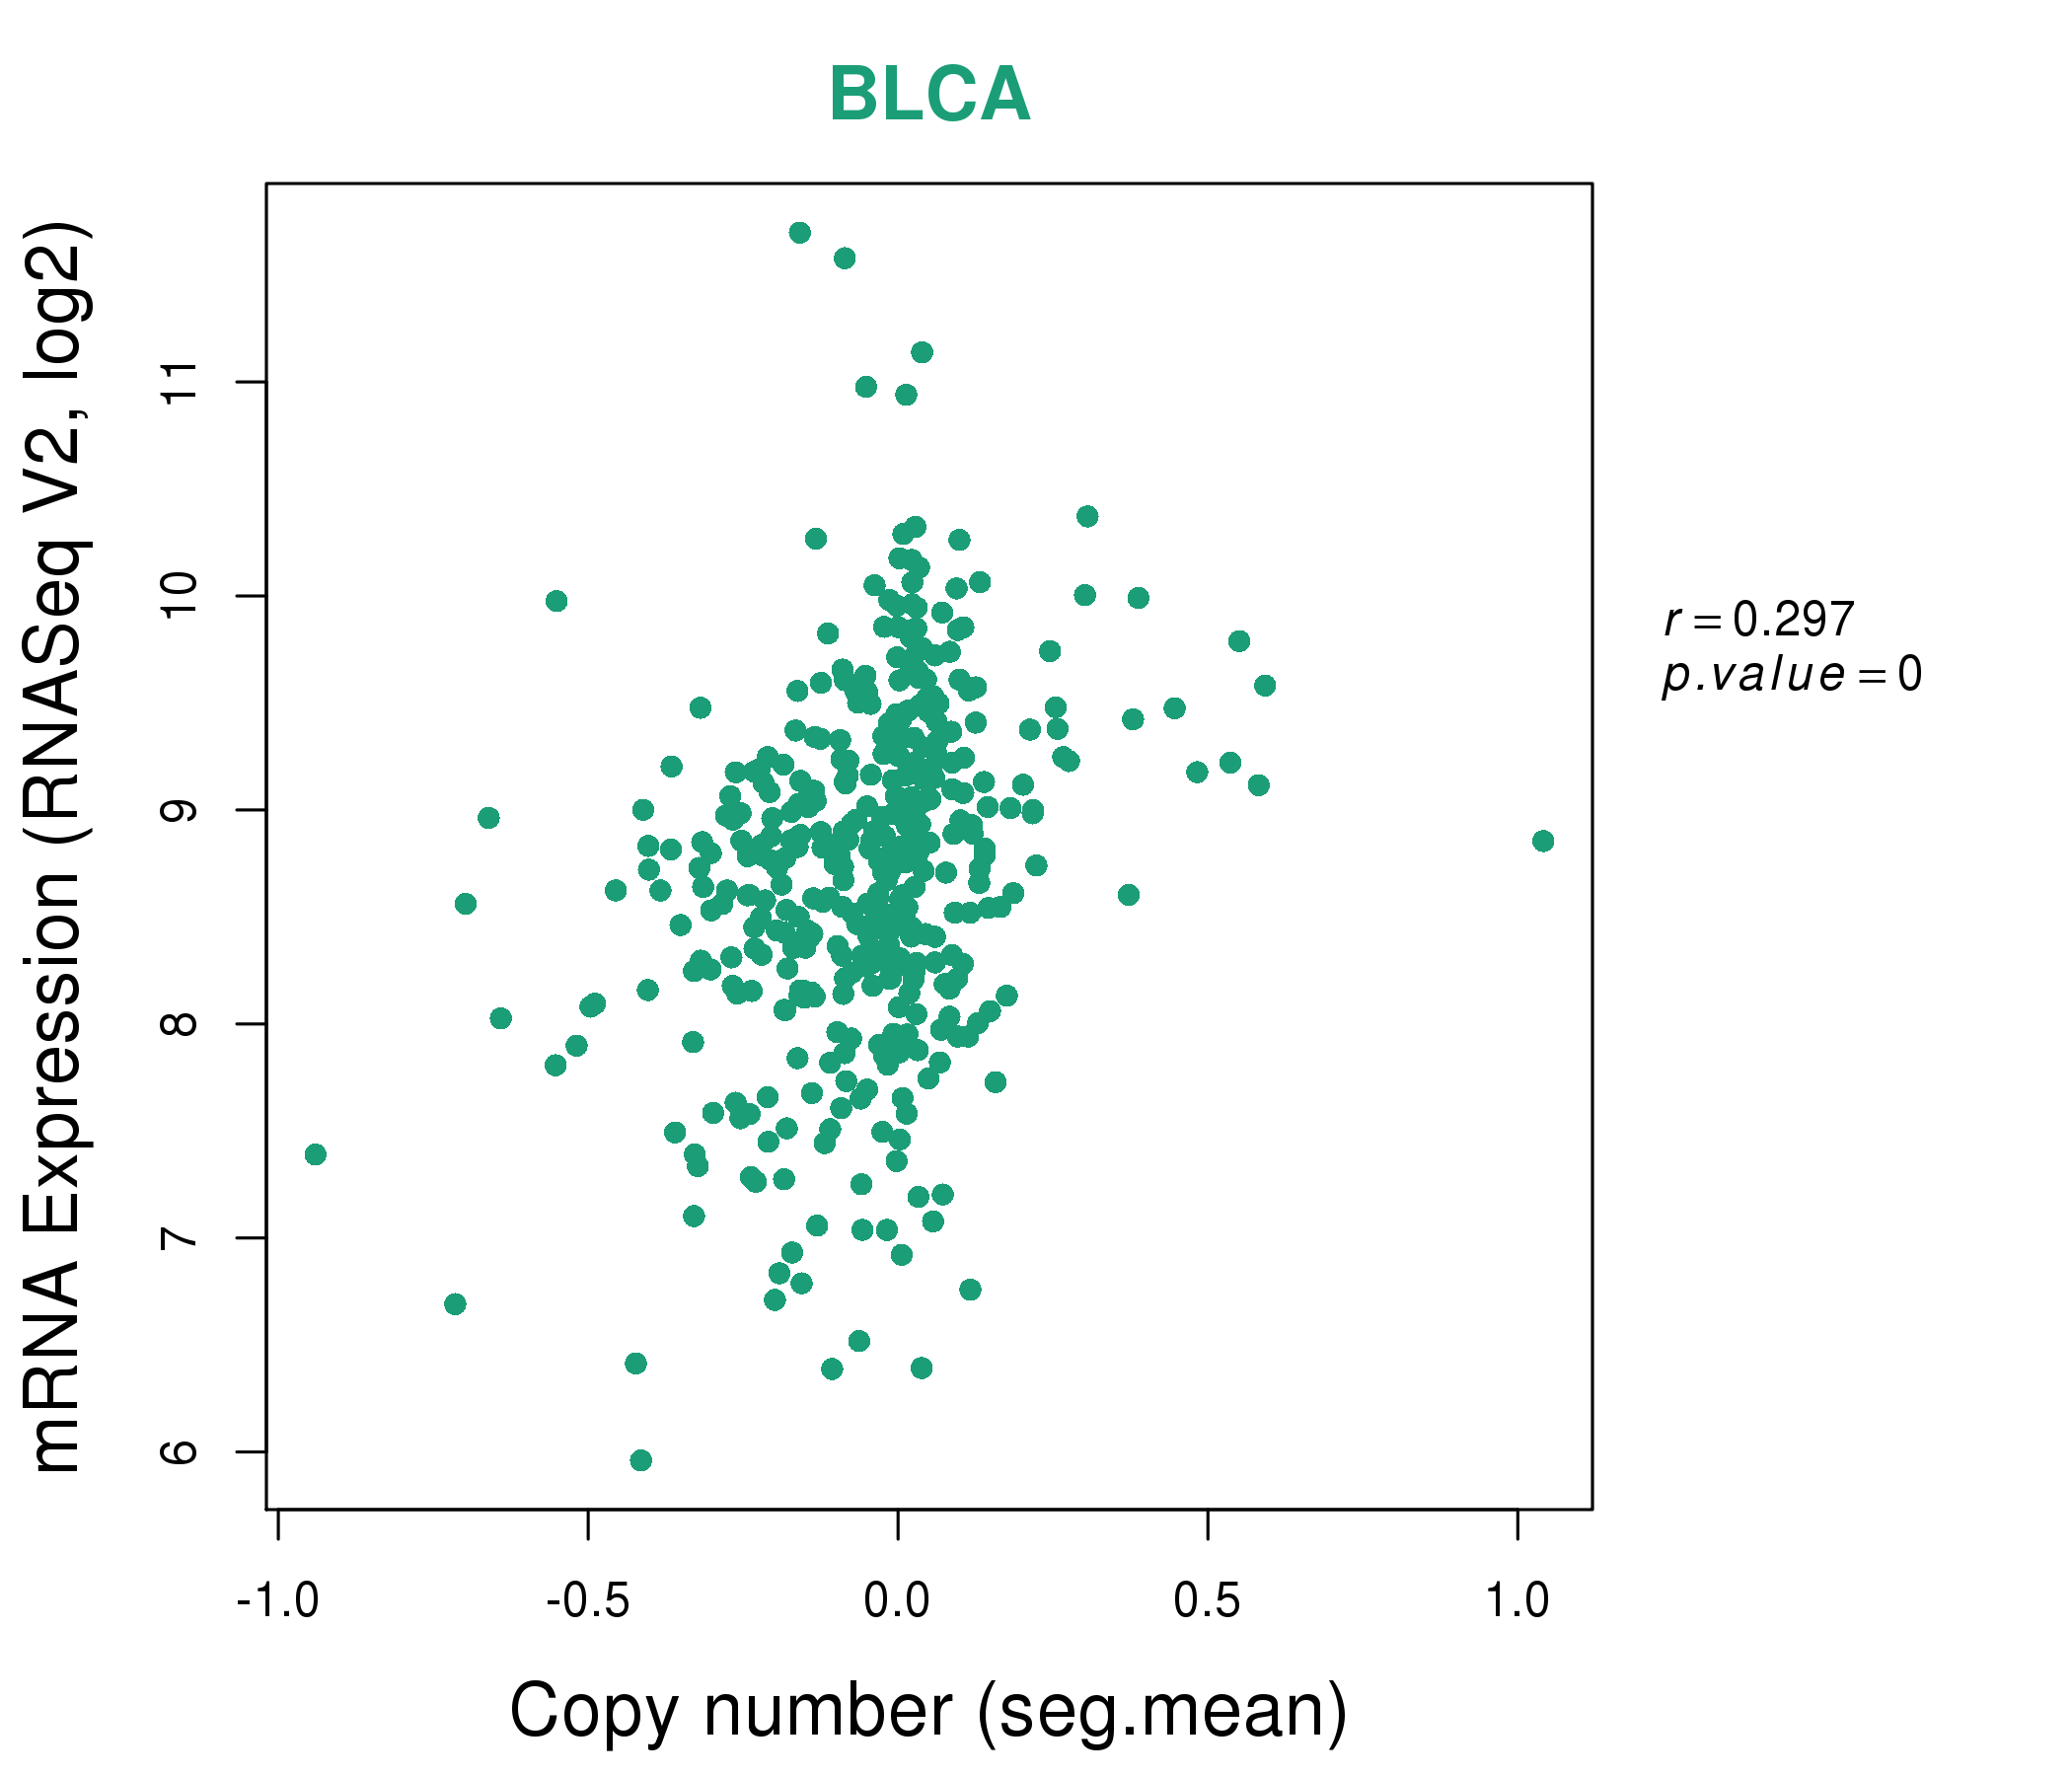
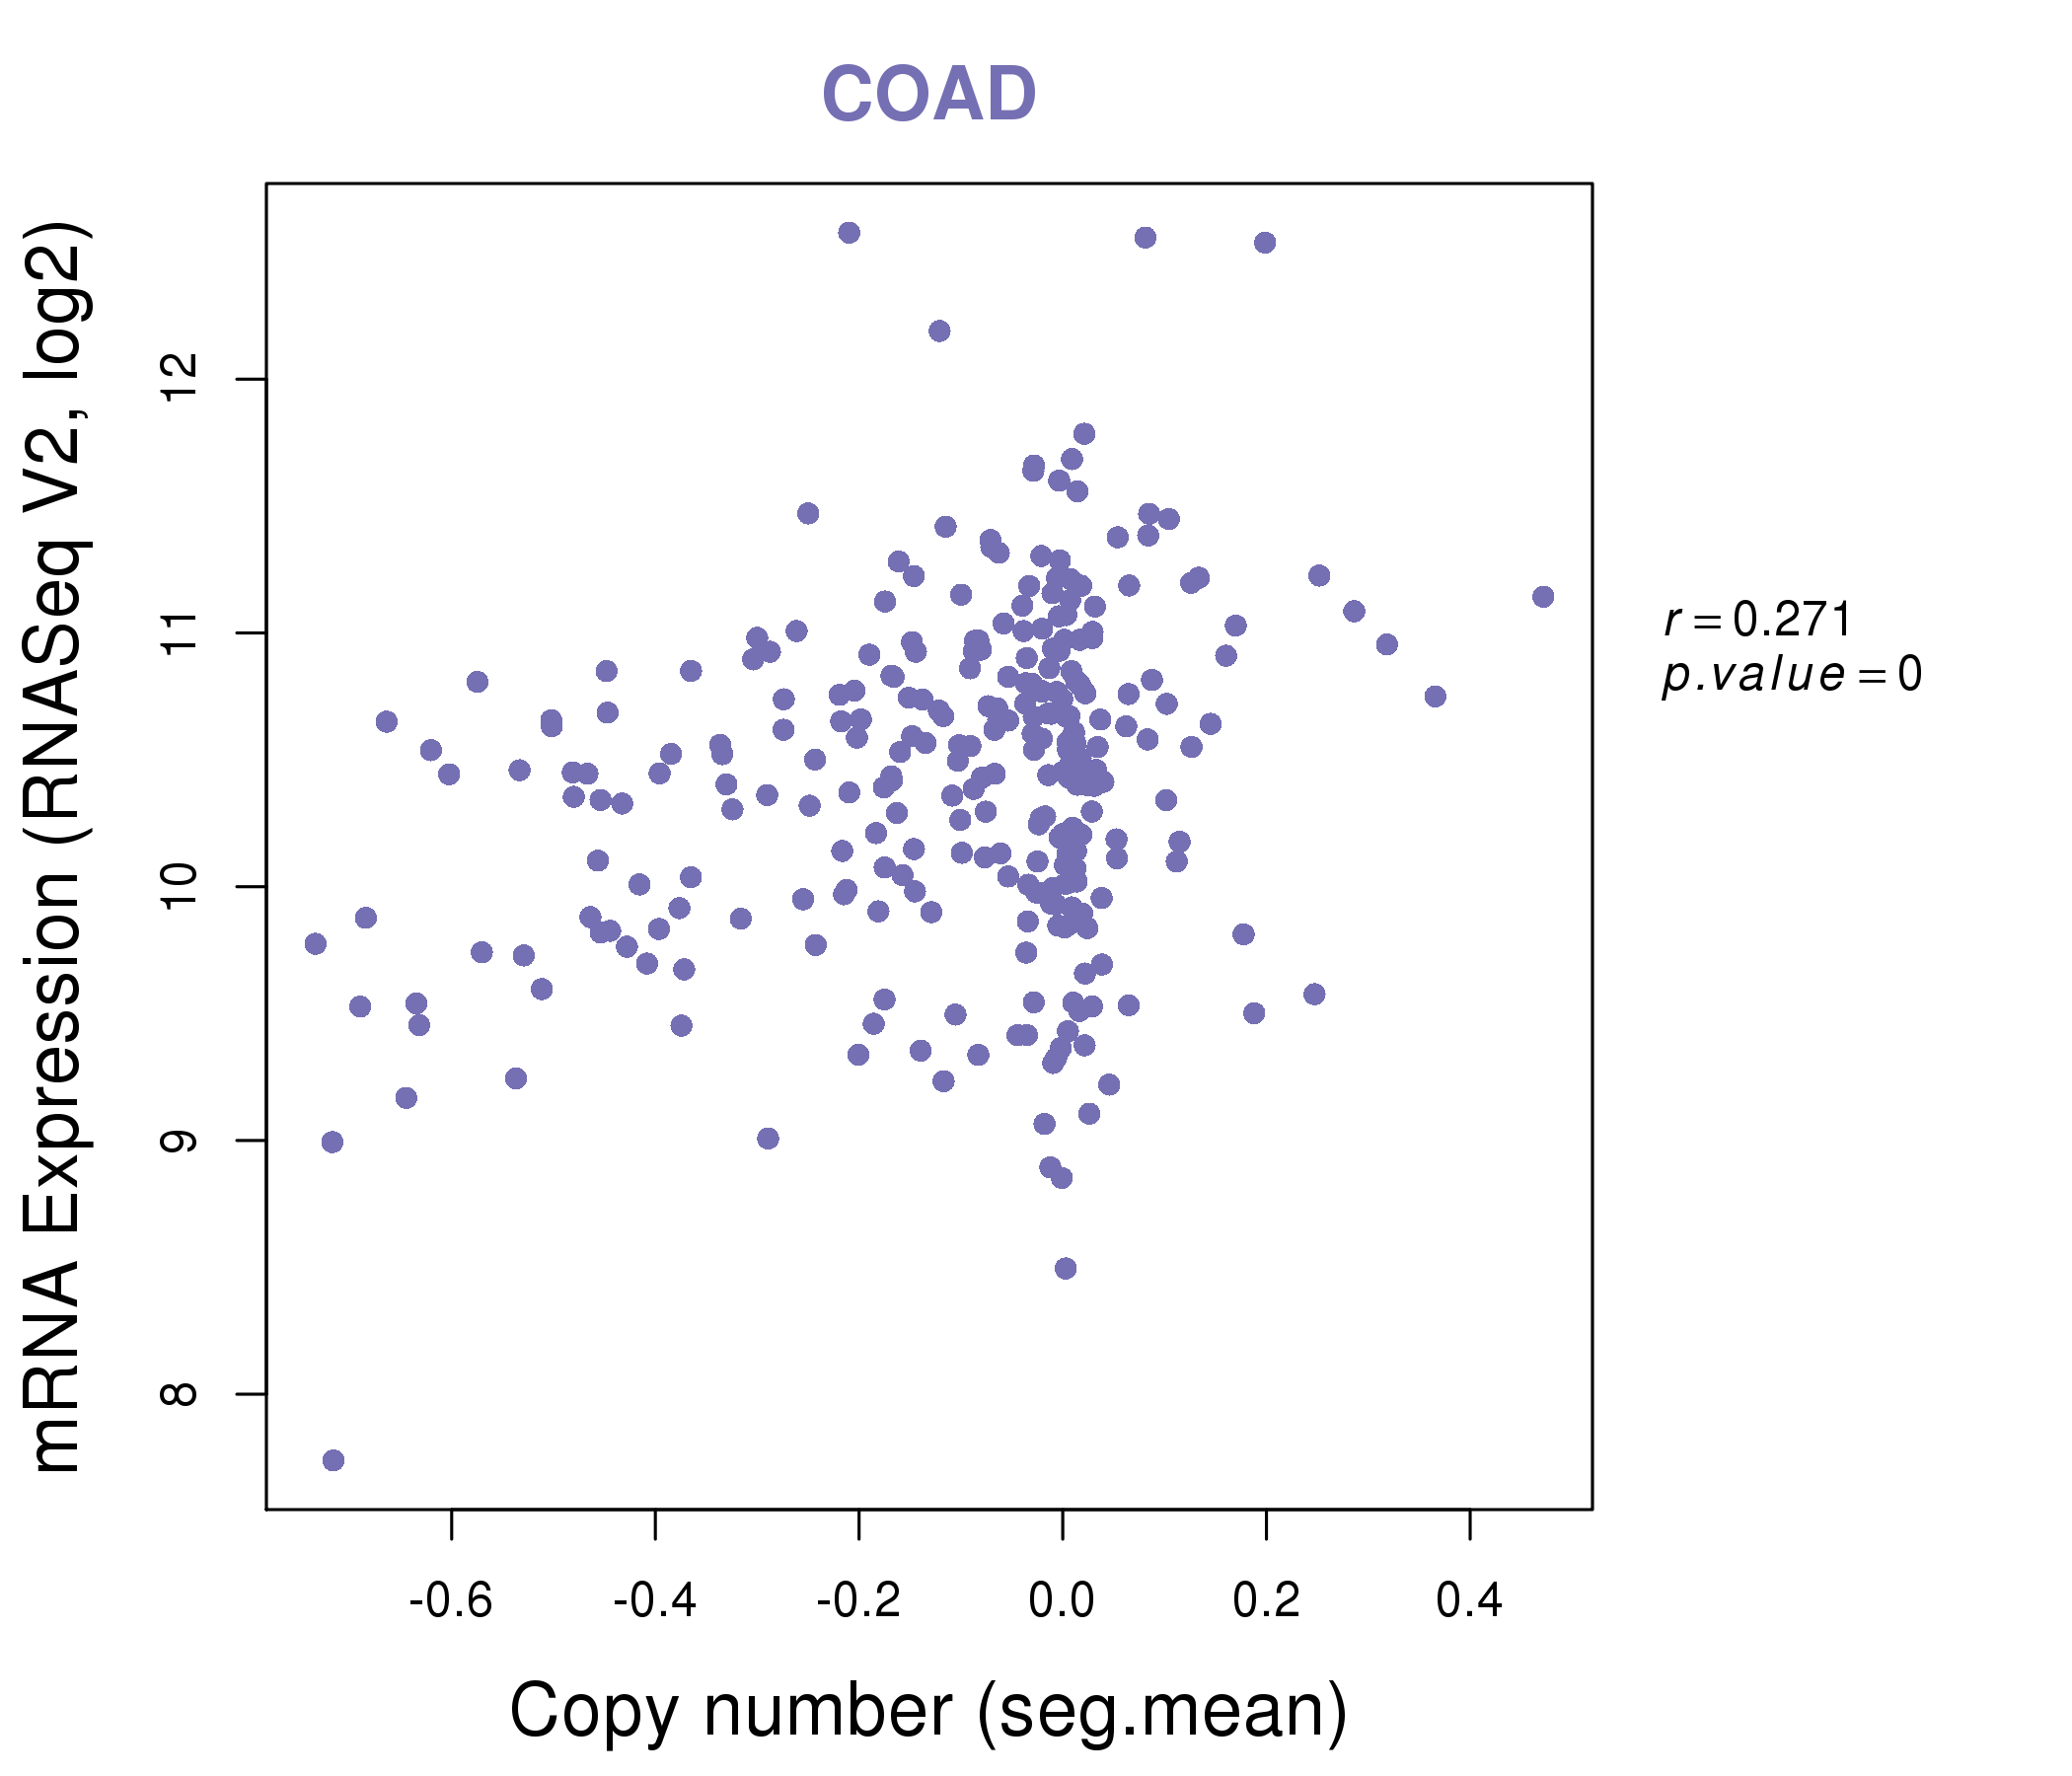
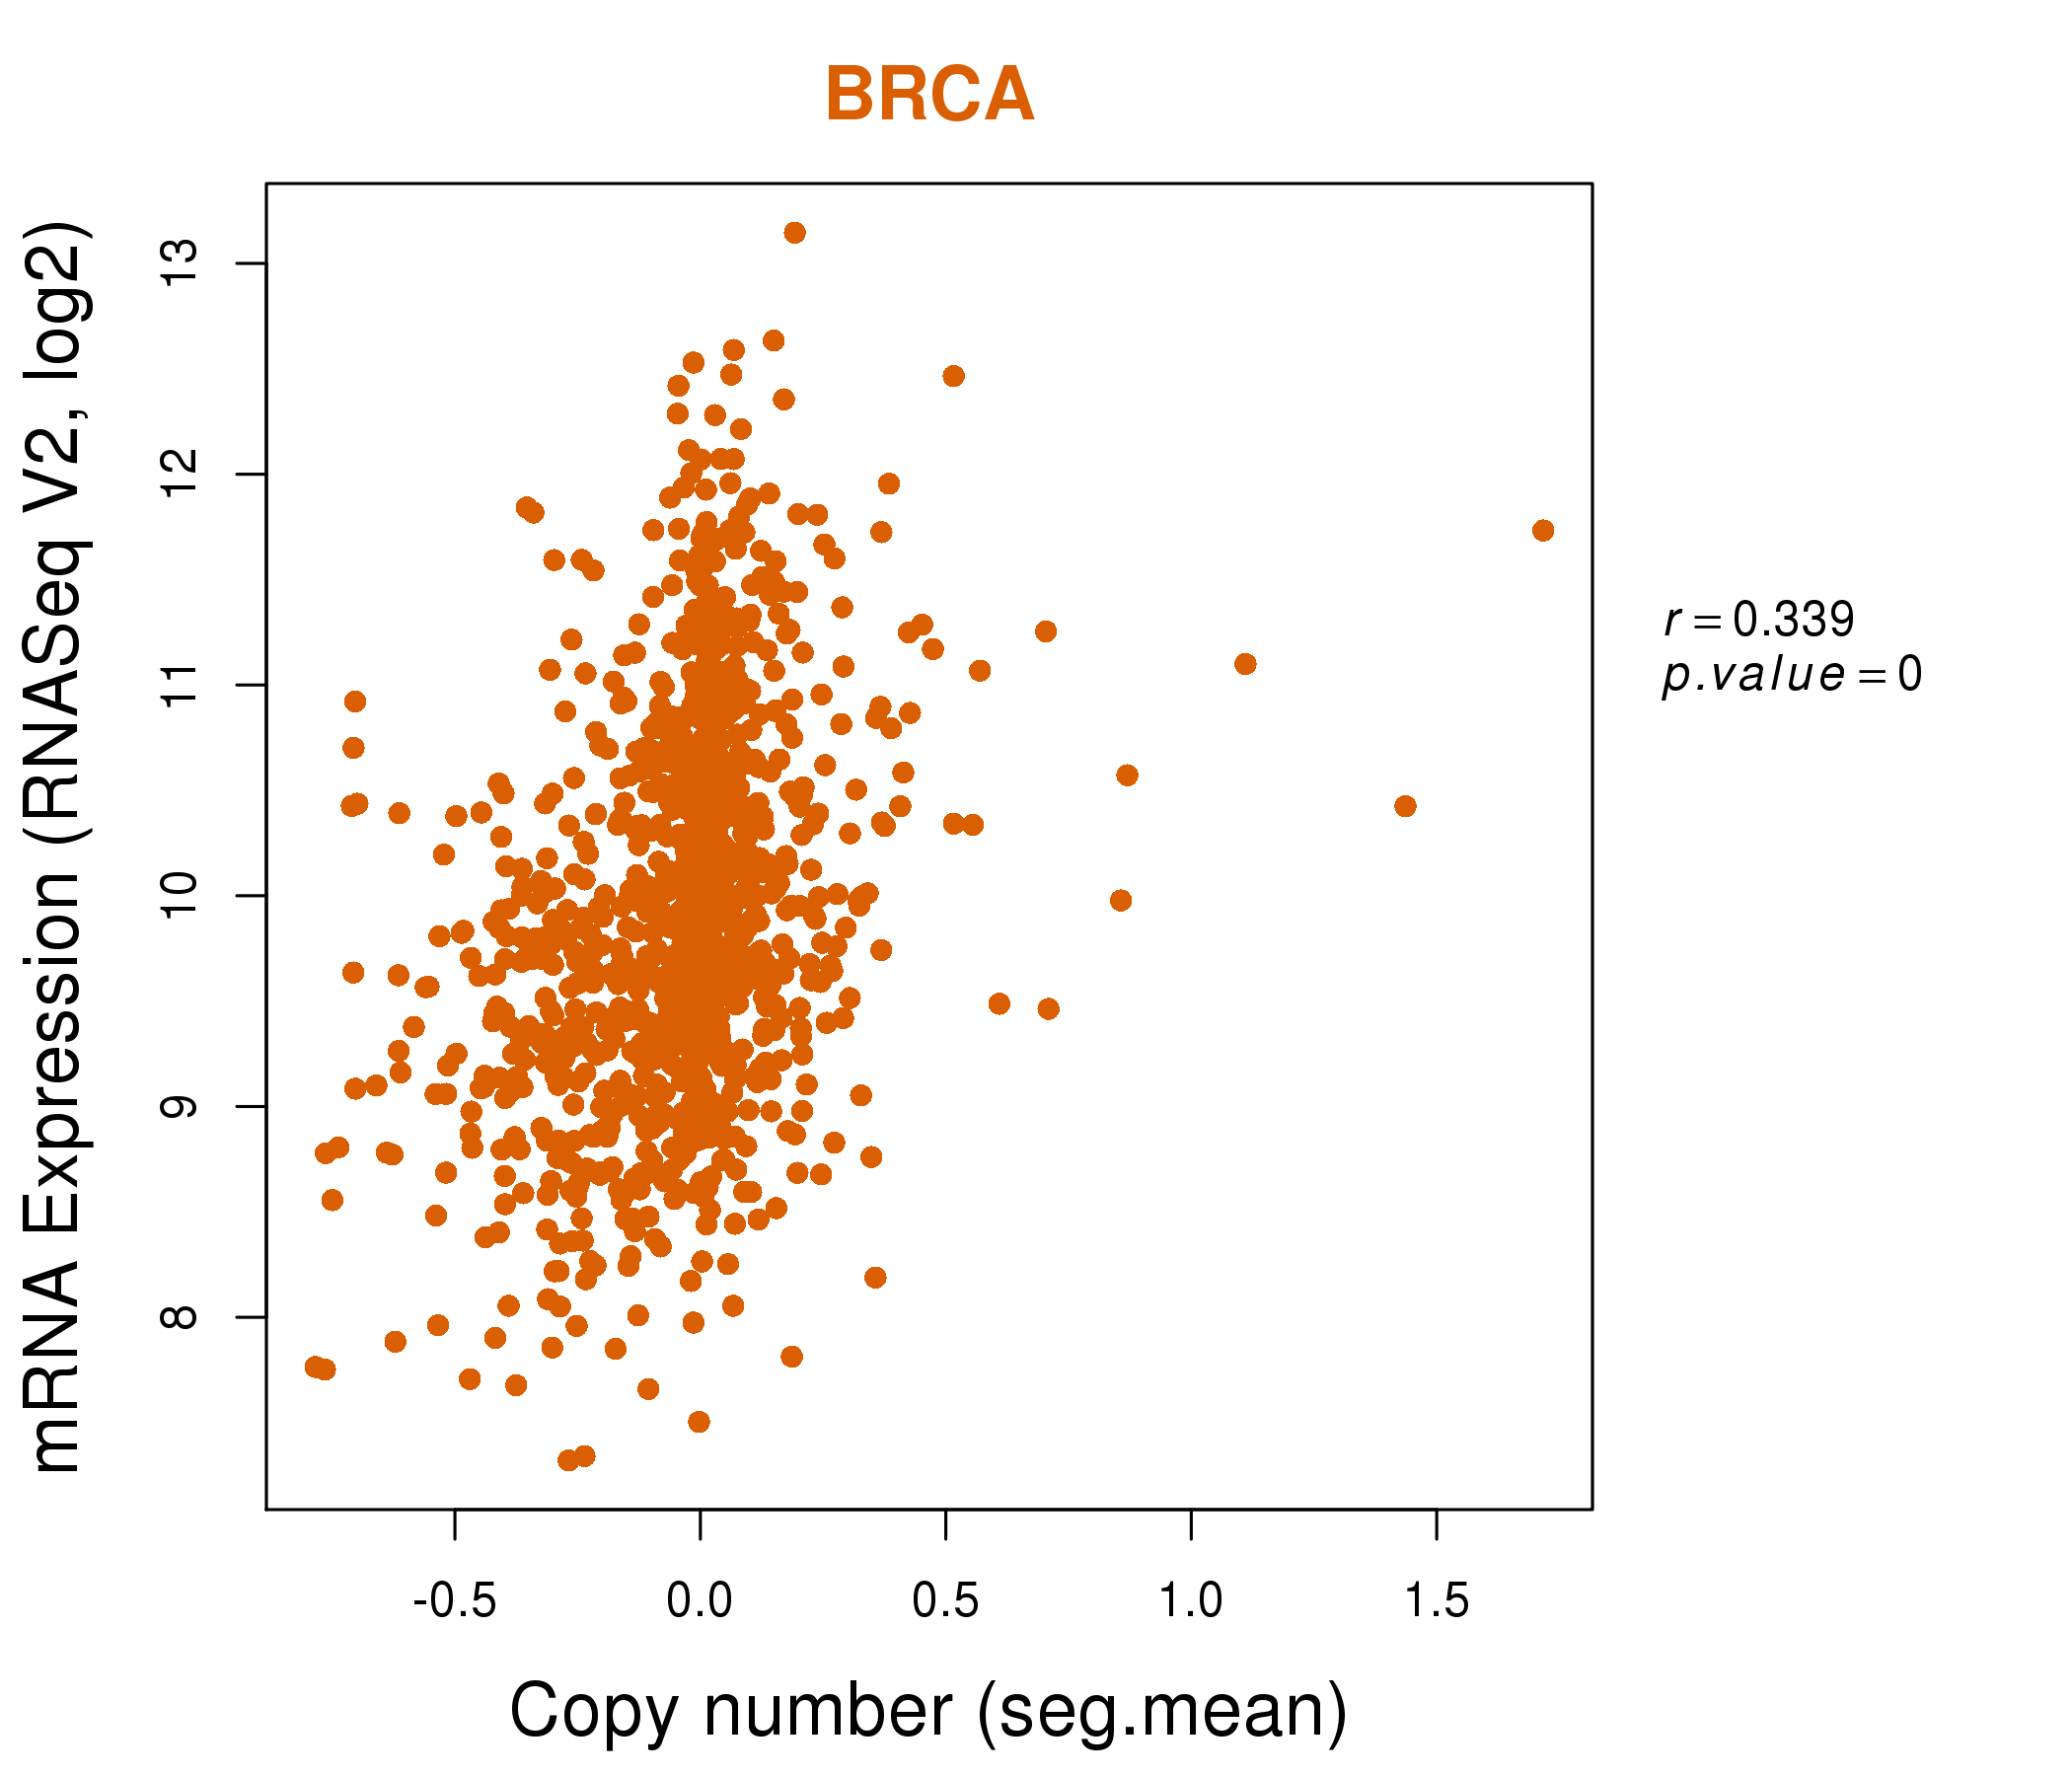
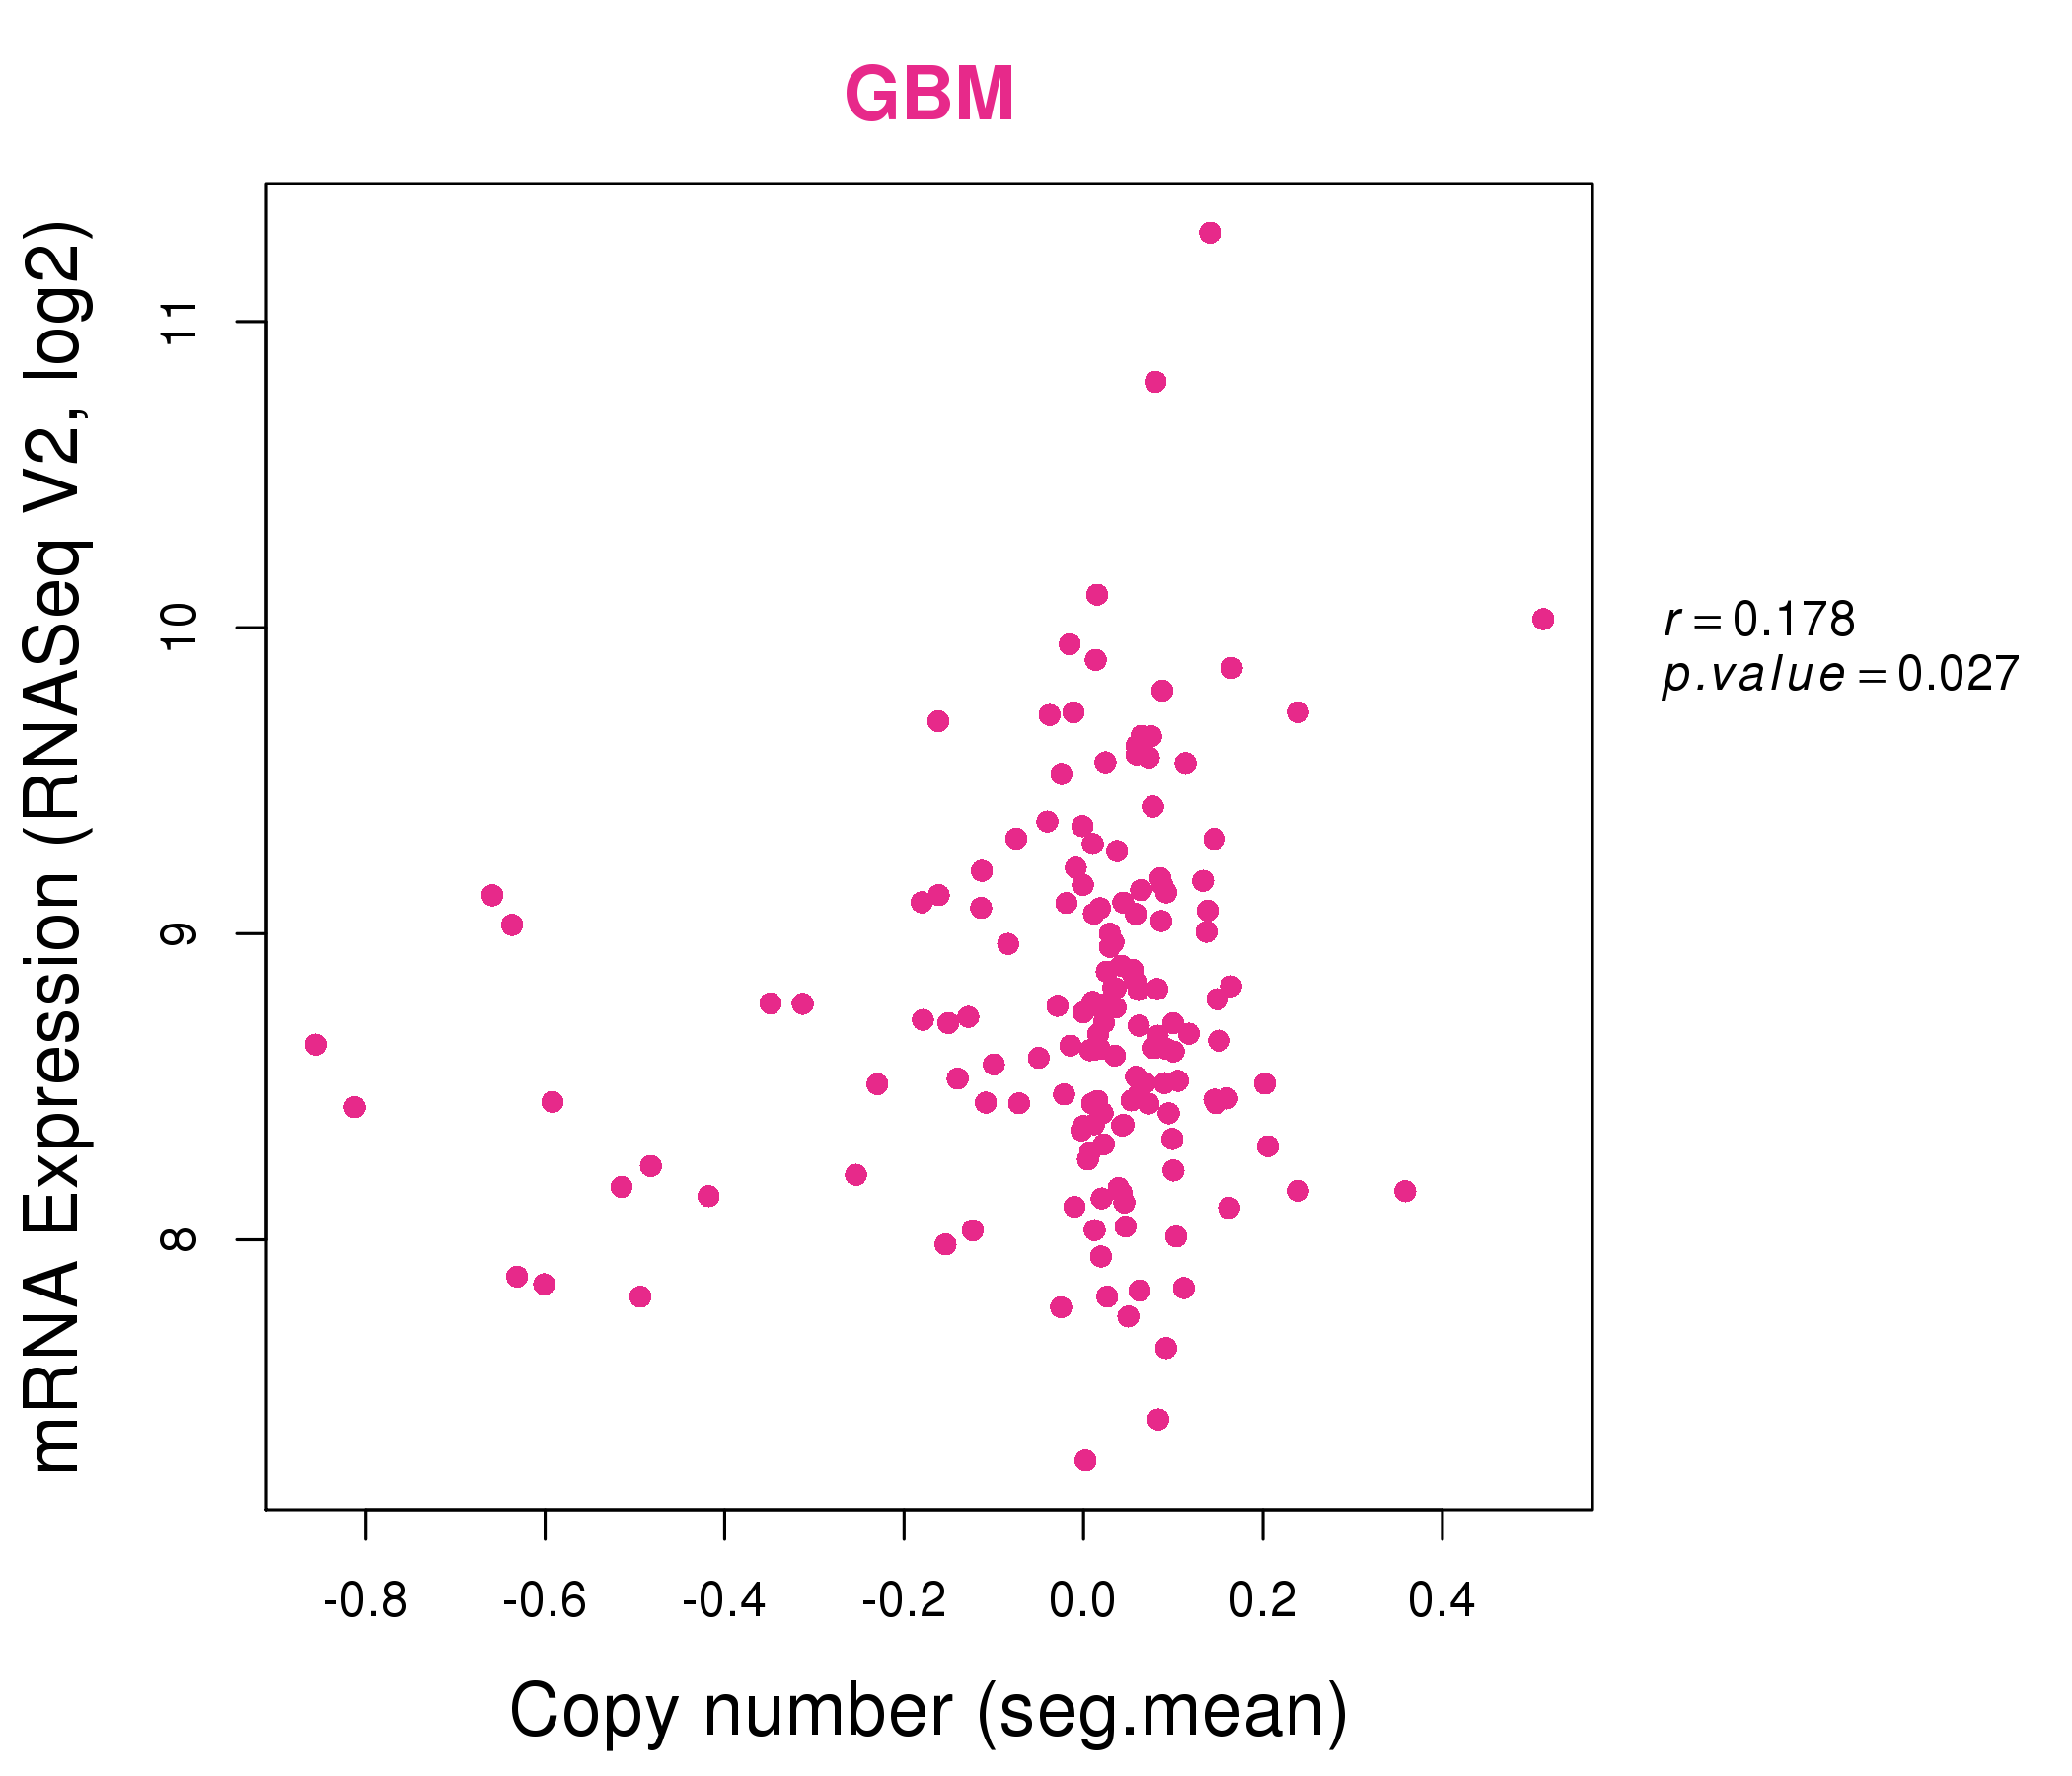
| * This plots show the correlation between CNV and gene expression. |
: Open all plots for all cancer types
 |
|
 |
|
| Top |
| Gene-Gene Network Information |
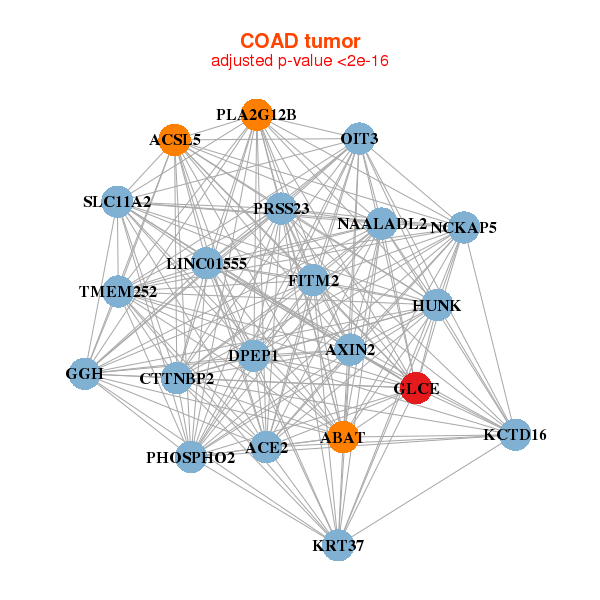
| * Co-Expression network figures were drawn using R package igraph. Only the top 20 genes with the highest correlations were shown. Red circle: input gene, orange circle: cell metabolism gene, sky circle: other gene |
: Open all plots for all cancer types
 |
|
| AFF3,AHCYL2,APH1B,BAZ2B,BCL2,DACH1,DCTN4, FAM73A,FOXA1,FRY,GLCE,IQCH,MTMR10,NEDD4L, RNF111,SCAMP1,SETBP1,SIN3A,THSD4,TMEM181,EWSAT1 | AK9,ANKRD50,ARHGEF12,ARID2,ATP7A,CTR9,GLCE, MEGF9,PDS5B,RALGAPB,SLC35A3,SPIN1,SRPK2,ST8SIA6, STAM2,STXBP4,TTC30B,WNK3,ZBTB41,ZKSCAN1,ZNF28 |
 |
|
| ABAT,ACE2,ACSL5,AXIN2,LINC01555,TMEM252,CTTNBP2, DPEP1,FITM2,GGH,GLCE,HUNK,KCTD16,KRT37, NAALADL2,NCKAP5,OIT3,PHOSPHO2,PLA2G12B,PRSS23,SLC11A2 | ADD3,C2orf15,CASP6,CD46,CMTM8,CNOT8,CRLS1, FAM60A,GLCE,GSR,LRRC57,NT5DC1,NUDT16P1,PEX1, SNX4,SNX5,TMEM98,TOM1L1,TXNDC12,VPS36,ZNF28 |

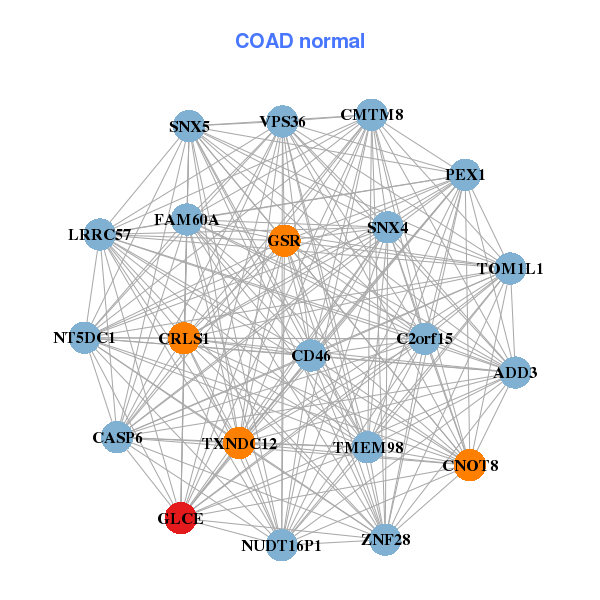
| * Co-Expression network figures were drawn using R package igraph. Only the top 20 genes with the highest correlations were shown. Red circle: input gene, orange circle: cell metabolism gene, sky circle: other gene |
: Open all plots for all cancer types
| Top |
: Open all interacting genes' information including KEGG pathway for all interacting genes from DAVID
| Top |
| Pharmacological Information for GLCE |
| There's no related Drug. |
| Top |
| Cross referenced IDs for GLCE |
| * We obtained these cross-references from Uniprot database. It covers 150 different DBs, 18 categories. http://www.uniprot.org/help/cross_references_section |
: Open all cross reference information
|
Copyright © 2016-Present - The Univsersity of Texas Health Science Center at Houston @ |