|
||||||||||||||||||||||||||||||||||||||||||||||||||||||||||||||||||||||||||||||||||||||||||||||||||||||||||||||||||||||||||||||||||||||||||||||||||||||||||||||||||||||||||||||||||||||||||||||||||||||||||||||||||||||||||||||||||||||||||||||||||||||||||||||||||||||||||||||||||||||||||||||||||||||||||||||||||||||||||
| |
| Phenotypic Information (metabolism pathway, cancer, disease, phenome) |
| |
| |
| Gene-Gene Network Information: Co-Expression Network, Interacting Genes & KEGG |
| |
|


| Gene Summary for HACL1 |
| Top |
| Phenotypic Information for HACL1(metabolism pathway, cancer, disease, phenome) |
| Cancer | CGAP: HACL1 |
| Familial Cancer Database: HACL1 | |
| * This gene is included in those cancer gene databases. |
|
|
|
|
|
| . | ||||||||||||||||||||||||||||||||||||||||||||||||||||||||||||||||||||||||||||||||||||||||||||||||||||||||||||||||||||||||||||||||||||||||||||||||||||||||||||||||||||||||||||||||||||||||||||||||||||||||||||||||||||||||||||||||||||||||||||||||||||||||||||||||||||||||||||||||||||||||||||||||||||||||||||||||||||
Oncogene 1 | Significant driver gene in | |||||||||||||||||||||||||||||||||||||||||||||||||||||||||||||||||||||||||||||||||||||||||||||||||||||||||||||||||||||||||||||||||||||||||||||||||||||||||||||||||||||||||||||||||||||||||||||||||||||||||||||||||||||||||||||||||||||||||||||||||||||||||||||||||||||||||||||||||||||||||||||||||||||||||||||||||||||||||
| cf) number; DB name 1 Oncogene; http://nar.oxfordjournals.org/content/35/suppl_1/D721.long, 2 Tumor Suppressor gene; https://bioinfo.uth.edu/TSGene/, 3 Cancer Gene Census; http://www.nature.com/nrc/journal/v4/n3/abs/nrc1299.html, 4 CancerGenes; http://nar.oxfordjournals.org/content/35/suppl_1/D721.long, 5 Network of Cancer Gene; http://ncg.kcl.ac.uk/index.php, 1Therapeutic Vulnerabilities in Cancer; http://cbio.mskcc.org/cancergenomics/statius/ |
| REACTOME_PEROXISOMAL_LIPID_METABOLISM REACTOME_METABOLISM_OF_LIPIDS_AND_LIPOPROTEINS | |
| OMIM | |
| Orphanet | |
| Disease | KEGG Disease: HACL1 |
| MedGen: HACL1 (Human Medical Genetics with Condition) | |
| ClinVar: HACL1 | |
| Phenotype | MGI: HACL1 (International Mouse Phenotyping Consortium) |
| PhenomicDB: HACL1 | |
| Mutations for HACL1 |
| * Under tables are showing count per each tissue to give us broad intuition about tissue specific mutation patterns.You can go to the detailed page for each mutation database's web site. |
| There's no structural variation information in COSMIC data for this gene. |
| * From mRNA Sanger sequences, Chitars2.0 arranged chimeric transcripts. This table shows HACL1 related fusion information. |
| ID | Head Gene | Tail Gene | Accession | Gene_a | qStart_a | qEnd_a | Chromosome_a | tStart_a | tEnd_a | Gene_a | qStart_a | qEnd_a | Chromosome_a | tStart_a | tEnd_a |
| AI969337 | HACL1 | 10 | 236 | 3 | 15602251 | 15604937 | ZZEF1 | 233 | 338 | 17 | 3926423 | 3926528 | |
| BE501084 | HACL1 | 4 | 230 | 3 | 15602251 | 15604937 | ZZEF1 | 227 | 332 | 17 | 3926423 | 3926528 | |
| AW837060 | ARHGAP29 | 250 | 272 | 1 | 94649540 | 94649563 | HACL1 | 258 | 280 | 3 | 15594990 | 15595012 | |
| AW269808 | HACL1 | 246 | 294 | 3 | 15601872 | 15602232 | RBM5 | 277 | 582 | 3 | 50154645 | 50154951 | |
| DB349473 | HACL1 | 1 | 54 | 3 | 15602351 | 15602404 | LRPPRC | 54 | 546 | 2 | 44152205 | 44152697 | |
| Top |
| Mutation type/ Tissue ID | brca | cns | cerv | endome | haematopo | kidn | Lintest | liver | lung | ns | ovary | pancre | prost | skin | stoma | thyro | urina | |||
| Total # sample | 1 | |||||||||||||||||||
| GAIN (# sample) | 1 | |||||||||||||||||||
| LOSS (# sample) |
| cf) Tissue ID; Tissue type (1; Breast, 2; Central_nervous_system, 3; Cervix, 4; Endometrium, 5; Haematopoietic_and_lymphoid_tissue, 6; Kidney, 7; Large_intestine, 8; Liver, 9; Lung, 10; NS, 11; Ovary, 12; Pancreas, 13; Prostate, 14; Skin, 15; Stomach, 16; Thyroid, 17; Urinary_tract) |
| Top |
|
 |
| Top |
| Stat. for Non-Synonymous SNVs (# total SNVs=25) | (# total SNVs=12) |
 |  |
(# total SNVs=0) | (# total SNVs=0) |
| Top |
| * When you move the cursor on each content, you can see more deailed mutation information on the Tooltip. Those are primary_site,primary_histology,mutation(aa),pubmedID. |
| GRCh37 position | Mutation(aa) | Unique sampleID count |
| chr3:15628080-15628080 | p.F137L | 3 |
| chr3:15613280-15613280 | p.? | 3 |
| chr3:15610010-15610010 | p.F393F | 2 |
| chr3:15609957-15609957 | p.N411S | 1 |
| chr3:15628054-15628054 | p.A146V | 1 |
| chr3:15613244-15613244 | p.Q342Q | 1 |
| chr3:15621478-15621478 | p.P248S | 1 |
| chr3:15604925-15604925 | p.D548D | 1 |
| chr3:15609974-15609974 | p.G405G | 1 |
| chr3:15628073-15628073 | p.R140C | 1 |
| Top |
|
 |
| Point Mutation/ Tissue ID | 1 | 2 | 3 | 4 | 5 | 6 | 7 | 8 | 9 | 10 | 11 | 12 | 13 | 14 | 15 | 16 | 17 | 18 | 19 | 20 |
| # sample | 1 | 1 | 8 | 5 | 2 | 3 | 1 | 3 | 3 | 1 | 7 | |||||||||
| # mutation | 1 | 1 | 7 | 5 | 2 | 3 | 1 | 3 | 5 | 1 | 7 | |||||||||
| nonsynonymous SNV | 1 | 5 | 4 | 3 | 1 | 2 | 3 | 1 | 6 | |||||||||||
| synonymous SNV | 1 | 2 | 1 | 2 | 1 | 2 | 1 |
| cf) Tissue ID; Tissue type (1; BLCA[Bladder Urothelial Carcinoma], 2; BRCA[Breast invasive carcinoma], 3; CESC[Cervical squamous cell carcinoma and endocervical adenocarcinoma], 4; COAD[Colon adenocarcinoma], 5; GBM[Glioblastoma multiforme], 6; Glioma Low Grade, 7; HNSC[Head and Neck squamous cell carcinoma], 8; KICH[Kidney Chromophobe], 9; KIRC[Kidney renal clear cell carcinoma], 10; KIRP[Kidney renal papillary cell carcinoma], 11; LAML[Acute Myeloid Leukemia], 12; LUAD[Lung adenocarcinoma], 13; LUSC[Lung squamous cell carcinoma], 14; OV[Ovarian serous cystadenocarcinoma ], 15; PAAD[Pancreatic adenocarcinoma], 16; PRAD[Prostate adenocarcinoma], 17; SKCM[Skin Cutaneous Melanoma], 18:STAD[Stomach adenocarcinoma], 19:THCA[Thyroid carcinoma], 20:UCEC[Uterine Corpus Endometrial Carcinoma]) |
| Top |
| * We represented just top 10 SNVs. When you move the cursor on each content, you can see more deailed mutation information on the Tooltip. Those are primary_site, primary_histology, mutation(aa), pubmedID. |
| Genomic Position | Mutation(aa) | Unique sampleID count |
| chr3:15628080 | p.F110L,HACL1 | 3 |
| chr3:15610010 | p.F311F,HACL1 | 2 |
| chr3:15613185 | p.V312M,HACL1 | 1 |
| chr3:15624464 | p.A119V,HACL1 | 1 |
| chr3:15609385 | p.R113C,HACL1 | 1 |
| chr3:15613192 | p.L306L,HACL1 | 1 |
| chr3:15628049 | p.S111F,HACL1 | 1 |
| chr3:15609397 | p.A280V,HACL1 | 1 |
| chr3:15613244 | p.N278D,HACL1 | 1 |
| chr3:15628054 | p.M92I,HACL1 | 1 |
| * Copy number data were extracted from TCGA using R package TCGA-Assembler. The URLs of all public data files on TCGA DCC data server were gathered on Jan-05-2015. Function ProcessCNAData in TCGA-Assembler package was used to obtain gene-level copy number value which is calculated as the average copy number of the genomic region of a gene. |
 |
| cf) Tissue ID[Tissue type]: BLCA[Bladder Urothelial Carcinoma], BRCA[Breast invasive carcinoma], CESC[Cervical squamous cell carcinoma and endocervical adenocarcinoma], COAD[Colon adenocarcinoma], GBM[Glioblastoma multiforme], Glioma Low Grade, HNSC[Head and Neck squamous cell carcinoma], KICH[Kidney Chromophobe], KIRC[Kidney renal clear cell carcinoma], KIRP[Kidney renal papillary cell carcinoma], LAML[Acute Myeloid Leukemia], LUAD[Lung adenocarcinoma], LUSC[Lung squamous cell carcinoma], OV[Ovarian serous cystadenocarcinoma ], PAAD[Pancreatic adenocarcinoma], PRAD[Prostate adenocarcinoma], SKCM[Skin Cutaneous Melanoma], STAD[Stomach adenocarcinoma], THCA[Thyroid carcinoma], UCEC[Uterine Corpus Endometrial Carcinoma] |
| Top |
| Gene Expression for HACL1 |
| * CCLE gene expression data were extracted from CCLE_Expression_Entrez_2012-10-18.res: Gene-centric RMA-normalized mRNA expression data. |
 |
| * Normalized gene expression data of RNASeqV2 was extracted from TCGA using R package TCGA-Assembler. The URLs of all public data files on TCGA DCC data server were gathered at Jan-05-2015. Only eight cancer types have enough normal control samples for differential expression analysis. (t test, adjusted p<0.05 (using Benjamini-Hochberg FDR)) |
 |
| Top |
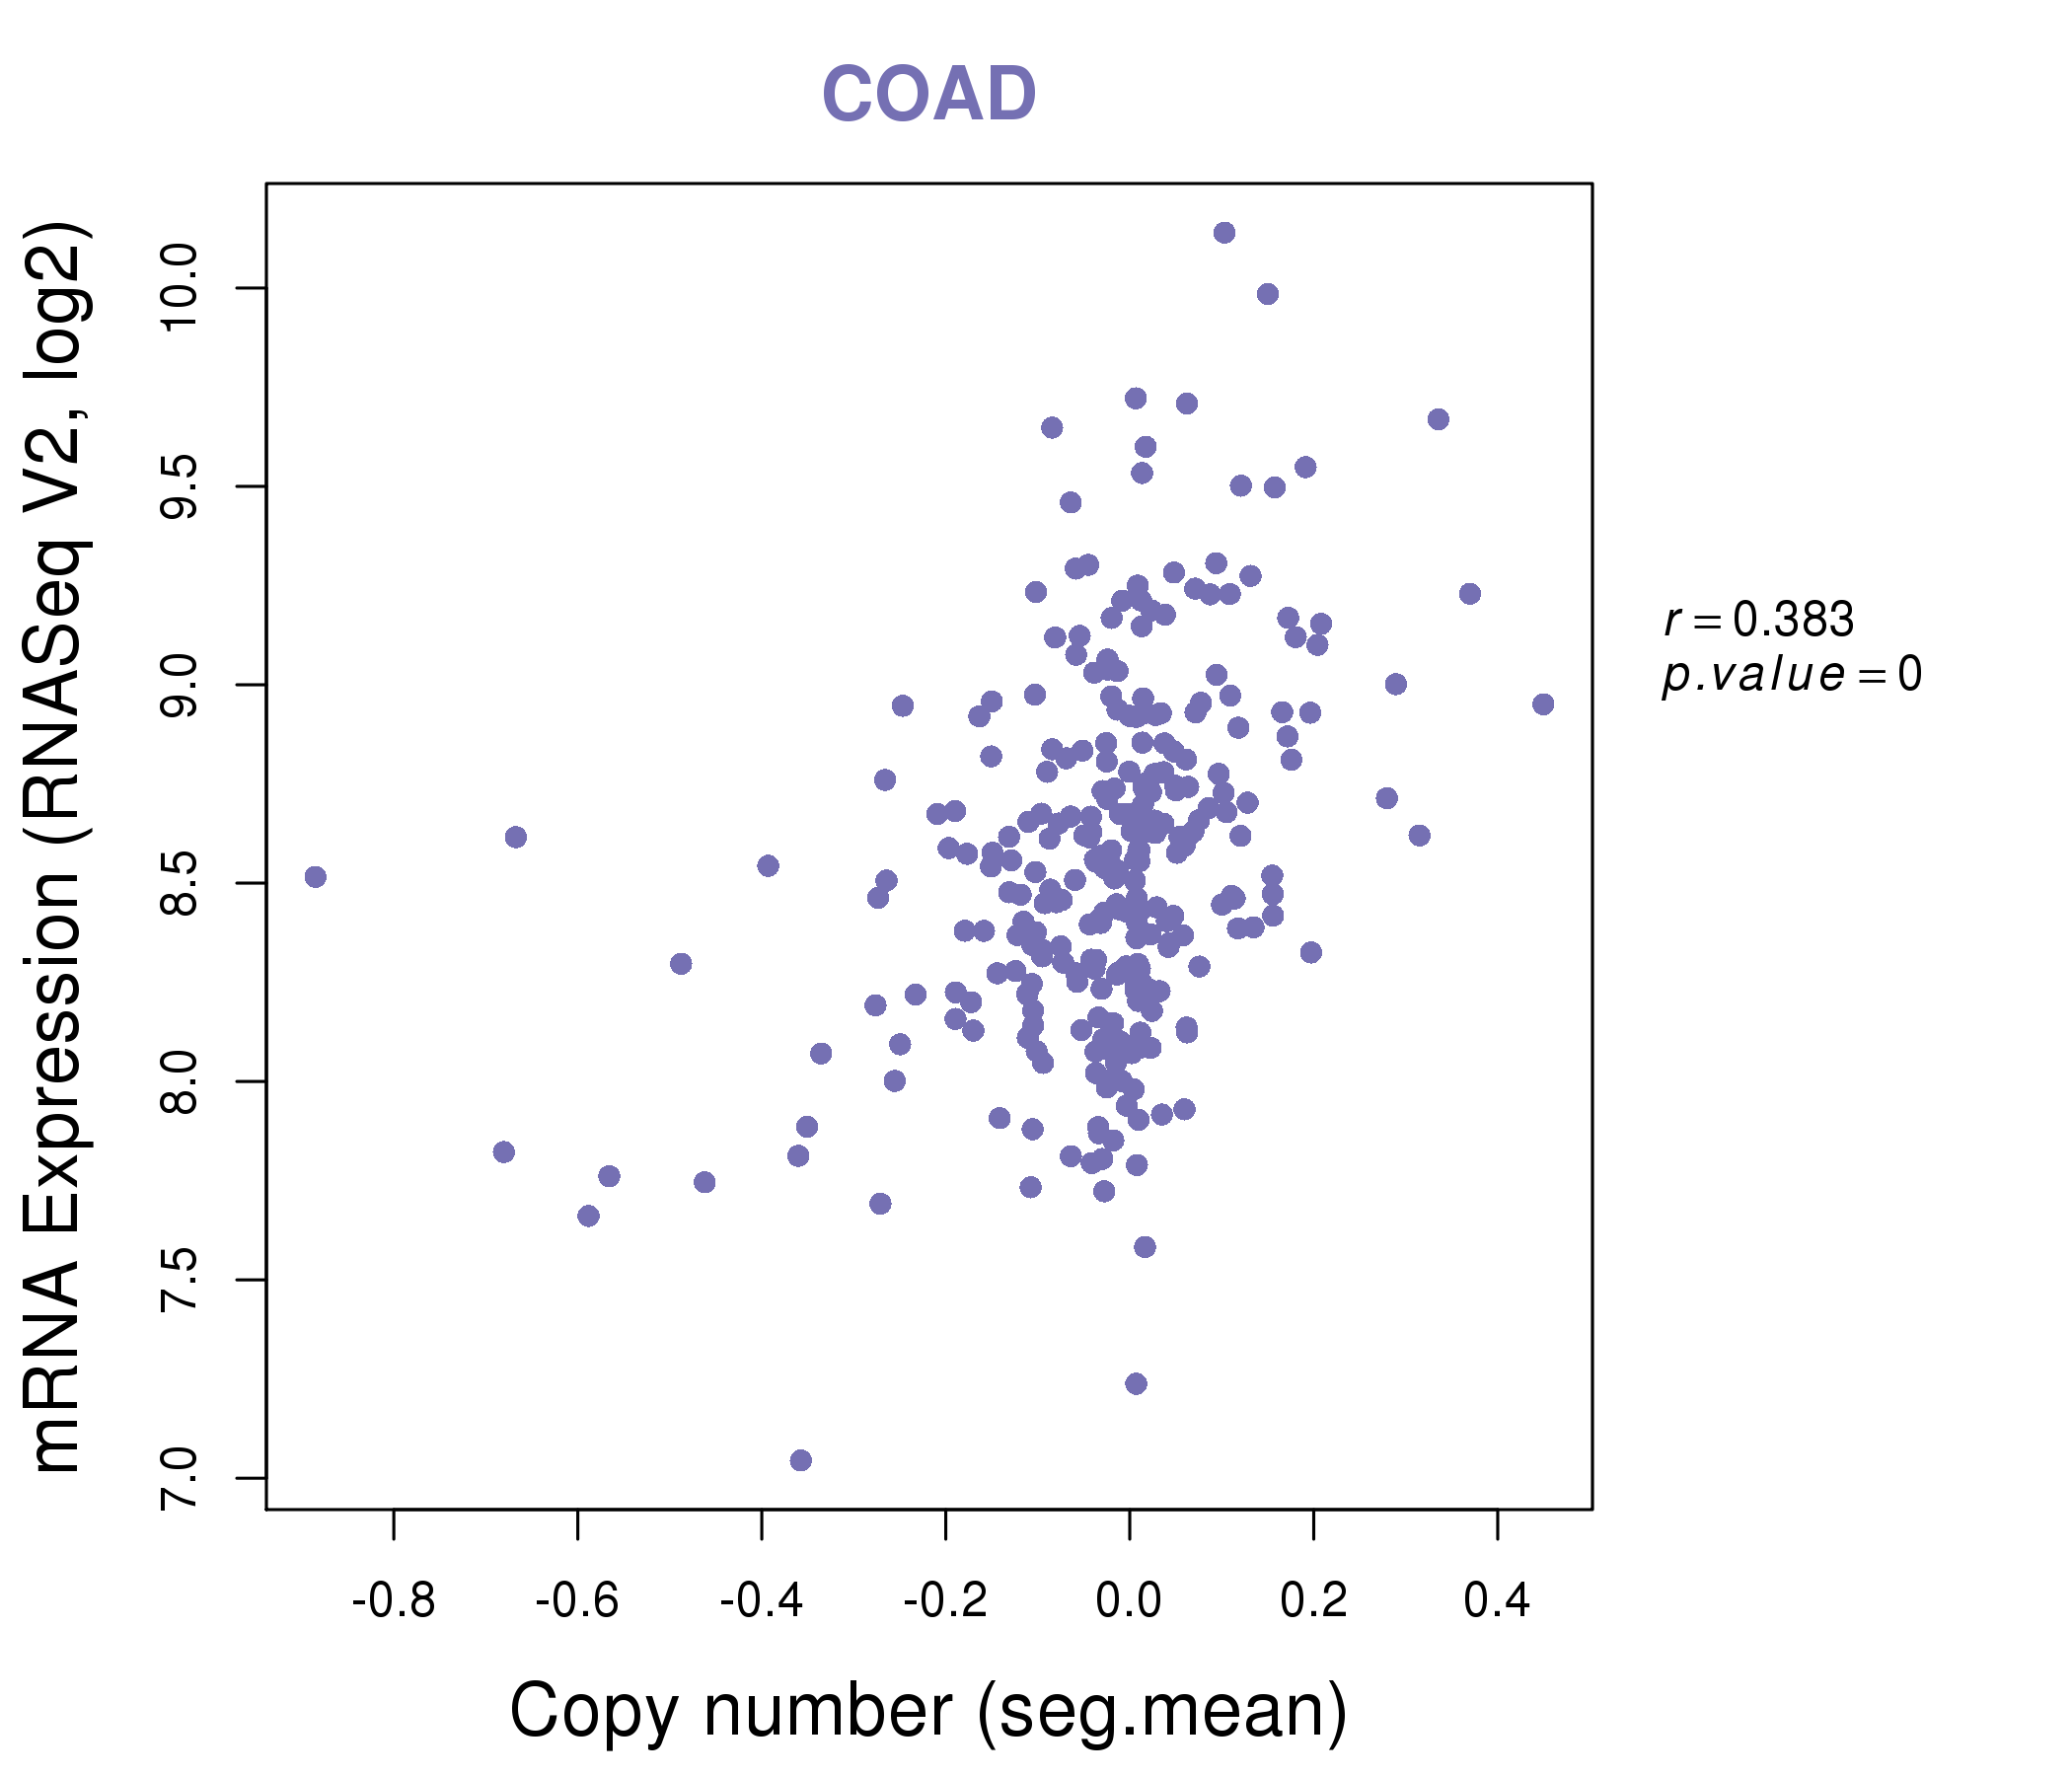
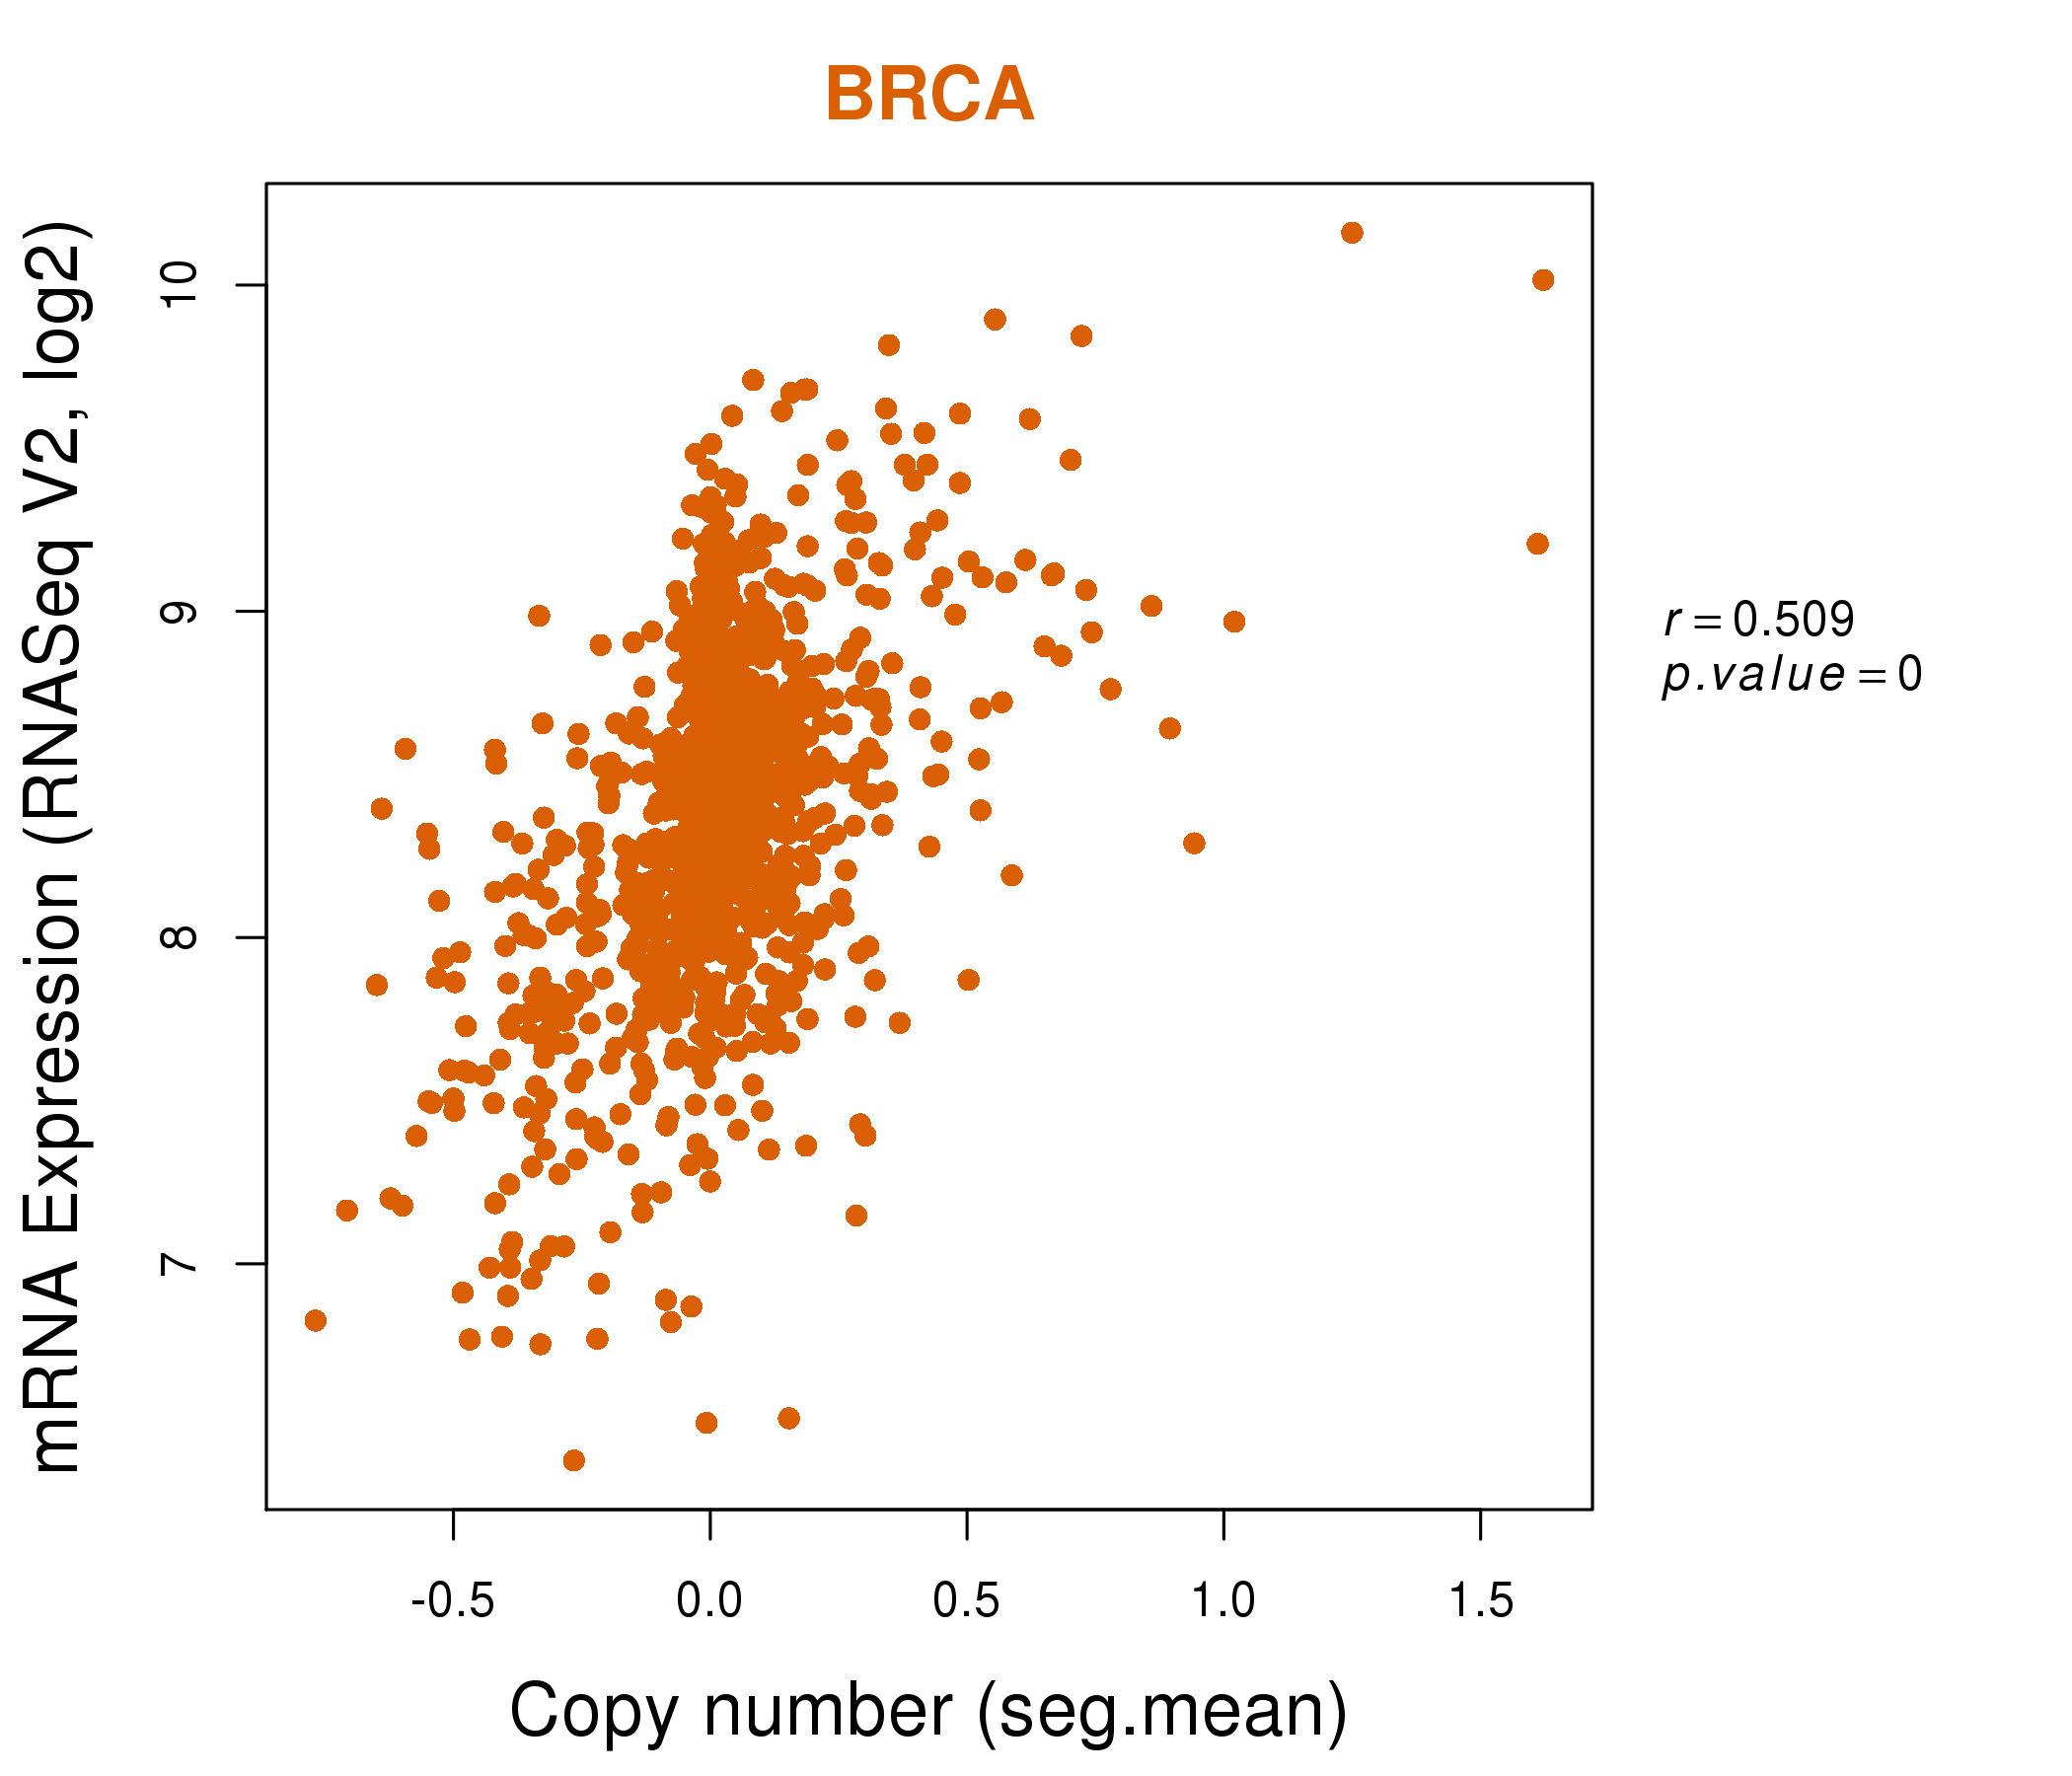
| * This plots show the correlation between CNV and gene expression. |
: Open all plots for all cancer types
 |
|
 |
|

| Top |
| Gene-Gene Network Information |
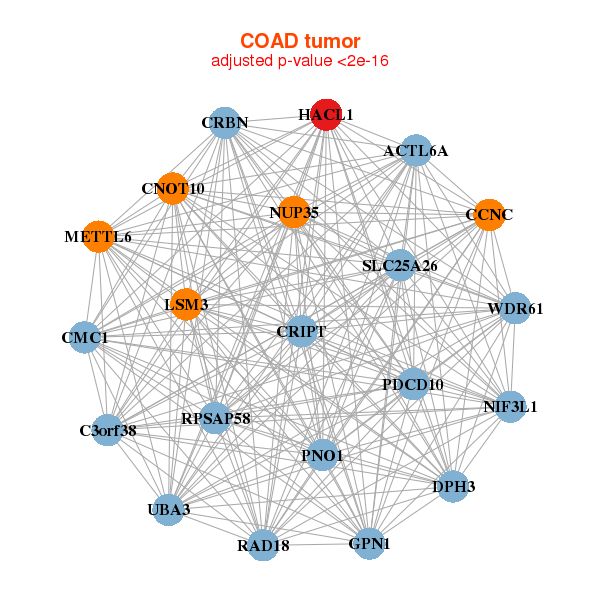
| * Co-Expression network figures were drawn using R package igraph. Only the top 20 genes with the highest correlations were shown. Red circle: input gene, orange circle: cell metabolism gene, sky circle: other gene |
: Open all plots for all cancer types
 |
|
| ANKRD28,BTD,C10orf32,CAPN7,CRBN,DPH3,EAF1, HACL1,LZTFL1,METTL6,MLH1,NGLY1,OXNAD1,PHF7, PHOSPHO2,RAD18,RBKS,THUMPD3,TOP2B,XPC,ZFYVE20 | ACO1,ASPH,BTD,CALB2,CAV1,CAV2,DHDDS, GLYAT,HACL1,HRASLS5,ITGB1BP1,MGST1,MMD,MRAS, PALMD,PLIN1,PYGL,RTN3,TK2,TSPAN3,VKORC1L1 |
 |
|
| ACTL6A,C3orf38,CCNC,CMC1,CNOT10,CRBN,CRIPT, DPH3,GPN1,HACL1,LSM3,METTL6,NIF3L1,NUP35, PDCD10,PNO1,RAD18,RPSAP58,SLC25A26,UBA3,WDR61 | AIG1,AKR1A1,ASAH2,TMEM256,TMEM252,CYB5A,F11, GATA5,GCHFR,GOLT1A,HACL1,HOXC9,LOC201651,MMEL1, MS4A15,OAT,OTC,RNF141,SAT2,SLC25A15,TMEM41A |


| * Co-Expression network figures were drawn using R package igraph. Only the top 20 genes with the highest correlations were shown. Red circle: input gene, orange circle: cell metabolism gene, sky circle: other gene |
: Open all plots for all cancer types
| Top |
: Open all interacting genes' information including KEGG pathway for all interacting genes from DAVID
| Top |
| Pharmacological Information for HACL1 |
| There's no related Drug. |
| Top |
| Cross referenced IDs for HACL1 |
| * We obtained these cross-references from Uniprot database. It covers 150 different DBs, 18 categories. http://www.uniprot.org/help/cross_references_section |
: Open all cross reference information
|
Copyright © 2016-Present - The Univsersity of Texas Health Science Center at Houston @ |