|
||||||||||||||||||||
| |
| Phenotypic Information (metabolism pathway, cancer, disease, phenome) |
| |
| |
| Gene-Gene Network Information: Co-Expression Network, Interacting Genes & KEGG |
| |
|


| Gene Summary for GART |
| Top |
| Phenotypic Information for GART(metabolism pathway, cancer, disease, phenome) |
| Cancer | CGAP: GART |
| Familial Cancer Database: GART | |
| * This gene is included in those cancer gene databases. |
|
|
|
|
|
| . | ||||||||||||||
Oncogene 1 | Significant driver gene in | |||||||||||||||||||
| cf) number; DB name 1 Oncogene; http://nar.oxfordjournals.org/content/35/suppl_1/D721.long, 2 Tumor Suppressor gene; https://bioinfo.uth.edu/TSGene/, 3 Cancer Gene Census; http://www.nature.com/nrc/journal/v4/n3/abs/nrc1299.html, 4 CancerGenes; http://nar.oxfordjournals.org/content/35/suppl_1/D721.long, 5 Network of Cancer Gene; http://ncg.kcl.ac.uk/index.php, 1Therapeutic Vulnerabilities in Cancer; http://cbio.mskcc.org/cancergenomics/statius/ |
| KEGG_PURINE_METABOLISM REACTOME_METABOLISM_OF_NUCLEOTIDES REACTOME_PURINE_METABOLISM | |
| OMIM | |
| Orphanet | |
| Disease | KEGG Disease: GART |
| MedGen: GART (Human Medical Genetics with Condition) | |
| ClinVar: GART | |
| Phenotype | MGI: GART (International Mouse Phenotyping Consortium) |
| PhenomicDB: GART | |
| Mutations for GART |
| * Under tables are showing count per each tissue to give us broad intuition about tissue specific mutation patterns.You can go to the detailed page for each mutation database's web site. |
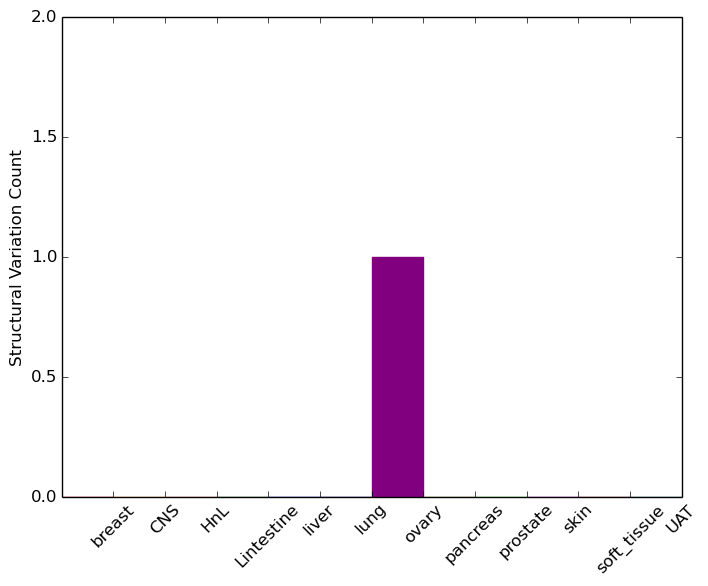
| - Statistics for Tissue and Mutation type | Top |
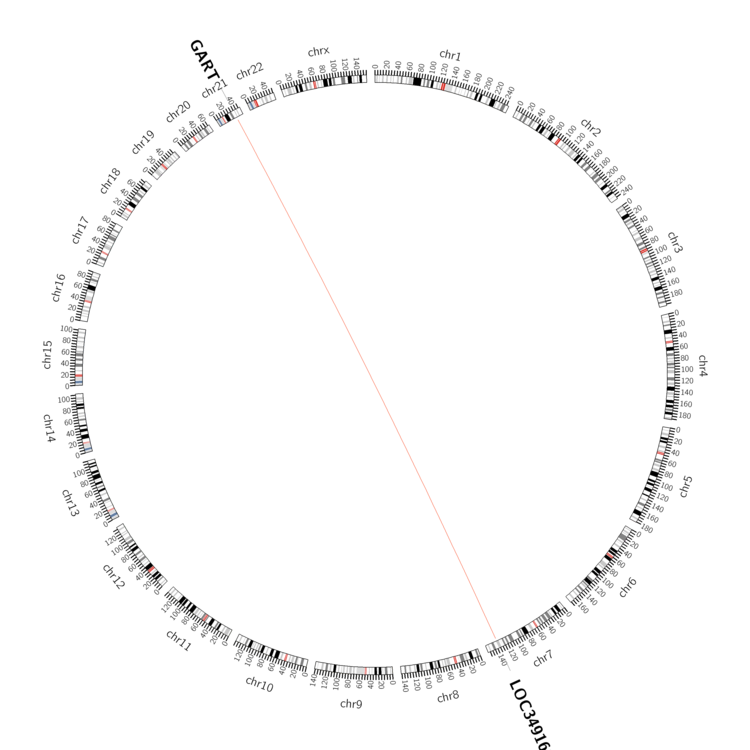 |
| - For Inter-chromosomal Variations |
| * Inter-chromosomal variantions includes 'interchromosomal amplicon to amplicon', 'interchromosomal amplicon to non-amplified dna', 'interchromosomal insertion', 'Interchromosomal unknown type'. |
 |
| - For Intra-chromosomal Variations |
| There's no intra-chromosomal structural variation. |
| Sample | Symbol_a | Chr_a | Start_a | End_a | Symbol_b | Chr_b | Start_b | End_b |
| ovary | GART | chr21 | 34913099 | 34913119 | LOC349160 | chr7 | 136721438 | 136721458 |
| cf) Tissue number; Tissue name (1;Breast, 2;Central_nervous_system, 3;Haematopoietic_and_lymphoid_tissue, 4;Large_intestine, 5;Liver, 6;Lung, 7;Ovary, 8;Pancreas, 9;Prostate, 10;Skin, 11;Soft_tissue, 12;Upper_aerodigestive_tract) |
| * From mRNA Sanger sequences, Chitars2.0 arranged chimeric transcripts. This table shows GART related fusion information. |
| ID | Head Gene | Tail Gene | Accession | Gene_a | qStart_a | qEnd_a | Chromosome_a | tStart_a | tEnd_a | Gene_a | qStart_a | qEnd_a | Chromosome_a | tStart_a | tEnd_a |
| BF763230 | GART | 4 | 244 | 21 | 34887290 | 34887528 | FCHO2 | 229 | 330 | 5 | 72359704 | 72364512 | |
| BE147859 | GART | 28 | 129 | 21 | 34891486 | 34891587 | VCP | 125 | 422 | 9 | 35070176 | 35070473 | |
| Top |
| There's no copy number variation information in COSMIC data for this gene. |
| Top |
|
 |
| Top |
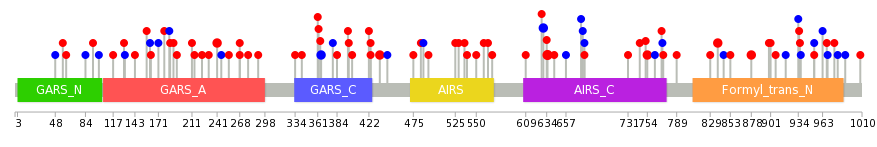
| Stat. for Non-Synonymous SNVs (# total SNVs=51) | (# total SNVs=24) |
 |  |
(# total SNVs=5) | (# total SNVs=1) |
 |  |
| Top |
| * When you move the cursor on each content, you can see more deailed mutation information on the Tooltip. Those are primary_site,primary_histology,mutation(aa),pubmedID. |
| GRCh37 position | Mutation(aa) | Unique sampleID count |
| chr21:34882122-34882122 | p.K807fs*7 | 7 |
| chr21:34889714-34889714 | p.S635F | 3 |
| chr21:34877961-34877961 | p.I878V | 2 |
| chr21:34883613-34883613 | p.Q754K | 2 |
| chr21:34894583-34894583 | p.L435F | 2 |
| chr21:34903066-34903066 | p.Q241R | 2 |
| chr21:34878352-34878352 | p.D838N | 2 |
| chr21:34889728-34889728 | p.I630I | 2 |
| chr21:34882121-34882122 | p.A808fs*26 | 2 |
| chr21:34889295-34889295 | p.? | 2 |
| Top |
|
 |
| Point Mutation/ Tissue ID | 1 | 2 | 3 | 4 | 5 | 6 | 7 | 8 | 9 | 10 | 11 | 12 | 13 | 14 | 15 | 16 | 17 | 18 | 19 | 20 |
| # sample | 1 | 3 | 6 | 6 | 2 | 11 | 4 | 1 | 1 | 10 | 7 | 1 | 8 | |||||||
| # mutation | 1 | 3 | 6 | 7 | 2 | 11 | 4 | 1 | 1 | 9 | 7 | 1 | 12 | |||||||
| nonsynonymous SNV | 1 | 1 | 3 | 3 | 2 | 5 | 3 | 1 | 1 | 7 | 4 | 9 | ||||||||
| synonymous SNV | 2 | 3 | 4 | 6 | 1 | 2 | 3 | 1 | 3 |
| cf) Tissue ID; Tissue type (1; BLCA[Bladder Urothelial Carcinoma], 2; BRCA[Breast invasive carcinoma], 3; CESC[Cervical squamous cell carcinoma and endocervical adenocarcinoma], 4; COAD[Colon adenocarcinoma], 5; GBM[Glioblastoma multiforme], 6; Glioma Low Grade, 7; HNSC[Head and Neck squamous cell carcinoma], 8; KICH[Kidney Chromophobe], 9; KIRC[Kidney renal clear cell carcinoma], 10; KIRP[Kidney renal papillary cell carcinoma], 11; LAML[Acute Myeloid Leukemia], 12; LUAD[Lung adenocarcinoma], 13; LUSC[Lung squamous cell carcinoma], 14; OV[Ovarian serous cystadenocarcinoma ], 15; PAAD[Pancreatic adenocarcinoma], 16; PRAD[Prostate adenocarcinoma], 17; SKCM[Skin Cutaneous Melanoma], 18:STAD[Stomach adenocarcinoma], 19:THCA[Thyroid carcinoma], 20:UCEC[Uterine Corpus Endometrial Carcinoma]) |
| Top |
| * We represented just top 10 SNVs. When you move the cursor on each content, you can see more deailed mutation information on the Tooltip. Those are primary_site, primary_histology, mutation(aa), pubmedID. |
| Genomic Position | Mutation(aa) | Unique sampleID count |
| chr21:34889714 | p.S635F,GART | 2 |
| chr21:34903066 | p.R829R,GART | 2 |
| chr21:34878379 | p.Q241R,GART | 2 |
| chr21:34876575 | p.L919L,GART | 1 |
| chr21:34897104 | p.T657T,GART | 1 |
| chr21:34878381 | p.L365L,GART | 1 |
| chr21:34901165 | p.E190D,GART | 1 |
| chr21:34889690 | p.W907G,GART | 1 |
| chr21:34904694 | p.L656L,GART | 1 |
| chr21:34876749 | p.L365L,GART | 1 |
| * Copy number data were extracted from TCGA using R package TCGA-Assembler. The URLs of all public data files on TCGA DCC data server were gathered on Jan-05-2015. Function ProcessCNAData in TCGA-Assembler package was used to obtain gene-level copy number value which is calculated as the average copy number of the genomic region of a gene. |
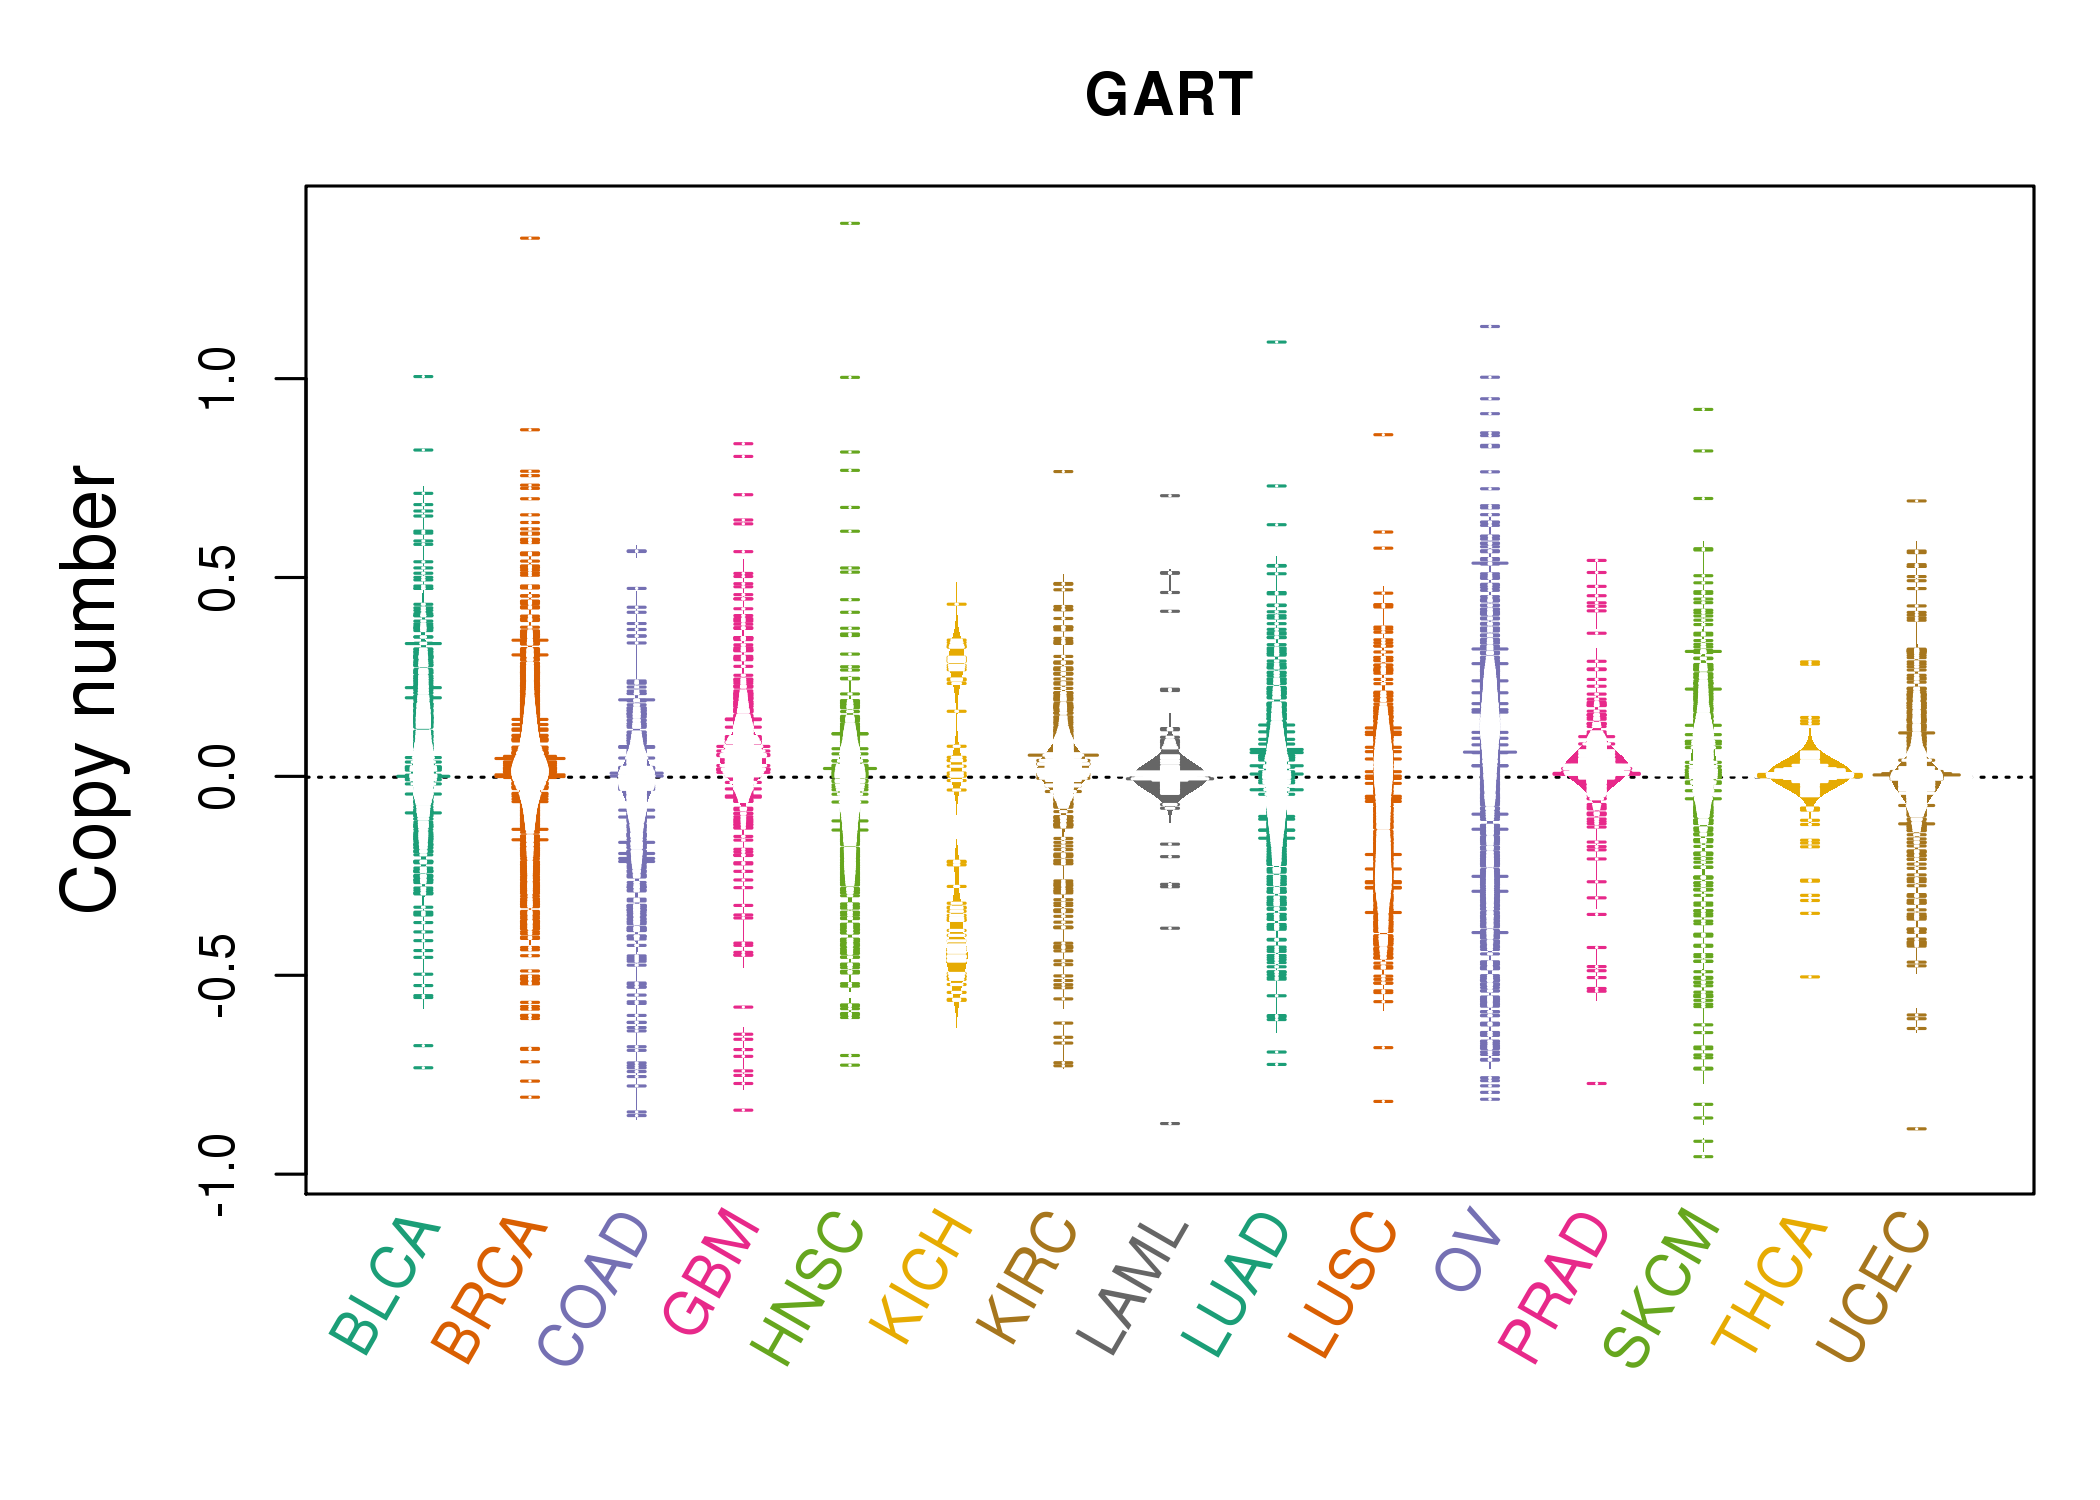 |
| cf) Tissue ID[Tissue type]: BLCA[Bladder Urothelial Carcinoma], BRCA[Breast invasive carcinoma], CESC[Cervical squamous cell carcinoma and endocervical adenocarcinoma], COAD[Colon adenocarcinoma], GBM[Glioblastoma multiforme], Glioma Low Grade, HNSC[Head and Neck squamous cell carcinoma], KICH[Kidney Chromophobe], KIRC[Kidney renal clear cell carcinoma], KIRP[Kidney renal papillary cell carcinoma], LAML[Acute Myeloid Leukemia], LUAD[Lung adenocarcinoma], LUSC[Lung squamous cell carcinoma], OV[Ovarian serous cystadenocarcinoma ], PAAD[Pancreatic adenocarcinoma], PRAD[Prostate adenocarcinoma], SKCM[Skin Cutaneous Melanoma], STAD[Stomach adenocarcinoma], THCA[Thyroid carcinoma], UCEC[Uterine Corpus Endometrial Carcinoma] |
| Top |
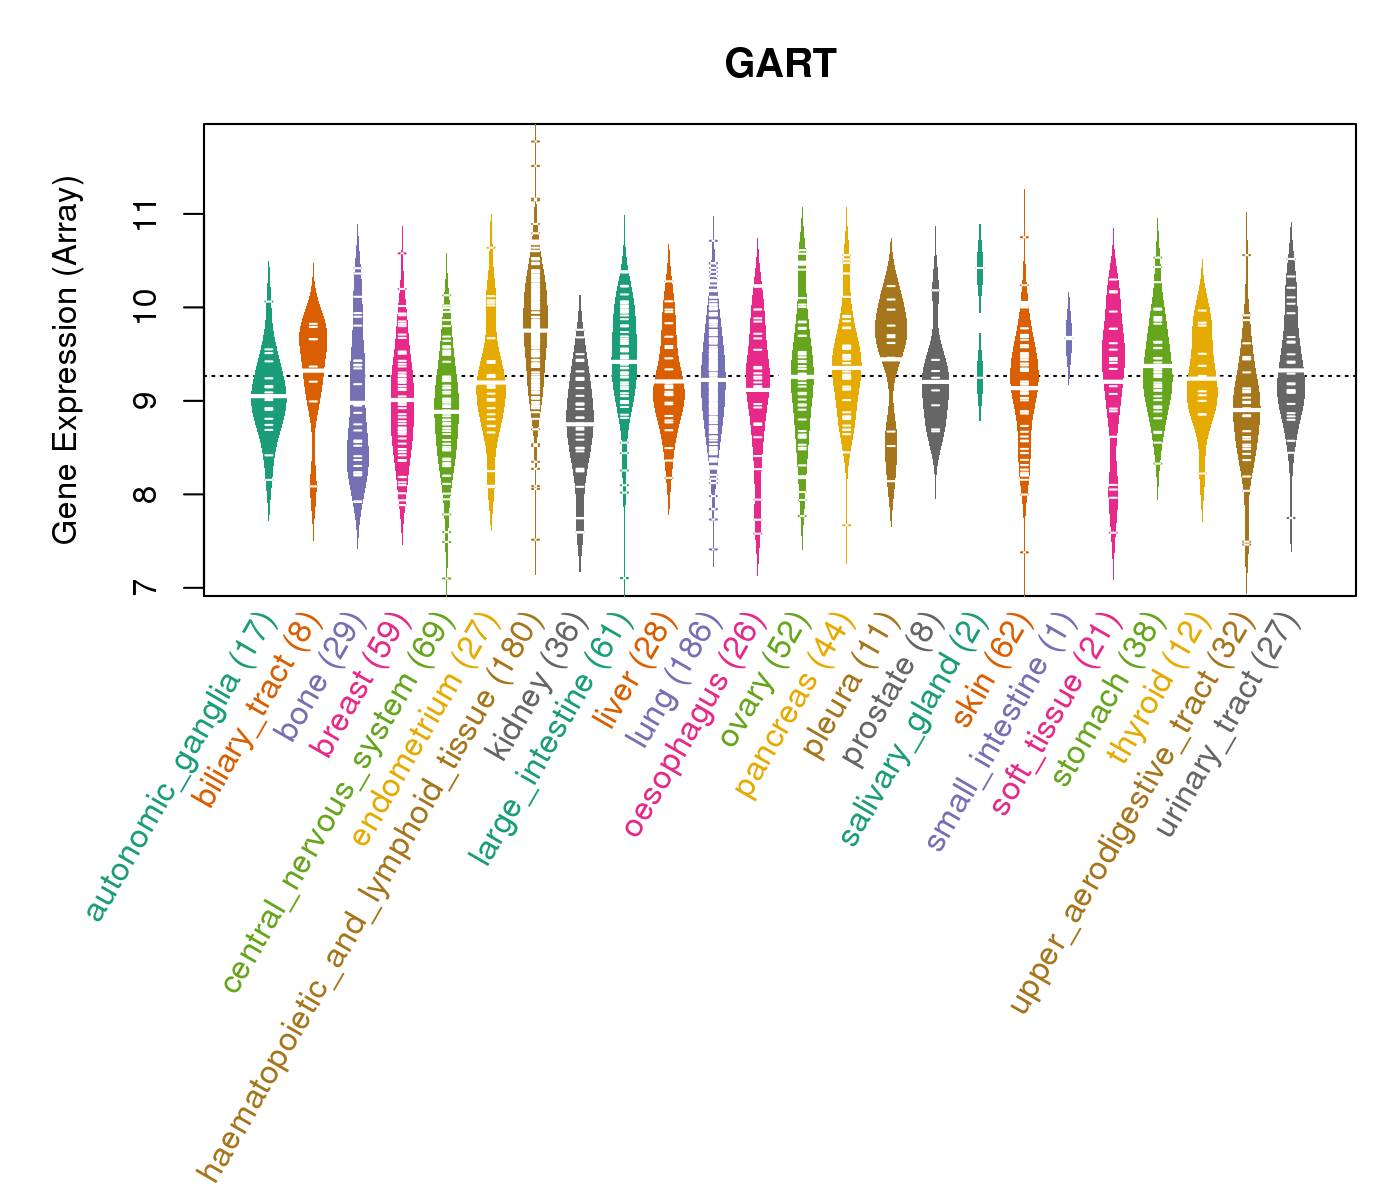
| Gene Expression for GART |
| * CCLE gene expression data were extracted from CCLE_Expression_Entrez_2012-10-18.res: Gene-centric RMA-normalized mRNA expression data. |
 |
| * Normalized gene expression data of RNASeqV2 was extracted from TCGA using R package TCGA-Assembler. The URLs of all public data files on TCGA DCC data server were gathered at Jan-05-2015. Only eight cancer types have enough normal control samples for differential expression analysis. (t test, adjusted p<0.05 (using Benjamini-Hochberg FDR)) |
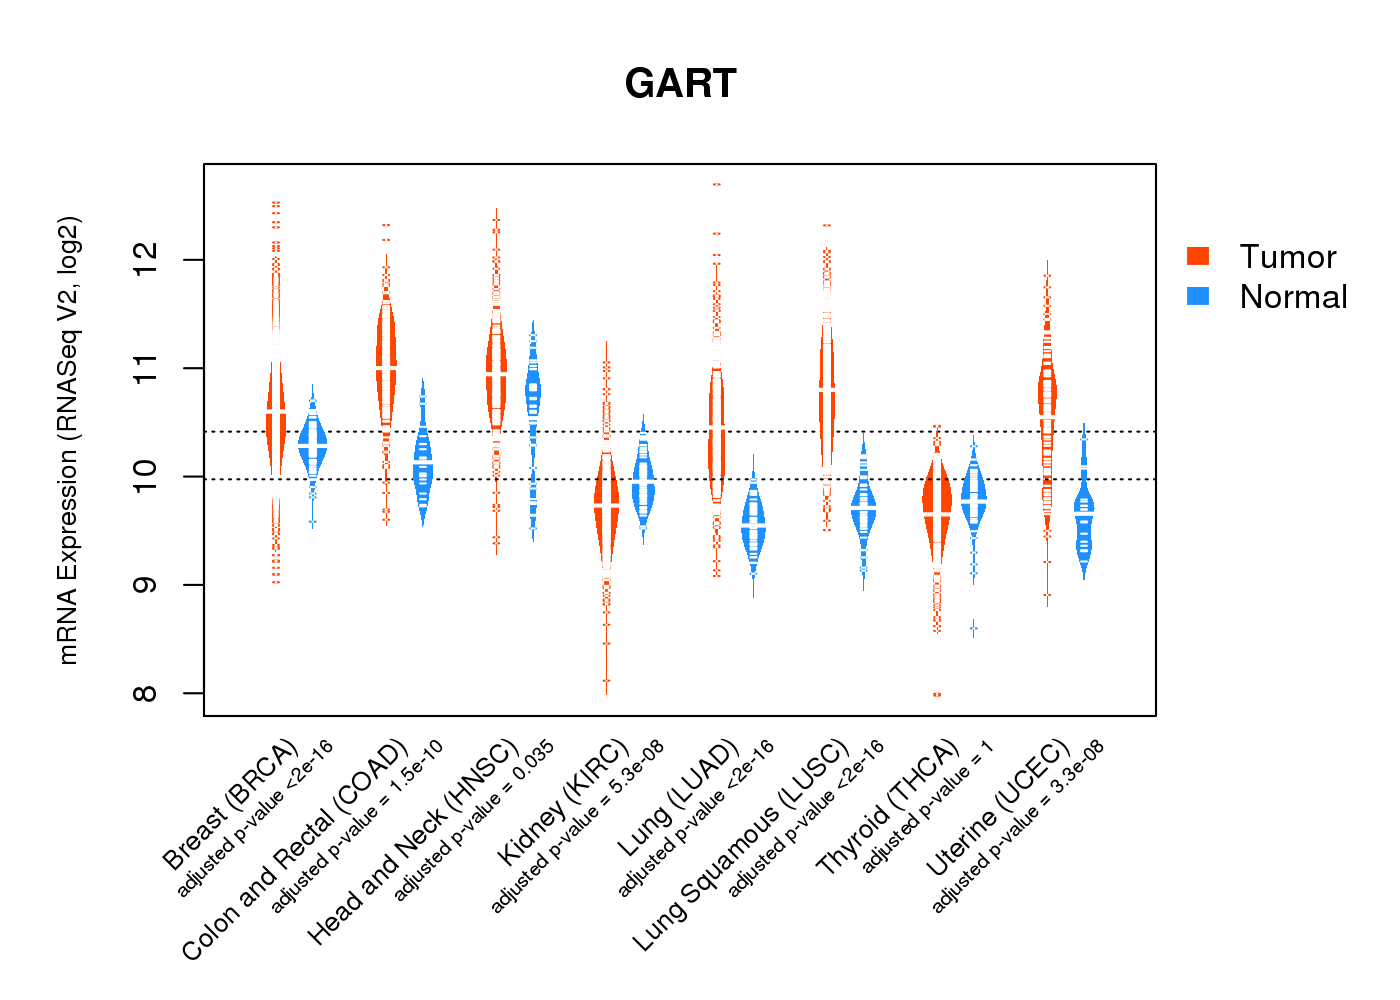 |
| Top |
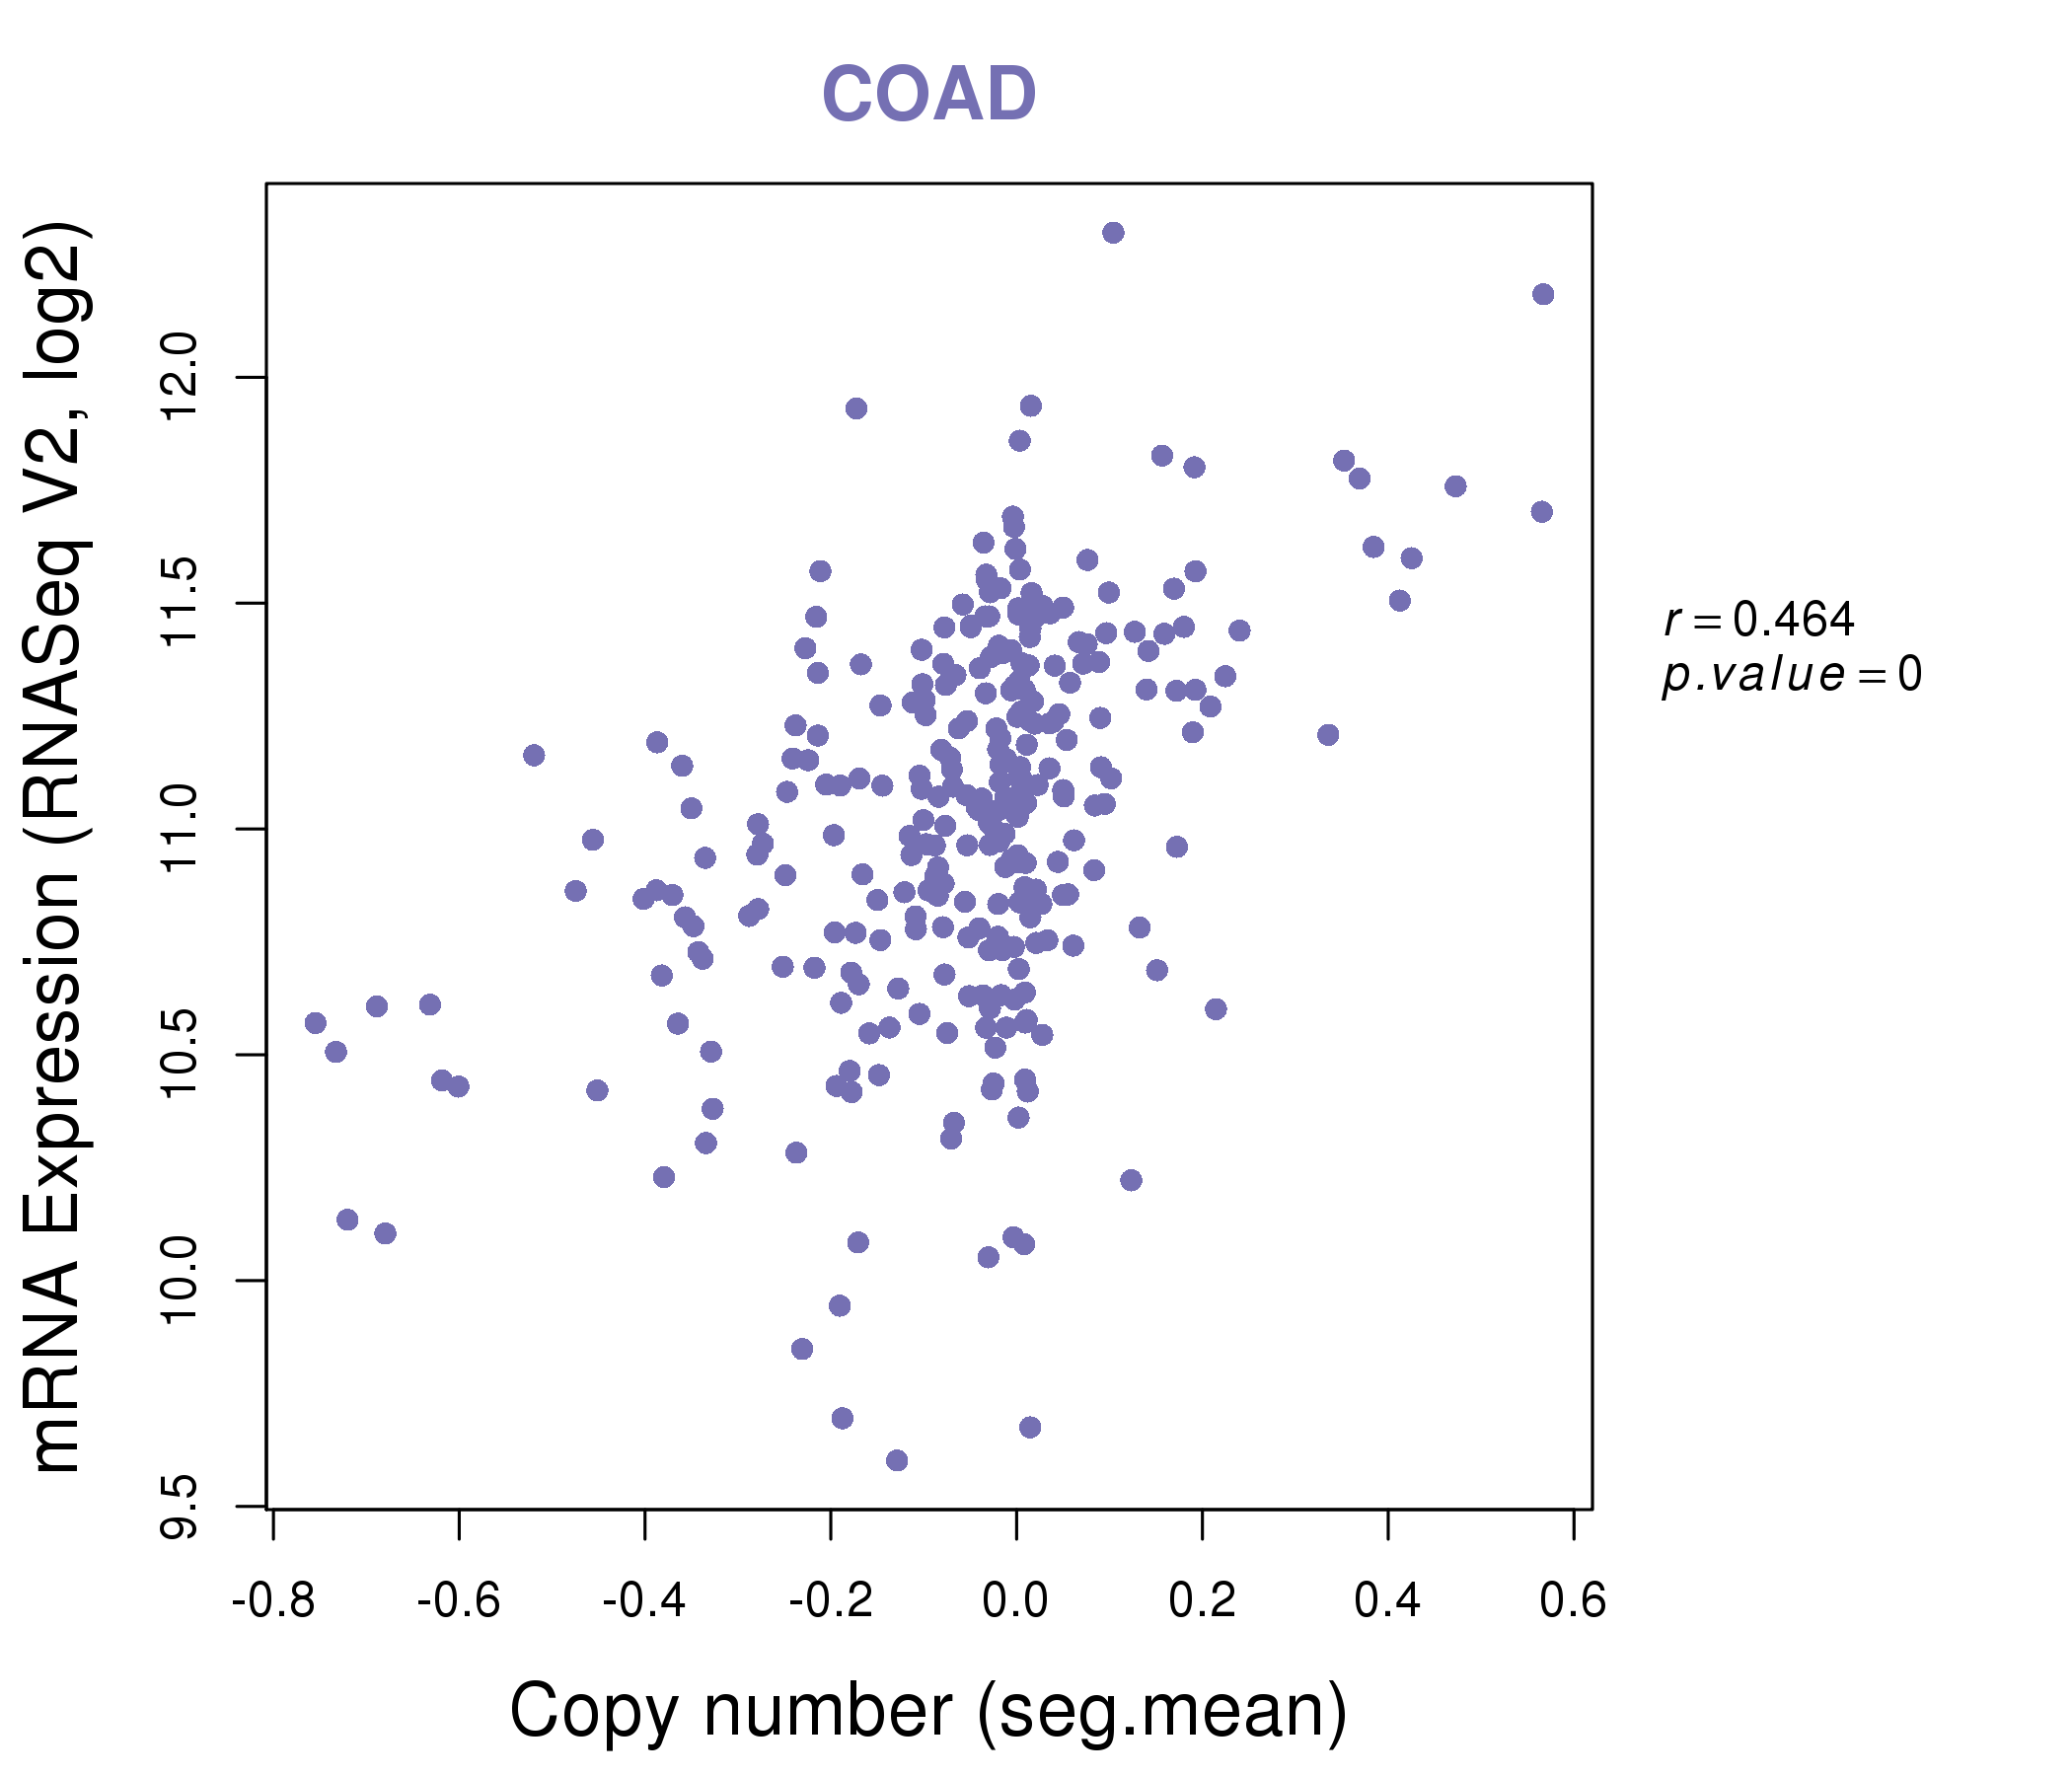
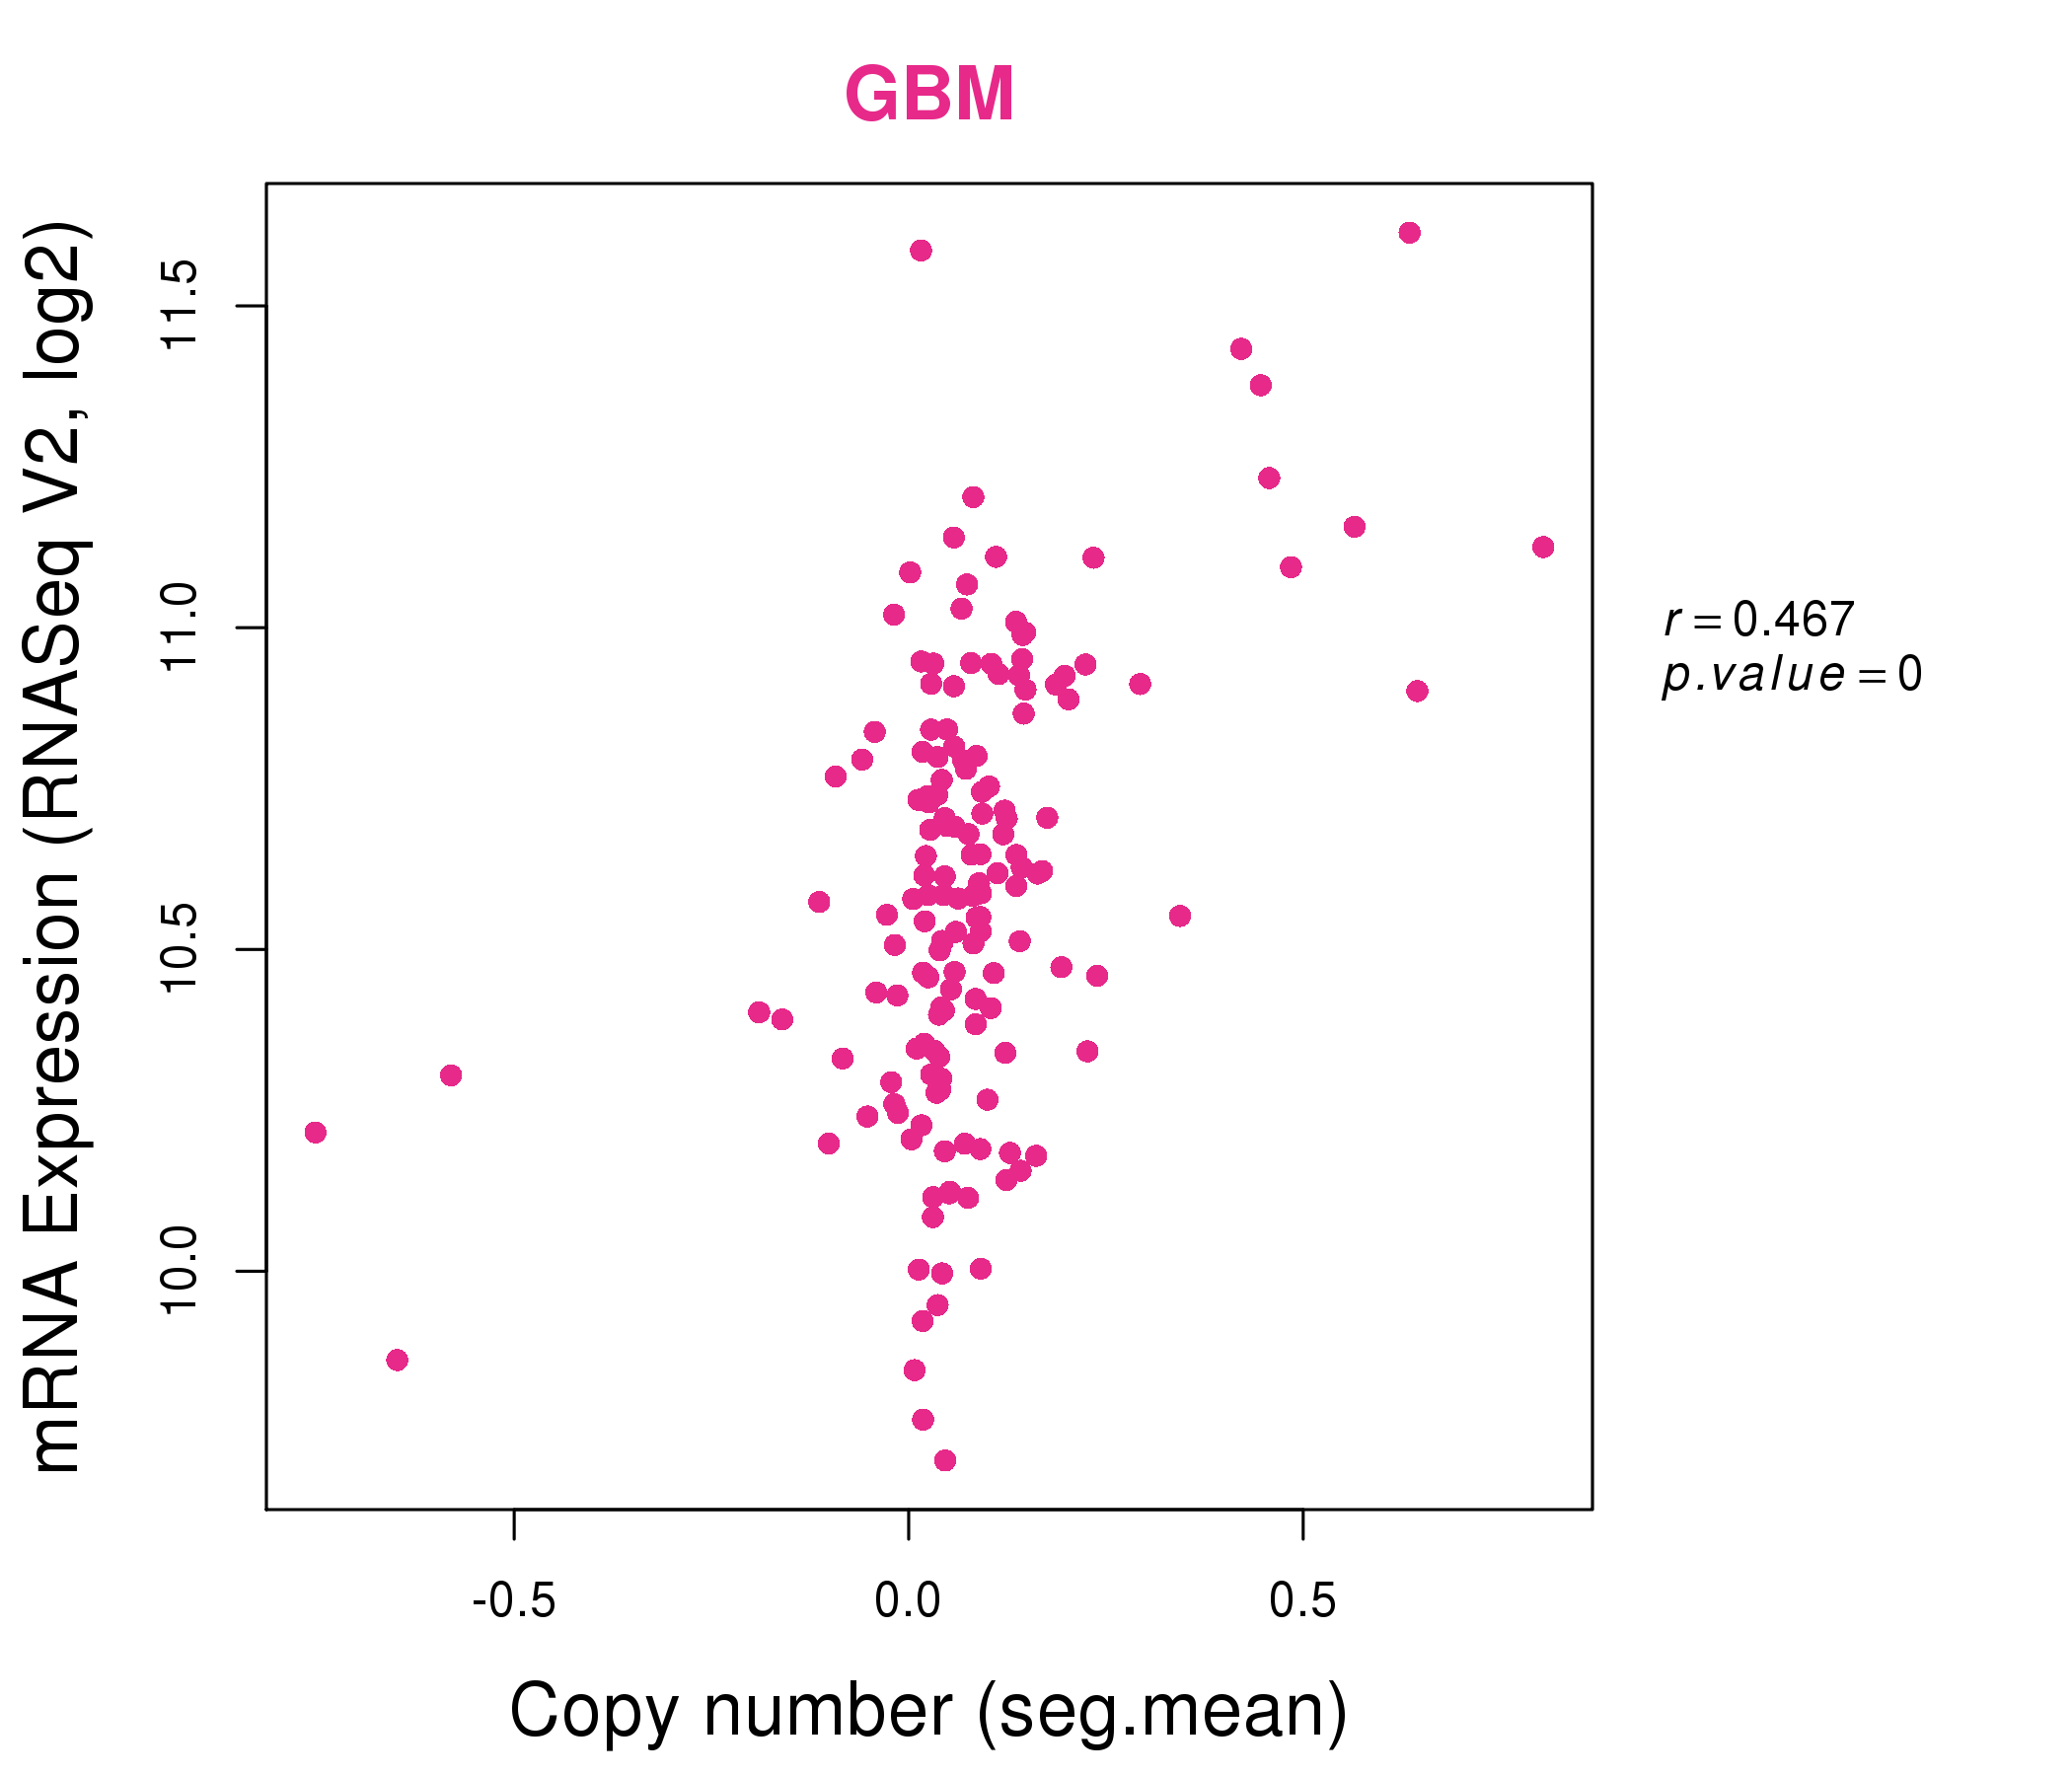
| * This plots show the correlation between CNV and gene expression. |
: Open all plots for all cancer types
 |
|
 |
|

| Top |
| Gene-Gene Network Information |
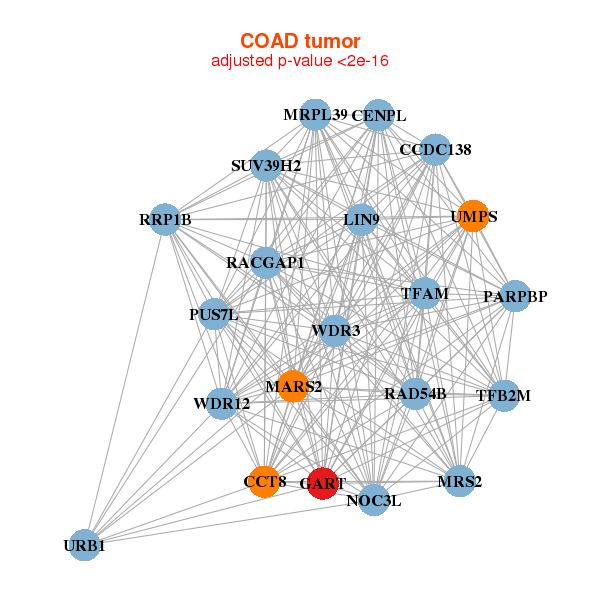
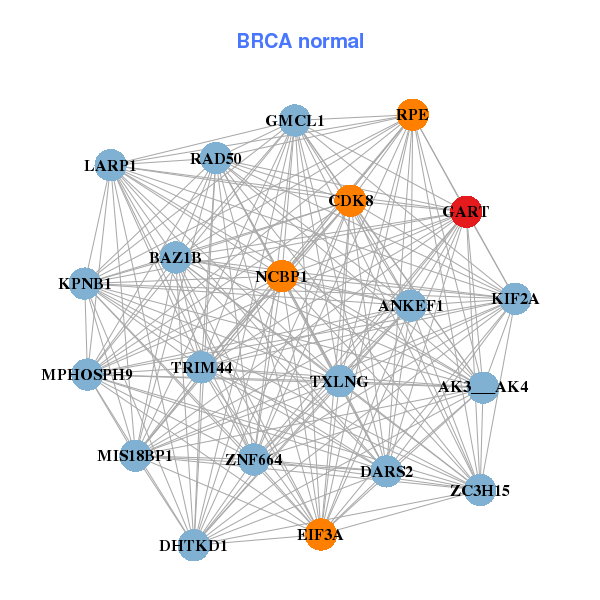
| * Co-Expression network figures were drawn using R package igraph. Only the top 20 genes with the highest correlations were shown. Red circle: input gene, orange circle: cell metabolism gene, sky circle: other gene |
: Open all plots for all cancer types
 |
| ||||
| COA7,CHAF1B,CHEK1,DONSON,EXO1,GART,GMPS, GSG2,GTPBP4,MSH2,NUP205,ORC1,RRP1B,SCAF4, SRPK1,STIL,SUV39H2,TEX10,TTK,URB1,WDR43 | AK3___AK4,ANKEF1,BAZ1B,MIS18BP1,CDK8,DARS2,DHTKD1, EIF3A,GART,GMCL1,KIF2A,KPNB1,LARP1,MPHOSPH9, NCBP1,RAD50,RPE,TRIM44,TXLNG,ZC3H15,ZNF664 | ||||
 |
| ||||
| PARPBP,CCDC138,CCT8,CENPL,GART,LIN9,MARS2, MRPL39,MRS2,NOC3L,PUS7L,RACGAP1,RAD54B,RRP1B, SUV39H2,TFAM,TFB2M,UMPS,URB1,WDR12,WDR3 | DDIAS,ASUN,CCT2,GART,GINS1,GINS3,H2AFZ, ILF2,MCM6,MRPL3,NUP85,POLE2,RAN,RFC3, RQCD1,SNRPD1,SUV39H2,TFDP1,UTP6,VRK1,WDR77 |

| * Co-Expression network figures were drawn using R package igraph. Only the top 20 genes with the highest correlations were shown. Red circle: input gene, orange circle: cell metabolism gene, sky circle: other gene |
: Open all plots for all cancer types
| Top |
: Open all interacting genes' information including KEGG pathway for all interacting genes from DAVID
| Top |
| Pharmacological Information for GART |
| DB Category | DB Name | DB's ID and Url link |
| * Gene Centered Interaction Network. |
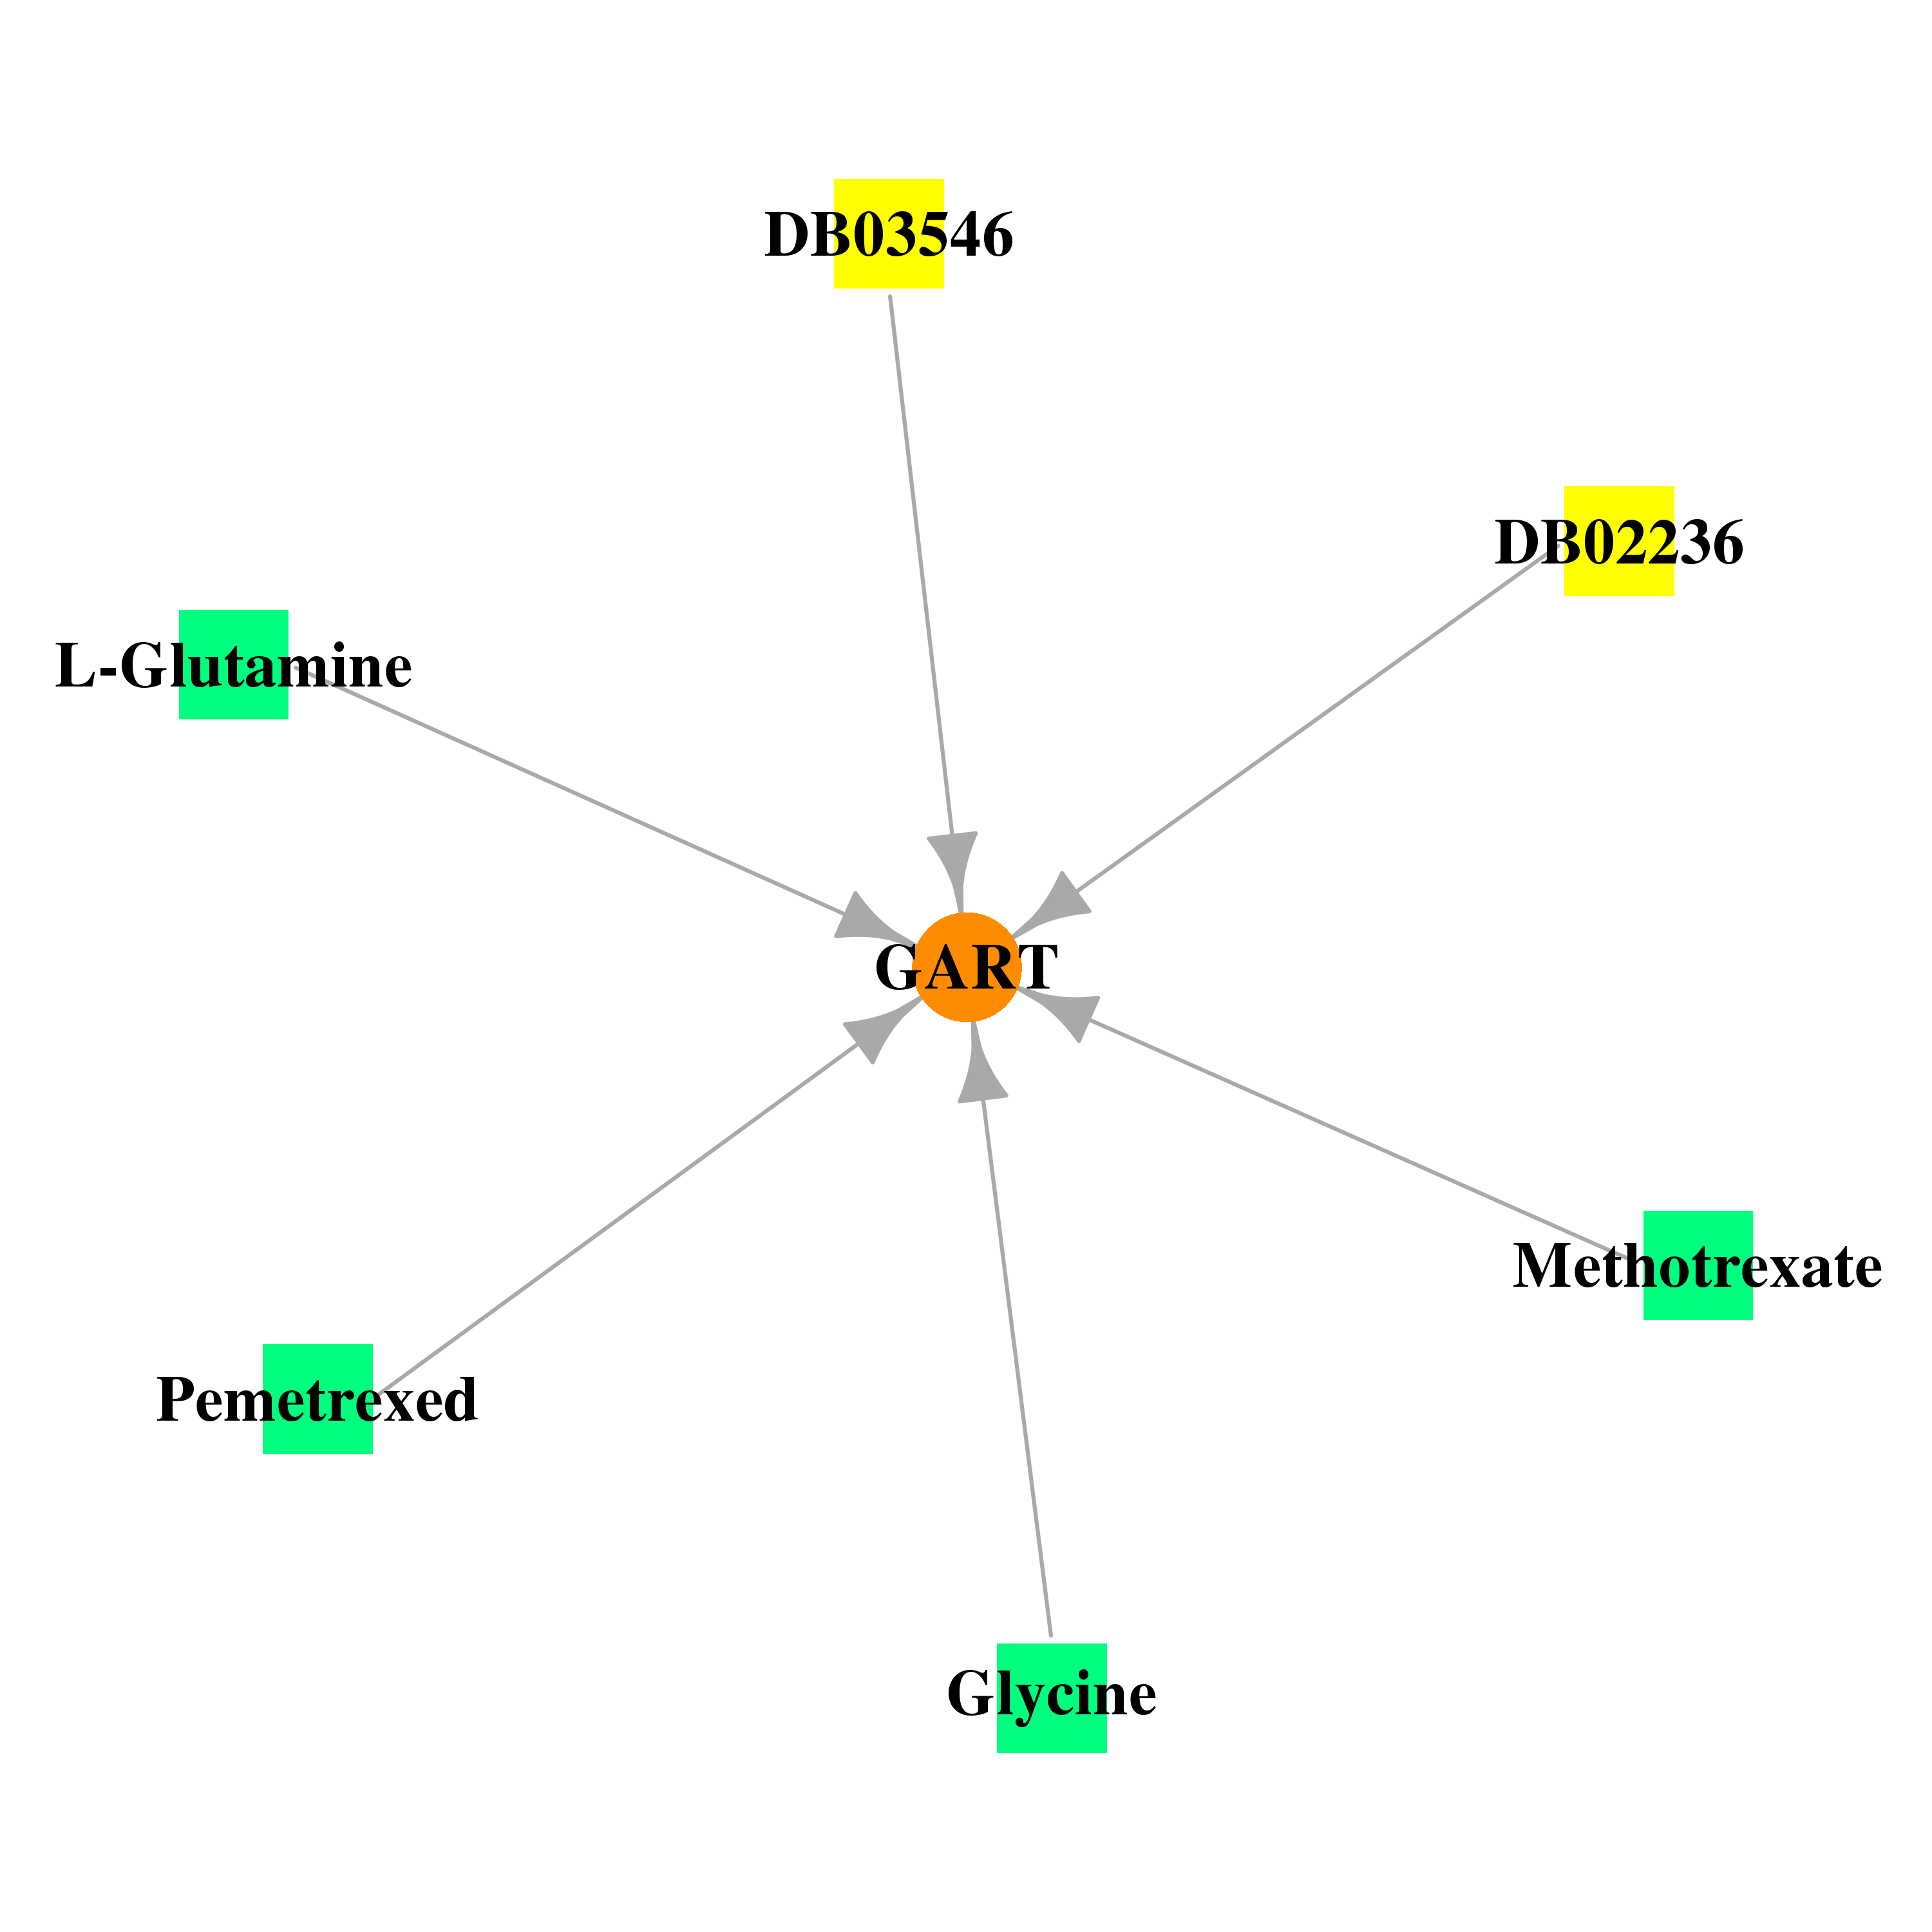 |
| * Drug Centered Interaction Network. |
| DrugBank ID | Target Name | Drug Groups | Generic Name | Drug Centered Network | Drug Structure |
| DB00642 | phosphoribosylglycinamide formyltransferase, phosphoribosylglycinamide synthetase, phosphoribosylaminoimidazole synthetase | approved; investigational | Pemetrexed | 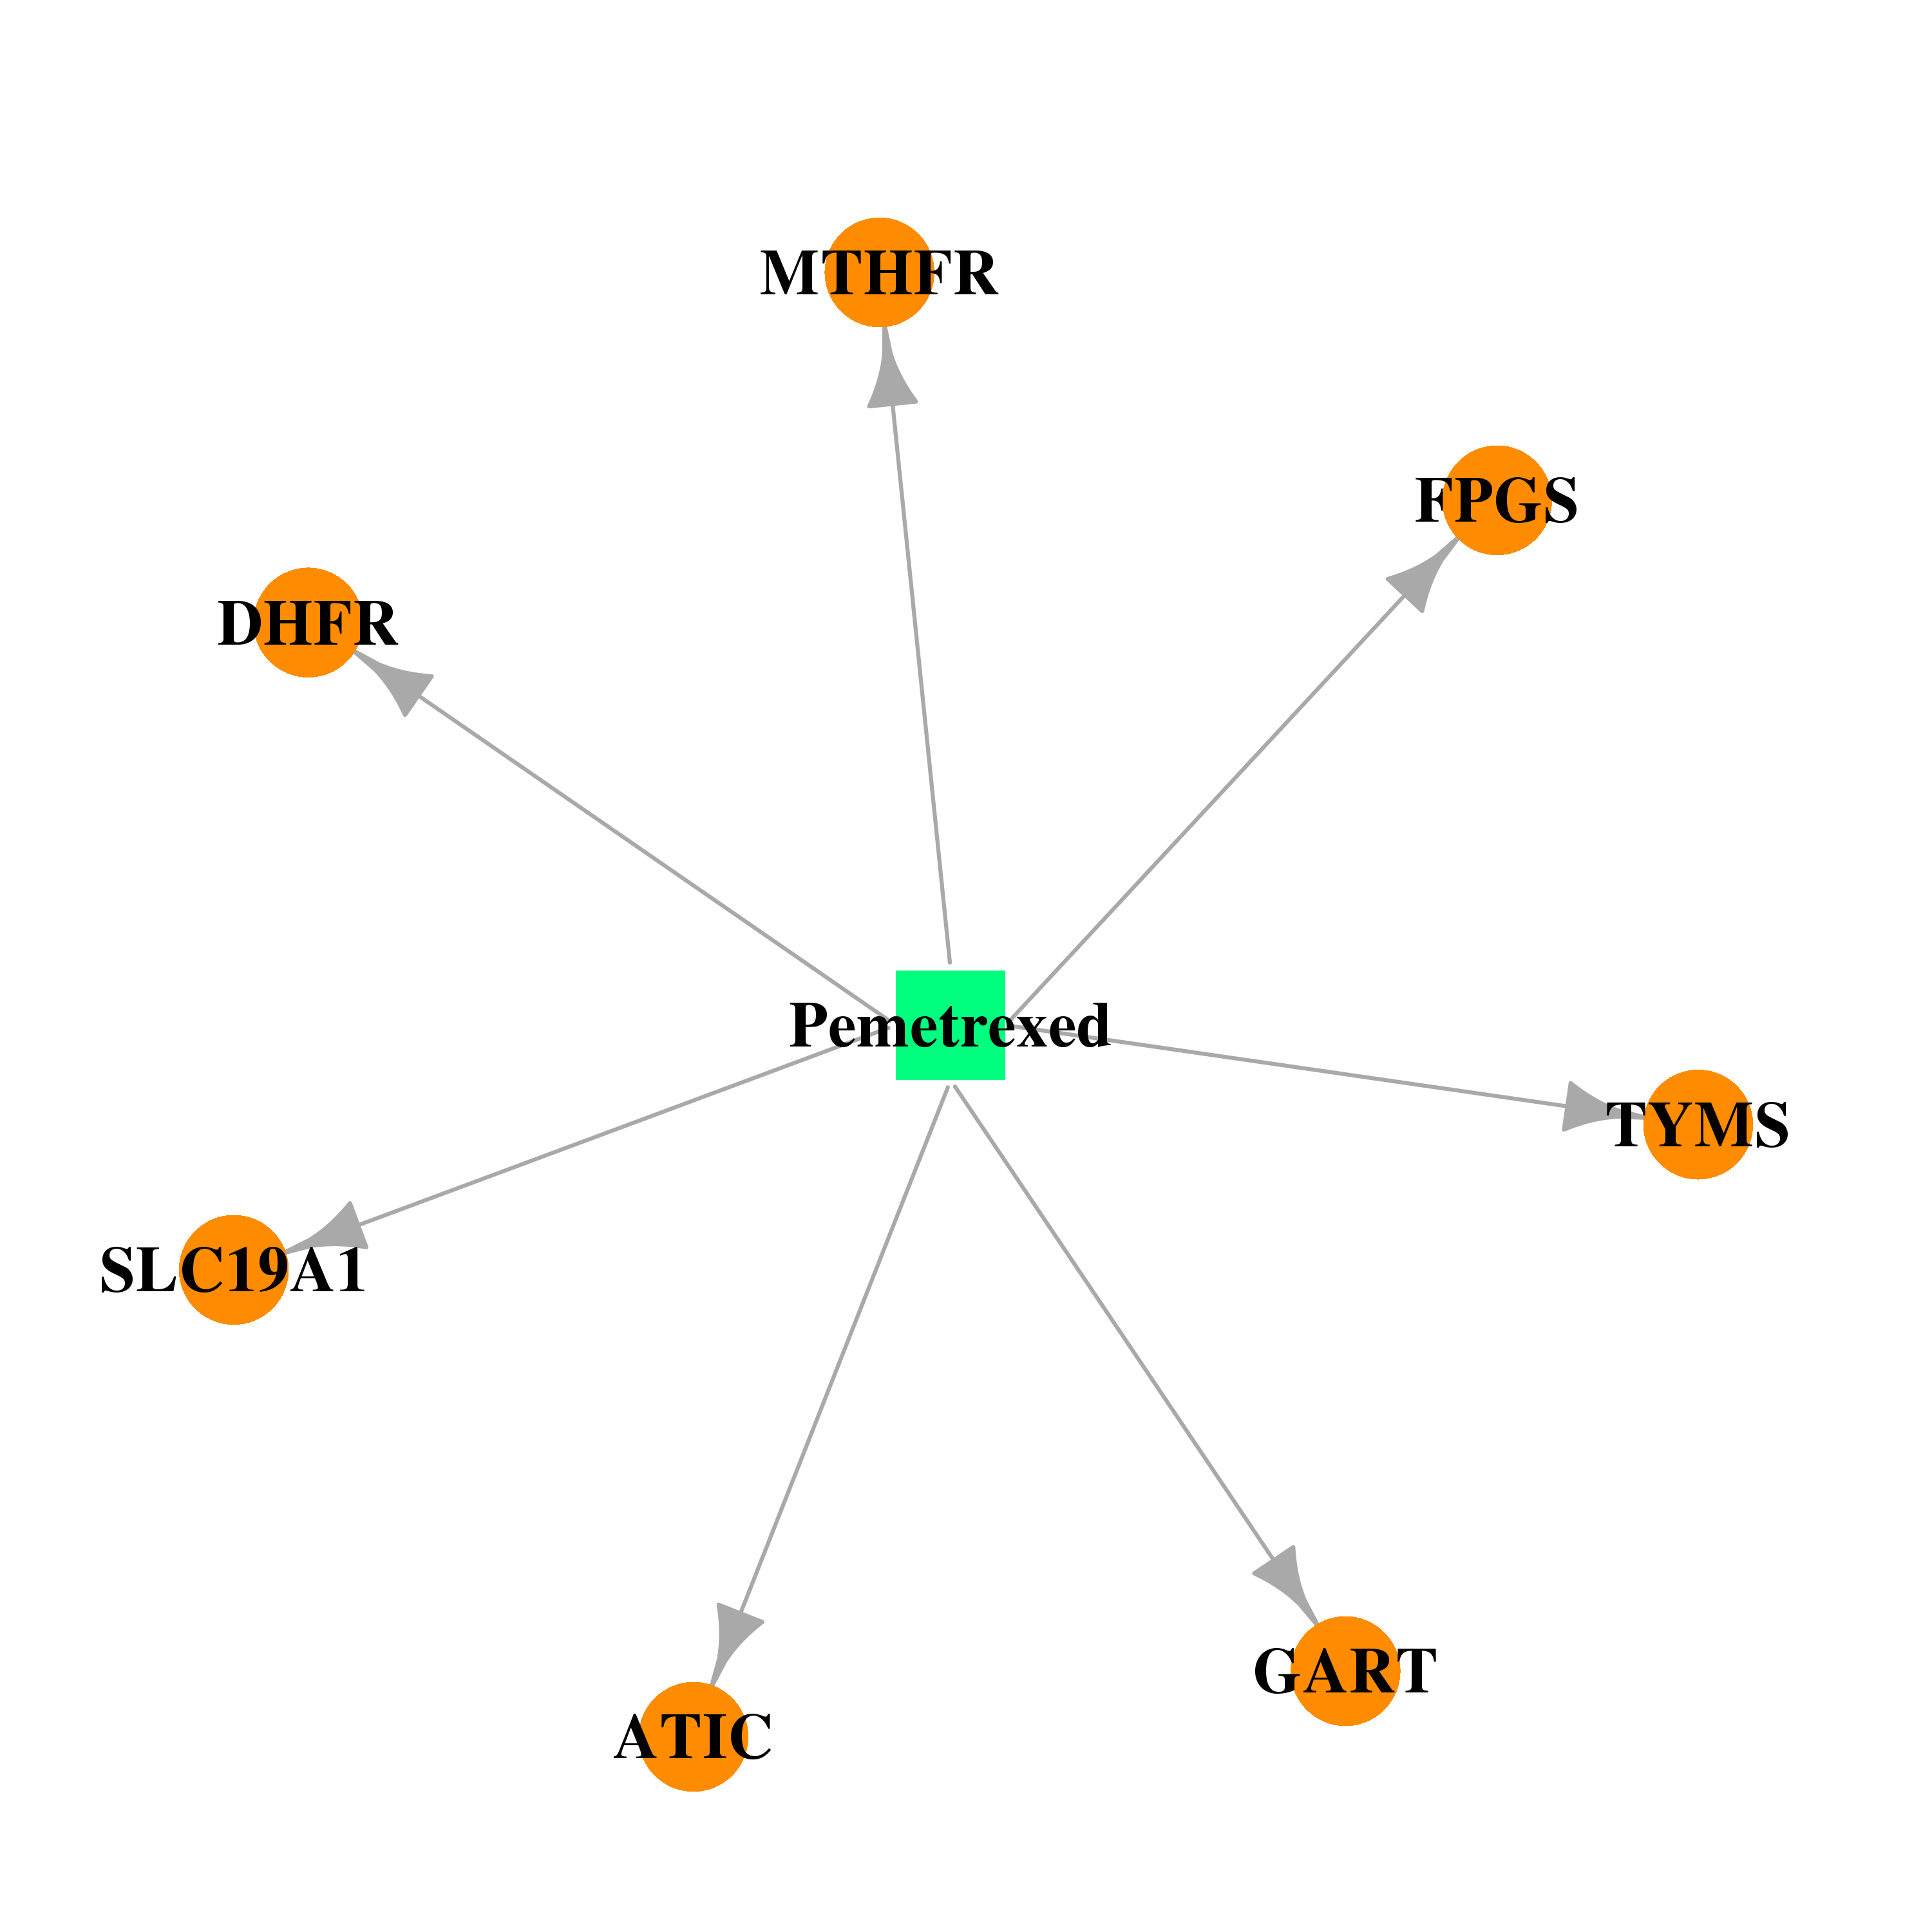 | 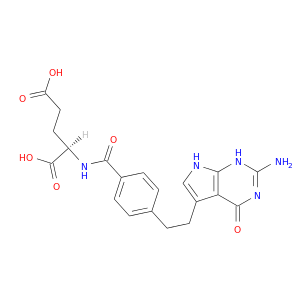 |
| DB02236 | phosphoribosylglycinamide formyltransferase, phosphoribosylglycinamide synthetase, phosphoribosylaminoimidazole synthetase | experimental | Glycinamide Ribonucleotide |  | 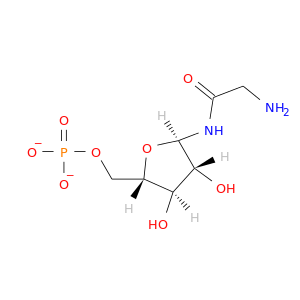 |
| DB03546 | phosphoribosylglycinamide formyltransferase, phosphoribosylglycinamide synthetase, phosphoribosylaminoimidazole synthetase | experimental | 10-CF3C(OH)2-DDACTHF |  | 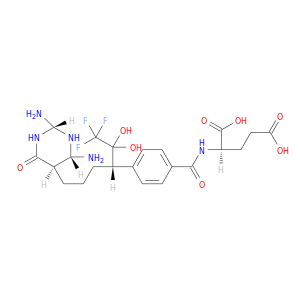 |
| DB00145 | phosphoribosylglycinamide formyltransferase, phosphoribosylglycinamide synthetase, phosphoribosylaminoimidazole synthetase | approved; nutraceutical | Glycine |  |  |
| DB00130 | phosphoribosylglycinamide formyltransferase, phosphoribosylglycinamide synthetase, phosphoribosylaminoimidazole synthetase | approved; nutraceutical; investigational | L-Glutamine |  |  |
| DB00563 | phosphoribosylglycinamide formyltransferase, phosphoribosylglycinamide synthetase, phosphoribosylaminoimidazole synthetase | approved | Methotrexate |  |  |
| Top |
| Cross referenced IDs for GART |
| * We obtained these cross-references from Uniprot database. It covers 150 different DBs, 18 categories. http://www.uniprot.org/help/cross_references_section |
: Open all cross reference information
|
Copyright © 2016-Present - The Univsersity of Texas Health Science Center at Houston @ |