|
|||||||||||||||||||||||||||||||||||||||||||||||||||||||||||||||||||||||||||||||||||||||||||||||||||||||||||||||||||||||||||||||||||||||||||||||||||||||||||||||||||||||||||||||||||||||||||||||||||||||||||||||||||||||||||||||||||||||||||||||||||||||||||||||||||||||||||||||||||||||||||||||||||||||||||||||||||||||||||||||||||||||||||||||||||||||||||||||||||||
| |
| Phenotypic Information (metabolism pathway, cancer, disease, phenome) |
| |
| |
| Gene-Gene Network Information: Co-Expression Network, Interacting Genes & KEGG |
| |
|


| Gene Summary for AMD1 |
| Top |
| Phenotypic Information for AMD1(metabolism pathway, cancer, disease, phenome) |
| Cancer | CGAP: AMD1 |
| Familial Cancer Database: AMD1 | |
| * This gene is included in those cancer gene databases. |
|
|
|
|
|
| . | |||||||||||||||||||||||||||||||||||||||||||||||||||||||||||||||||||||||||||||||||||||||||||||||||||||||||||||||||||||||||||||||||||||||||||||||||||||||||||||||||||||||||||||||||||||||||||||||||||||||||||||||||||||||||||||||||||||||||||||||||||||||||||||||||||||||||||||||||||||||||||||||||||||||||||||||||||||||||||||||||||||||||||||||||||||||||||||||
Oncogene 1 | Significant driver gene in | ||||||||||||||||||||||||||||||||||||||||||||||||||||||||||||||||||||||||||||||||||||||||||||||||||||||||||||||||||||||||||||||||||||||||||||||||||||||||||||||||||||||||||||||||||||||||||||||||||||||||||||||||||||||||||||||||||||||||||||||||||||||||||||||||||||||||||||||||||||||||||||||||||||||||||||||||||||||||||||||||||||||||||||||||||||||||||||||||||||
| cf) number; DB name 1 Oncogene; http://nar.oxfordjournals.org/content/35/suppl_1/D721.long, 2 Tumor Suppressor gene; https://bioinfo.uth.edu/TSGene/, 3 Cancer Gene Census; http://www.nature.com/nrc/journal/v4/n3/abs/nrc1299.html, 4 CancerGenes; http://nar.oxfordjournals.org/content/35/suppl_1/D721.long, 5 Network of Cancer Gene; http://ncg.kcl.ac.uk/index.php, 1Therapeutic Vulnerabilities in Cancer; http://cbio.mskcc.org/cancergenomics/statius/ |
| KEGG_CYSTEINE_AND_METHIONINE_METABOLISM KEGG_ARGININE_AND_PROLINE_METABOLISM REACTOME_METABOLISM_OF_AMINO_ACIDS_AND_DERIVATIVES REACTOME_METABOLISM_OF_POLYAMINES | |
| OMIM | |
| Orphanet | |
| Disease | KEGG Disease: AMD1 |
| MedGen: AMD1 (Human Medical Genetics with Condition) | |
| ClinVar: AMD1 | |
| Phenotype | MGI: AMD1 (International Mouse Phenotyping Consortium) |
| PhenomicDB: AMD1 | |
| Mutations for AMD1 |
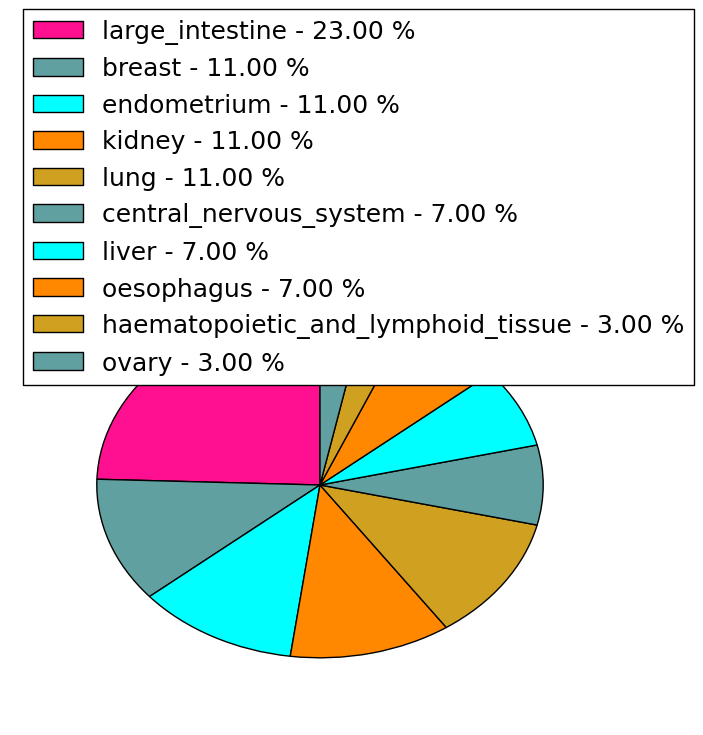
| * Under tables are showing count per each tissue to give us broad intuition about tissue specific mutation patterns.You can go to the detailed page for each mutation database's web site. |
| - Statistics for Tissue and Mutation type | Top |
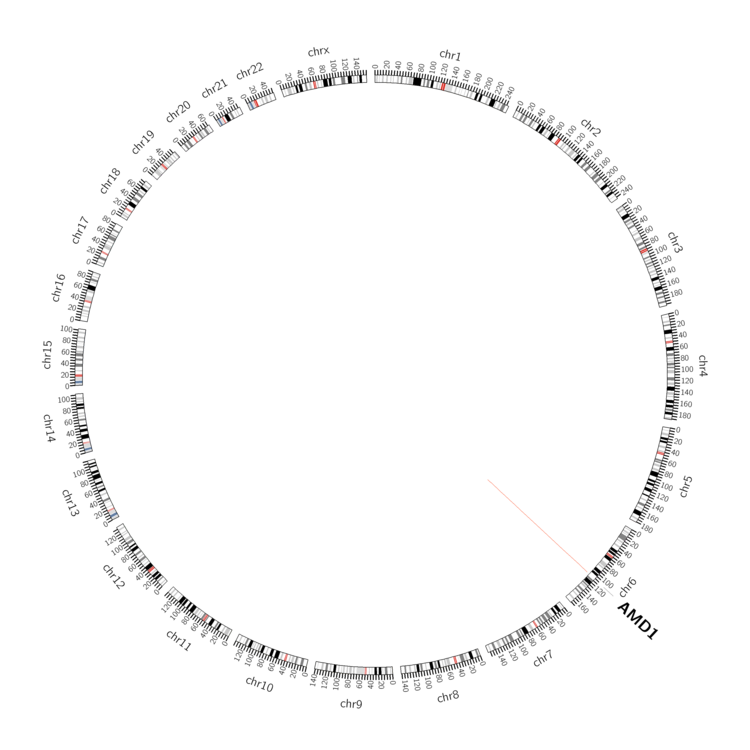 |
| - For Inter-chromosomal Variations |
| There's no inter-chromosomal structural variation. |
| - For Intra-chromosomal Variations |
| * Intra-chromosomal variantions includes 'intrachromosomal amplicon to amplicon', 'intrachromosomal amplicon to non-amplified dna', 'intrachromosomal deletion', 'intrachromosomal fold-back inversion', 'intrachromosomal inversion', 'intrachromosomal tandem duplication', 'Intrachromosomal unknown type', 'intrachromosomal with inverted orientation', 'intrachromosomal with non-inverted orientation'. |
 |
| Sample | Symbol_a | Chr_a | Start_a | End_a | Symbol_b | Chr_b | Start_b | End_b |
| ovary | AMD1 | chr6 | 111213879 | 111213899 | chr6 | 111217410 | 111217430 |
| cf) Tissue number; Tissue name (1;Breast, 2;Central_nervous_system, 3;Haematopoietic_and_lymphoid_tissue, 4;Large_intestine, 5;Liver, 6;Lung, 7;Ovary, 8;Pancreas, 9;Prostate, 10;Skin, 11;Soft_tissue, 12;Upper_aerodigestive_tract) |
| * From mRNA Sanger sequences, Chitars2.0 arranged chimeric transcripts. This table shows AMD1 related fusion information. |
| ID | Head Gene | Tail Gene | Accession | Gene_a | qStart_a | qEnd_a | Chromosome_a | tStart_a | tEnd_a | Gene_a | qStart_a | qEnd_a | Chromosome_a | tStart_a | tEnd_a |
| CN399561 | AMD1 | 10 | 425 | 6 | 111196003 | 111196418 | ECHDC1 | 424 | 693 | 6 | 127611236 | 127636043 | |
| CR992767 | AMD1 | 1 | 416 | 6 | 111196006 | 111196421 | TNFAIP3 | 412 | 690 | 6 | 138192348 | 138192626 | |
| BI770432 | NAA60 | 1 | 311 | 16 | 3493725 | 3498540 | AMD1 | 312 | 871 | 6 | 111213364 | 111214801 | |
| BE181974 | AMD1 | 45 | 132 | 6 | 111210097 | 111210185 | AMD1 | 125 | 192 | 6 | 111214224 | 111214701 | |
| Top |
| Mutation type/ Tissue ID | brca | cns | cerv | endome | haematopo | kidn | Lintest | liver | lung | ns | ovary | pancre | prost | skin | stoma | thyro | urina | |||
| Total # sample | 1 | 1 | ||||||||||||||||||
| GAIN (# sample) | 1 | |||||||||||||||||||
| LOSS (# sample) | 1 |
| cf) Tissue ID; Tissue type (1; Breast, 2; Central_nervous_system, 3; Cervix, 4; Endometrium, 5; Haematopoietic_and_lymphoid_tissue, 6; Kidney, 7; Large_intestine, 8; Liver, 9; Lung, 10; NS, 11; Ovary, 12; Pancreas, 13; Prostate, 14; Skin, 15; Stomach, 16; Thyroid, 17; Urinary_tract) |
| Top |
|
 |
| Top |
| Stat. for Non-Synonymous SNVs (# total SNVs=26) | (# total SNVs=5) |
 |  |
(# total SNVs=0) | (# total SNVs=0) |
| Top |
| * When you move the cursor on each content, you can see more deailed mutation information on the Tooltip. Those are primary_site,primary_histology,mutation(aa),pubmedID. |
| GRCh37 position | Mutation(aa) | Unique sampleID count |
| chr6:111213533-111213533 | p.R168W | 2 |
| chr6:111214008-111214008 | p.S229L | 2 |
| chr6:111213388-111213388 | p.R151H | 2 |
| chr6:111210086-111210086 | p.R75K | 2 |
| chr6:111210137-111210137 | p.V92A | 1 |
| chr6:111214765-111214766 | p.Y318fs*10 | 1 |
| chr6:111214177-111214177 | p.N258I | 1 |
| chr6:111210139-111210139 | p.L94fs*2 | 1 |
| chr6:111213560-111213560 | p.L177L | 1 |
| chr6:111214182-111214182 | p.S260R | 1 |
| Top |
|
 |
| Point Mutation/ Tissue ID | 1 | 2 | 3 | 4 | 5 | 6 | 7 | 8 | 9 | 10 | 11 | 12 | 13 | 14 | 15 | 16 | 17 | 18 | 19 | 20 |
| # sample | 1 | 1 | 3 | 2 | 1 | 3 | 3 | 1 | 3 | 3 | ||||||||||
| # mutation | 1 | 1 | 4 | 2 | 1 | 3 | 3 | 1 | 3 | 3 | ||||||||||
| nonsynonymous SNV | 1 | 1 | 4 | 2 | 1 | 2 | 2 | 1 | 3 | 3 | ||||||||||
| synonymous SNV | 1 | 1 |
| cf) Tissue ID; Tissue type (1; BLCA[Bladder Urothelial Carcinoma], 2; BRCA[Breast invasive carcinoma], 3; CESC[Cervical squamous cell carcinoma and endocervical adenocarcinoma], 4; COAD[Colon adenocarcinoma], 5; GBM[Glioblastoma multiforme], 6; Glioma Low Grade, 7; HNSC[Head and Neck squamous cell carcinoma], 8; KICH[Kidney Chromophobe], 9; KIRC[Kidney renal clear cell carcinoma], 10; KIRP[Kidney renal papillary cell carcinoma], 11; LAML[Acute Myeloid Leukemia], 12; LUAD[Lung adenocarcinoma], 13; LUSC[Lung squamous cell carcinoma], 14; OV[Ovarian serous cystadenocarcinoma ], 15; PAAD[Pancreatic adenocarcinoma], 16; PRAD[Prostate adenocarcinoma], 17; SKCM[Skin Cutaneous Melanoma], 18:STAD[Stomach adenocarcinoma], 19:THCA[Thyroid carcinoma], 20:UCEC[Uterine Corpus Endometrial Carcinoma]) |
| Top |
| * We represented just top 10 SNVs. When you move the cursor on each content, you can see more deailed mutation information on the Tooltip. Those are primary_site, primary_histology, mutation(aa), pubmedID. |
| Genomic Position | Mutation(aa) | Unique sampleID count |
| chr6:111214026 | p.S115L,AMD1 | 2 |
| chr6:111211547 | p.G112V,AMD1 | 1 |
| chr6:111214177 | p.M113I,AMD1 | 1 |
| chr6:111213388 | p.F7L,AMD1 | 1 |
| chr6:111214197 | p.D46G | 1 |
| chr6:111213404 | p.N138I,AMD1 | 1 |
| chr6:111214205 | p.R46K,AMD1 | 1 |
| chr6:111213504 | p.D145N,AMD1 | 1 |
| chr6:111214224 | p.V63A,AMD1 | 1 |
| chr6:111213533 | p.L147L,AMD1 | 1 |
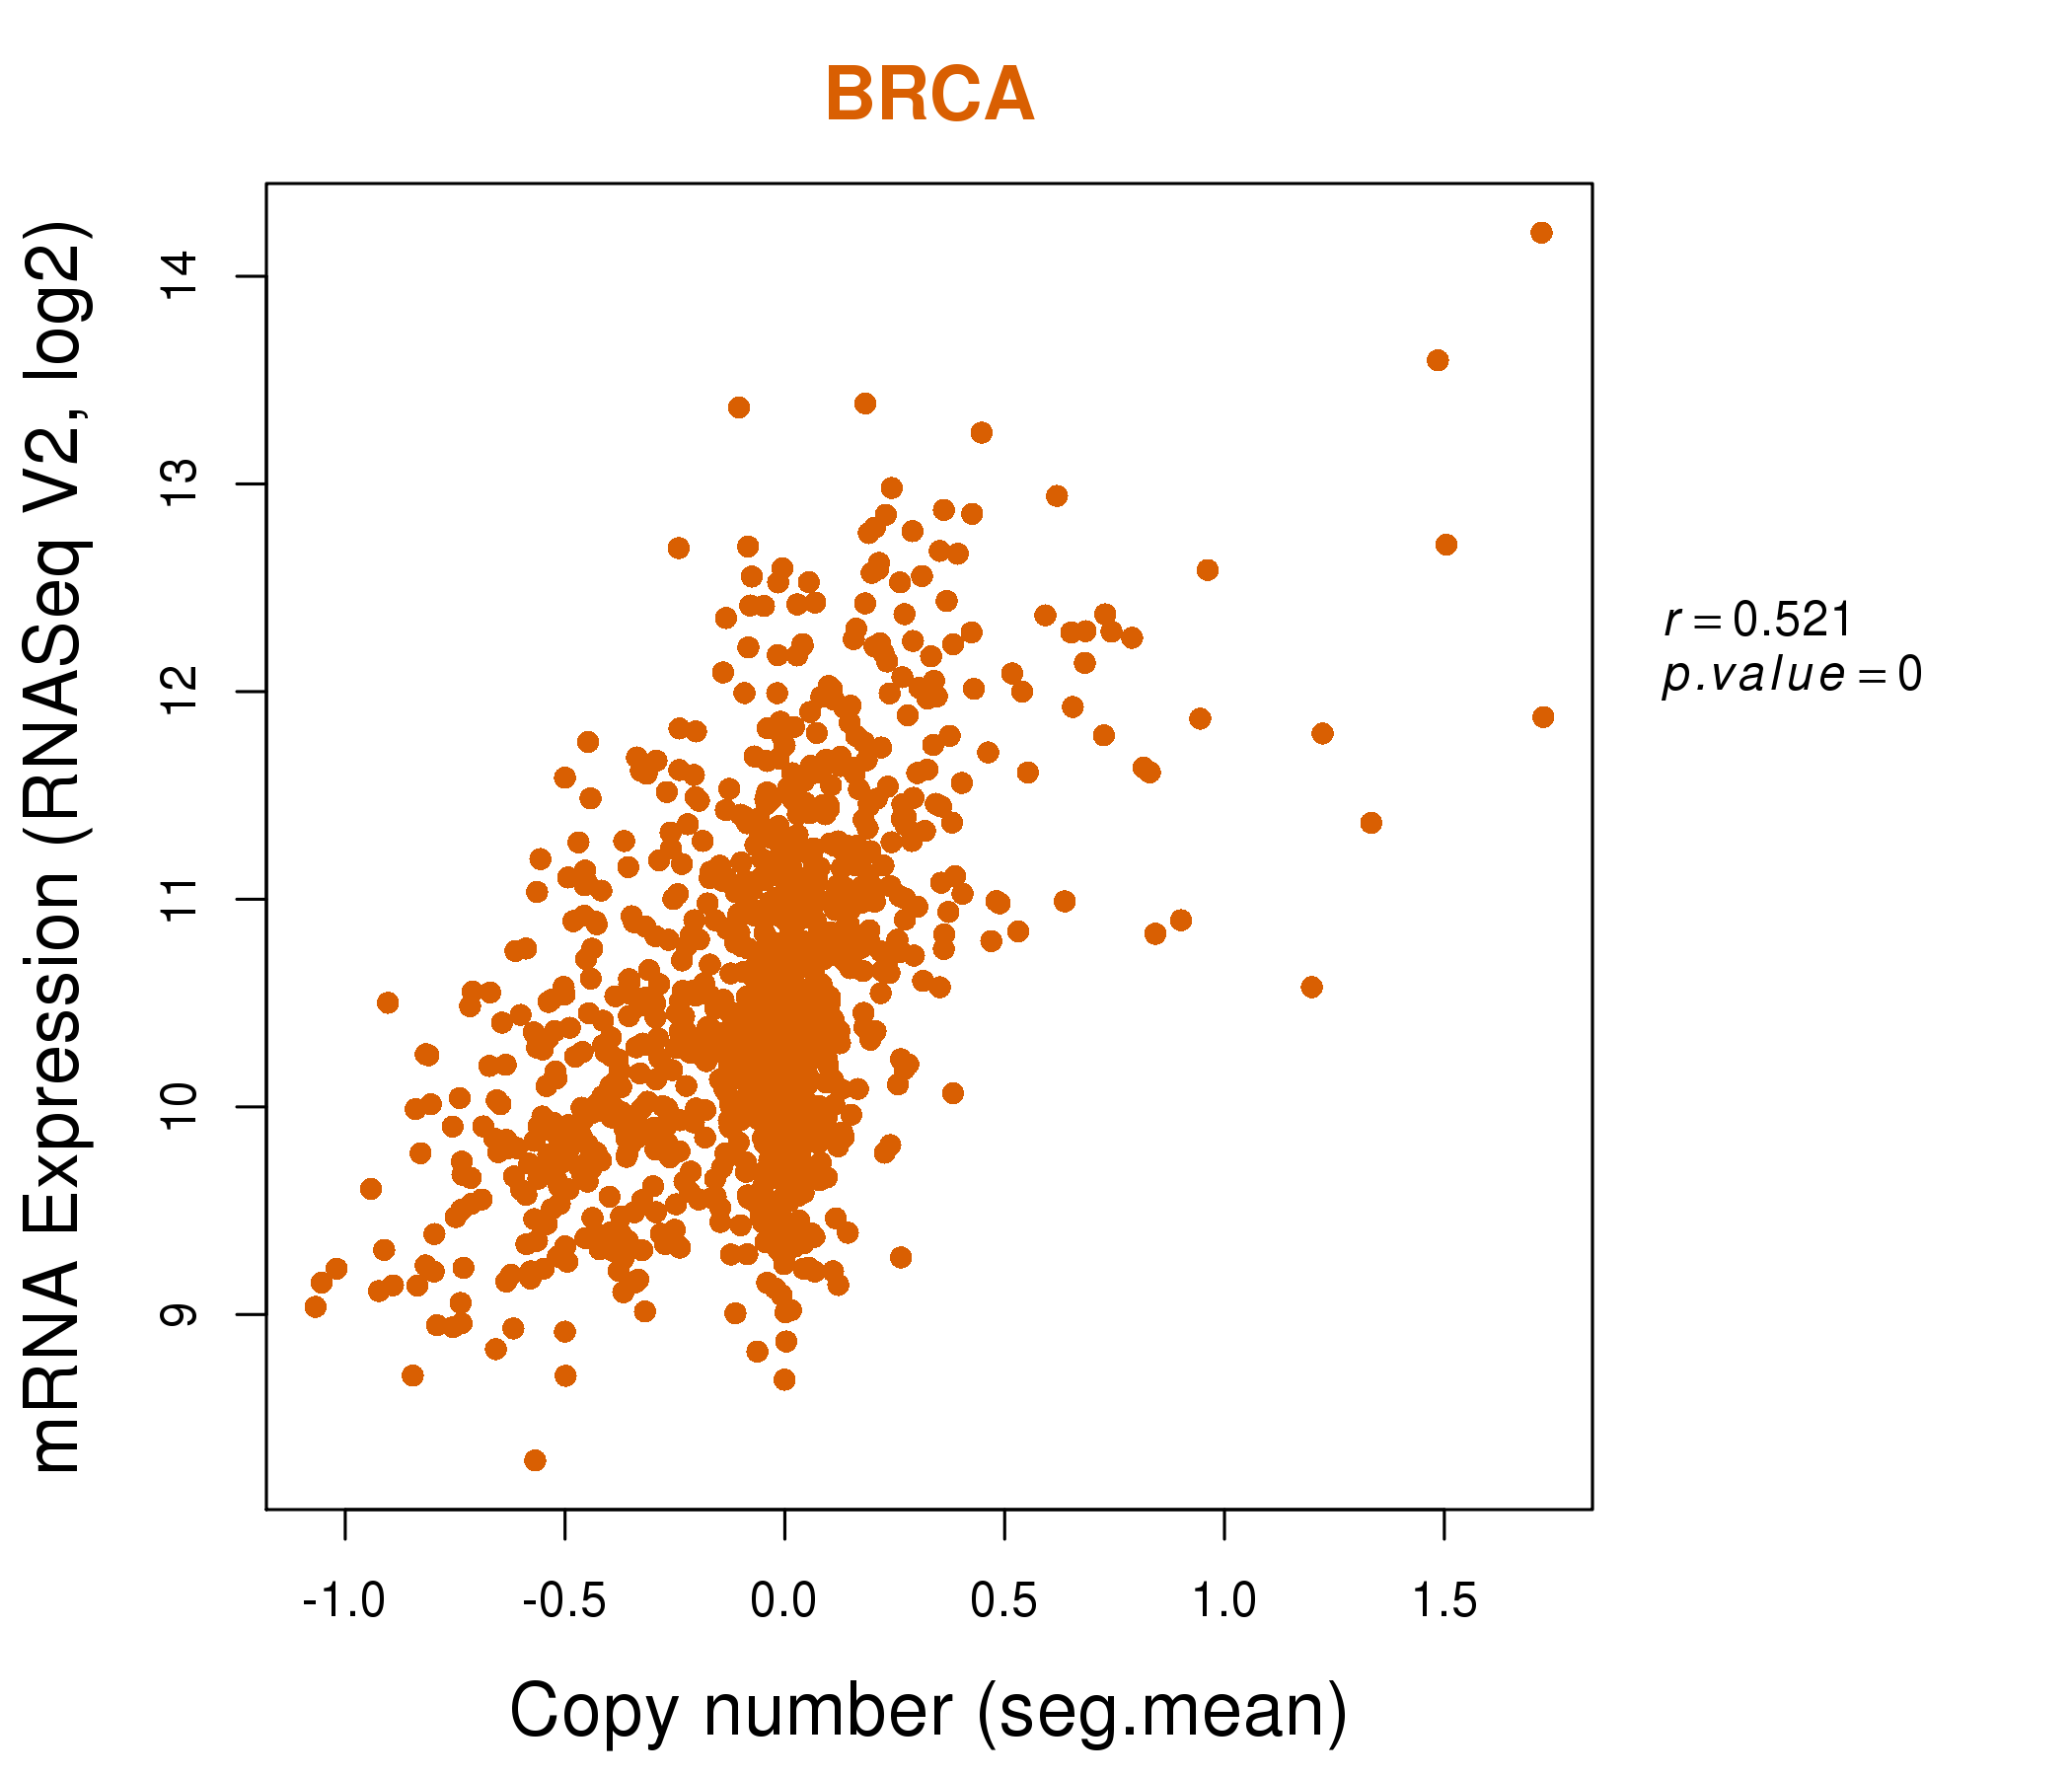
| * Copy number data were extracted from TCGA using R package TCGA-Assembler. The URLs of all public data files on TCGA DCC data server were gathered on Jan-05-2015. Function ProcessCNAData in TCGA-Assembler package was used to obtain gene-level copy number value which is calculated as the average copy number of the genomic region of a gene. |
 |
| cf) Tissue ID[Tissue type]: BLCA[Bladder Urothelial Carcinoma], BRCA[Breast invasive carcinoma], CESC[Cervical squamous cell carcinoma and endocervical adenocarcinoma], COAD[Colon adenocarcinoma], GBM[Glioblastoma multiforme], Glioma Low Grade, HNSC[Head and Neck squamous cell carcinoma], KICH[Kidney Chromophobe], KIRC[Kidney renal clear cell carcinoma], KIRP[Kidney renal papillary cell carcinoma], LAML[Acute Myeloid Leukemia], LUAD[Lung adenocarcinoma], LUSC[Lung squamous cell carcinoma], OV[Ovarian serous cystadenocarcinoma ], PAAD[Pancreatic adenocarcinoma], PRAD[Prostate adenocarcinoma], SKCM[Skin Cutaneous Melanoma], STAD[Stomach adenocarcinoma], THCA[Thyroid carcinoma], UCEC[Uterine Corpus Endometrial Carcinoma] |
| Top |
| Gene Expression for AMD1 |
| * CCLE gene expression data were extracted from CCLE_Expression_Entrez_2012-10-18.res: Gene-centric RMA-normalized mRNA expression data. |
 |
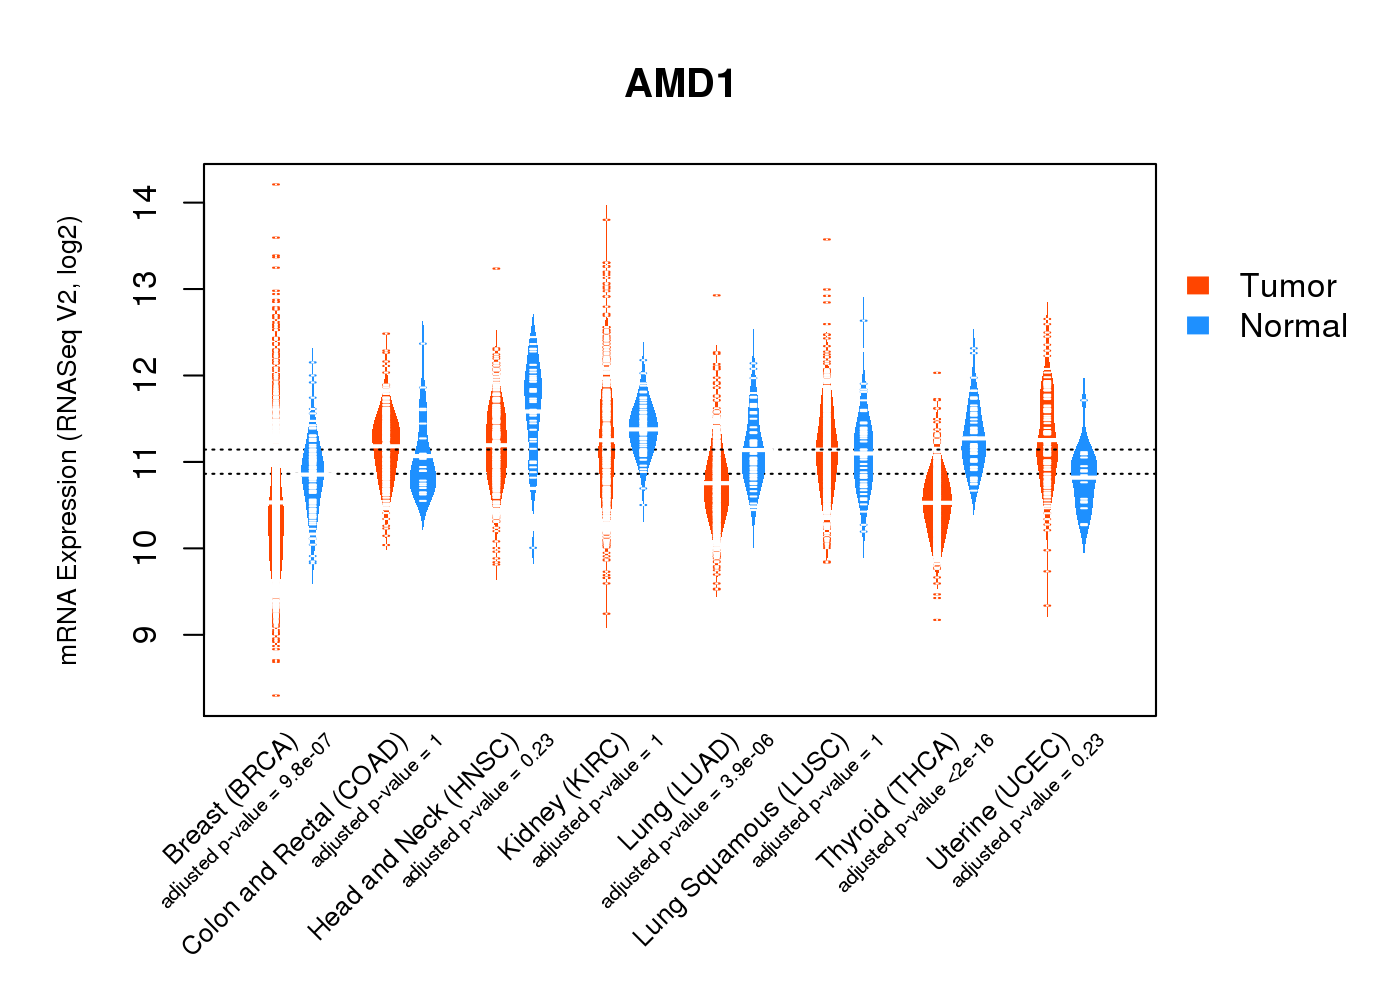
| * Normalized gene expression data of RNASeqV2 was extracted from TCGA using R package TCGA-Assembler. The URLs of all public data files on TCGA DCC data server were gathered at Jan-05-2015. Only eight cancer types have enough normal control samples for differential expression analysis. (t test, adjusted p<0.05 (using Benjamini-Hochberg FDR)) |
 |
| Top |
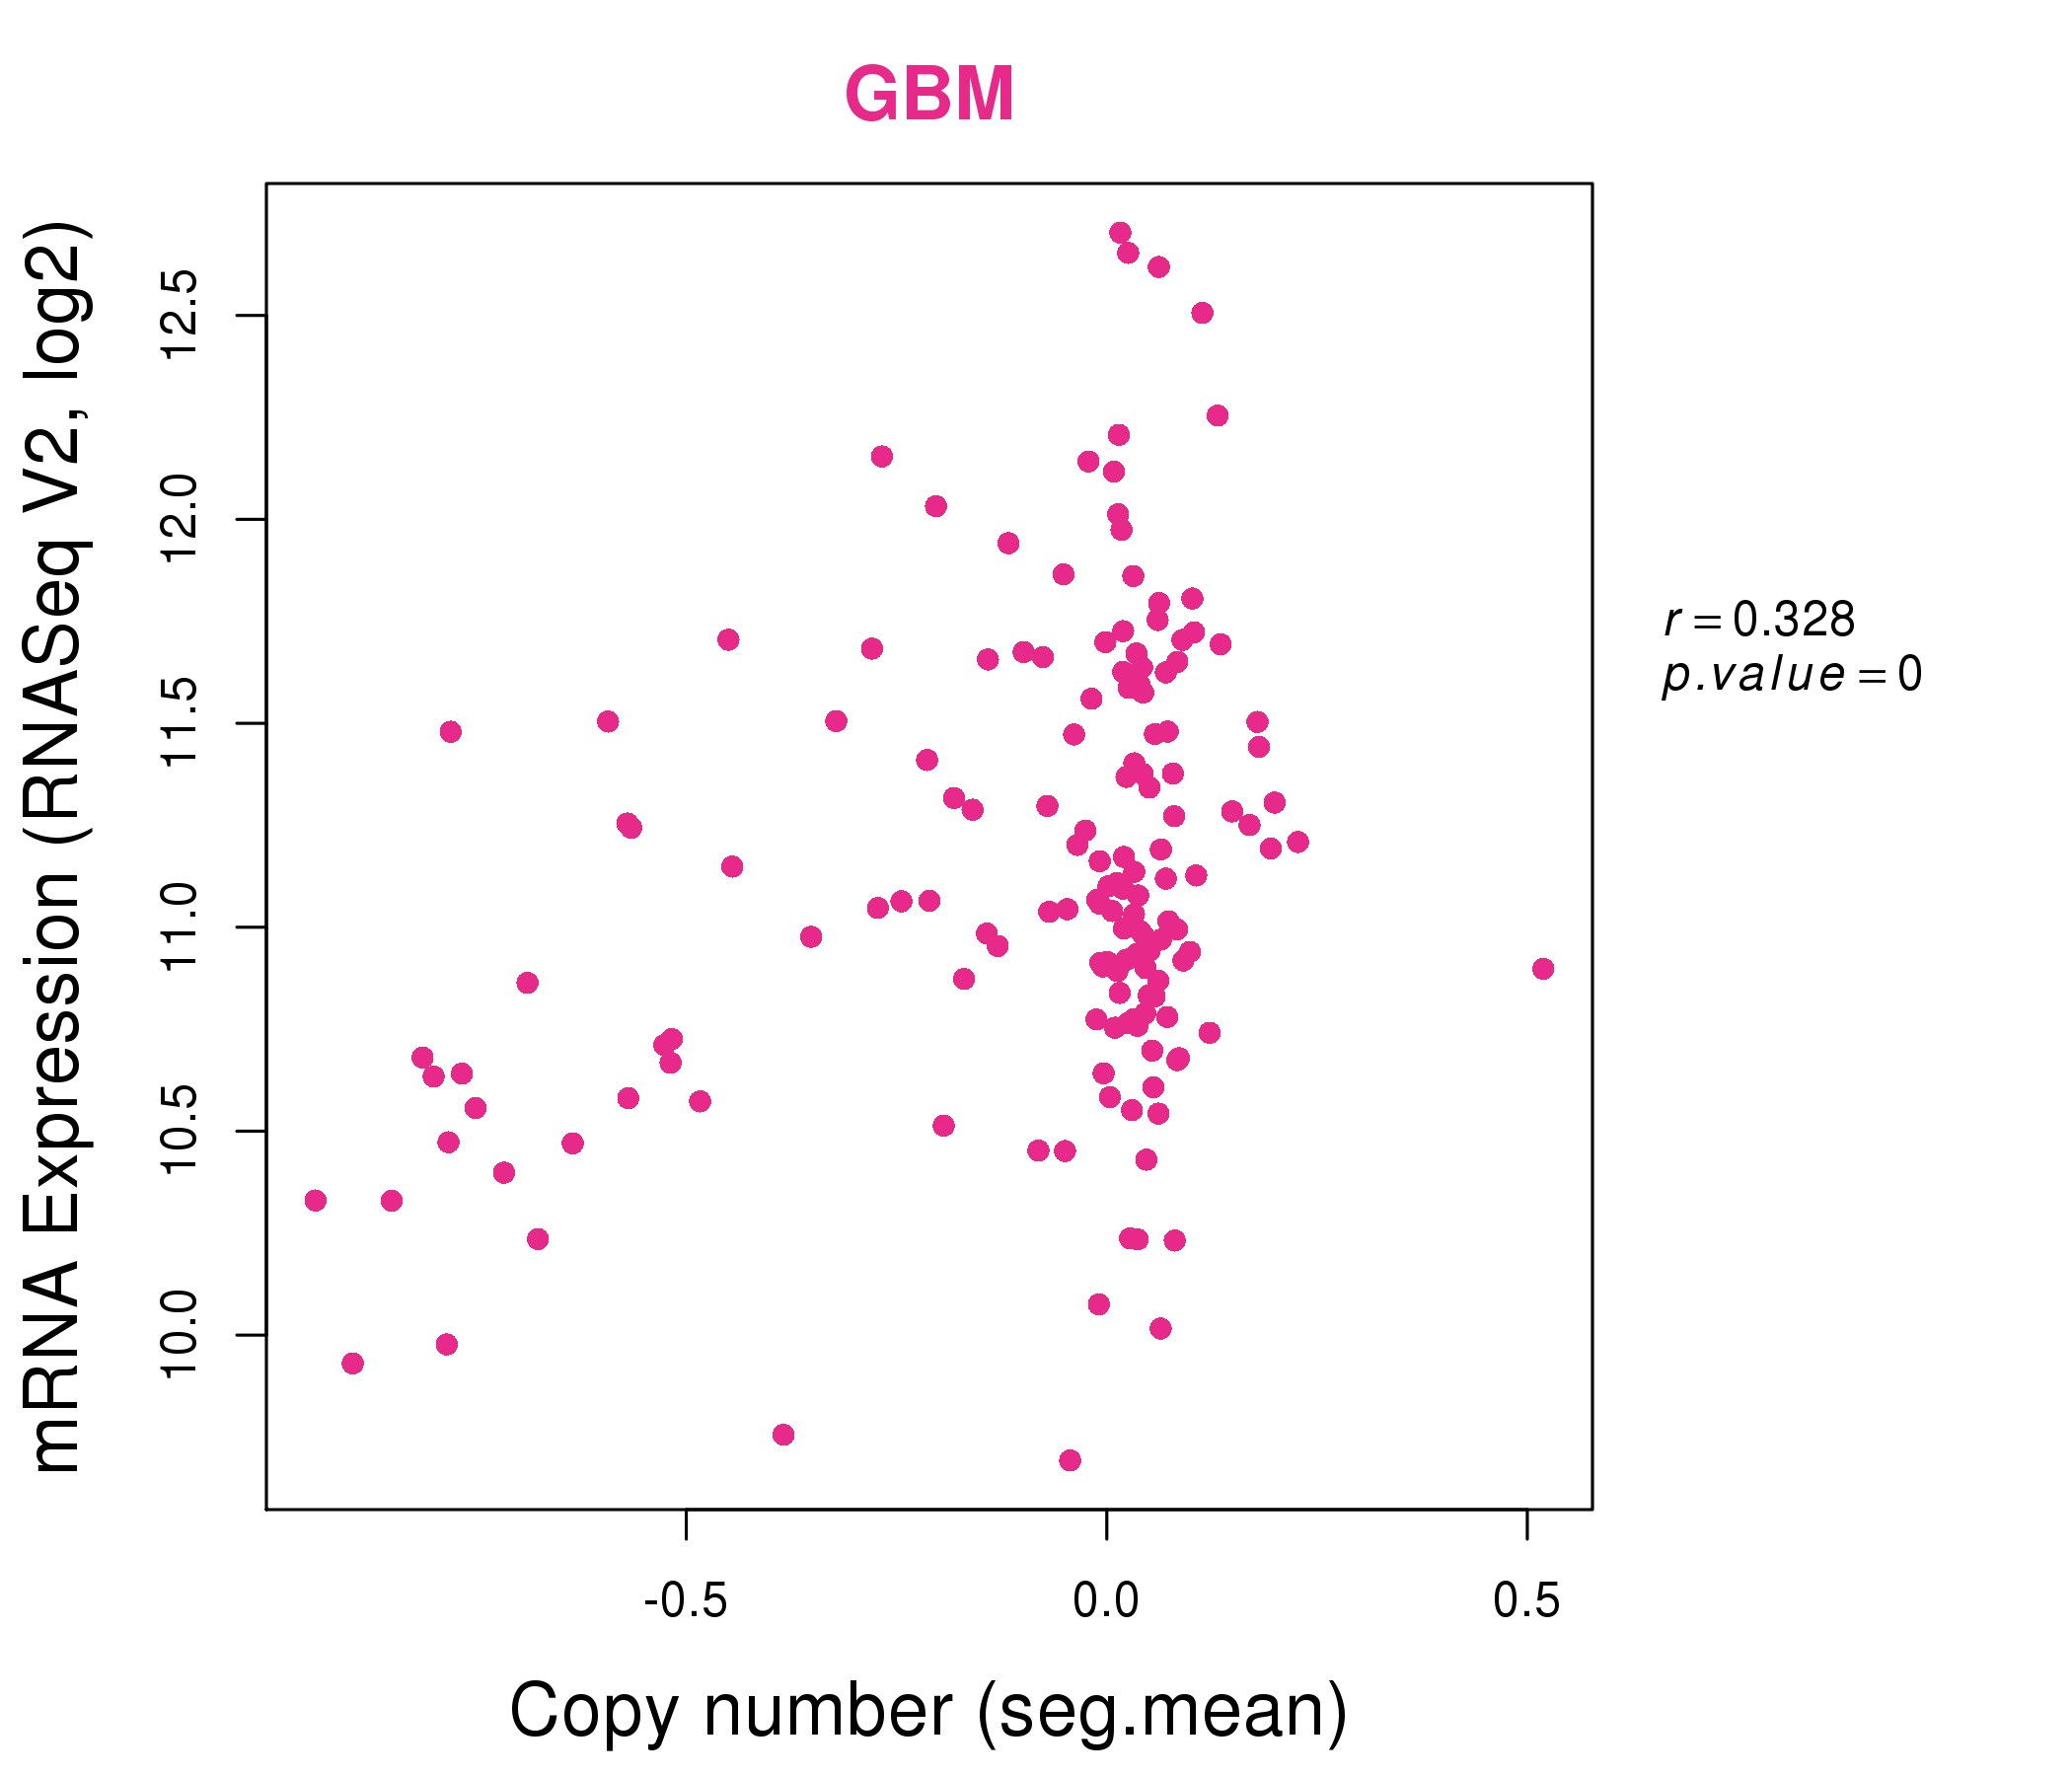
| * This plots show the correlation between CNV and gene expression. |
: Open all plots for all cancer types
 |
|
 |
|
| Top |
| Gene-Gene Network Information |
| * Co-Expression network figures were drawn using R package igraph. Only the top 20 genes with the highest correlations were shown. Red circle: input gene, orange circle: cell metabolism gene, sky circle: other gene |
: Open all plots for all cancer types
 |
| ||||
| AMD1,BEND3,MMS22L,CCNC,CDK19,GTF3C6,HDAC2, KIAA1804,LTV1,MTHFD1L,NDUFAF4,NUS1,PM20D2,PRKX, REV3L,RPF2,SRPK1,STK38,SYNCRIP,TTK,WDR43 | ABCE1,ABHD13,ABI1,AMD1,C5orf28,CBFB,CD47, MAK16,MAPK1IP1L,MRPL42,NUS1,PPHLN1,PRKCI,RNF138, SEH1L,STXBP3,SYNCRIP,TIPRL,TMEM123,TWISTNB,ZNF267 | ||||
 |
| ||||
| ABCE1,AMD1,ATG5,PARPBP,CCNA2,CCNB1,CCNC, CDK1,CHEK1,DEPDC1B,FBXO5,GSTCD,MAD2L1,MRPL44, NUP37,PPIL1,SRSF3,SRSF7,TFAM,TRA2B,UBE2N | AMD1,BZW1,GSKIP,C20orf24,CHAC2,CHUK,CYB5R4, EIF4E,GTF2A2,HSPA14,MRPL47,PPP2CA,PSMC6,PTS, SLC25A46,SNRPG,TAF13,TXNDC9,UBE2N,UCHL3,USP15 |


| * Co-Expression network figures were drawn using R package igraph. Only the top 20 genes with the highest correlations were shown. Red circle: input gene, orange circle: cell metabolism gene, sky circle: other gene |
: Open all plots for all cancer types
| Top |
: Open all interacting genes' information including KEGG pathway for all interacting genes from DAVID
| Top |
| Pharmacological Information for AMD1 |
| DB Category | DB Name | DB's ID and Url link |
| * Gene Centered Interaction Network. |
 |
| * Drug Centered Interaction Network. |
| DrugBank ID | Target Name | Drug Groups | Generic Name | Drug Centered Network | Drug Structure |
| DB00118 | adenosylmethionine decarboxylase 1 | approved; nutraceutical | S-Adenosylmethionine | 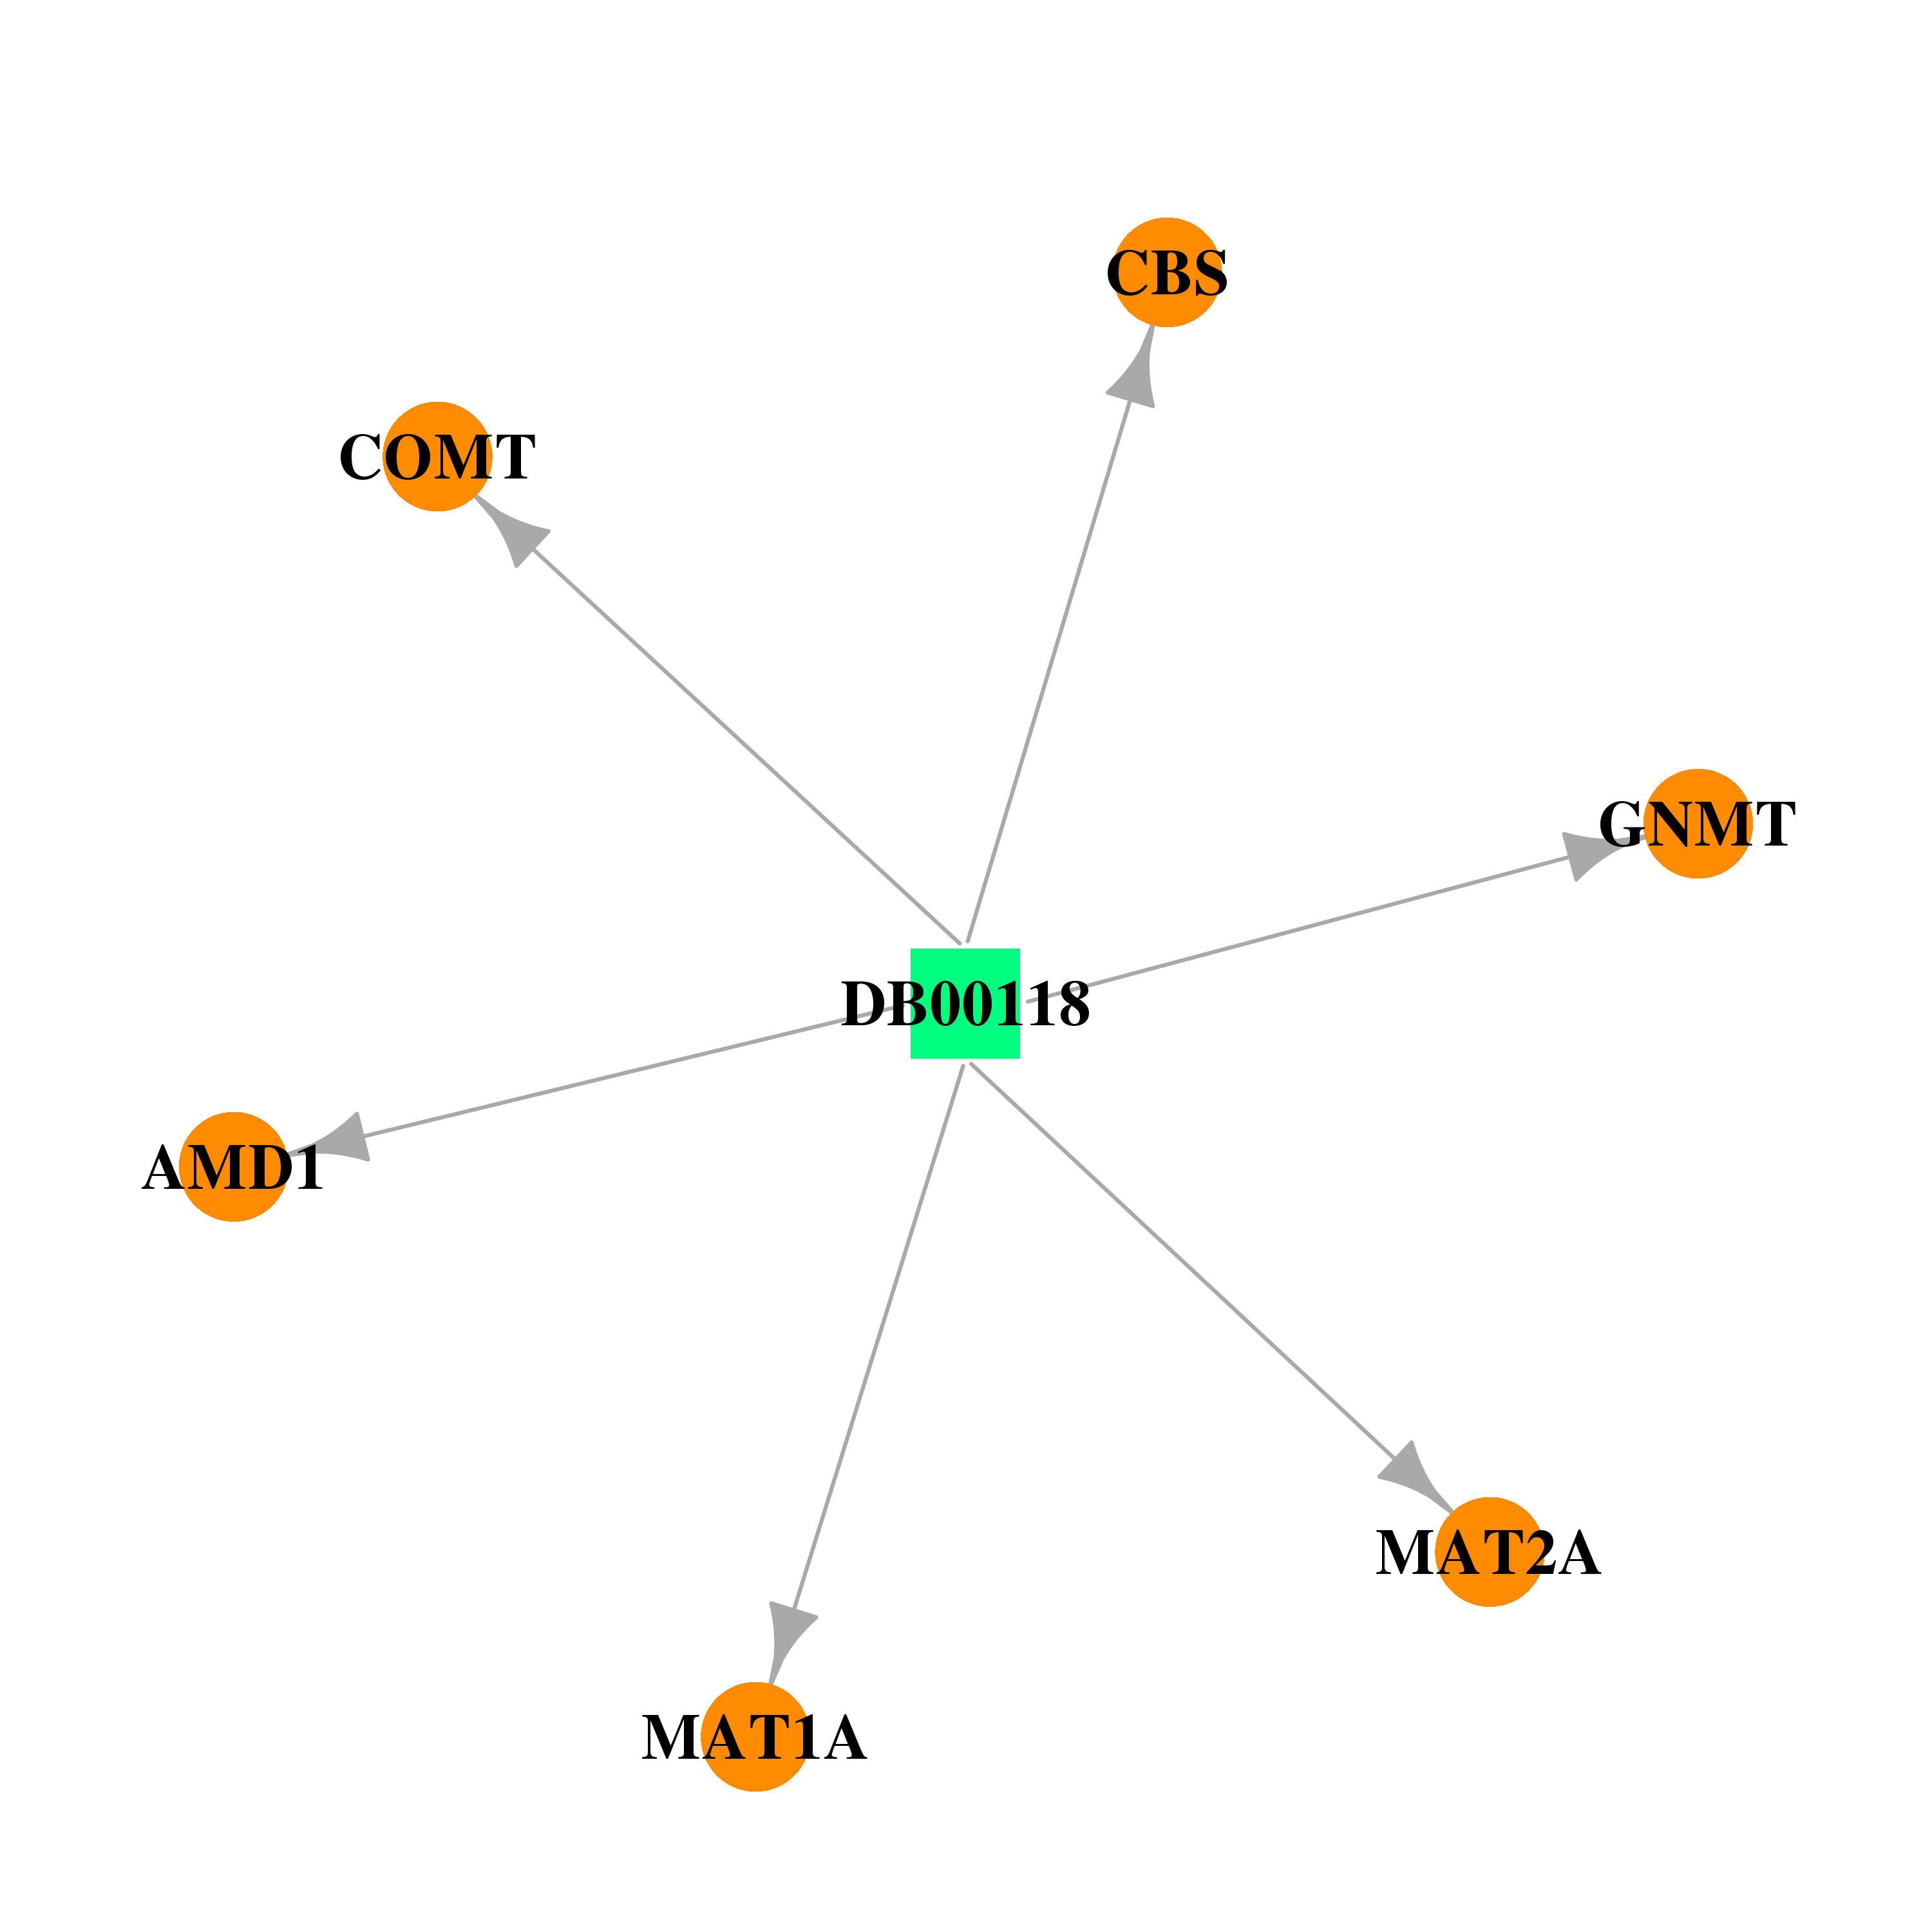 |  |
| DB01917 | adenosylmethionine decarboxylase 1 | experimental | Putrescine | 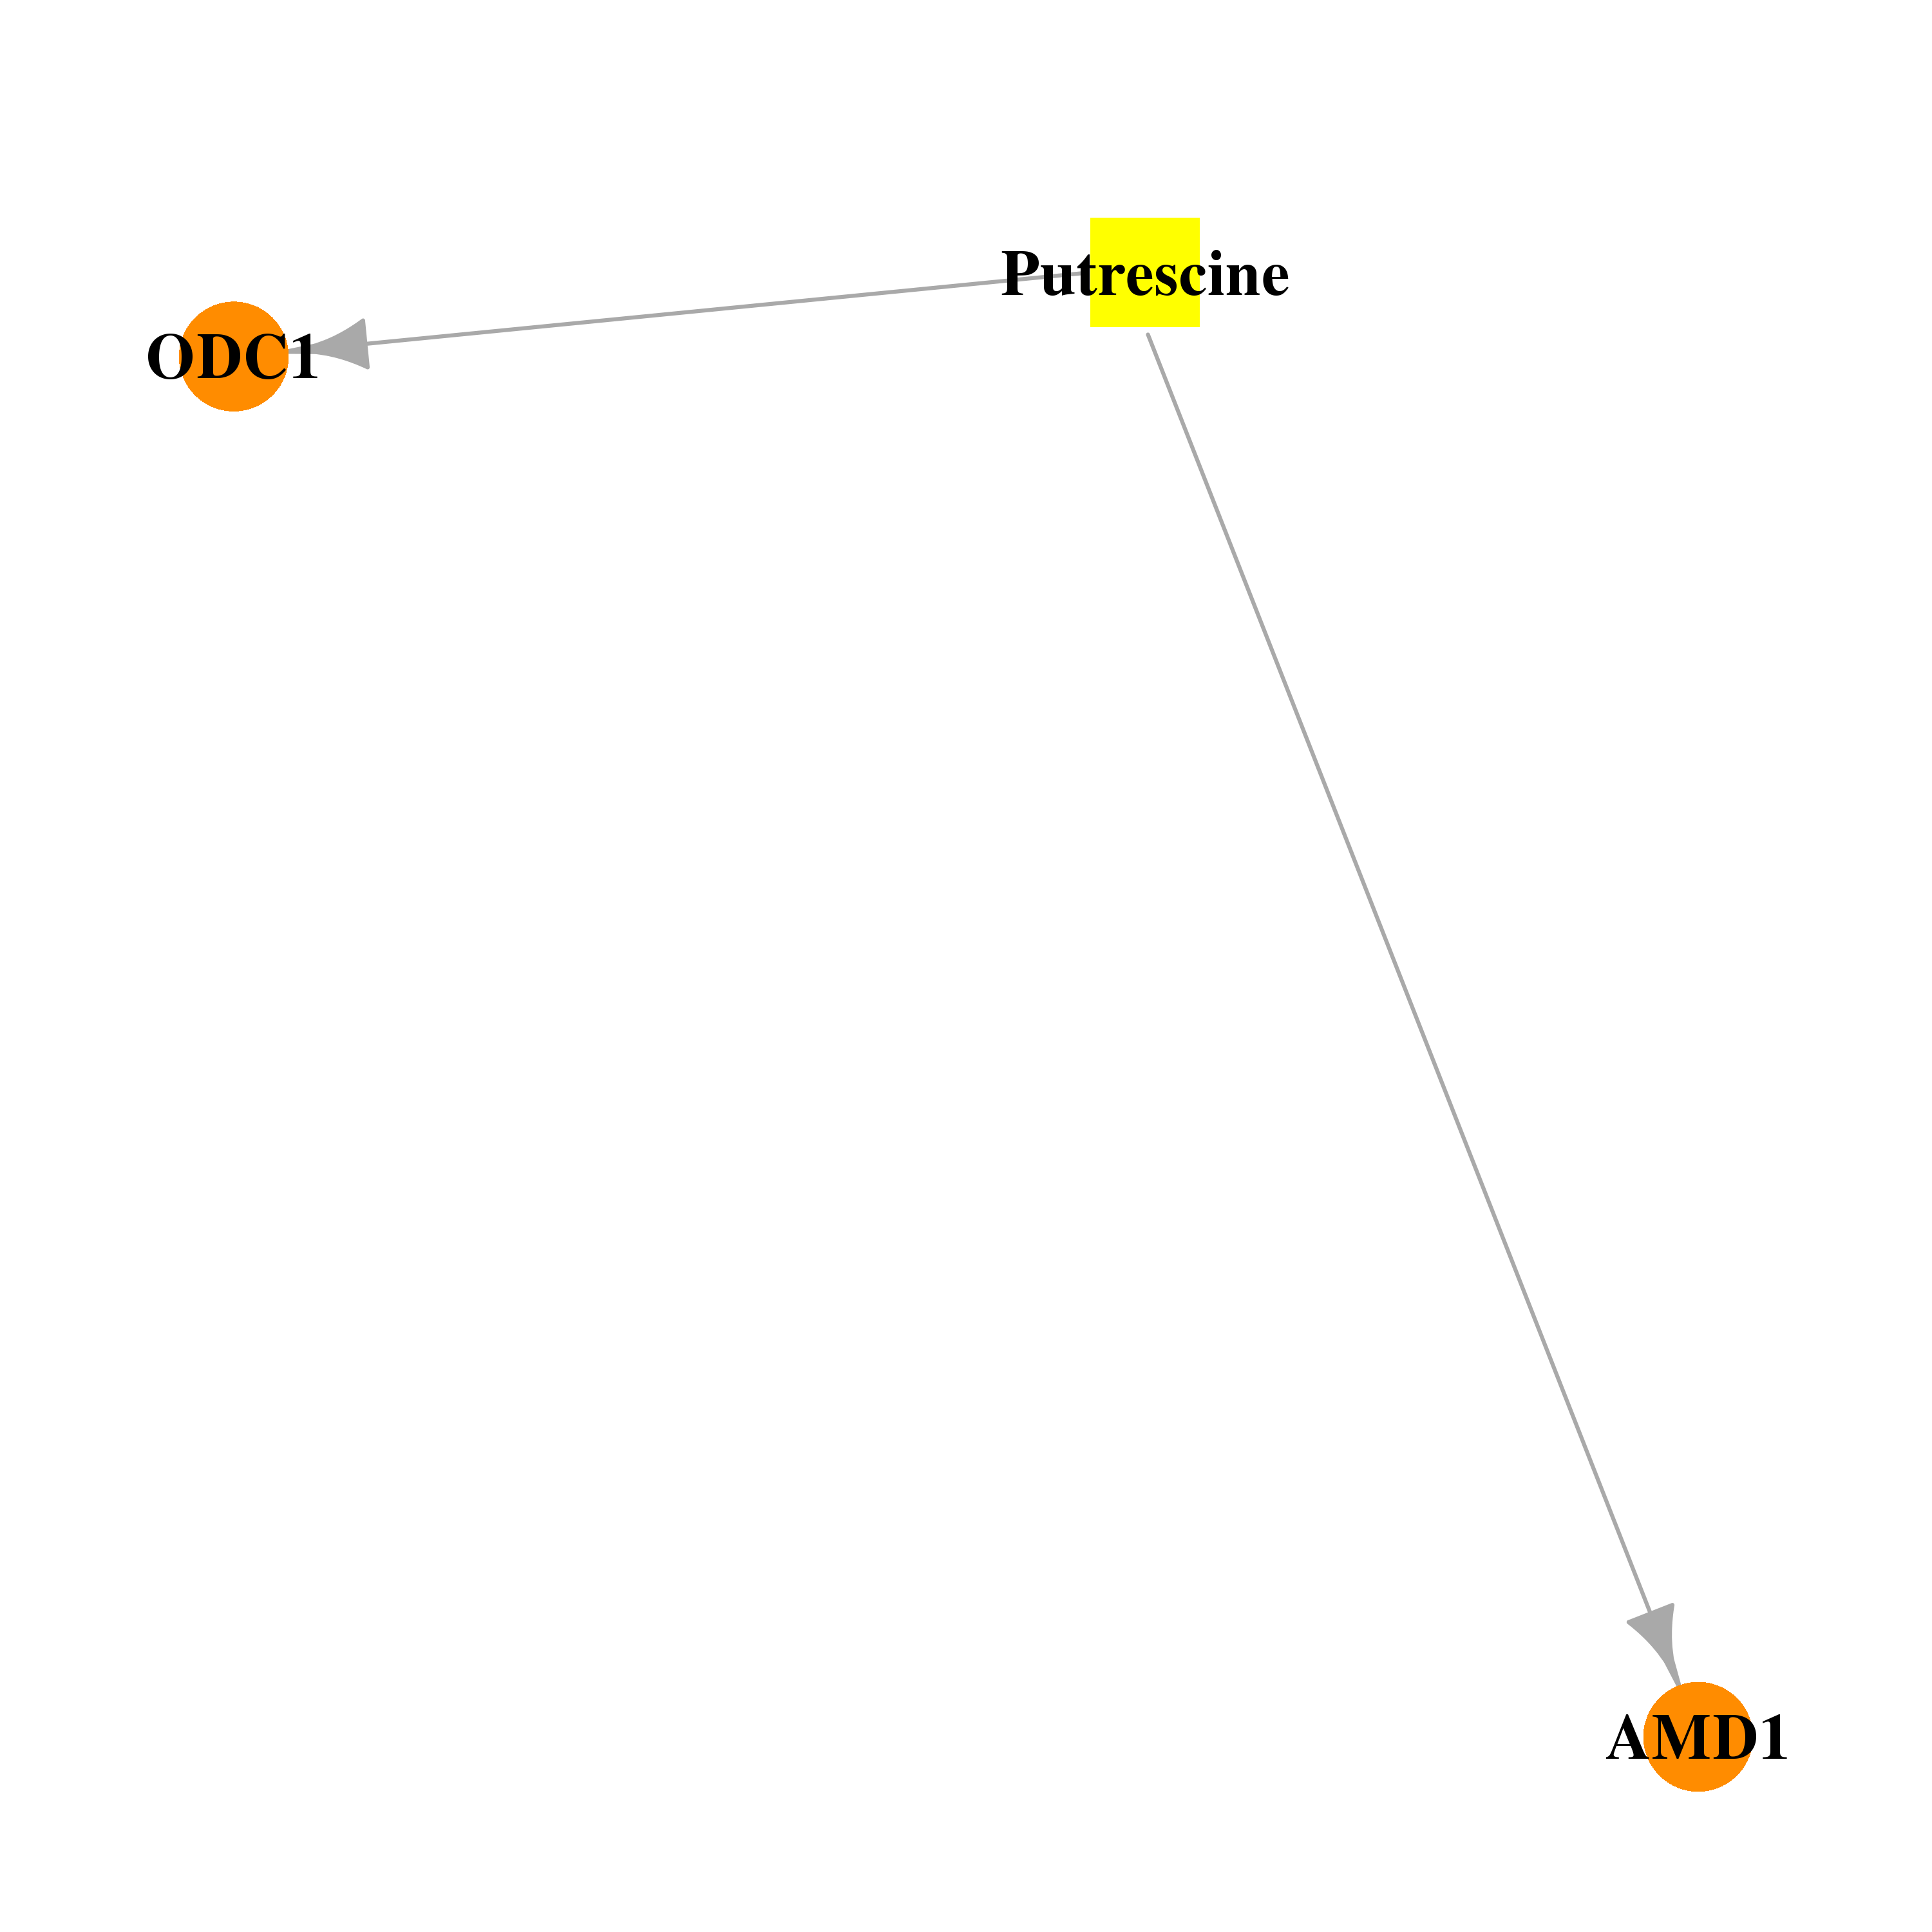 |  |
| DB03754 | adenosylmethionine decarboxylase 1 | experimental | Tris(Hydroxymethyl)Aminomethane | 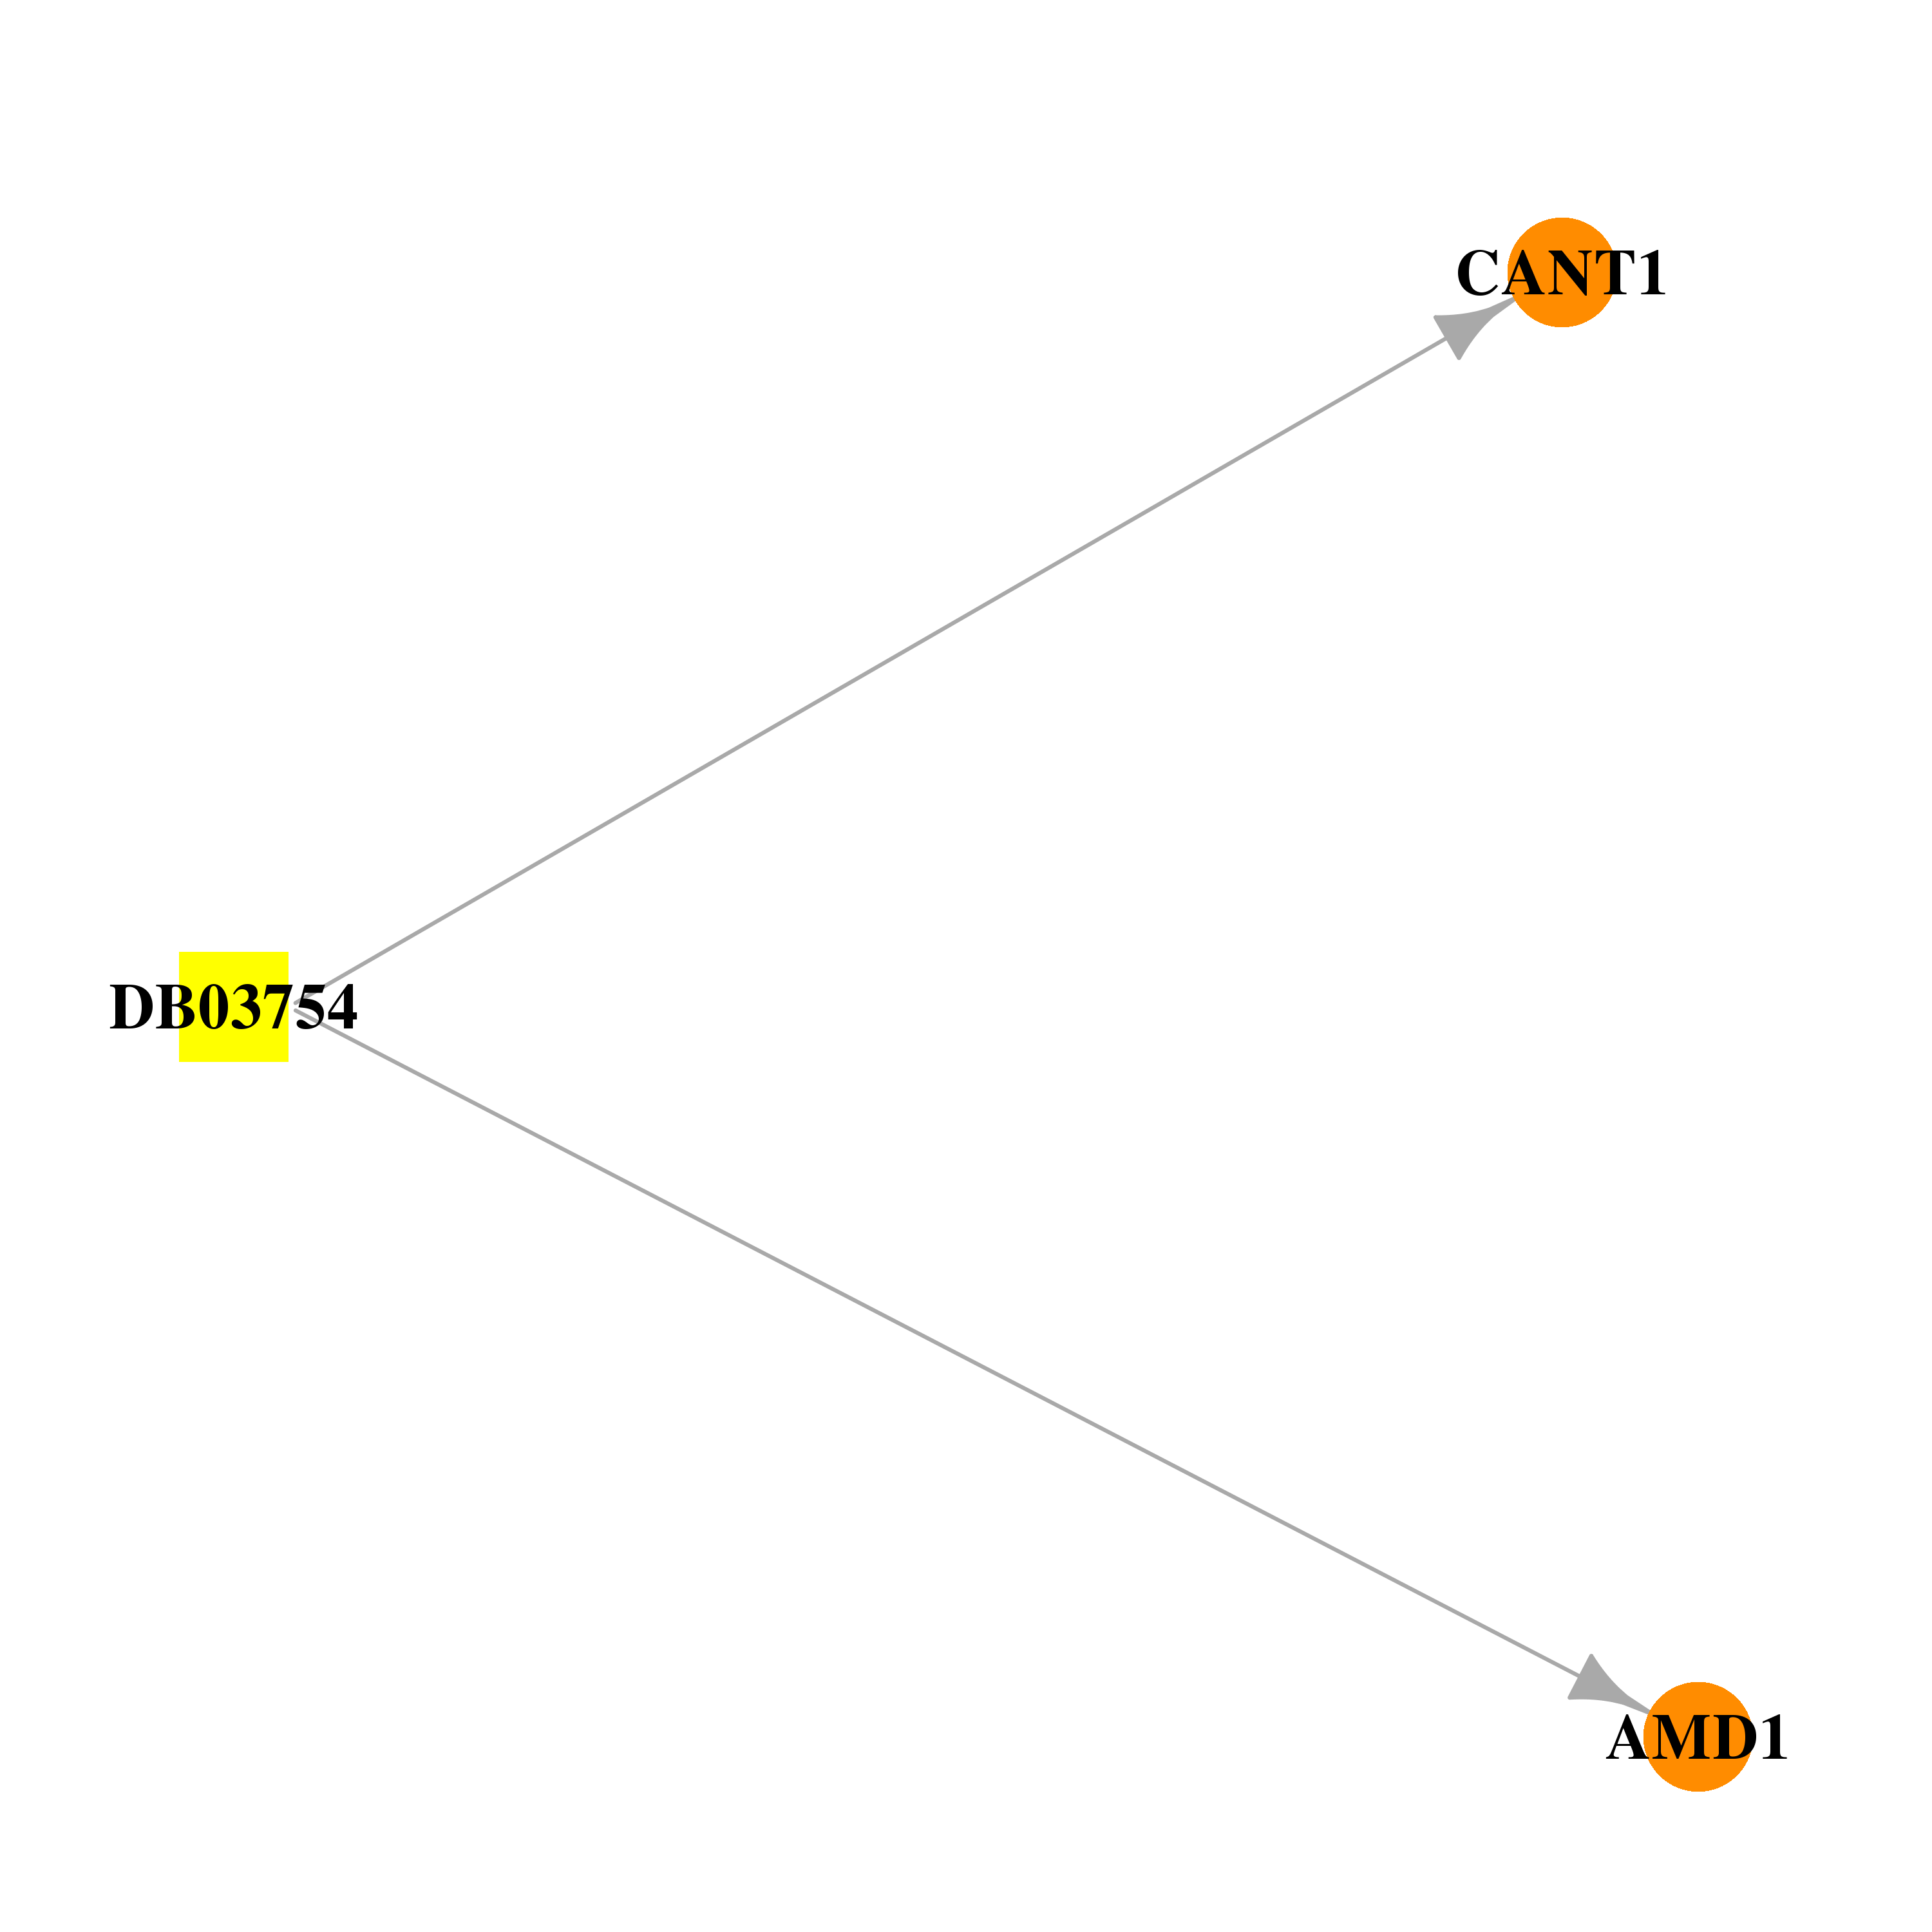 |  |
| DB08163 | adenosylmethionine decarboxylase 1 | experimental | 5'-{[4-(aminooxy)butyl](methyl)amino}-5'-deoxy-8-ethenyladenosine | 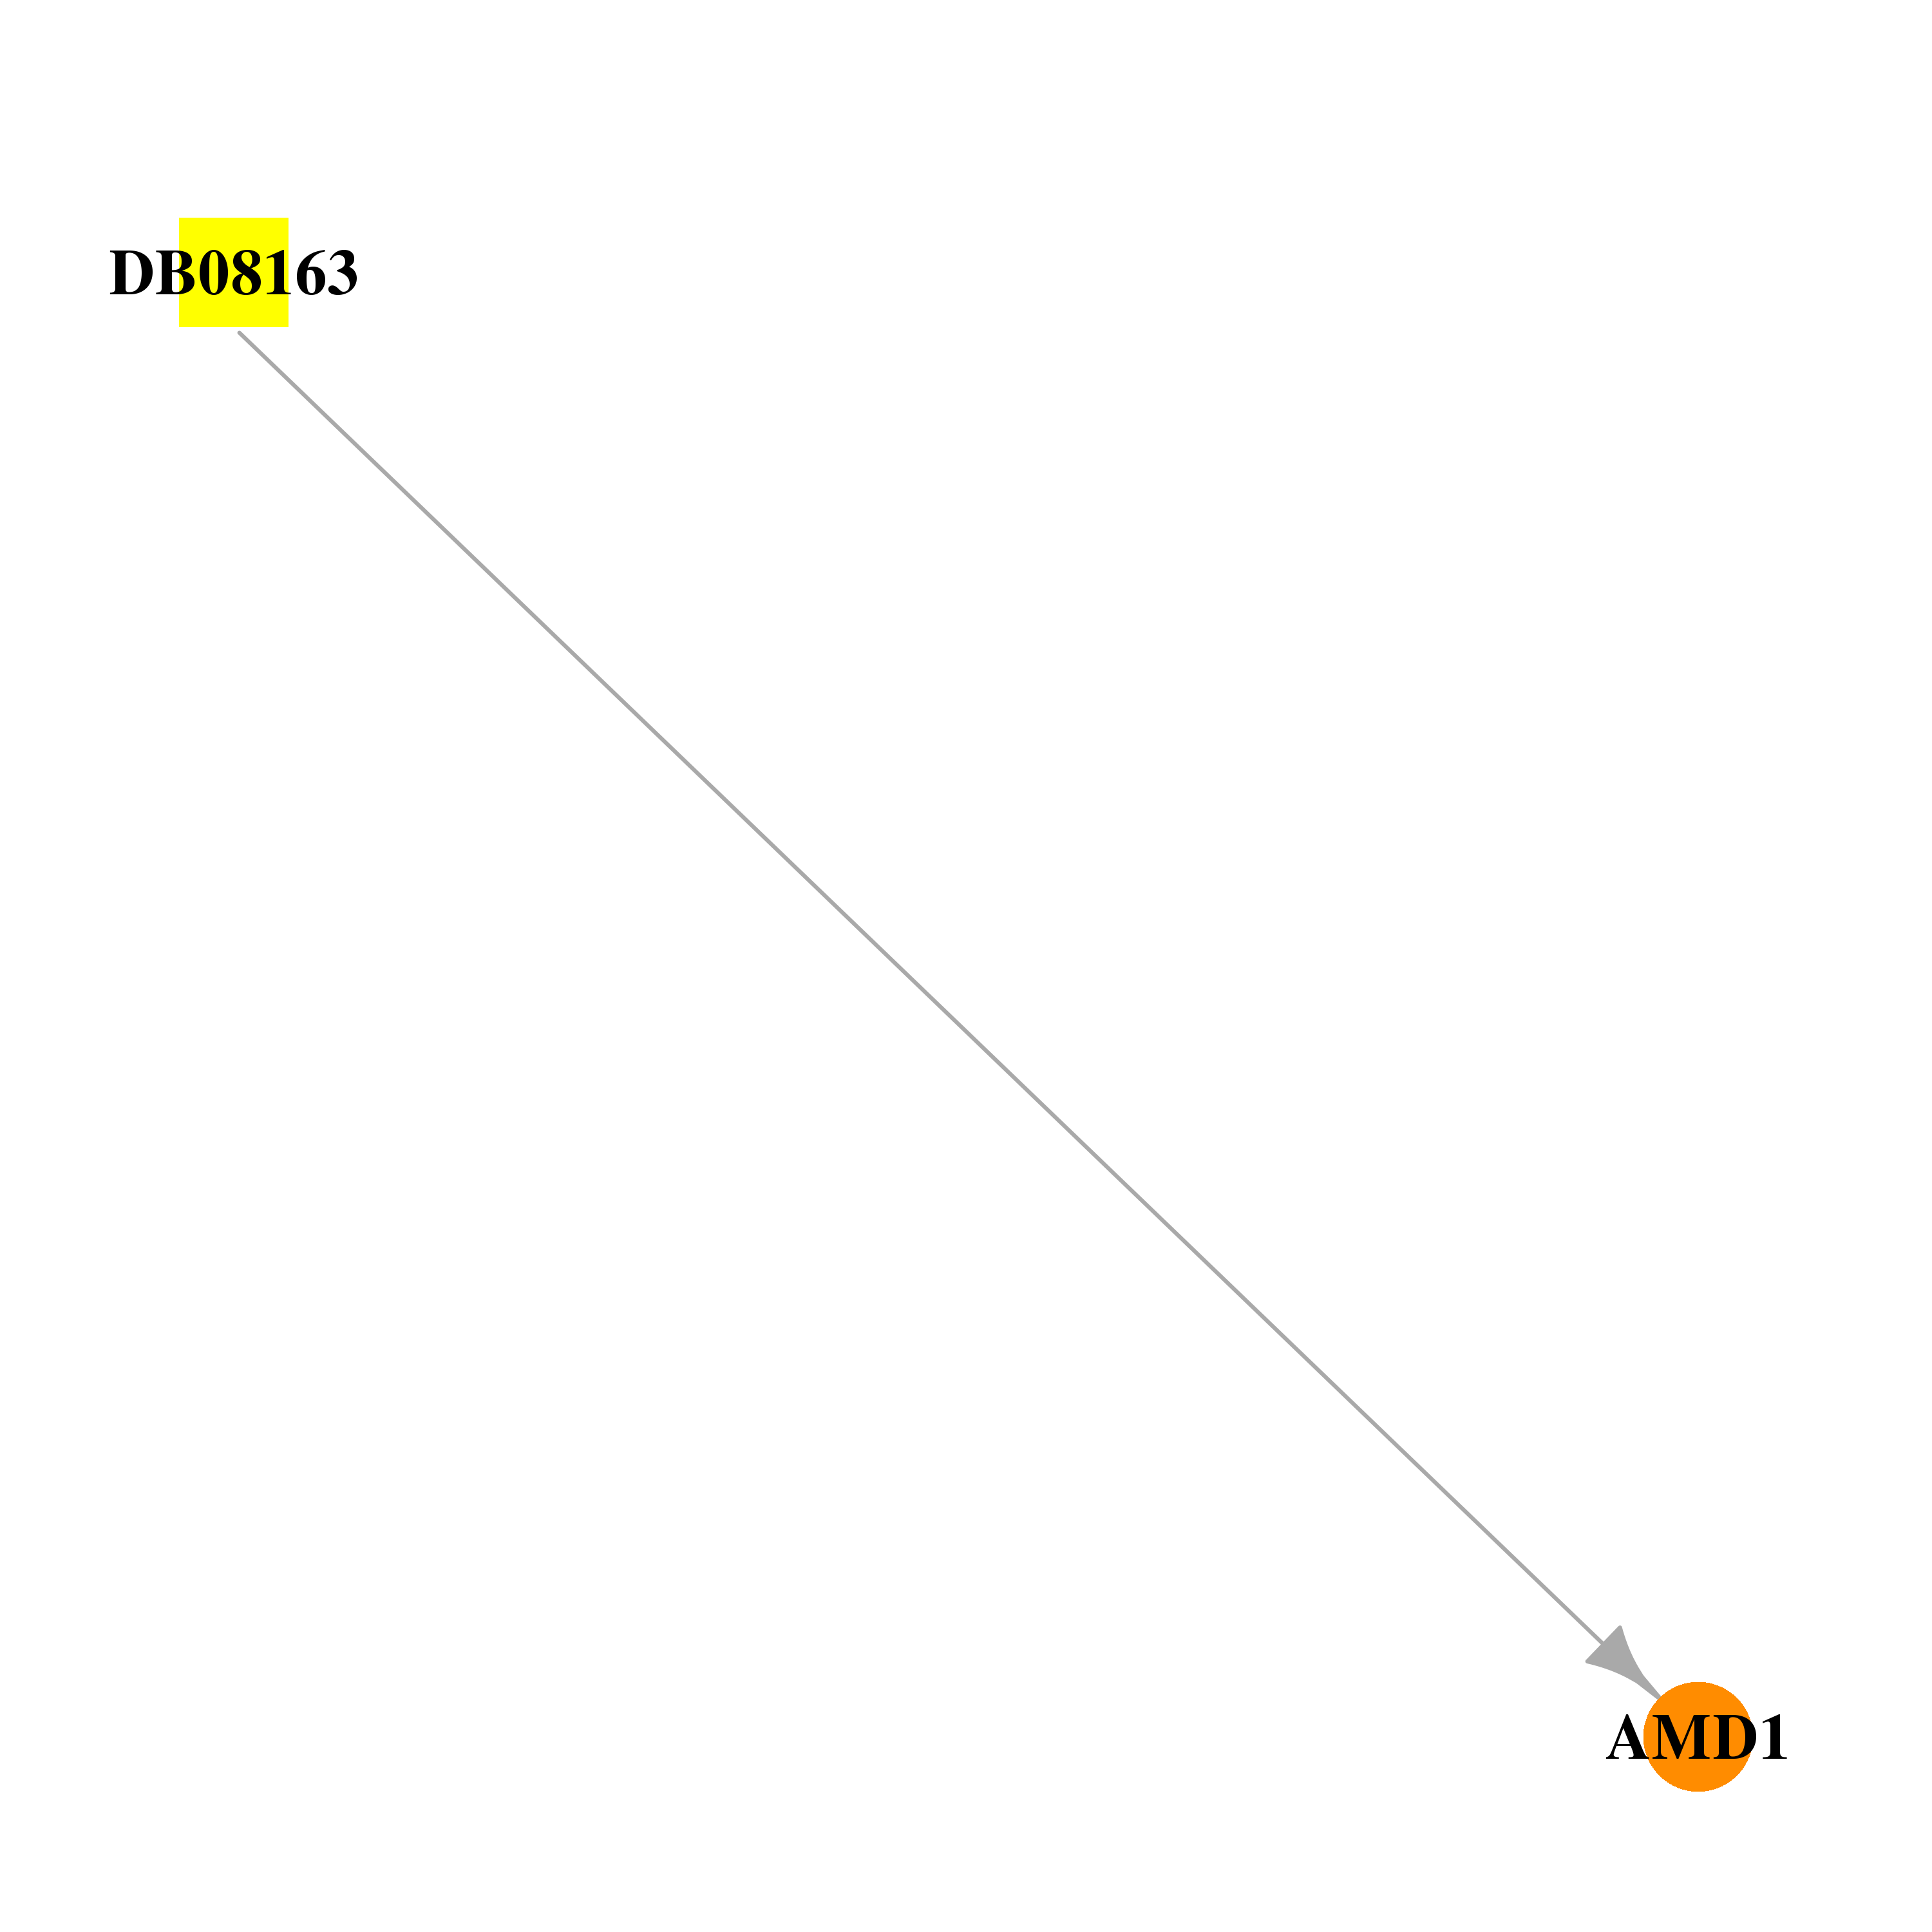 |  |
| DB00134 | adenosylmethionine decarboxylase 1 | approved; nutraceutical | L-Methionine |  |  |
| Top |
| Cross referenced IDs for AMD1 |
| * We obtained these cross-references from Uniprot database. It covers 150 different DBs, 18 categories. http://www.uniprot.org/help/cross_references_section |
: Open all cross reference information
|
Copyright © 2016-Present - The Univsersity of Texas Health Science Center at Houston @ |