|
||||||||||||||||||||
| |
| Phenotypic Information (metabolism pathway, cancer, disease, phenome) |
| |
| |
| Gene-Gene Network Information: Co-Expression Network, Interacting Genes & KEGG |
| |
|


| Gene Summary for B3GAT3 |
| Top |
| Phenotypic Information for B3GAT3(metabolism pathway, cancer, disease, phenome) |
| Cancer | CGAP: B3GAT3 |
| Familial Cancer Database: B3GAT3 | |
| * This gene is included in those cancer gene databases. |
|
|
|
|
|
|
| ||||||||||||||
Oncogene 1 | Significant driver gene in | |||||||||||||||||||
| cf) number; DB name 1 Oncogene; http://nar.oxfordjournals.org/content/35/suppl_1/D721.long, 2 Tumor Suppressor gene; https://bioinfo.uth.edu/TSGene/, 3 Cancer Gene Census; http://www.nature.com/nrc/journal/v4/n3/abs/nrc1299.html, 4 CancerGenes; http://nar.oxfordjournals.org/content/35/suppl_1/D721.long, 5 Network of Cancer Gene; http://ncg.kcl.ac.uk/index.php, 1Therapeutic Vulnerabilities in Cancer; http://cbio.mskcc.org/cancergenomics/statius/ |
| REACTOME_METABOLISM_OF_CARBOHYDRATES | |
| OMIM | |
| Orphanet | |
| Disease | KEGG Disease: B3GAT3 |
| MedGen: B3GAT3 (Human Medical Genetics with Condition) | |
| ClinVar: B3GAT3 | |
| Phenotype | MGI: B3GAT3 (International Mouse Phenotyping Consortium) |
| PhenomicDB: B3GAT3 | |
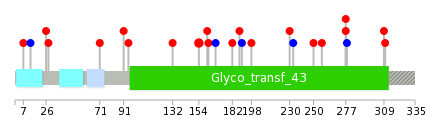
| Mutations for B3GAT3 |
| * Under tables are showing count per each tissue to give us broad intuition about tissue specific mutation patterns.You can go to the detailed page for each mutation database's web site. |
| - Statistics for Tissue and Mutation type | Top |
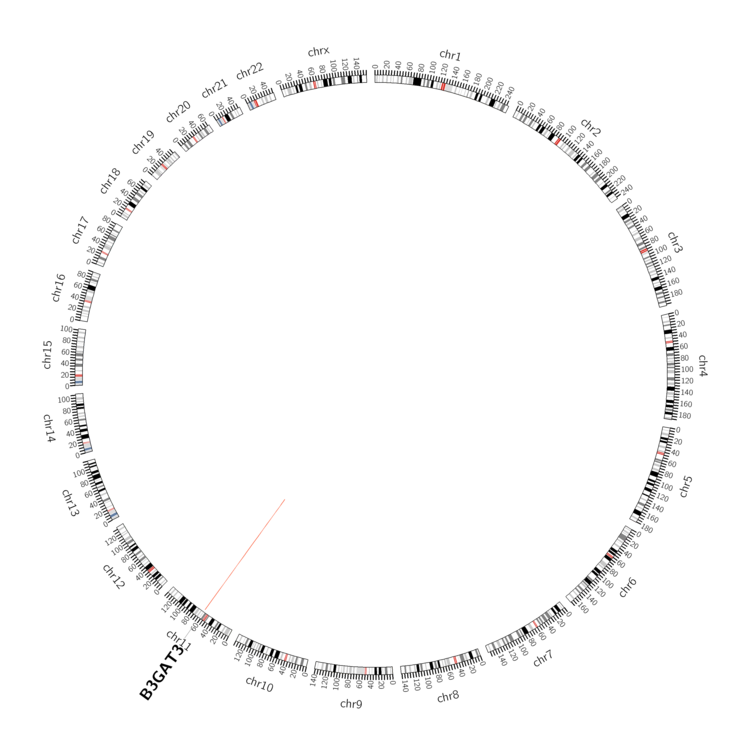 |
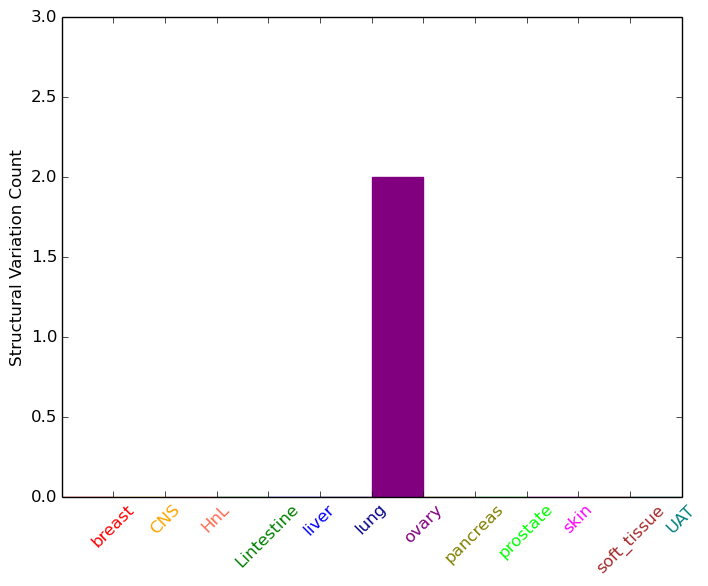
| - For Inter-chromosomal Variations |
| There's no inter-chromosomal structural variation. |
| - For Intra-chromosomal Variations |
| * Intra-chromosomal variantions includes 'intrachromosomal amplicon to amplicon', 'intrachromosomal amplicon to non-amplified dna', 'intrachromosomal deletion', 'intrachromosomal fold-back inversion', 'intrachromosomal inversion', 'intrachromosomal tandem duplication', 'Intrachromosomal unknown type', 'intrachromosomal with inverted orientation', 'intrachromosomal with non-inverted orientation'. |
 |
| Sample | Symbol_a | Chr_a | Start_a | End_a | Symbol_b | Chr_b | Start_b | End_b |
| ovary | B3GAT3 | chr11 | 62387068 | 62387088 | chr11 | 62694837 | 62694857 | |
| ovary | B3GAT3 | chr11 | 62387069 | 62387089 | chr11 | 62694837 | 62694857 |
| cf) Tissue number; Tissue name (1;Breast, 2;Central_nervous_system, 3;Haematopoietic_and_lymphoid_tissue, 4;Large_intestine, 5;Liver, 6;Lung, 7;Ovary, 8;Pancreas, 9;Prostate, 10;Skin, 11;Soft_tissue, 12;Upper_aerodigestive_tract) |
| * From mRNA Sanger sequences, Chitars2.0 arranged chimeric transcripts. This table shows B3GAT3 related fusion information. |
| ID | Head Gene | Tail Gene | Accession | Gene_a | qStart_a | qEnd_a | Chromosome_a | tStart_a | tEnd_a | Gene_a | qStart_a | qEnd_a | Chromosome_a | tStart_a | tEnd_a |
| BP227858 | SHC4 | 1 | 437 | 15 | 49170287 | 49170723 | B3GAT3 | 430 | 564 | 11 | 62387968 | 62388102 | |
| BX107986 | B3GAT3 | 1 | 139 | 11 | 62388055 | 62389397 | SLC8A3 | 136 | 488 | 14 | 70513747 | 70514099 | |
| BU738636 | B3GAT3 | 18 | 57 | 11 | 62382768 | 62382807 | ATP1B2 | 54 | 593 | 17 | 7558922 | 7559565 | |
| Top |
| There's no copy number variation information in COSMIC data for this gene. |
| Top |
|
 |
| Top |
| Stat. for Non-Synonymous SNVs (# total SNVs=17) | (# total SNVs=8) |
 |  |
(# total SNVs=0) | (# total SNVs=0) |
| Top |
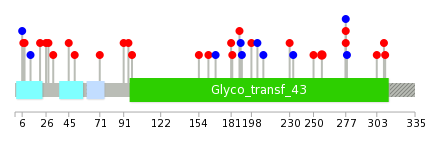
| * When you move the cursor on each content, you can see more deailed mutation information on the Tooltip. Those are primary_site,primary_histology,mutation(aa),pubmedID. |
| GRCh37 position | Mutation(aa) | Unique sampleID count |
| chr11:62384058-62384058 | p.R277W | 2 |
| chr11:62384117-62384117 | p.A257V | 2 |
| chr11:62388092-62388092 | p.R45L | 1 |
| chr11:62384188-62384188 | p.D233D | 1 |
| chr11:62384535-62384535 | p.P181Q | 1 |
| chr11:62388127-62388127 | p.C33* | 1 |
| chr11:62384199-62384199 | p.Q230E | 1 |
| chr11:62384573-62384573 | p.L168L | 1 |
| chr11:62383253-62383253 | p.R310W | 1 |
| chr11:62388132-62388132 | p.D32N | 1 |
| Top |
|
 |
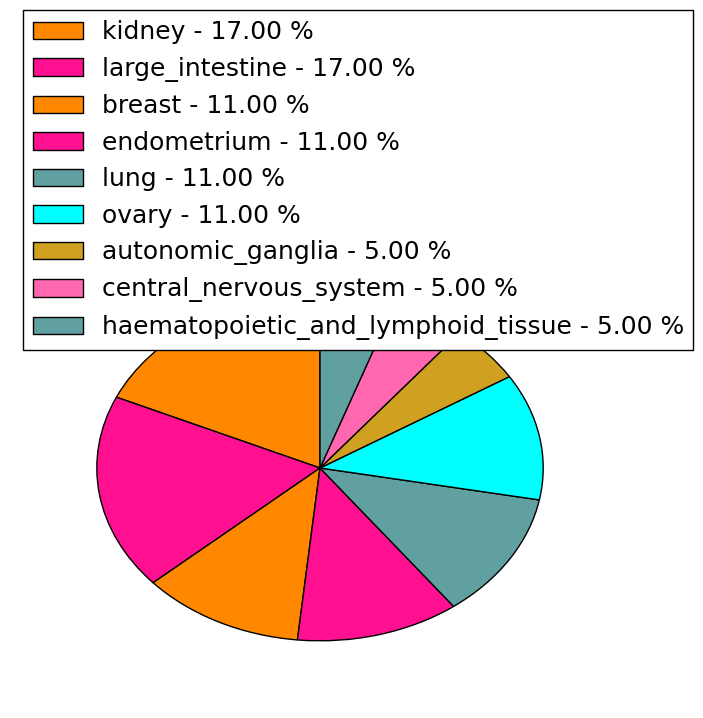
| Point Mutation/ Tissue ID | 1 | 2 | 3 | 4 | 5 | 6 | 7 | 8 | 9 | 10 | 11 | 12 | 13 | 14 | 15 | 16 | 17 | 18 | 19 | 20 |
| # sample | 1 | 1 | 3 | 3 | 1 | 2 | 2 | 2 | 5 | 3 | 2 | |||||||||
| # mutation | 1 | 1 | 3 | 3 | 1 | 2 | 2 | 2 | 5 | 3 | 2 | |||||||||
| nonsynonymous SNV | 1 | 1 | 1 | 3 | 1 | 1 | 1 | 2 | 4 | 3 | 2 | |||||||||
| synonymous SNV | 2 | 1 | 1 | 1 |
| cf) Tissue ID; Tissue type (1; BLCA[Bladder Urothelial Carcinoma], 2; BRCA[Breast invasive carcinoma], 3; CESC[Cervical squamous cell carcinoma and endocervical adenocarcinoma], 4; COAD[Colon adenocarcinoma], 5; GBM[Glioblastoma multiforme], 6; Glioma Low Grade, 7; HNSC[Head and Neck squamous cell carcinoma], 8; KICH[Kidney Chromophobe], 9; KIRC[Kidney renal clear cell carcinoma], 10; KIRP[Kidney renal papillary cell carcinoma], 11; LAML[Acute Myeloid Leukemia], 12; LUAD[Lung adenocarcinoma], 13; LUSC[Lung squamous cell carcinoma], 14; OV[Ovarian serous cystadenocarcinoma ], 15; PAAD[Pancreatic adenocarcinoma], 16; PRAD[Prostate adenocarcinoma], 17; SKCM[Skin Cutaneous Melanoma], 18:STAD[Stomach adenocarcinoma], 19:THCA[Thyroid carcinoma], 20:UCEC[Uterine Corpus Endometrial Carcinoma]) |
| Top |
| * We represented just top 10 SNVs. When you move the cursor on each content, you can see more deailed mutation information on the Tooltip. Those are primary_site, primary_histology, mutation(aa), pubmedID. |
| Genomic Position | Mutation(aa) | Unique sampleID count |
| chr11:62384617 | p.H154Y,B3GAT3 | 2 |
| chr11:62384485 | p.P250L,B3GAT3 | 1 |
| chr11:62388015 | p.Q26H,B3GAT3 | 1 |
| chr11:62384507 | p.D233D,B3GAT3 | 1 |
| chr11:62389338 | p.F13F,B3GAT3 | 1 |
| chr11:62383253 | p.Q230E,B3GAT3 | 1 |
| chr11:62384514 | p.N7K,B3GAT3 | 1 |
| chr11:62389342 | p.T198A,B3GAT3 | 1 |
| chr11:62383255 | p.V190V,B3GAT3 | 1 |
| chr11:62384532 | p.G188V,B3GAT3 | 1 |
| * Copy number data were extracted from TCGA using R package TCGA-Assembler. The URLs of all public data files on TCGA DCC data server were gathered on Jan-05-2015. Function ProcessCNAData in TCGA-Assembler package was used to obtain gene-level copy number value which is calculated as the average copy number of the genomic region of a gene. |
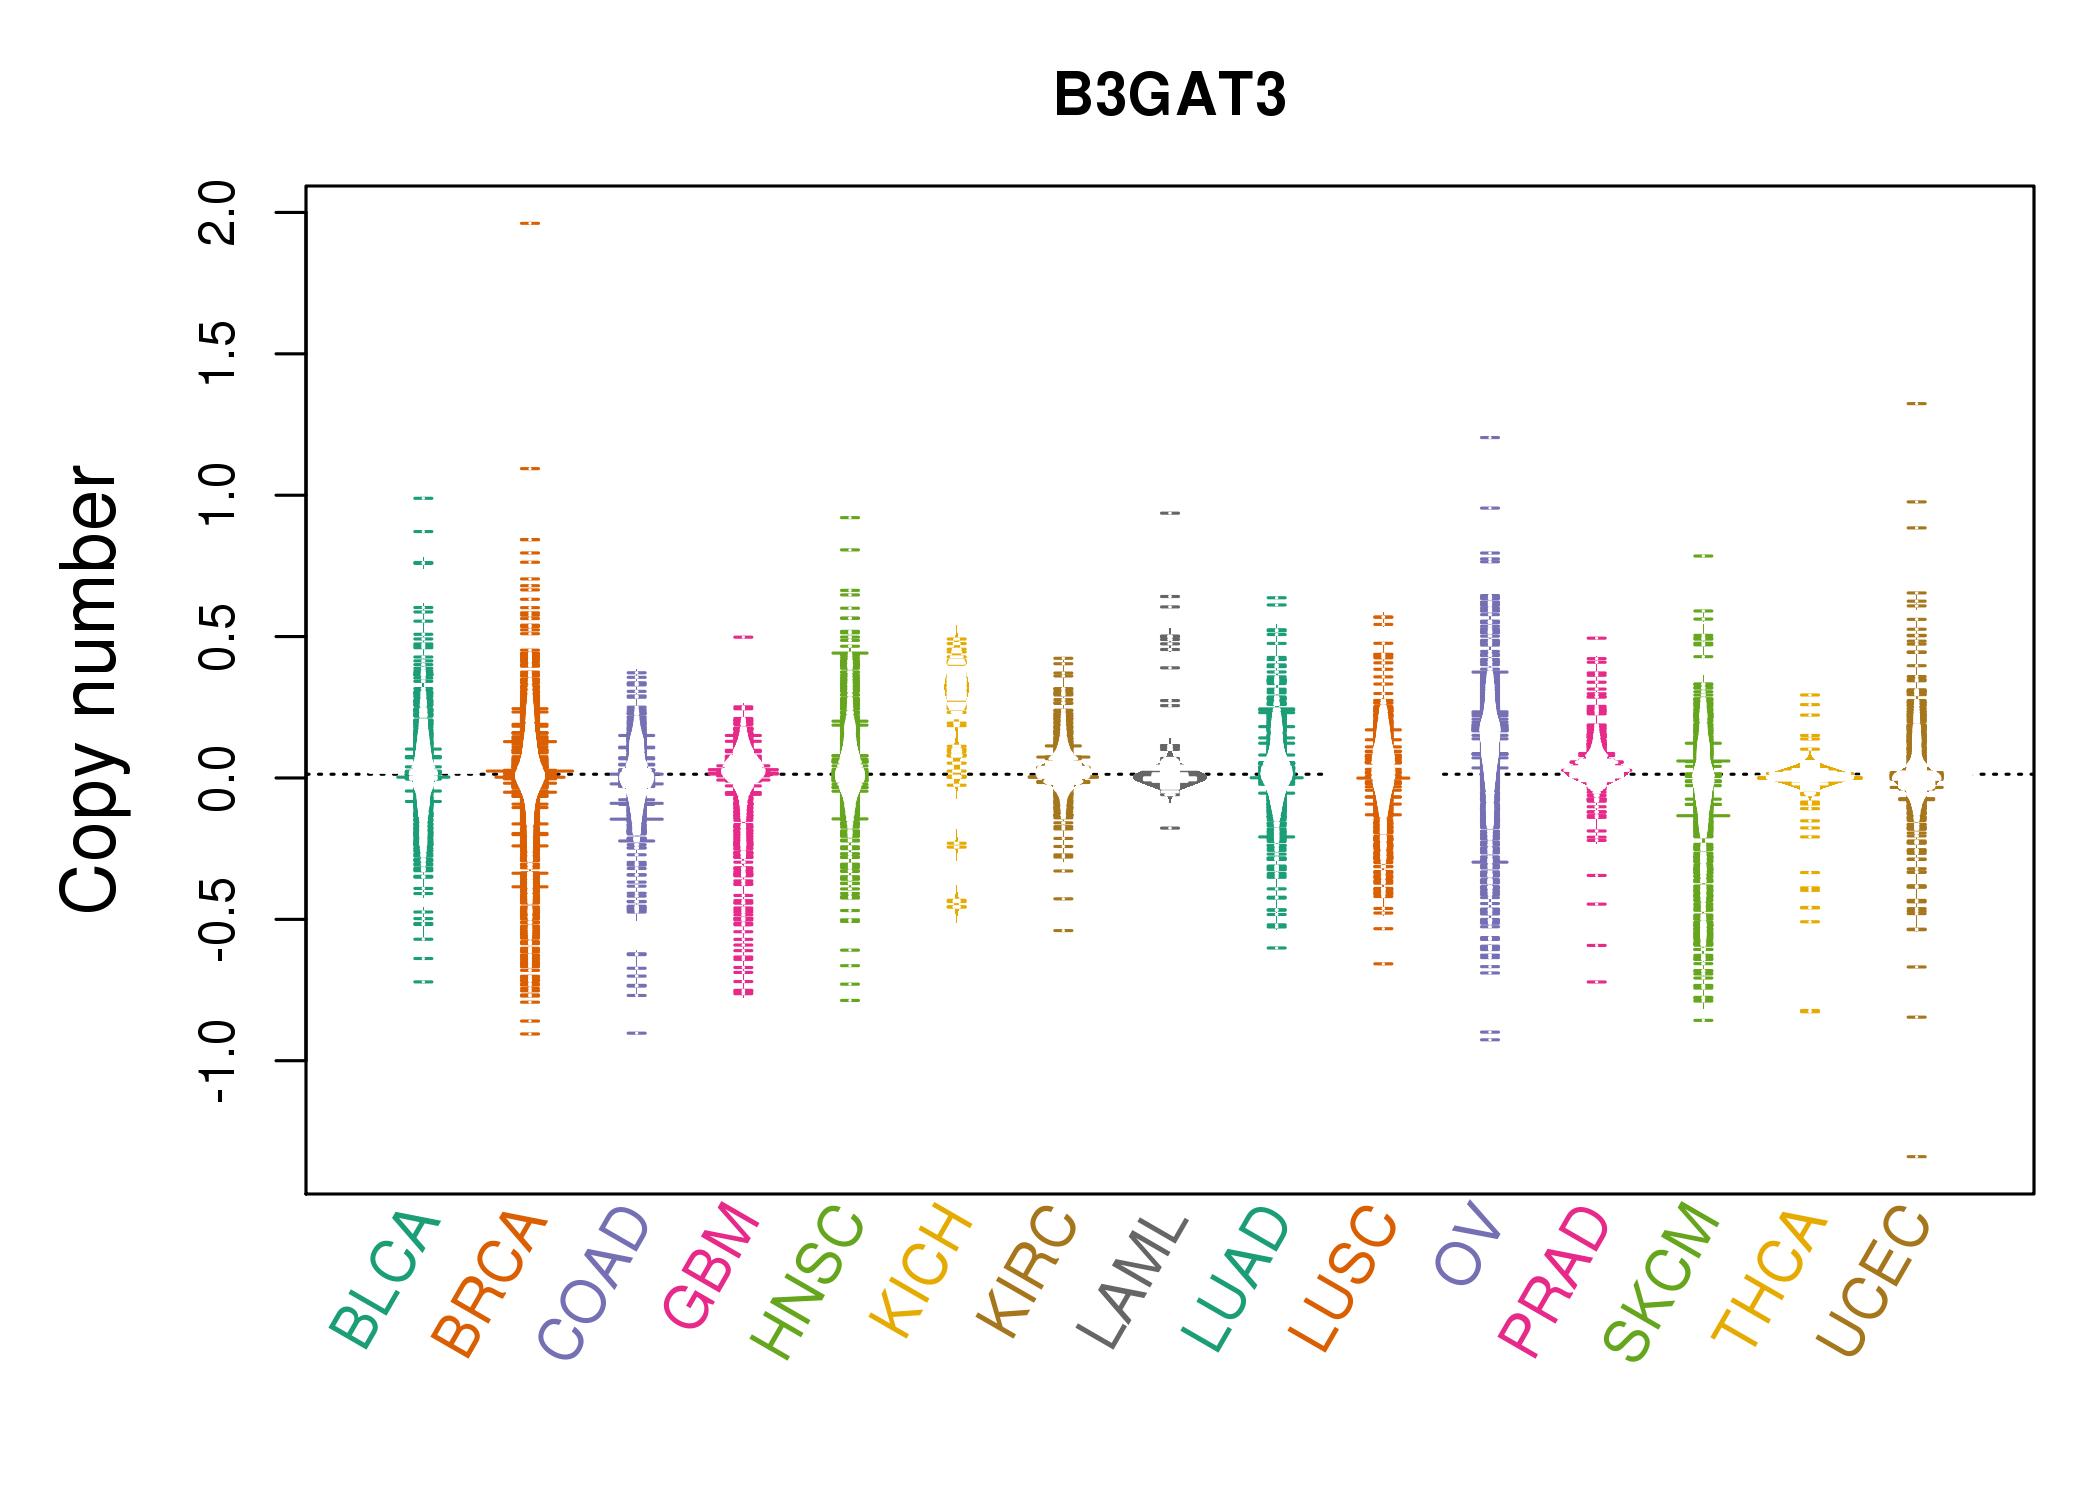 |
| cf) Tissue ID[Tissue type]: BLCA[Bladder Urothelial Carcinoma], BRCA[Breast invasive carcinoma], CESC[Cervical squamous cell carcinoma and endocervical adenocarcinoma], COAD[Colon adenocarcinoma], GBM[Glioblastoma multiforme], Glioma Low Grade, HNSC[Head and Neck squamous cell carcinoma], KICH[Kidney Chromophobe], KIRC[Kidney renal clear cell carcinoma], KIRP[Kidney renal papillary cell carcinoma], LAML[Acute Myeloid Leukemia], LUAD[Lung adenocarcinoma], LUSC[Lung squamous cell carcinoma], OV[Ovarian serous cystadenocarcinoma ], PAAD[Pancreatic adenocarcinoma], PRAD[Prostate adenocarcinoma], SKCM[Skin Cutaneous Melanoma], STAD[Stomach adenocarcinoma], THCA[Thyroid carcinoma], UCEC[Uterine Corpus Endometrial Carcinoma] |
| Top |
| Gene Expression for B3GAT3 |
| * CCLE gene expression data were extracted from CCLE_Expression_Entrez_2012-10-18.res: Gene-centric RMA-normalized mRNA expression data. |
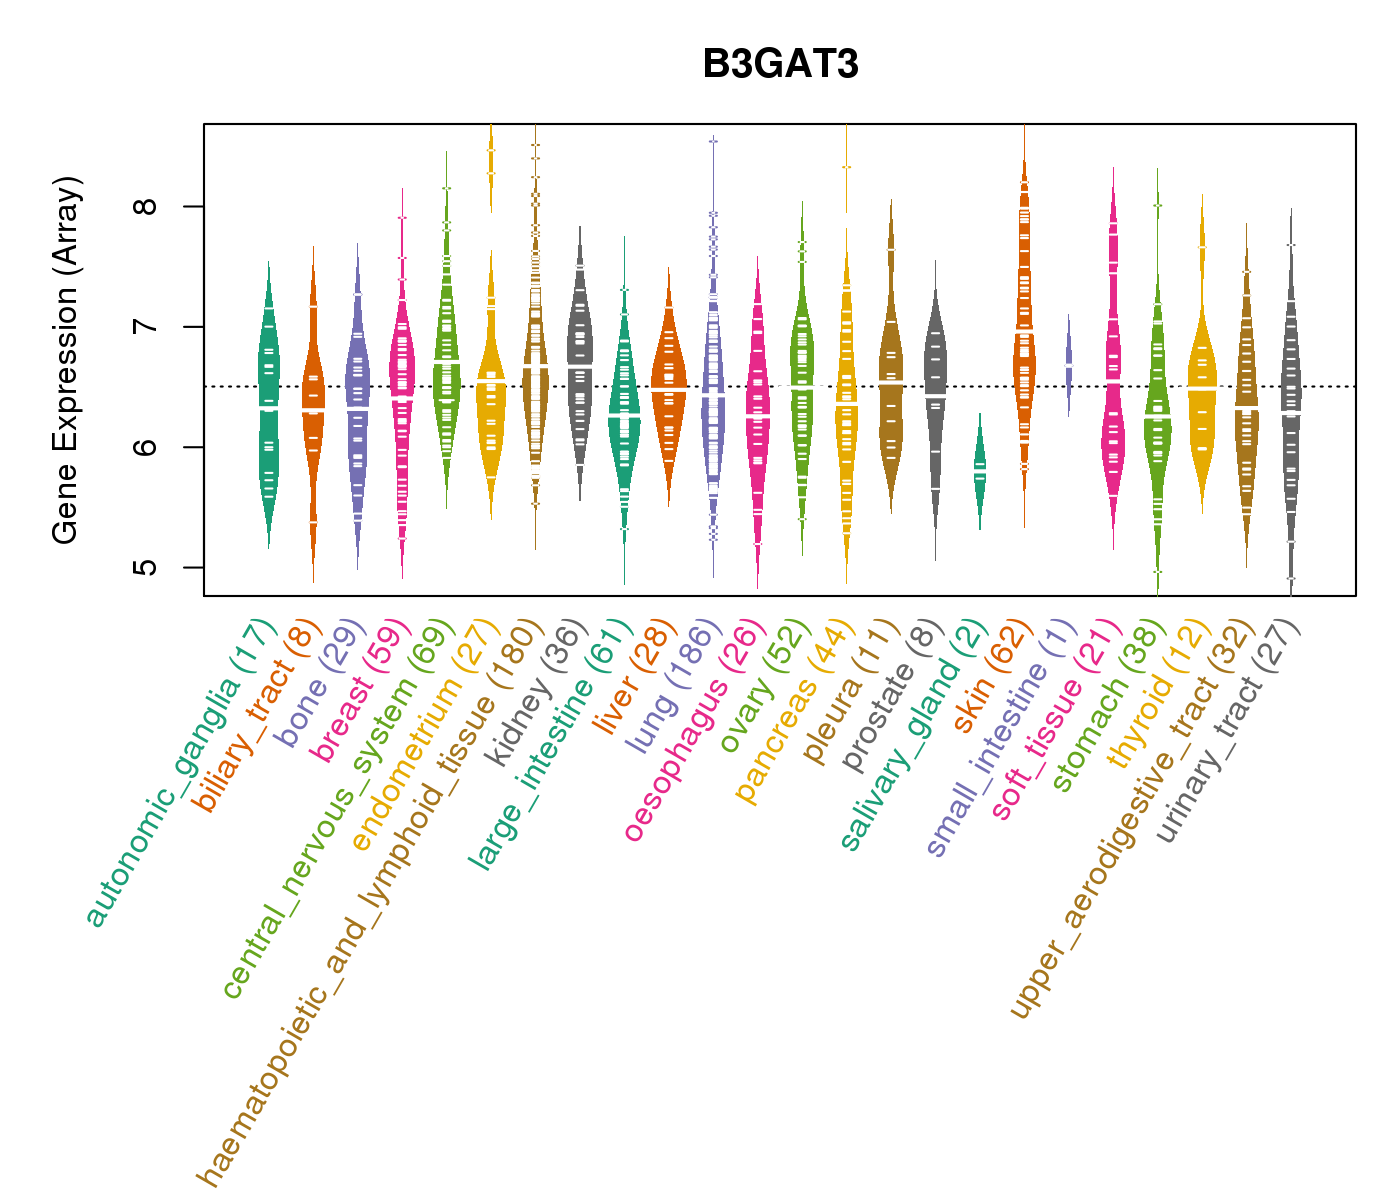 |
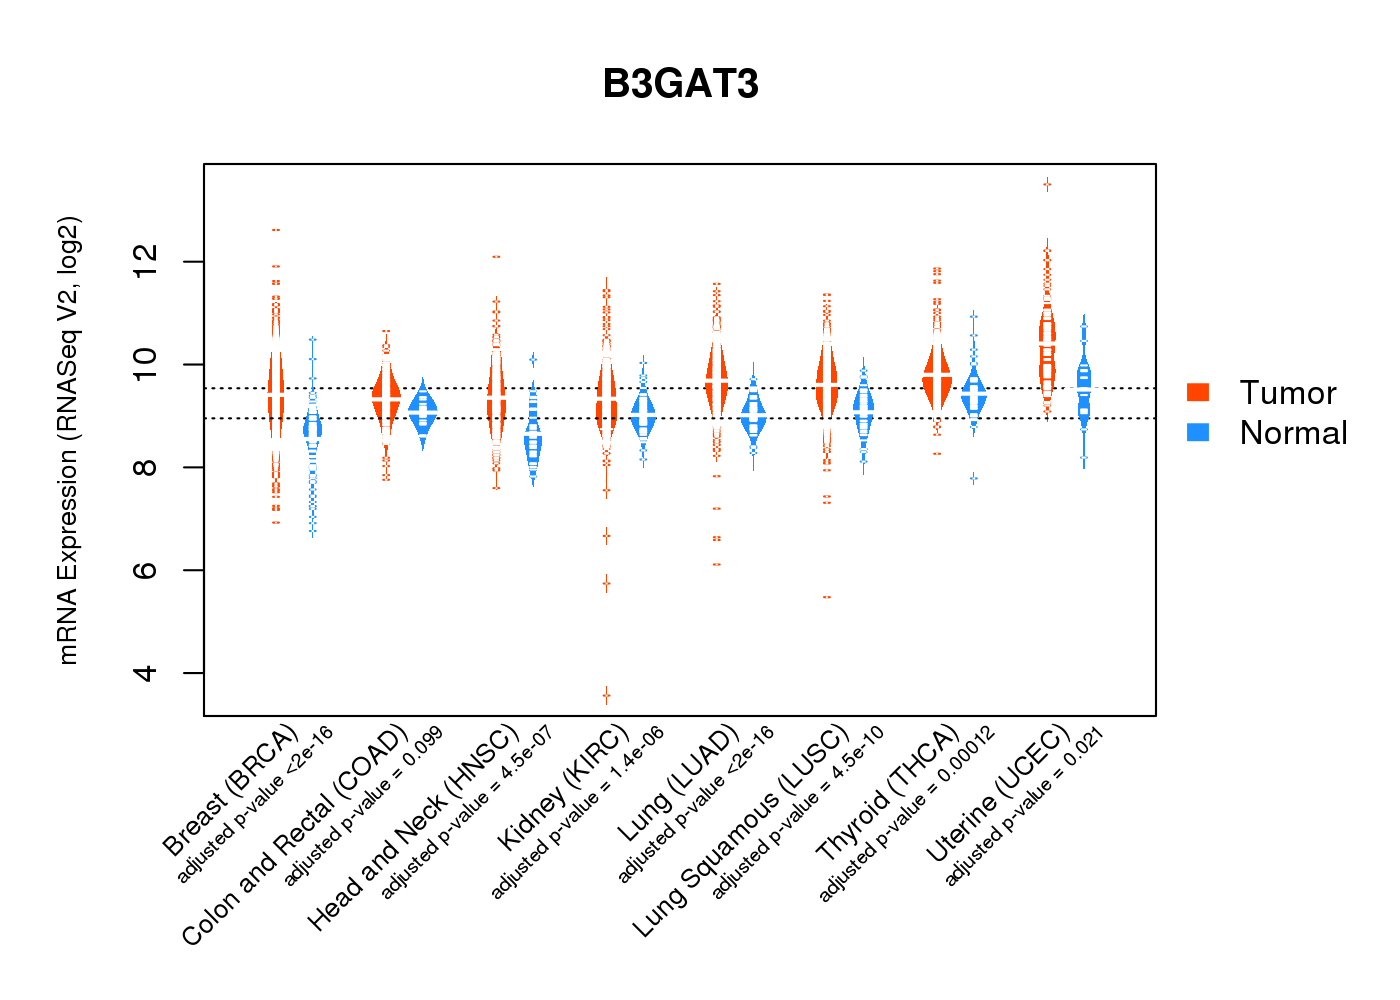
| * Normalized gene expression data of RNASeqV2 was extracted from TCGA using R package TCGA-Assembler. The URLs of all public data files on TCGA DCC data server were gathered at Jan-05-2015. Only eight cancer types have enough normal control samples for differential expression analysis. (t test, adjusted p<0.05 (using Benjamini-Hochberg FDR)) |
 |
| Top |
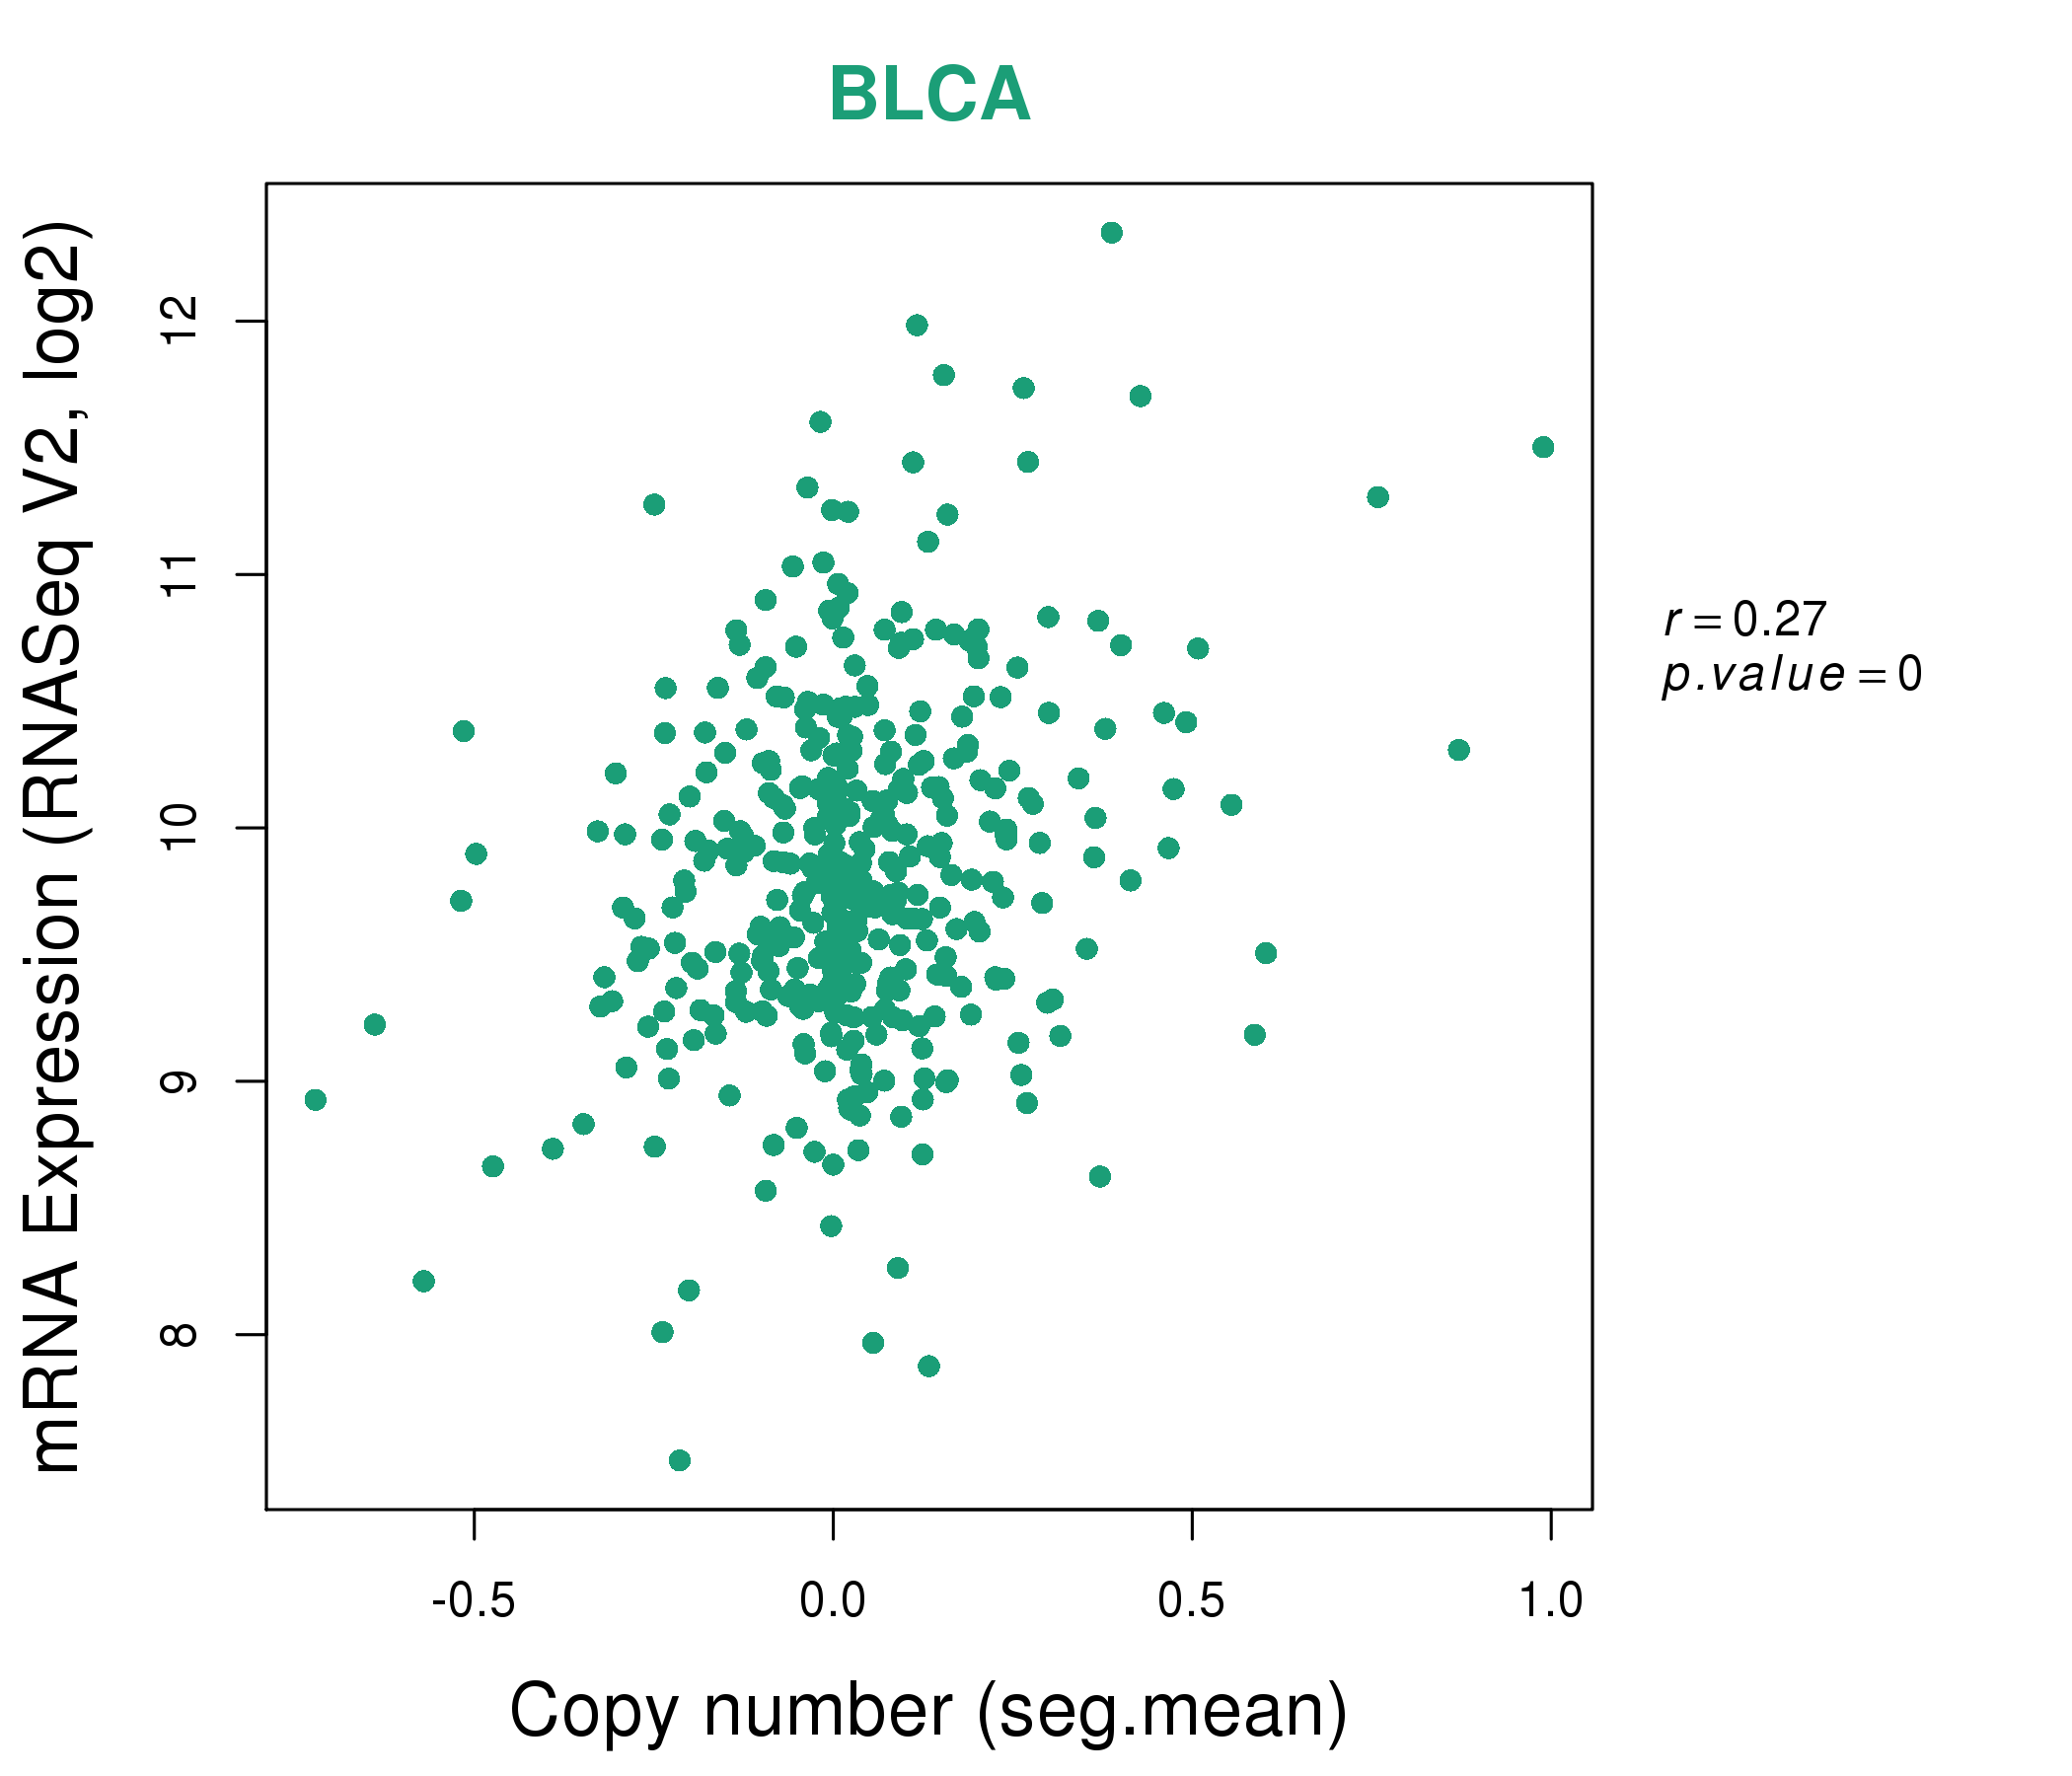
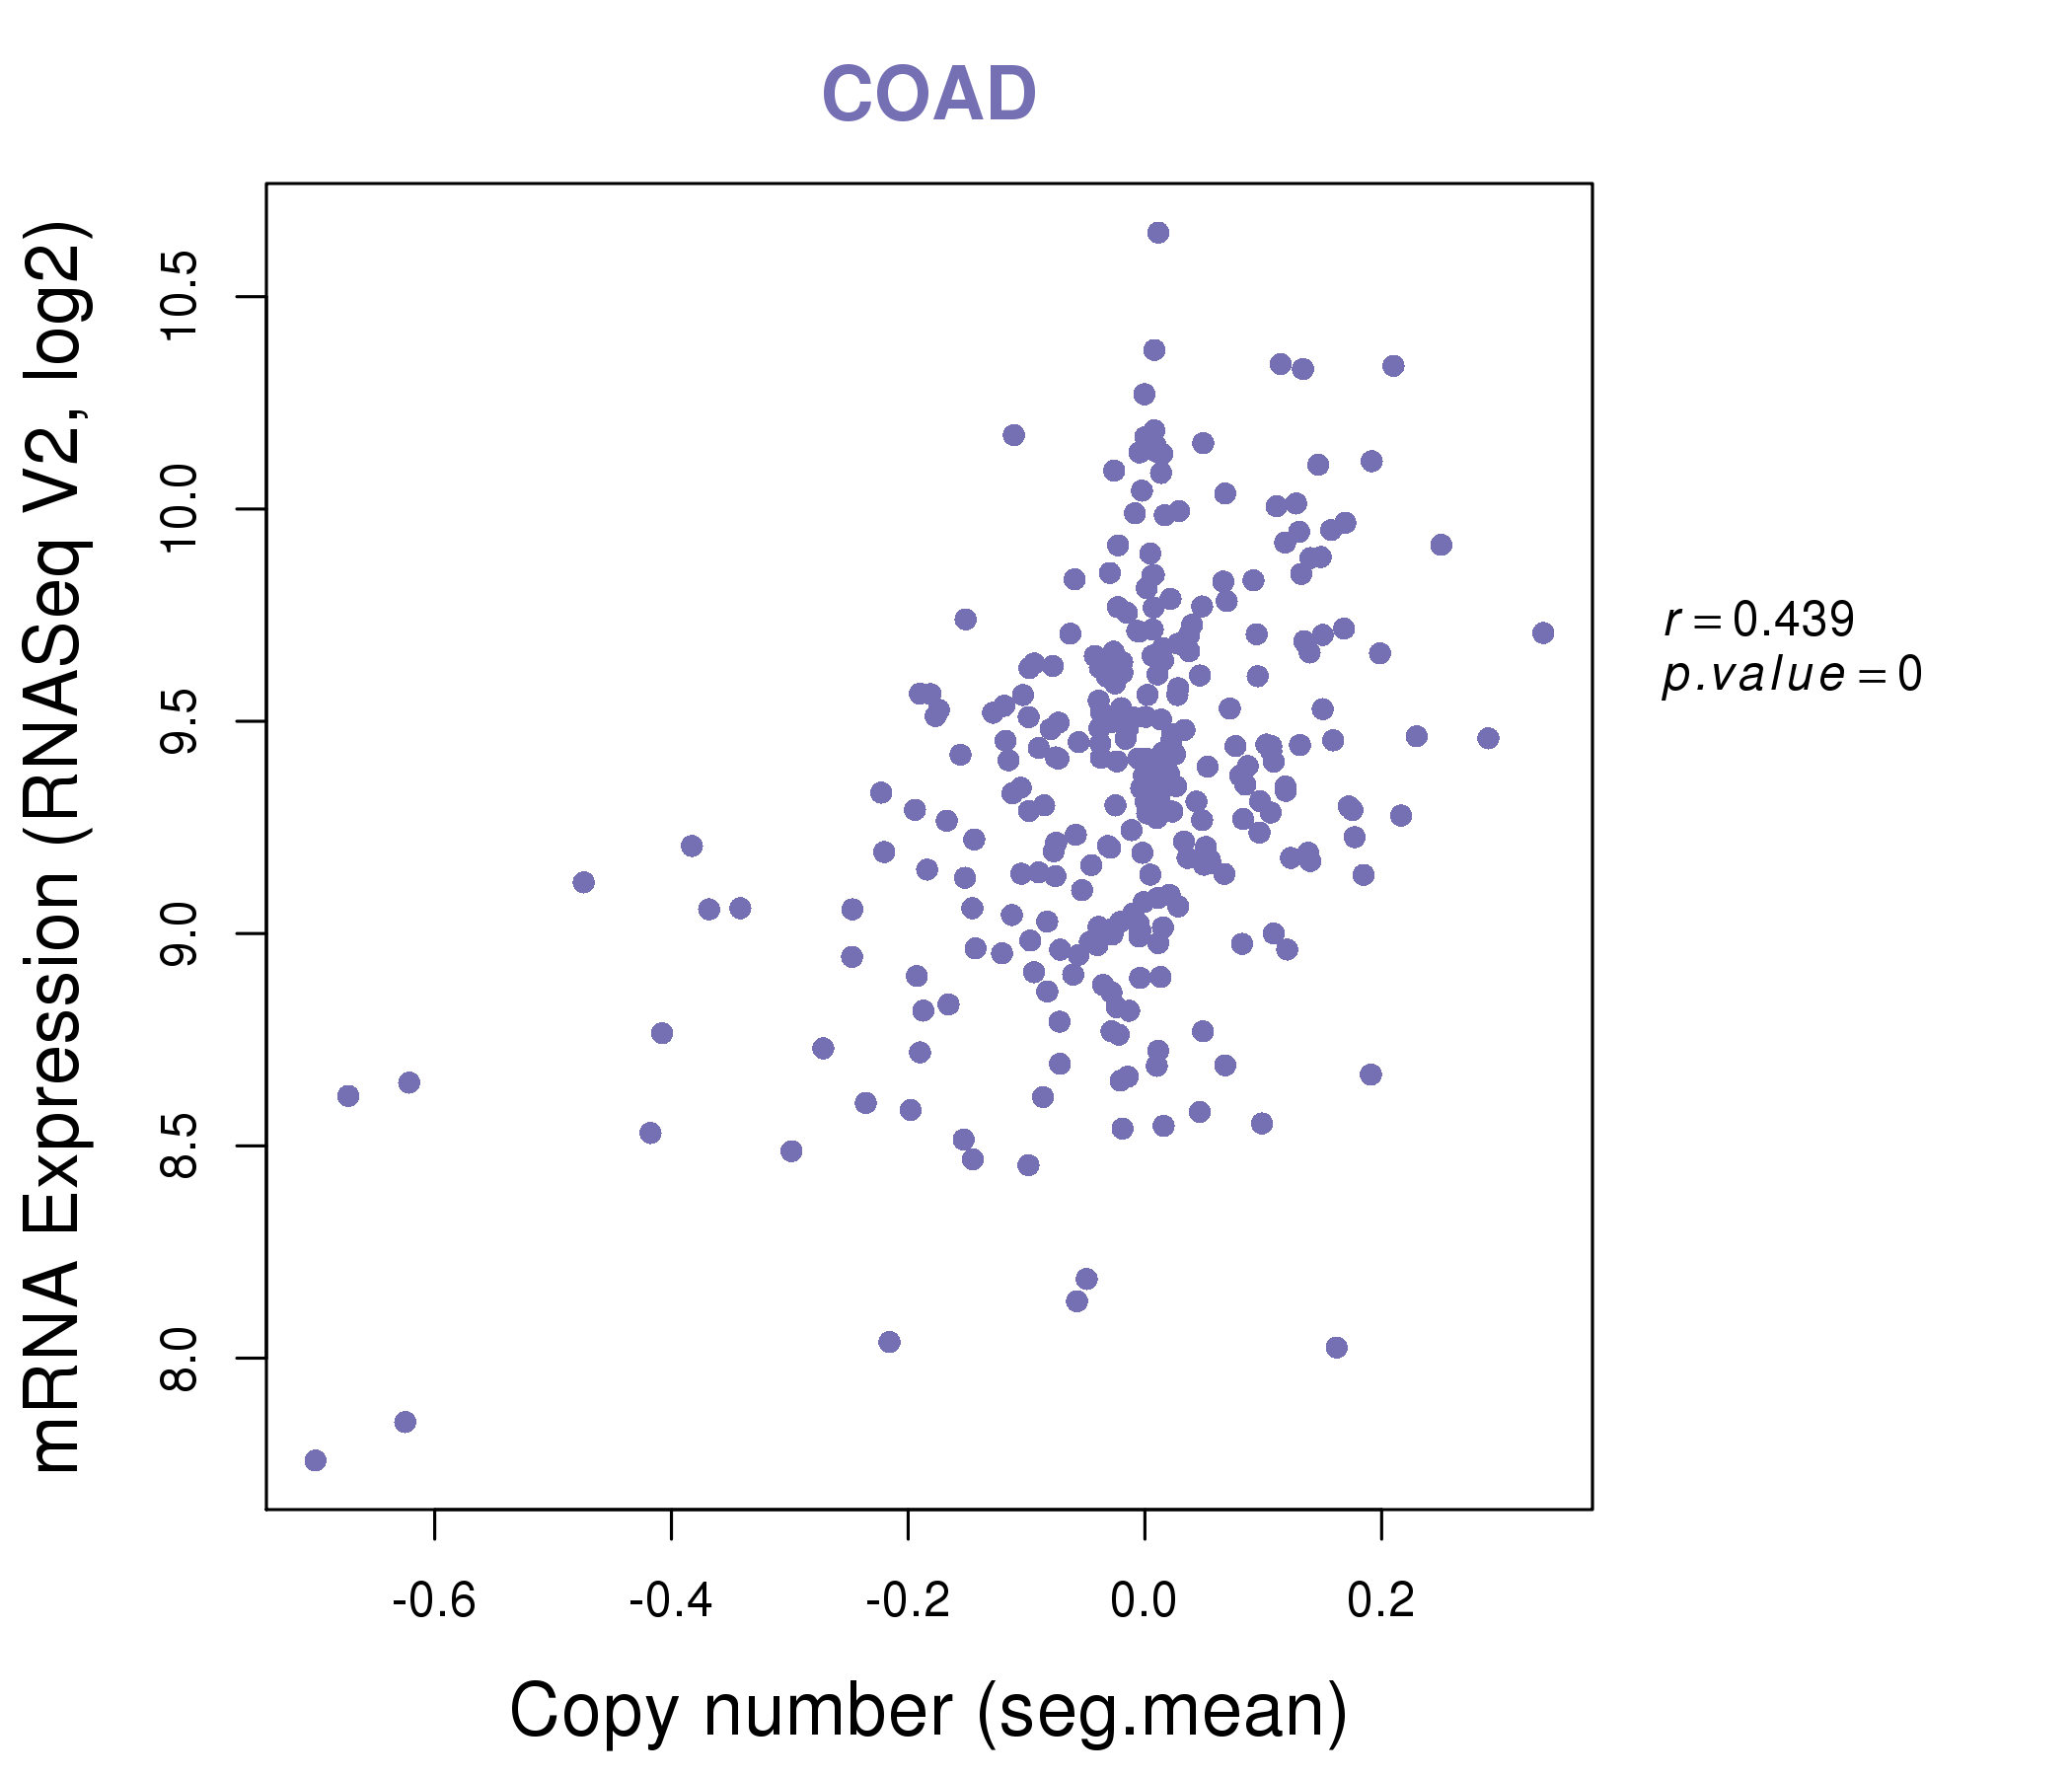
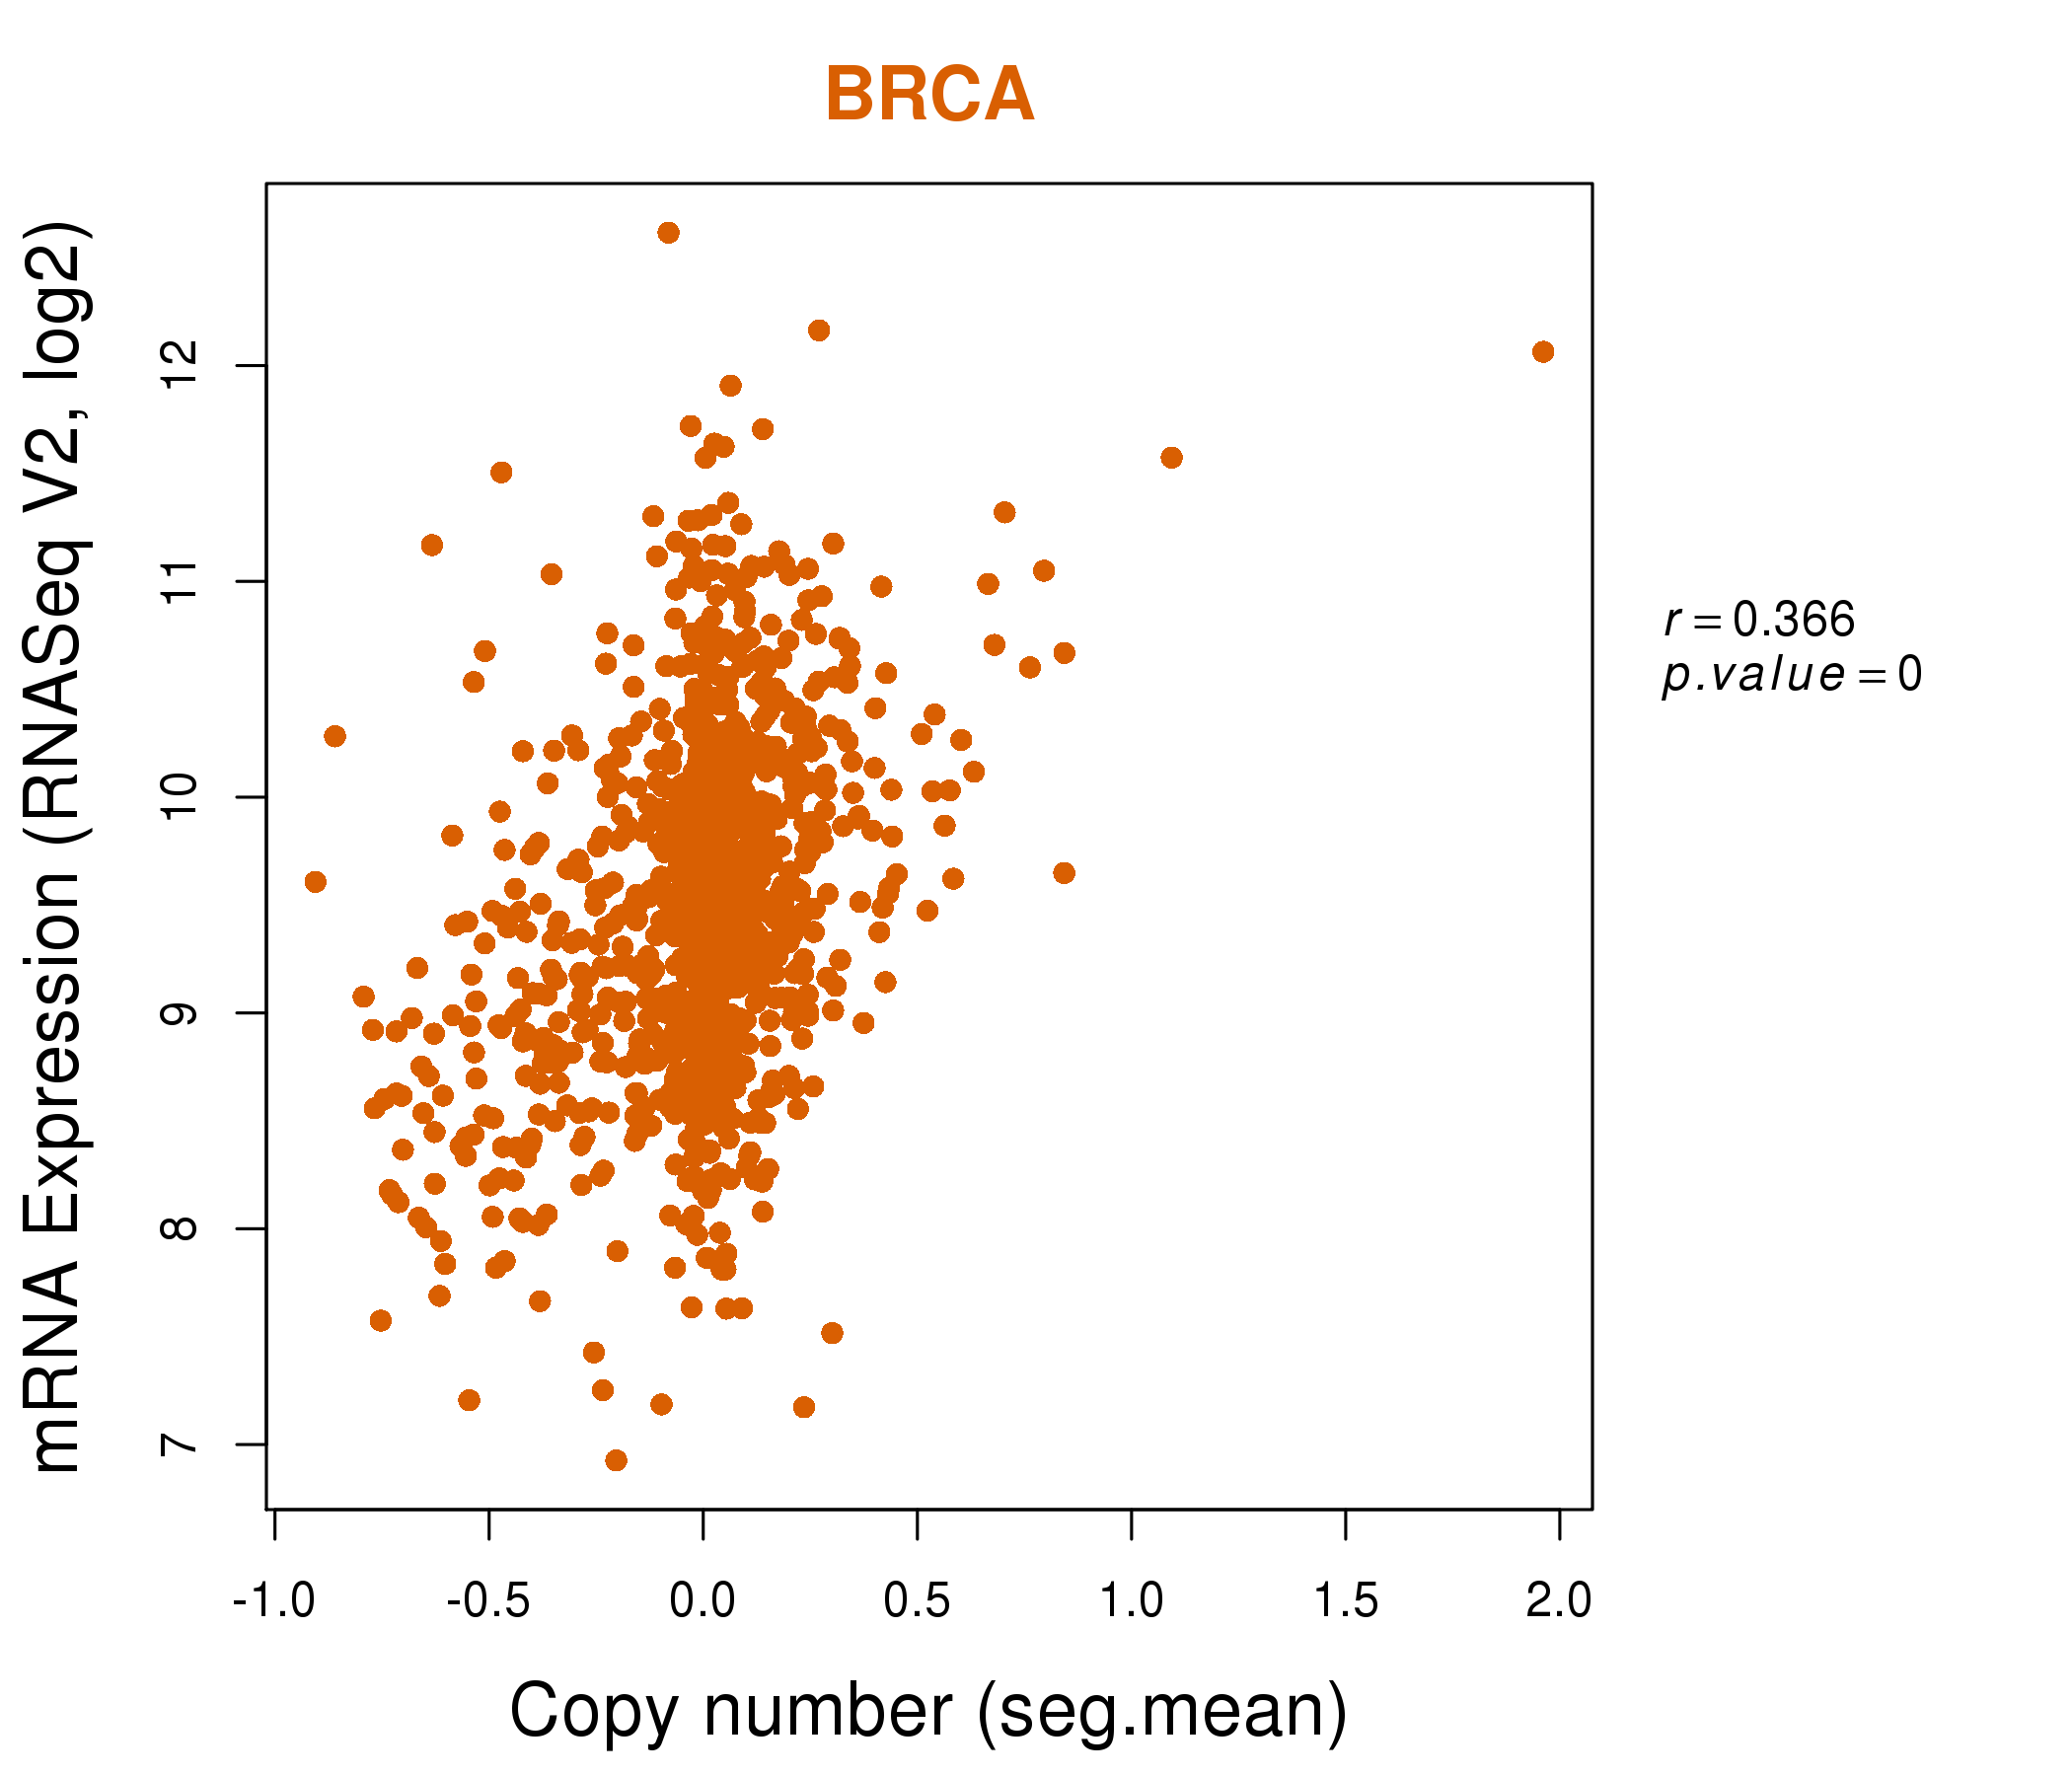
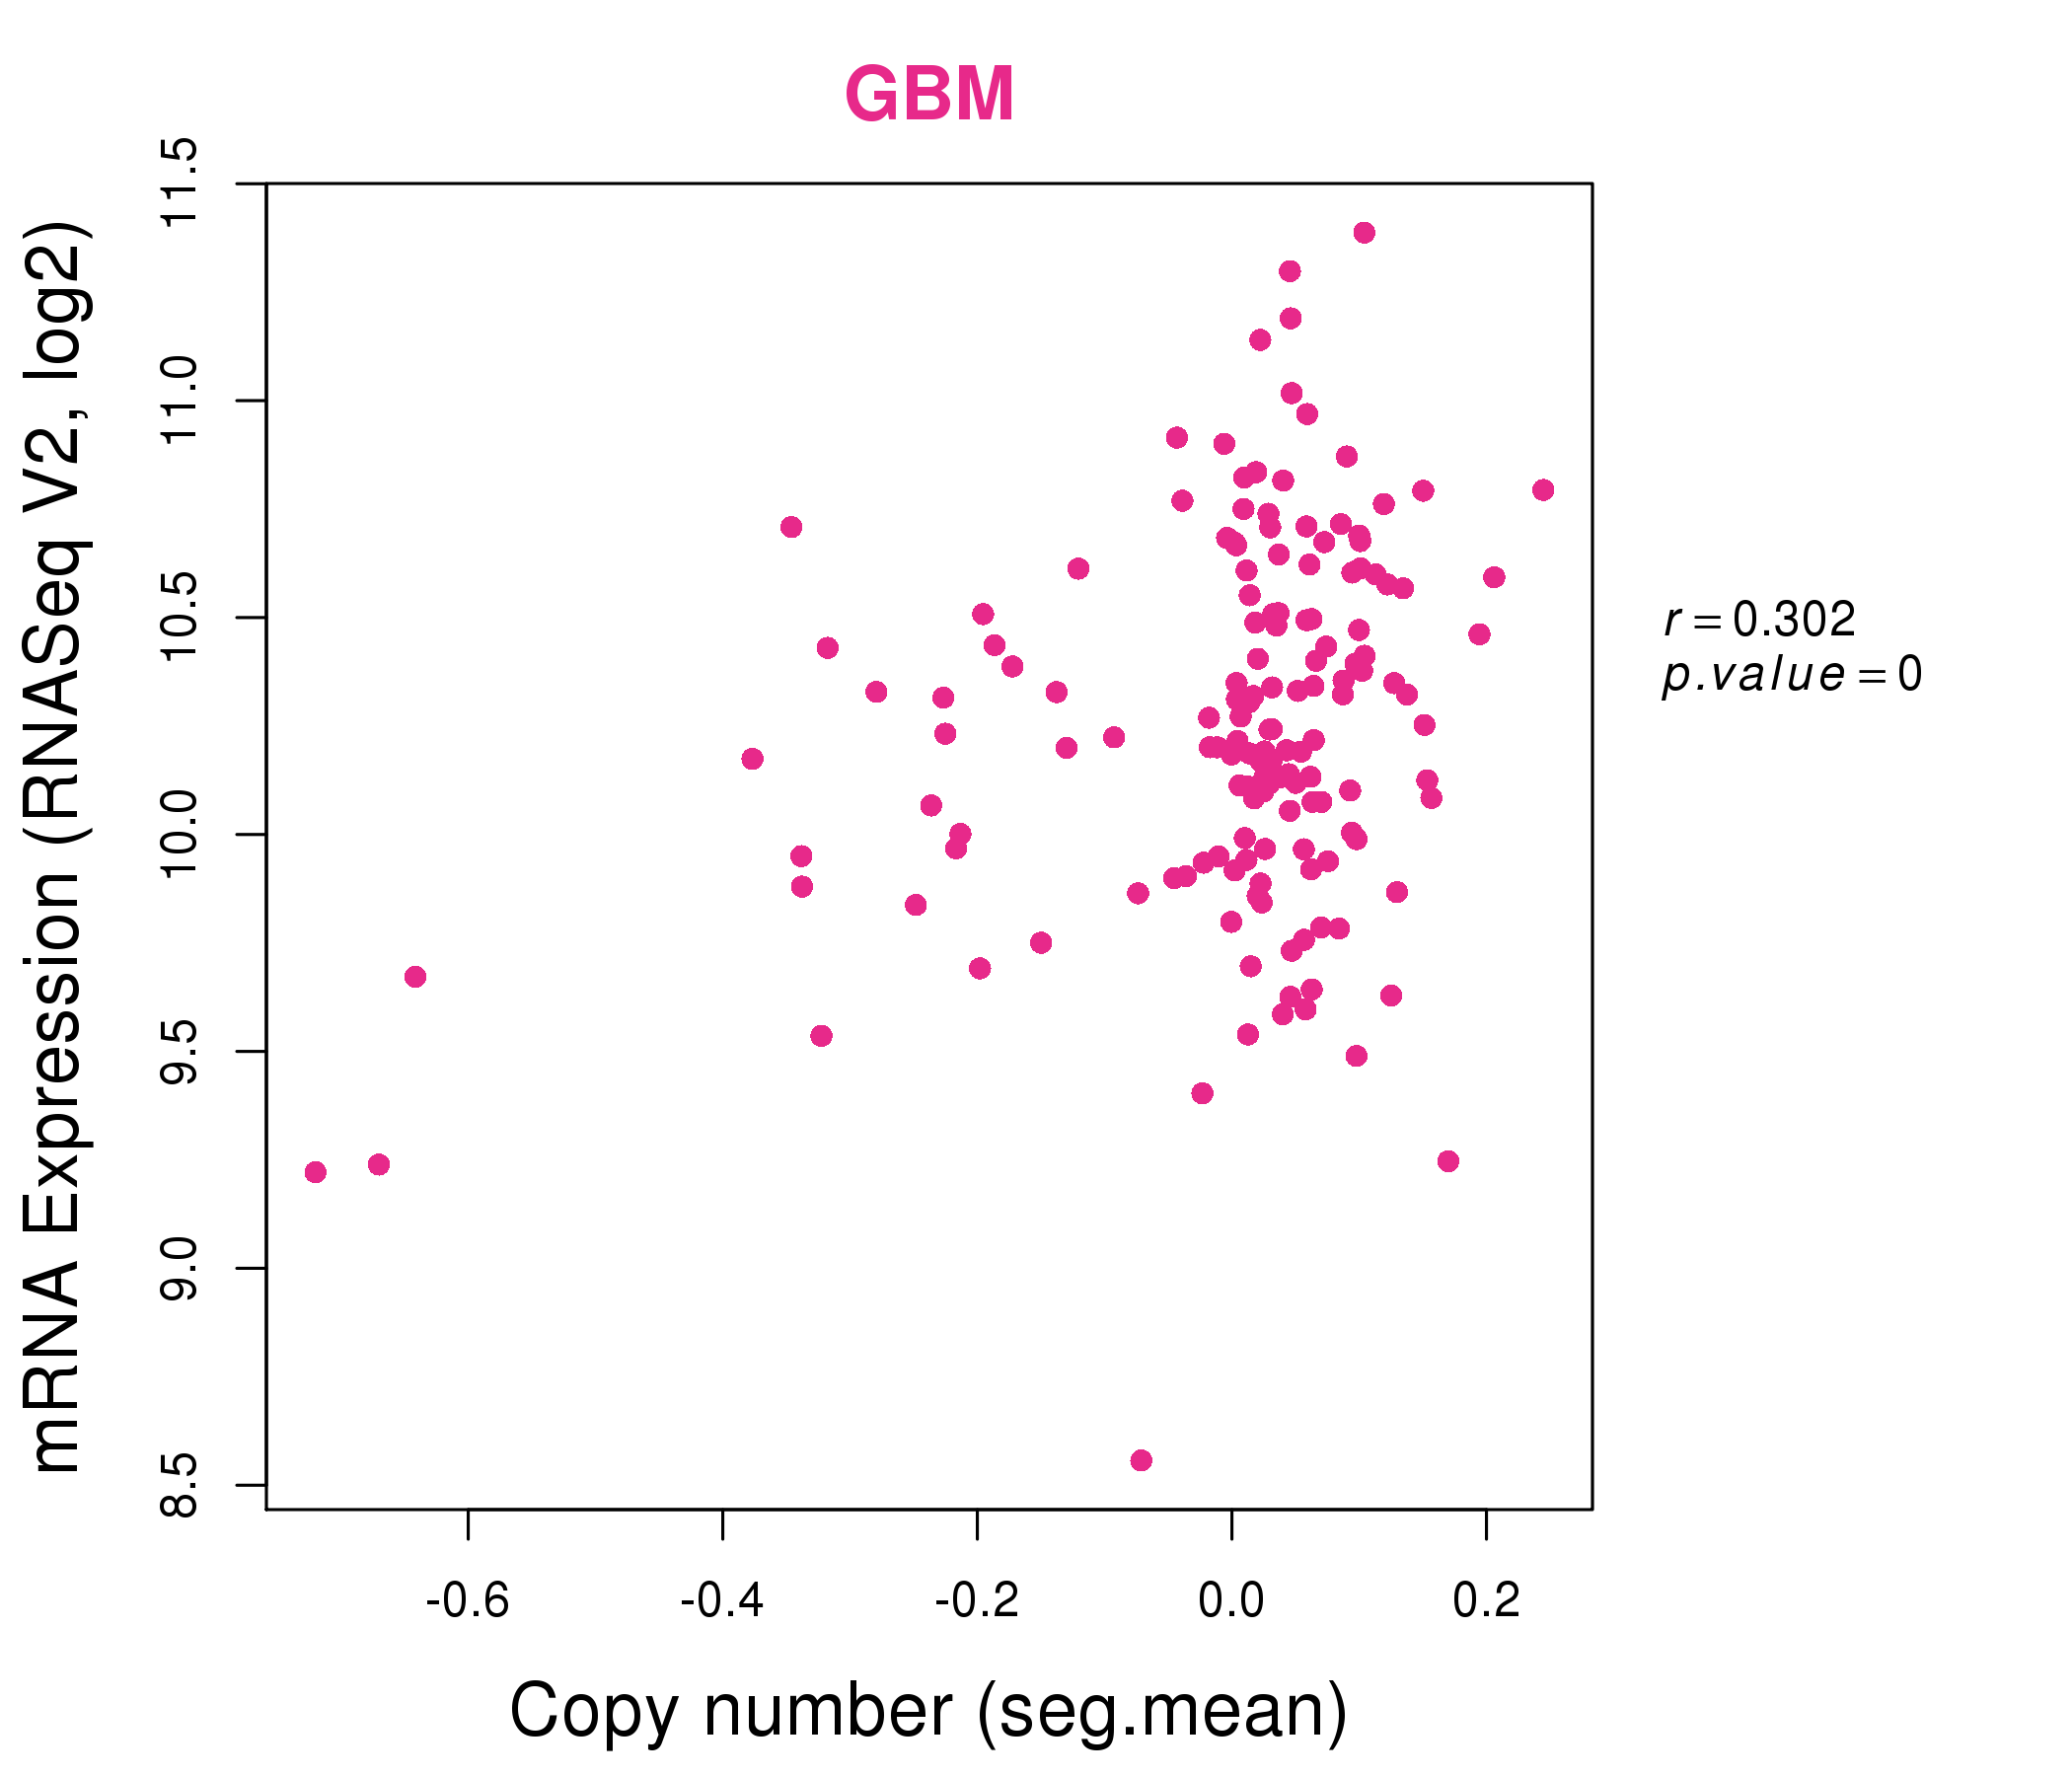
| * This plots show the correlation between CNV and gene expression. |
: Open all plots for all cancer types
 |
|
 |
|
| Top |
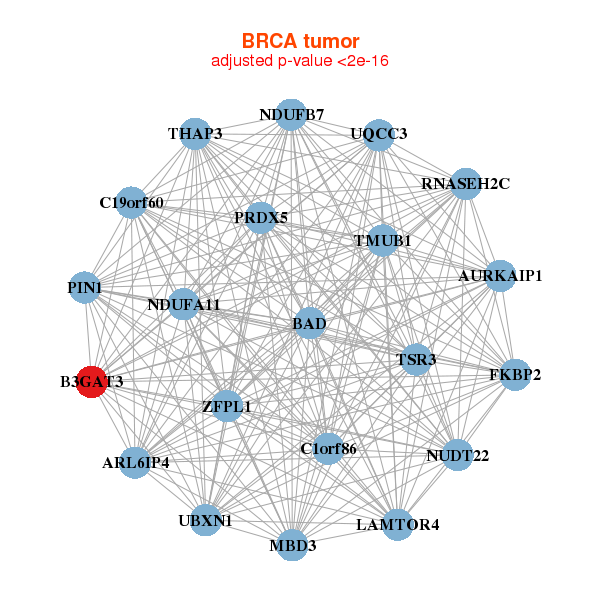
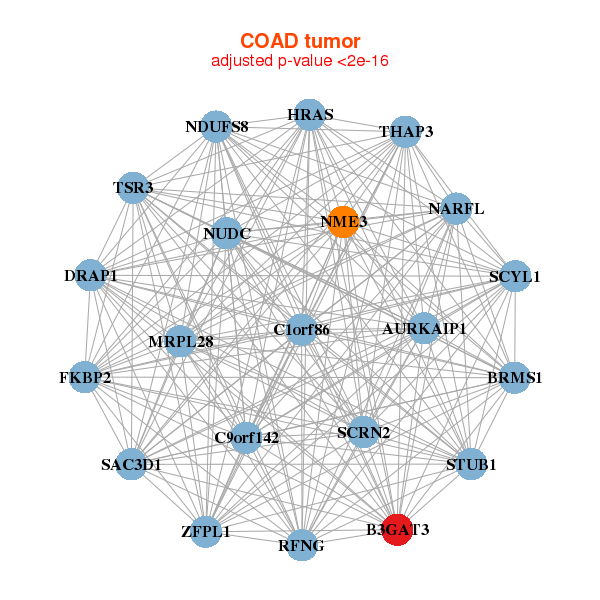
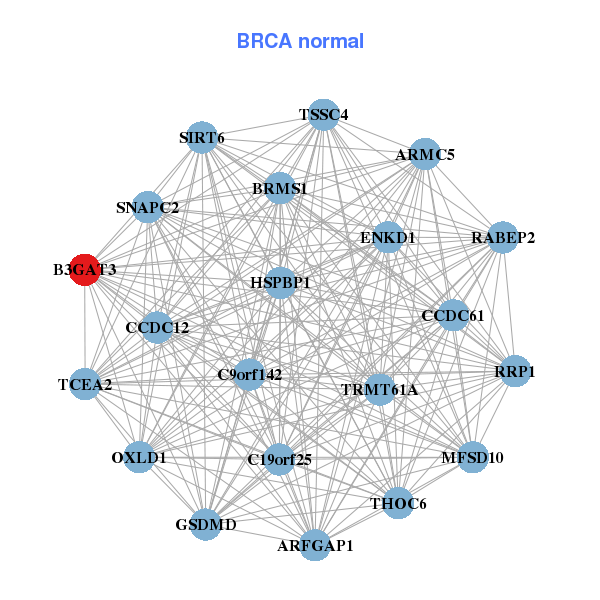
| Gene-Gene Network Information |
| * Co-Expression network figures were drawn using R package igraph. Only the top 20 genes with the highest correlations were shown. Red circle: input gene, orange circle: cell metabolism gene, sky circle: other gene |
: Open all plots for all cancer types
 |
| ||||
| ARL6IP4,AURKAIP1,B3GAT3,BAD,UQCC3,TSR3,C19orf60, C1orf86,LAMTOR4,FKBP2,MBD3,NDUFA11,NDUFB7,NUDT22, PIN1,PRDX5,RNASEH2C,THAP3,TMUB1,UBXN1,ZFPL1 | ARFGAP1,ARMC5,B3GAT3,BRMS1,ENKD1,OXLD1,C19orf25, C9orf142,CCDC12,CCDC61,GSDMD,HSPBP1,MFSD10,RABEP2, RRP1,SIRT6,SNAPC2,TCEA2,THOC6,TRMT61A,TSSC4 | ||||
 |
| ||||
| AURKAIP1,B3GAT3,BRMS1,TSR3,C1orf86,C9orf142,DRAP1, FKBP2,HRAS,MRPL28,NARFL,NDUFS8,NME3,NUDC, RFNG,SAC3D1,SCRN2,SCYL1,STUB1,THAP3,ZFPL1 | ARRDC1,B3GAT3,B4GALT3,DUS1L,DUSP23,CRACR2B,FASTK, FBXW9,GAS6,MAN1B1,MRPL41,NARFL,NOL12,PGLS, QPCTL,QTRT1,RABEP2,SIGIRR,TMEM129,TMEM44,ZDHHC24 |
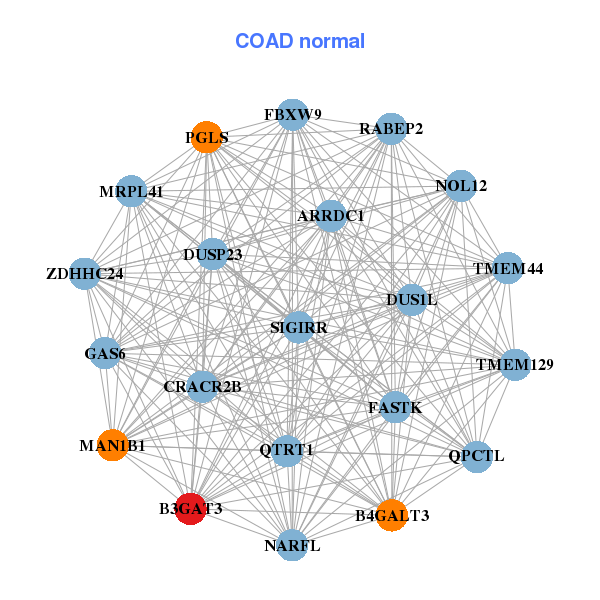
| * Co-Expression network figures were drawn using R package igraph. Only the top 20 genes with the highest correlations were shown. Red circle: input gene, orange circle: cell metabolism gene, sky circle: other gene |
: Open all plots for all cancer types
| Top |
: Open all interacting genes' information including KEGG pathway for all interacting genes from DAVID
| Top |
| Pharmacological Information for B3GAT3 |
| DB Category | DB Name | DB's ID and Url link |
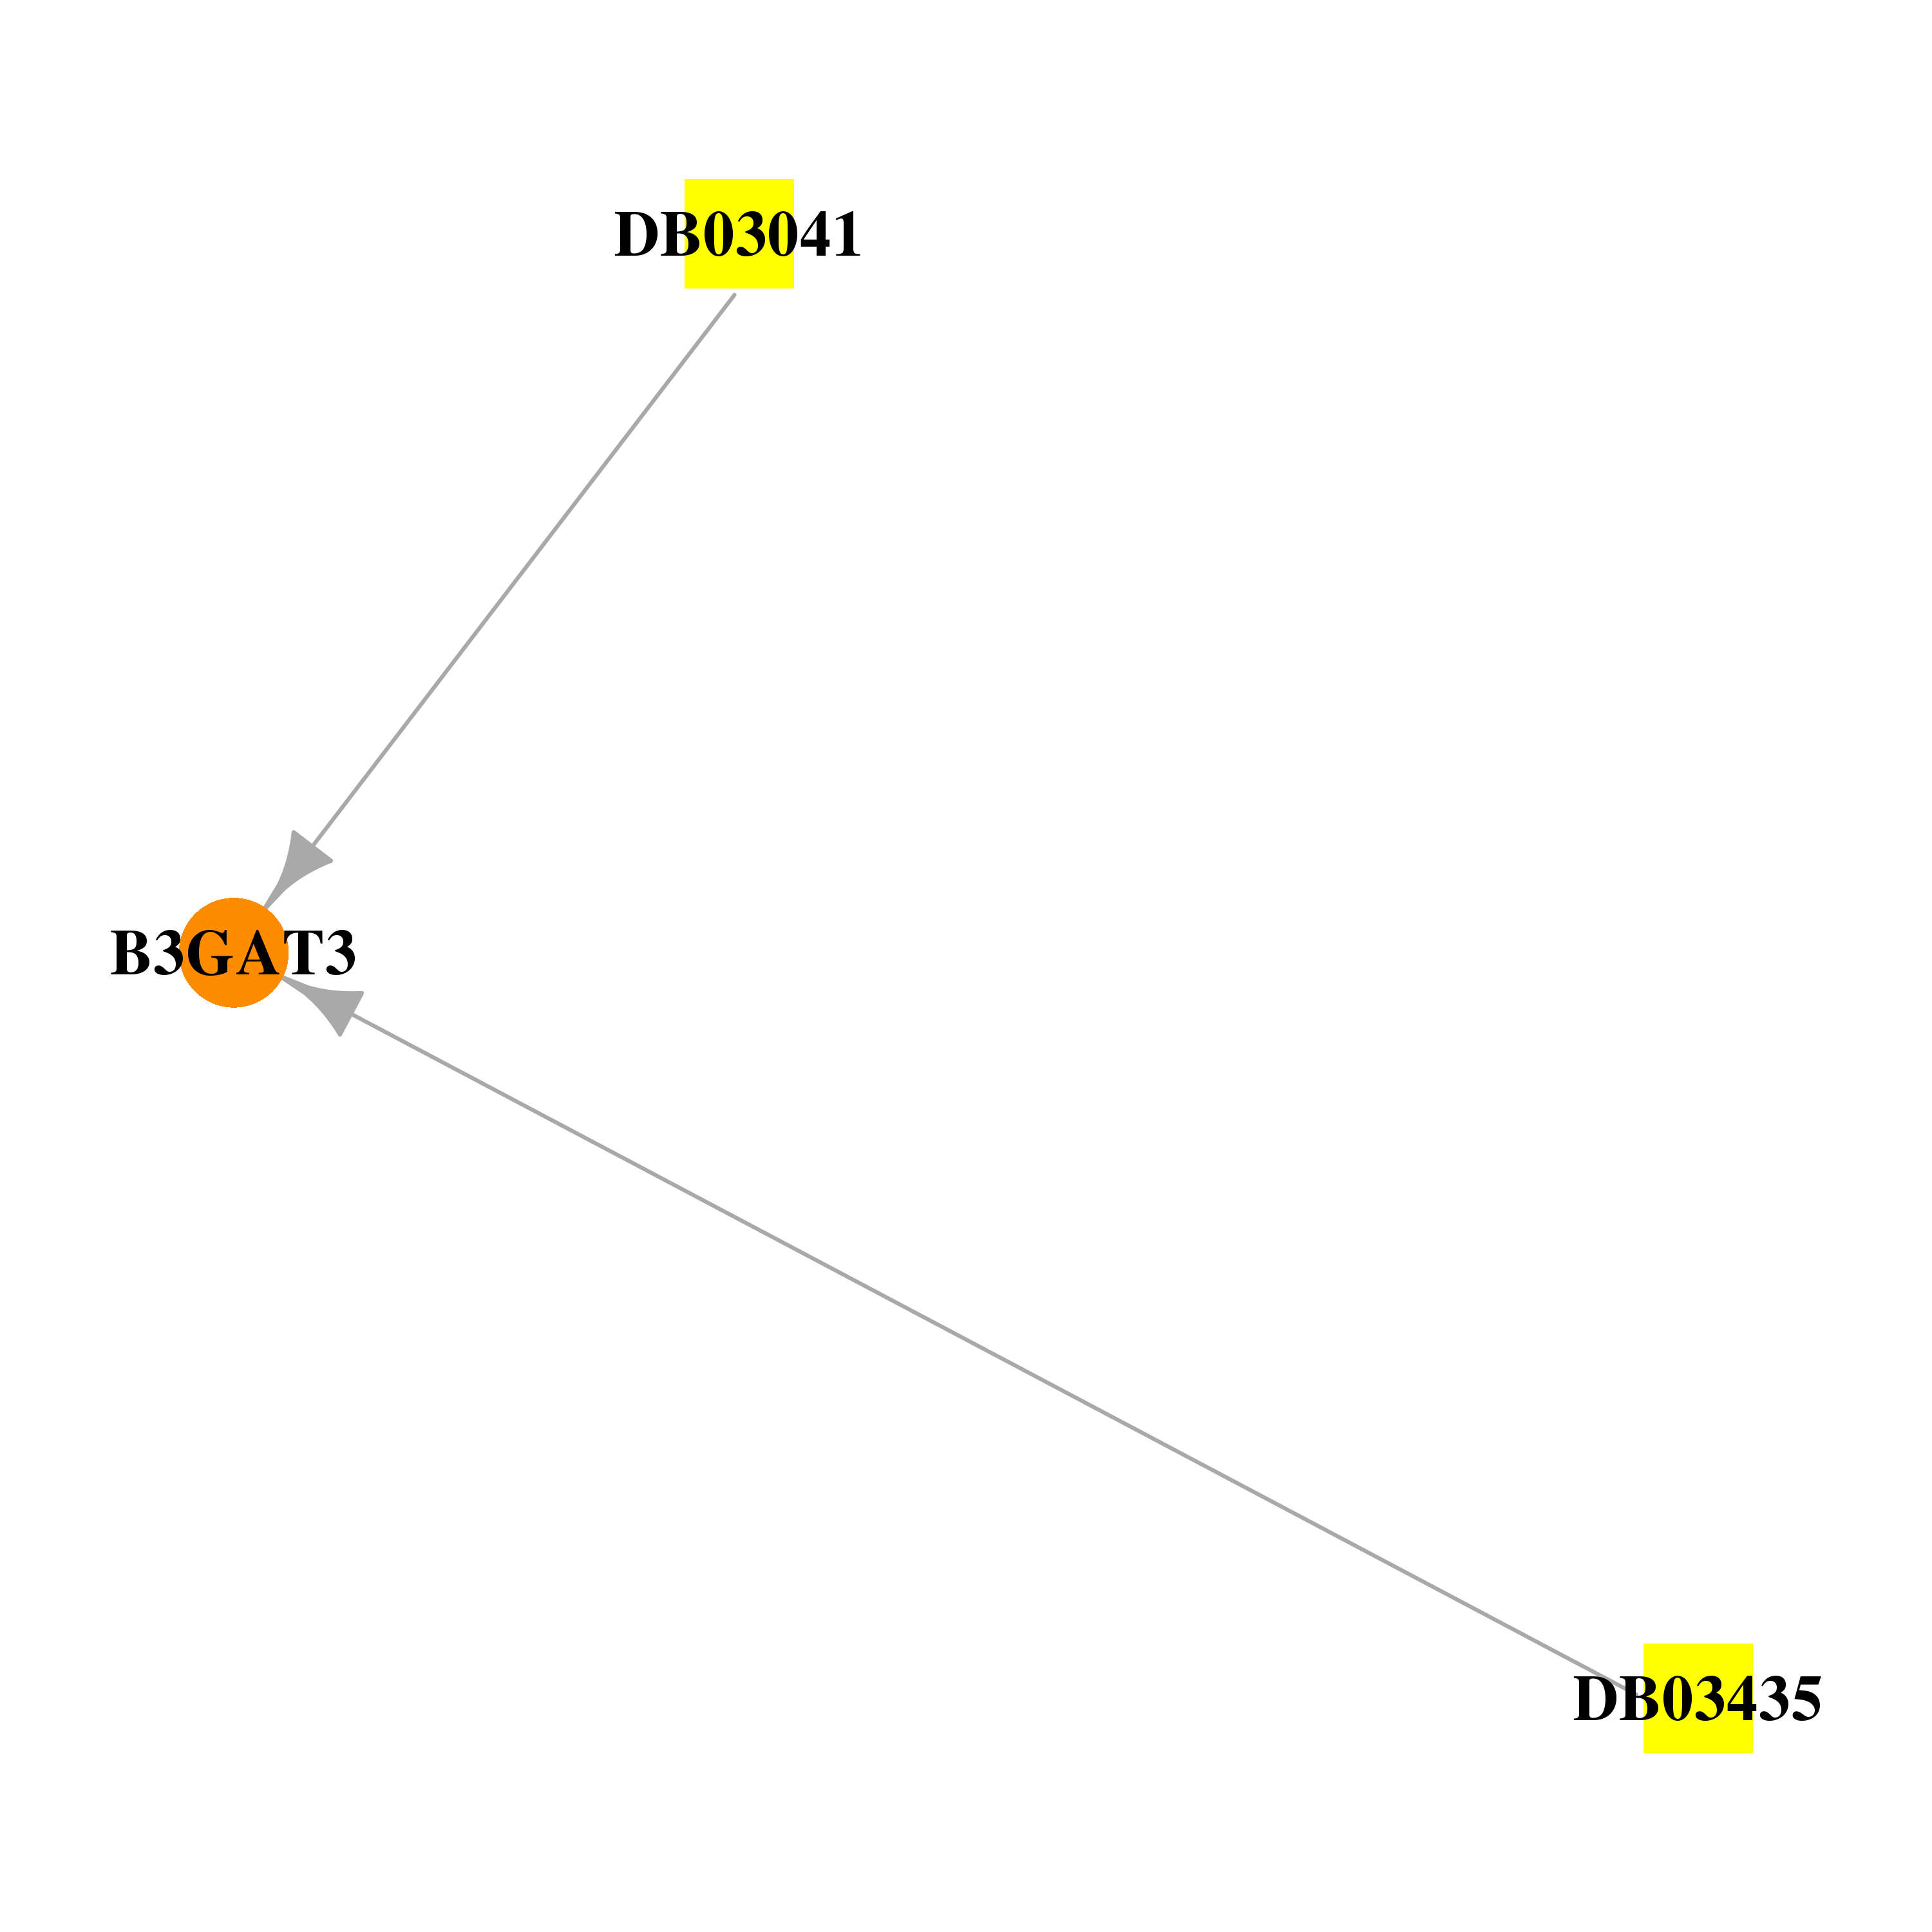
| * Gene Centered Interaction Network. |
 |
| * Drug Centered Interaction Network. |
| DrugBank ID | Target Name | Drug Groups | Generic Name | Drug Centered Network | Drug Structure |
| DB03041 | beta-1,3-glucuronyltransferase 3 (glucuronosyltransferase I) | experimental | Udp-Glucuronic Acid |  | 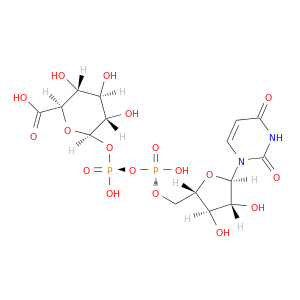 |
| DB03435 | beta-1,3-glucuronyltransferase 3 (glucuronosyltransferase I) | experimental | Uridine-5'-Diphosphate | 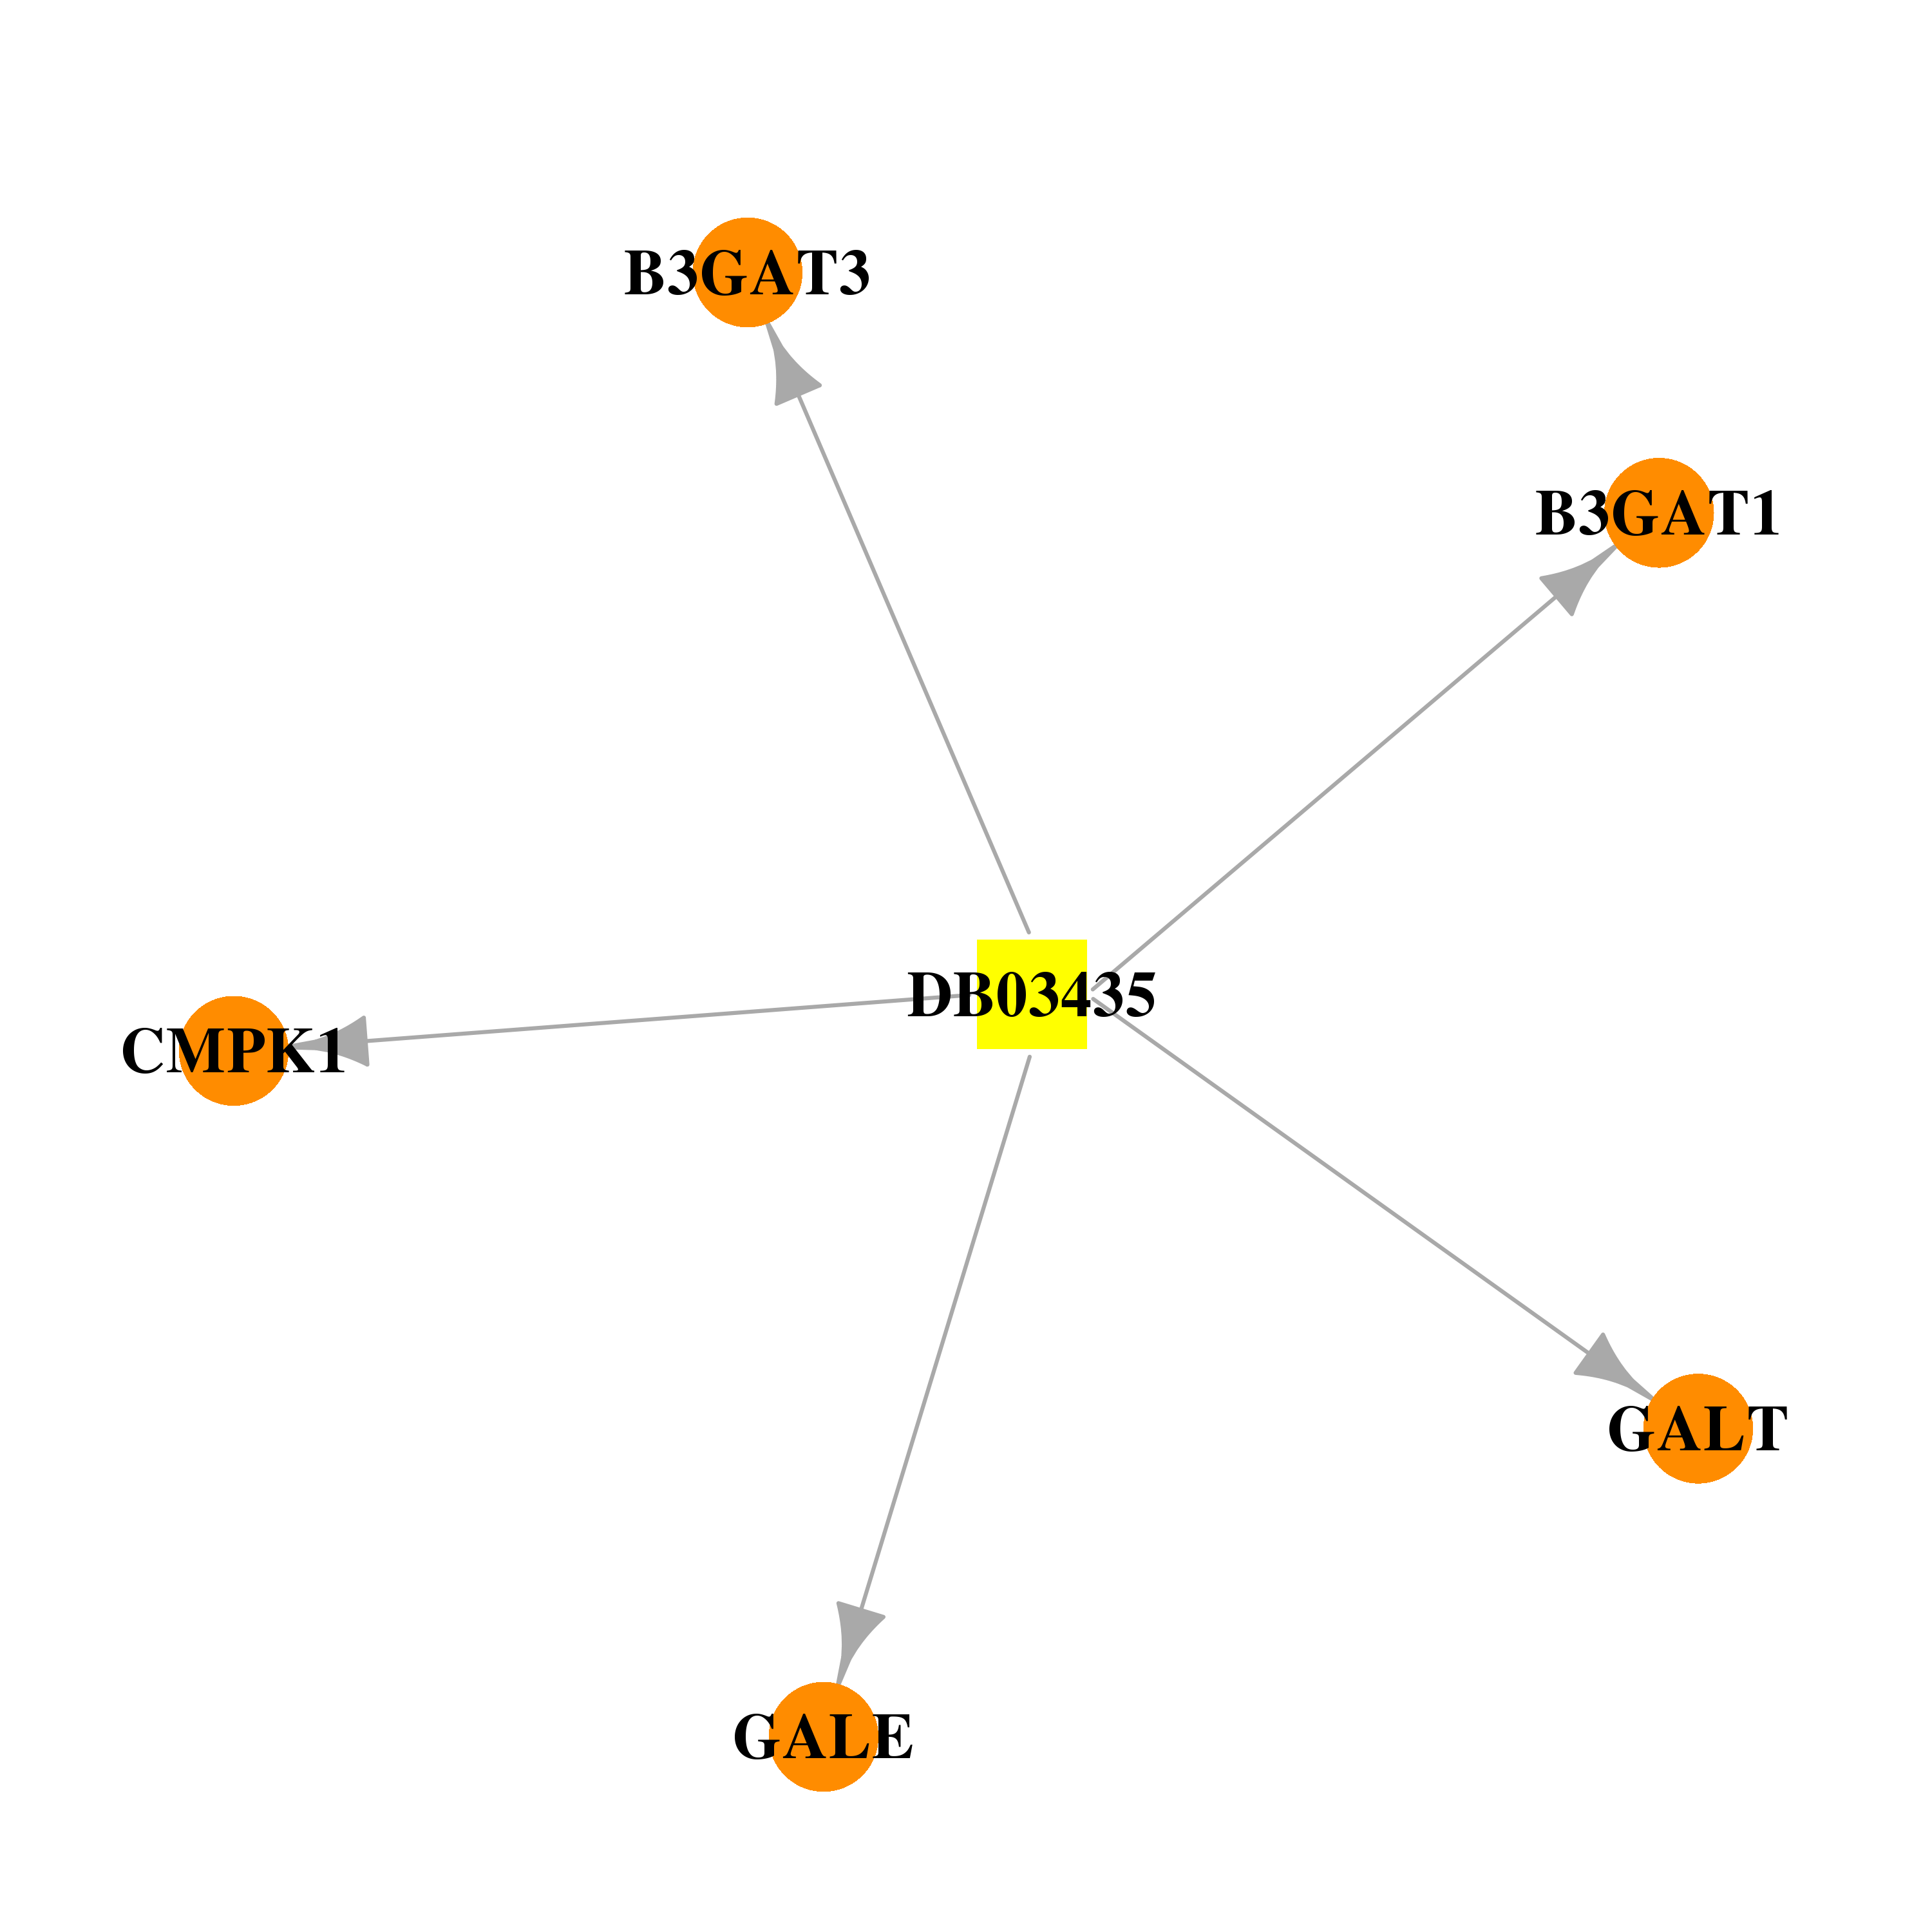 |  |
| Top |
| Cross referenced IDs for B3GAT3 |
| * We obtained these cross-references from Uniprot database. It covers 150 different DBs, 18 categories. http://www.uniprot.org/help/cross_references_section |
: Open all cross reference information
|
Copyright © 2016-Present - The Univsersity of Texas Health Science Center at Houston @ |