|
||||||||||||||||||||||||||||||||||||||||||||||||||||||||||||||||||||||||||||||||||||||||||||||||||||||||||||||||||||||||||||||||||||||||||||||||||||||||||||||||||||||||||||||||||||||||||||||||||||||||||||||||||||||||||||||||||||||||||||||||||||||||||||||||||||||||||||||||||||||||||||||||||||||||||||||||||||||||||
| |
| Phenotypic Information (metabolism pathway, cancer, disease, phenome) |
| |
| |
| Gene-Gene Network Information: Co-Expression Network, Interacting Genes & KEGG |
| |
|


| Gene Summary for TIAM2 |
| Top |
| Phenotypic Information for TIAM2(metabolism pathway, cancer, disease, phenome) |
| Cancer | CGAP: TIAM2 |
| Familial Cancer Database: TIAM2 | |
| * This gene is included in those cancer gene databases. |
|
|
|
|
|
| . | ||||||||||||||||||||||||||||||||||||||||||||||||||||||||||||||||||||||||||||||||||||||||||||||||||||||||||||||||||||||||||||||||||||||||||||||||||||||||||||||||||||||||||||||||||||||||||||||||||||||||||||||||||||||||||||||||||||||||||||||||||||||||||||||||||||||||||||||||||||||||||||||||||||||||||||||||||||
Oncogene 1 | Significant driver gene in | |||||||||||||||||||||||||||||||||||||||||||||||||||||||||||||||||||||||||||||||||||||||||||||||||||||||||||||||||||||||||||||||||||||||||||||||||||||||||||||||||||||||||||||||||||||||||||||||||||||||||||||||||||||||||||||||||||||||||||||||||||||||||||||||||||||||||||||||||||||||||||||||||||||||||||||||||||||||||
| cf) number; DB name 1 Oncogene; http://nar.oxfordjournals.org/content/35/suppl_1/D721.long, 2 Tumor Suppressor gene; https://bioinfo.uth.edu/TSGene/, 3 Cancer Gene Census; http://www.nature.com/nrc/journal/v4/n3/abs/nrc1299.html, 4 CancerGenes; http://nar.oxfordjournals.org/content/35/suppl_1/D721.long, 5 Network of Cancer Gene; http://ncg.kcl.ac.uk/index.php, 1Therapeutic Vulnerabilities in Cancer; http://cbio.mskcc.org/cancergenomics/statius/ |
| REACTOME_METABOLISM_OF_LIPIDS_AND_LIPOPROTEINS | |
| OMIM | |
| Orphanet | |
| Disease | KEGG Disease: TIAM2 |
| MedGen: TIAM2 (Human Medical Genetics with Condition) | |
| ClinVar: TIAM2 | |
| Phenotype | MGI: TIAM2 (International Mouse Phenotyping Consortium) |
| PhenomicDB: TIAM2 | |
| Mutations for TIAM2 |
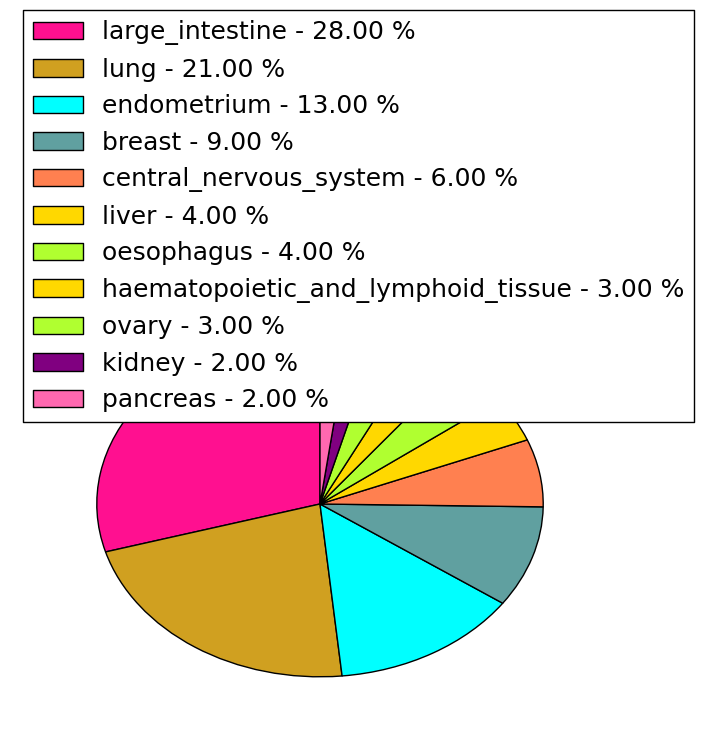
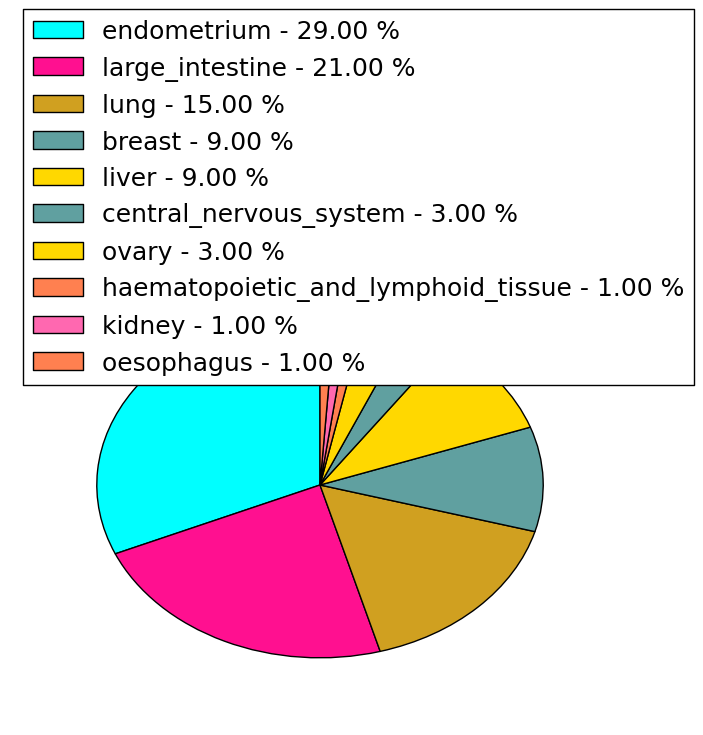
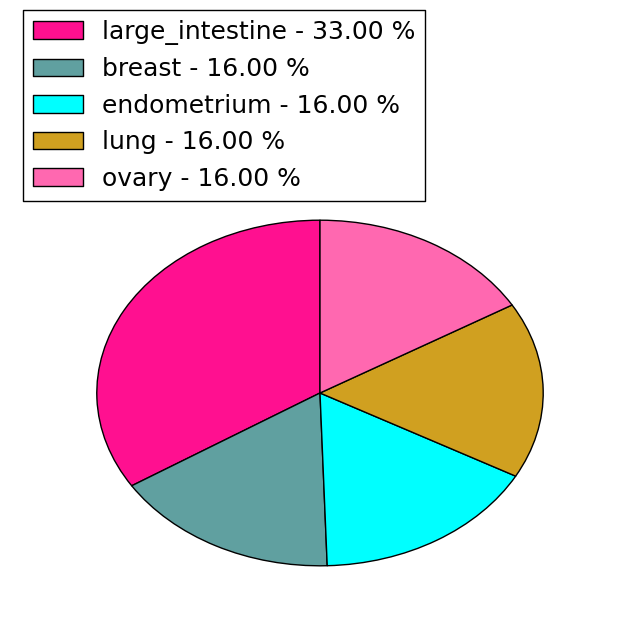
| * Under tables are showing count per each tissue to give us broad intuition about tissue specific mutation patterns.You can go to the detailed page for each mutation database's web site. |
| There's no structural variation information in COSMIC data for this gene. |
| * From mRNA Sanger sequences, Chitars2.0 arranged chimeric transcripts. This table shows TIAM2 related fusion information. |
| ID | Head Gene | Tail Gene | Accession | Gene_a | qStart_a | qEnd_a | Chromosome_a | tStart_a | tEnd_a | Gene_a | qStart_a | qEnd_a | Chromosome_a | tStart_a | tEnd_a |
| BU629140 | TIAM2 | 18 | 457 | 6 | 155284994 | 155285433 | RAD1 | 457 | 523 | 5 | 34908559 | 34908625 | |
| BM993771 | TIAM2 | 1 | 206 | 6 | 155578137 | 155578342 | TFB1M | 201 | 677 | 6 | 155580968 | 155581444 | |
| BI850472 | TIAM2 | 13 | 405 | 6 | 155173929 | 155174321 | TMEM57 | 396 | 613 | 1 | 25824898 | 25825116 | |
| CN479315 | TIAM2 | 1 | 206 | 6 | 155578137 | 155578342 | TFB1M | 201 | 677 | 6 | 155580968 | 155581444 | |
| BG028067 | TIAM2 | 12 | 404 | 6 | 155173929 | 155174321 | TMEM57 | 395 | 670 | 1 | 25824898 | 25825182 | |
| BI010428 | GORASP2 | 12 | 209 | 2 | 171807836 | 171811224 | TIAM2 | 201 | 333 | 6 | 155272905 | 155273037 | |
| BQ371784 | TIAM2 | 9 | 63 | 6 | 155161247 | 155161303 | MKLN1 | 44 | 130 | 7 | 131124903 | 131124989 | |
| BF935734 | TIAM2 | 12 | 189 | 6 | 155187561 | 155187739 | PAPD4 | 184 | 467 | 5 | 78948775 | 78949058 | |
| T05134 | TIAM2 | 83 | 264 | 6 | 155456767 | 155456944 | NTN4 | 248 | 318 | 12 | 96111311 | 96111381 | |
| Top |
| Mutation type/ Tissue ID | brca | cns | cerv | endome | haematopo | kidn | Lintest | liver | lung | ns | ovary | pancre | prost | skin | stoma | thyro | urina | |||
| Total # sample | 1 | 1 | 1 | |||||||||||||||||
| GAIN (# sample) | 1 | |||||||||||||||||||
| LOSS (# sample) | 1 | 1 |
| cf) Tissue ID; Tissue type (1; Breast, 2; Central_nervous_system, 3; Cervix, 4; Endometrium, 5; Haematopoietic_and_lymphoid_tissue, 6; Kidney, 7; Large_intestine, 8; Liver, 9; Lung, 10; NS, 11; Ovary, 12; Pancreas, 13; Prostate, 14; Skin, 15; Stomach, 16; Thyroid, 17; Urinary_tract) |
| Top |
|
 |
| Top |
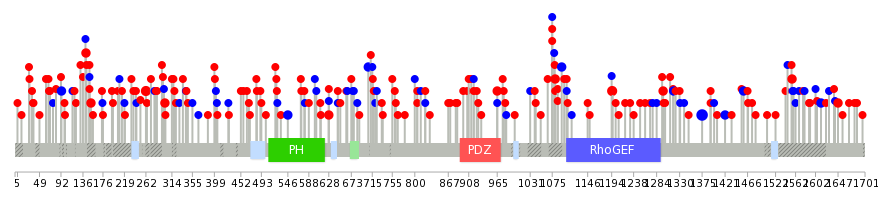
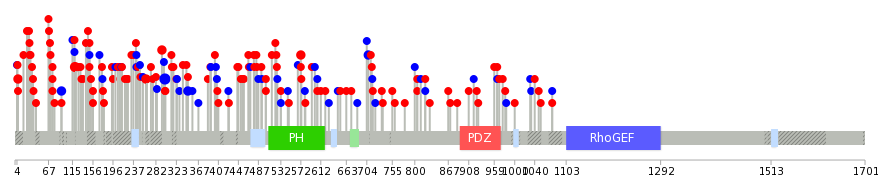
| Stat. for Non-Synonymous SNVs (# total SNVs=122) | (# total SNVs=51) |
 |  |
(# total SNVs=6) | (# total SNVs=0) |
 |
| Top |
| * When you move the cursor on each content, you can see more deailed mutation information on the Tooltip. Those are primary_site,primary_histology,mutation(aa),pubmedID. |
| GRCh37 position | Mutation(aa) | Unique sampleID count |
| chr6:155574087-155574087 | p.S1375S | 6 |
| chr6:155566797-155566797 | p.A1195V | 3 |
| chr6:155504465-155504465 | p.S965R | 3 |
| chr6:155469323-155469323 | p.G628E | 3 |
| chr6:155451141-155451141 | p.E262K | 3 |
| chr6:155561777-155561777 | p.L1094L | 2 |
| chr6:155575613-155575613 | p.F1458F | 2 |
| chr6:155571042-155571042 | p.Y1297C | 2 |
| chr6:155577812-155577812 | p.A1555T | 2 |
| chr6:155465747-155465747 | p.T546T | 2 |
| Top |
|
 |
| Point Mutation/ Tissue ID | 1 | 2 | 3 | 4 | 5 | 6 | 7 | 8 | 9 | 10 | 11 | 12 | 13 | 14 | 15 | 16 | 17 | 18 | 19 | 20 |
| # sample | 6 | 5 | 25 | 6 | 11 | 3 | 14 | 6 | 5 | 1 | 25 | 24 | 3 | 20 | ||||||
| # mutation | 6 | 5 | 26 | 6 | 11 | 3 | 17 | 6 | 5 | 1 | 34 | 32 | 3 | 27 | ||||||
| nonsynonymous SNV | 6 | 4 | 22 | 5 | 9 | 2 | 14 | 4 | 3 | 21 | 23 | 3 | 15 | |||||||
| synonymous SNV | 1 | 4 | 1 | 2 | 1 | 3 | 2 | 2 | 1 | 13 | 9 | 12 |
| cf) Tissue ID; Tissue type (1; BLCA[Bladder Urothelial Carcinoma], 2; BRCA[Breast invasive carcinoma], 3; CESC[Cervical squamous cell carcinoma and endocervical adenocarcinoma], 4; COAD[Colon adenocarcinoma], 5; GBM[Glioblastoma multiforme], 6; Glioma Low Grade, 7; HNSC[Head and Neck squamous cell carcinoma], 8; KICH[Kidney Chromophobe], 9; KIRC[Kidney renal clear cell carcinoma], 10; KIRP[Kidney renal papillary cell carcinoma], 11; LAML[Acute Myeloid Leukemia], 12; LUAD[Lung adenocarcinoma], 13; LUSC[Lung squamous cell carcinoma], 14; OV[Ovarian serous cystadenocarcinoma ], 15; PAAD[Pancreatic adenocarcinoma], 16; PRAD[Prostate adenocarcinoma], 17; SKCM[Skin Cutaneous Melanoma], 18:STAD[Stomach adenocarcinoma], 19:THCA[Thyroid carcinoma], 20:UCEC[Uterine Corpus Endometrial Carcinoma]) |
| Top |
| * We represented just top 10 SNVs. When you move the cursor on each content, you can see more deailed mutation information on the Tooltip. Those are primary_site, primary_histology, mutation(aa), pubmedID. |
| Genomic Position | Mutation(aa) | Unique sampleID count |
| chr6:155574087 | p.S300S,TIAM2 | 5 |
| chr6:155566797 | p.A120V,TIAM2 | 3 |
| chr6:155578089 | p.E6K,TIAM2 | 2 |
| chr6:155561736 | p.E262K | 2 |
| chr6:155451141 | p.S965R | 2 |
| chr6:155485641 | p.T93T | 2 |
| chr6:155575144 | p.S294P | 2 |
| chr6:155450636 | p.P707P | 2 |
| chr6:155504465 | p.T346T,TIAM2 | 2 |
| chr6:155451237 | p.G572E,TIAM2 | 2 |
| * Copy number data were extracted from TCGA using R package TCGA-Assembler. The URLs of all public data files on TCGA DCC data server were gathered on Jan-05-2015. Function ProcessCNAData in TCGA-Assembler package was used to obtain gene-level copy number value which is calculated as the average copy number of the genomic region of a gene. |
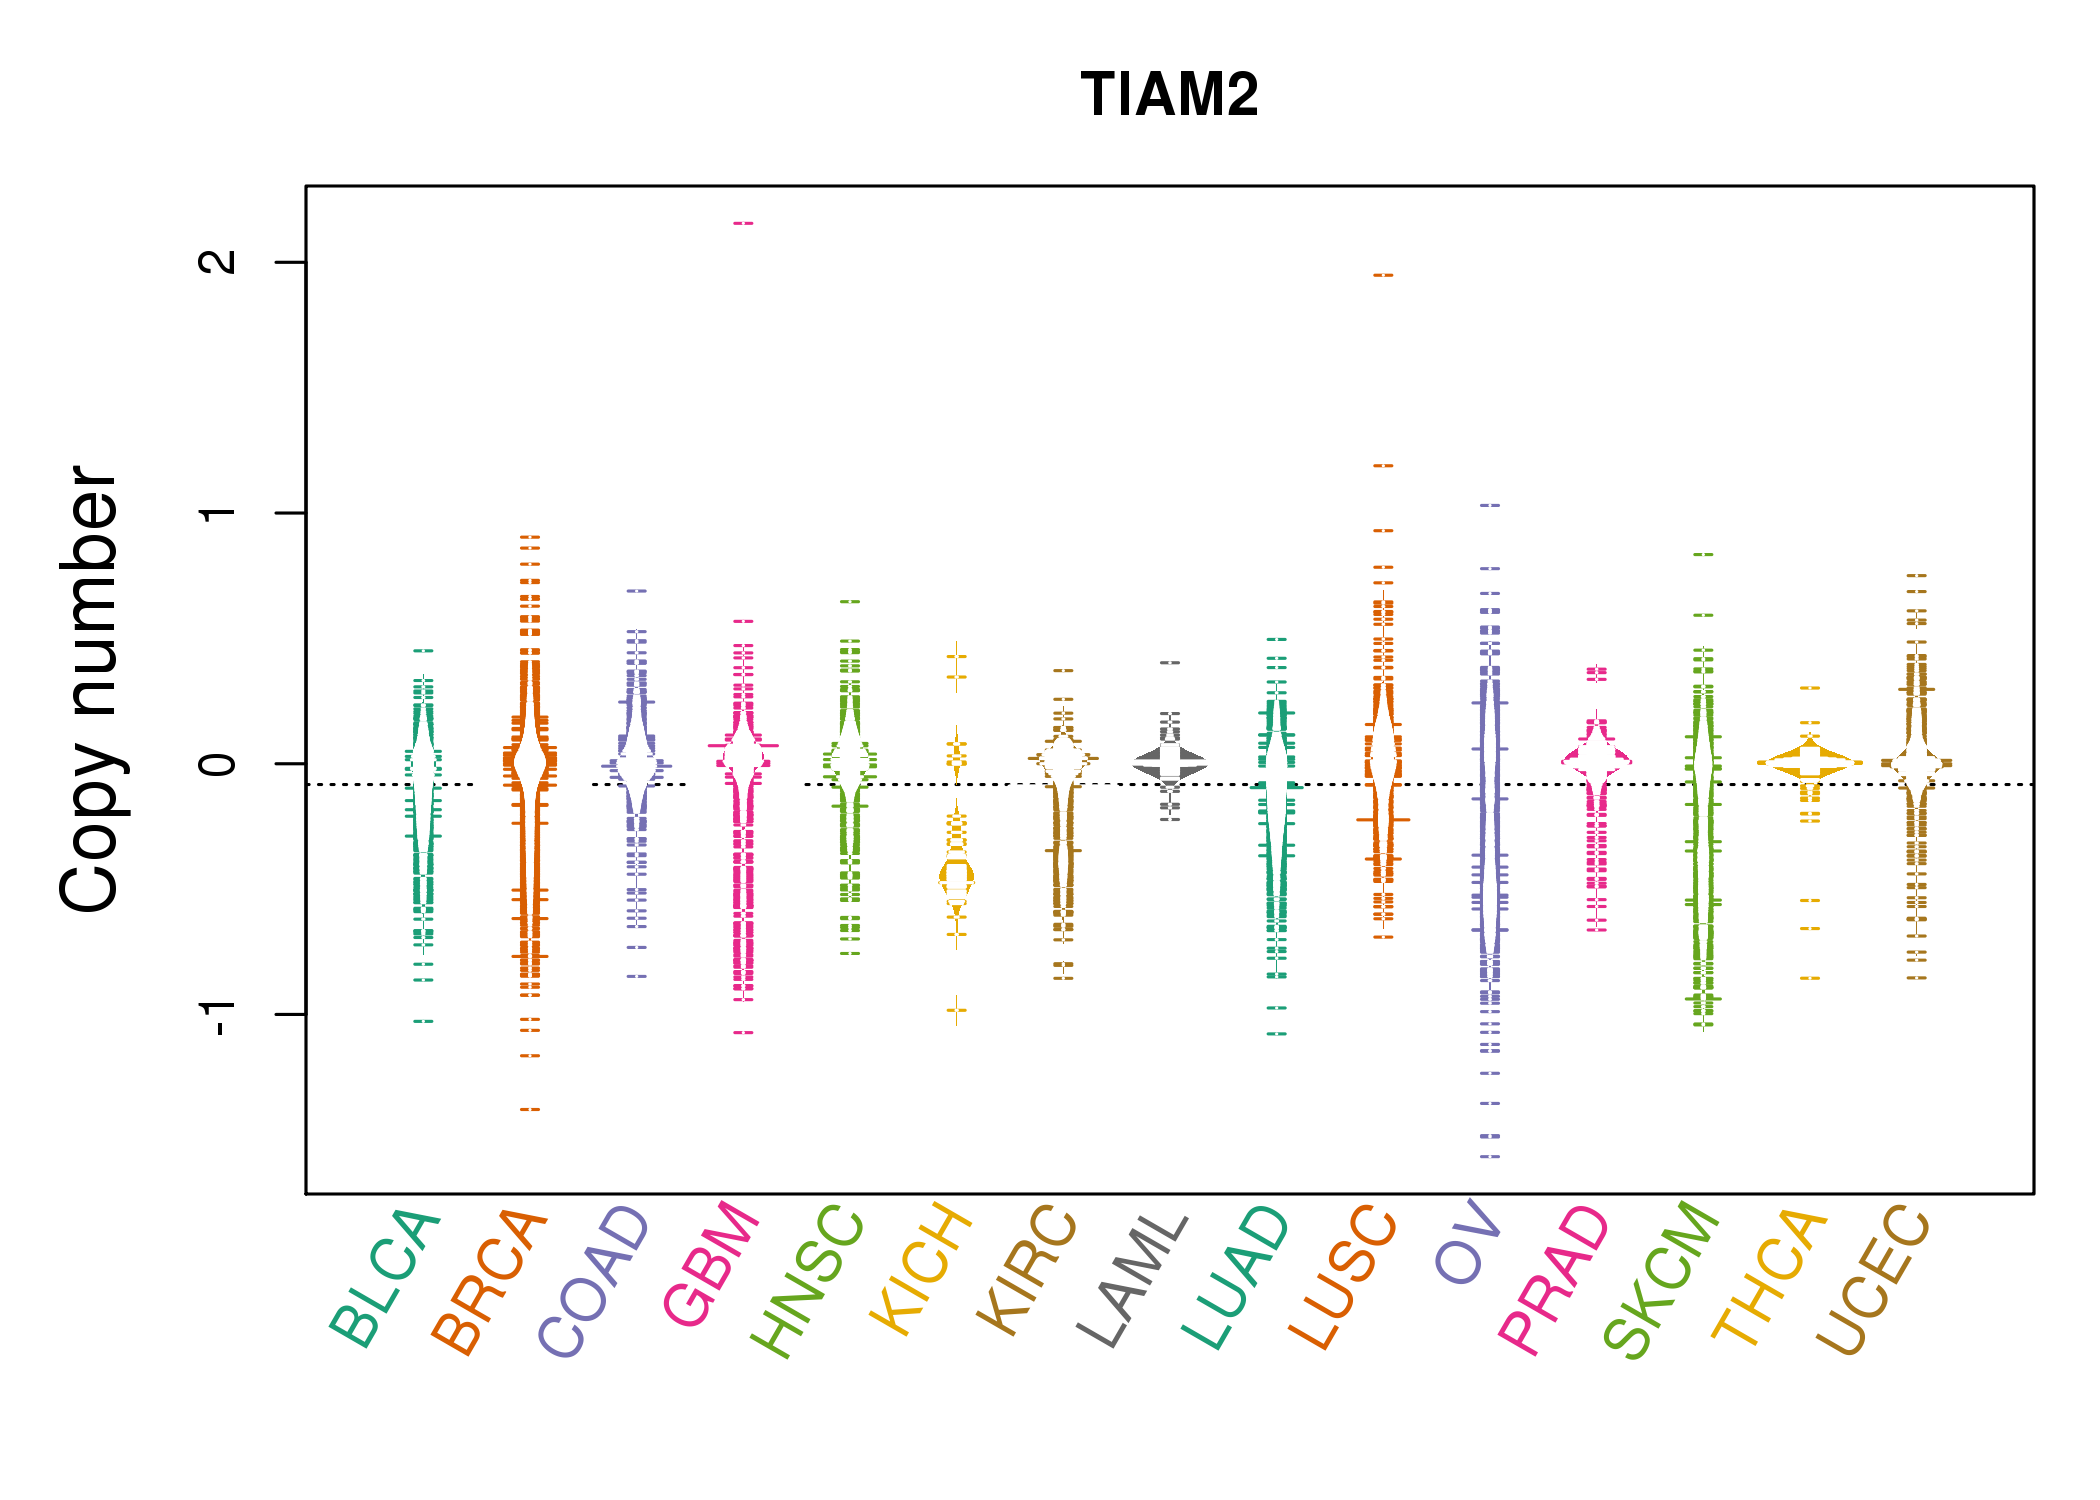 |
| cf) Tissue ID[Tissue type]: BLCA[Bladder Urothelial Carcinoma], BRCA[Breast invasive carcinoma], CESC[Cervical squamous cell carcinoma and endocervical adenocarcinoma], COAD[Colon adenocarcinoma], GBM[Glioblastoma multiforme], Glioma Low Grade, HNSC[Head and Neck squamous cell carcinoma], KICH[Kidney Chromophobe], KIRC[Kidney renal clear cell carcinoma], KIRP[Kidney renal papillary cell carcinoma], LAML[Acute Myeloid Leukemia], LUAD[Lung adenocarcinoma], LUSC[Lung squamous cell carcinoma], OV[Ovarian serous cystadenocarcinoma ], PAAD[Pancreatic adenocarcinoma], PRAD[Prostate adenocarcinoma], SKCM[Skin Cutaneous Melanoma], STAD[Stomach adenocarcinoma], THCA[Thyroid carcinoma], UCEC[Uterine Corpus Endometrial Carcinoma] |
| Top |
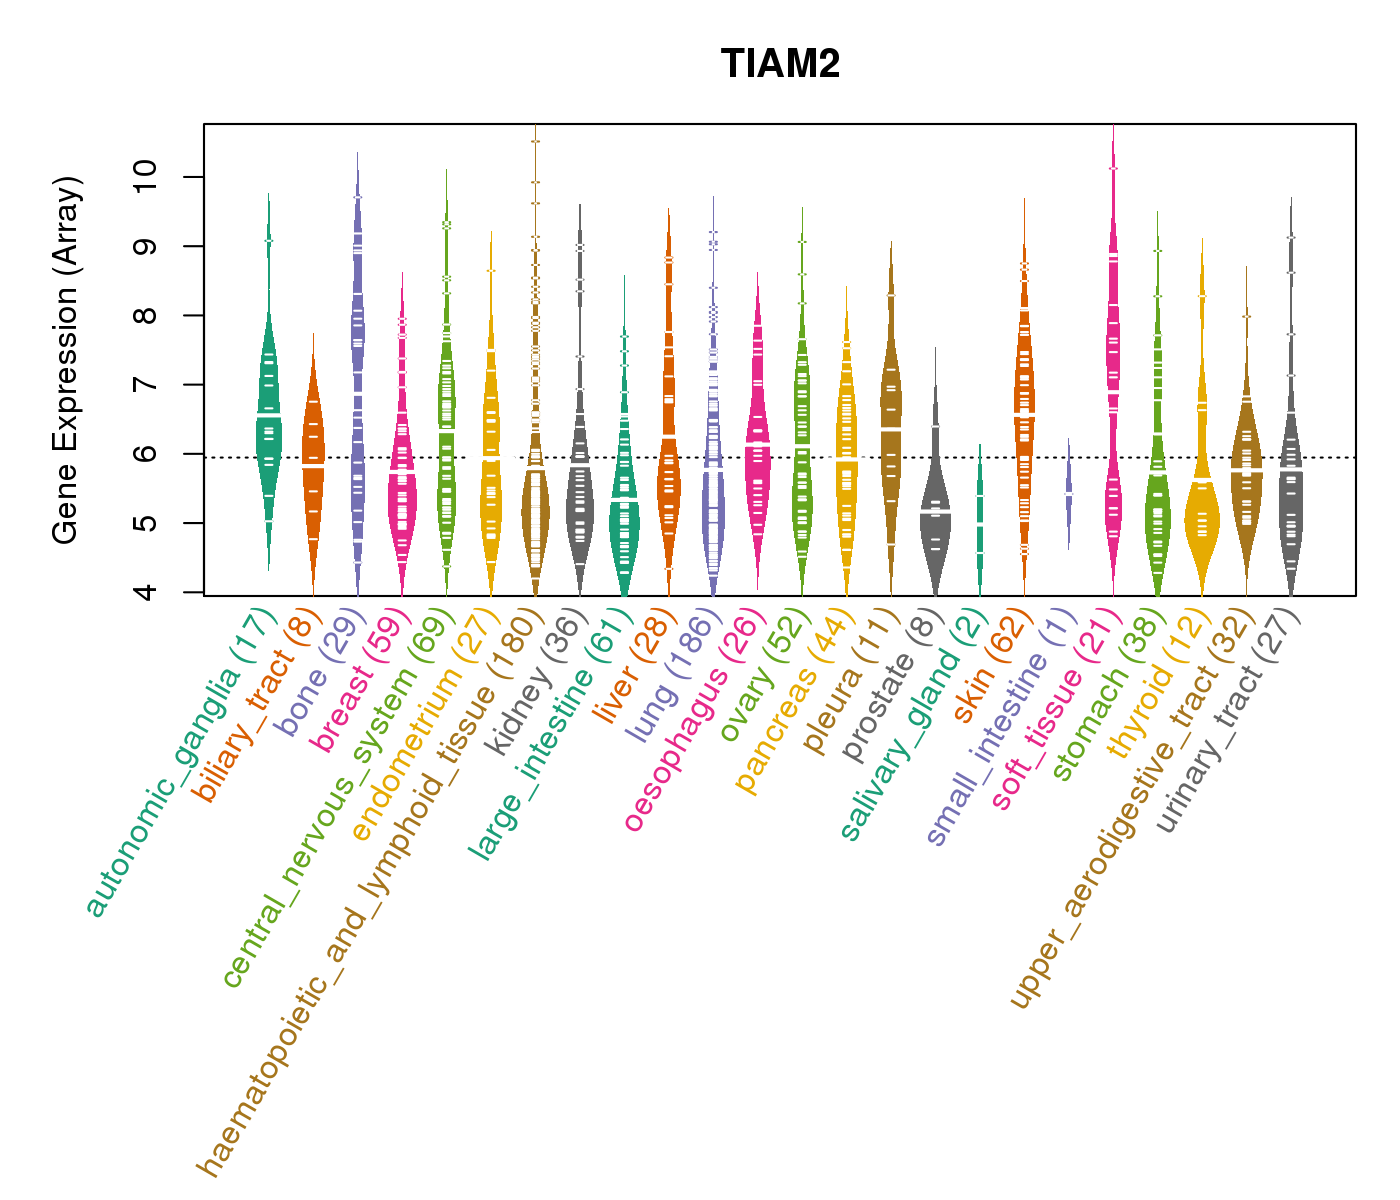
| Gene Expression for TIAM2 |
| * CCLE gene expression data were extracted from CCLE_Expression_Entrez_2012-10-18.res: Gene-centric RMA-normalized mRNA expression data. |
 |
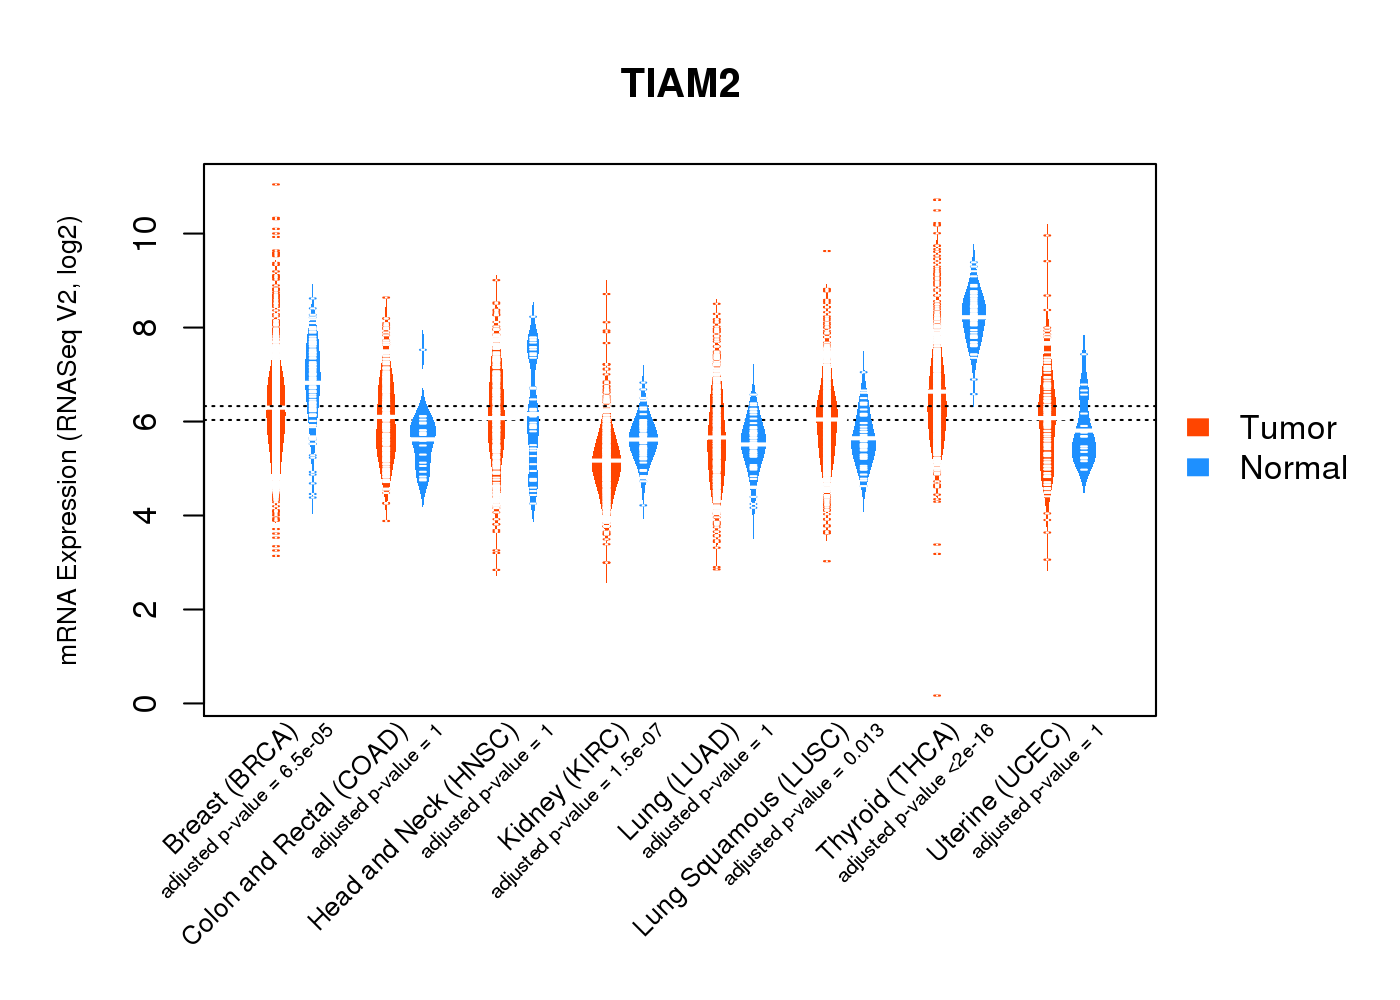
| * Normalized gene expression data of RNASeqV2 was extracted from TCGA using R package TCGA-Assembler. The URLs of all public data files on TCGA DCC data server were gathered at Jan-05-2015. Only eight cancer types have enough normal control samples for differential expression analysis. (t test, adjusted p<0.05 (using Benjamini-Hochberg FDR)) |
 |
| Top |
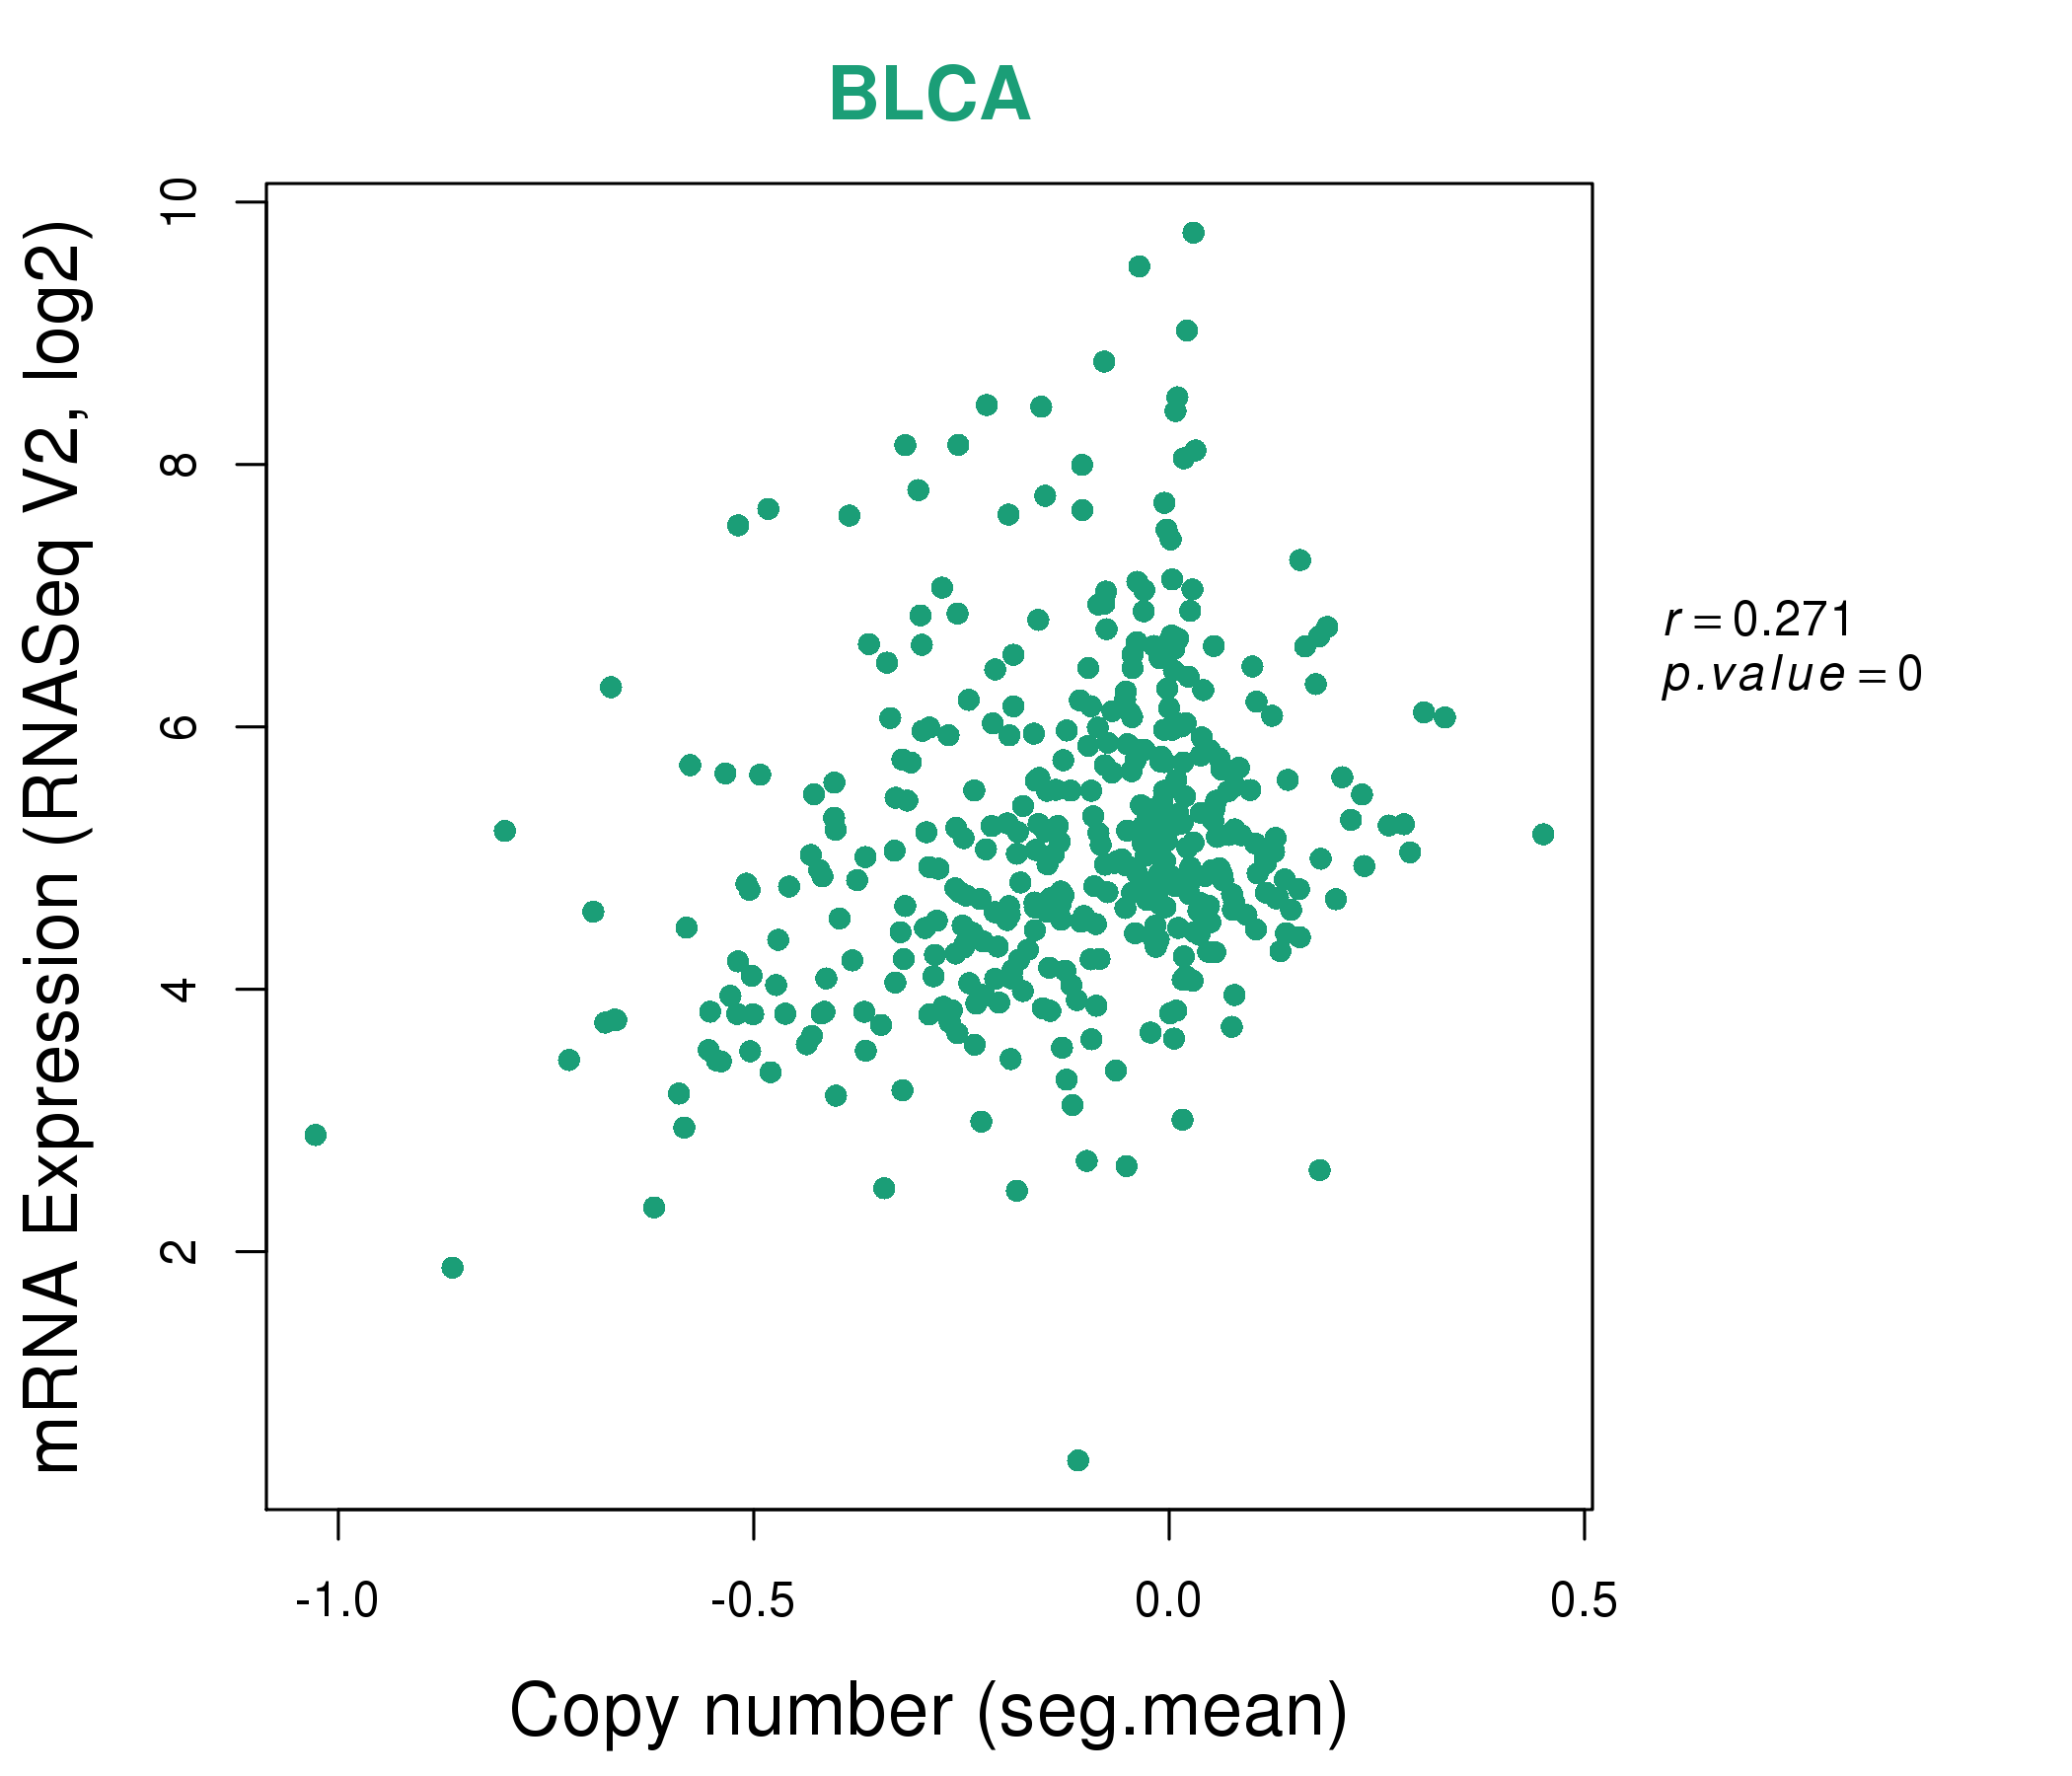
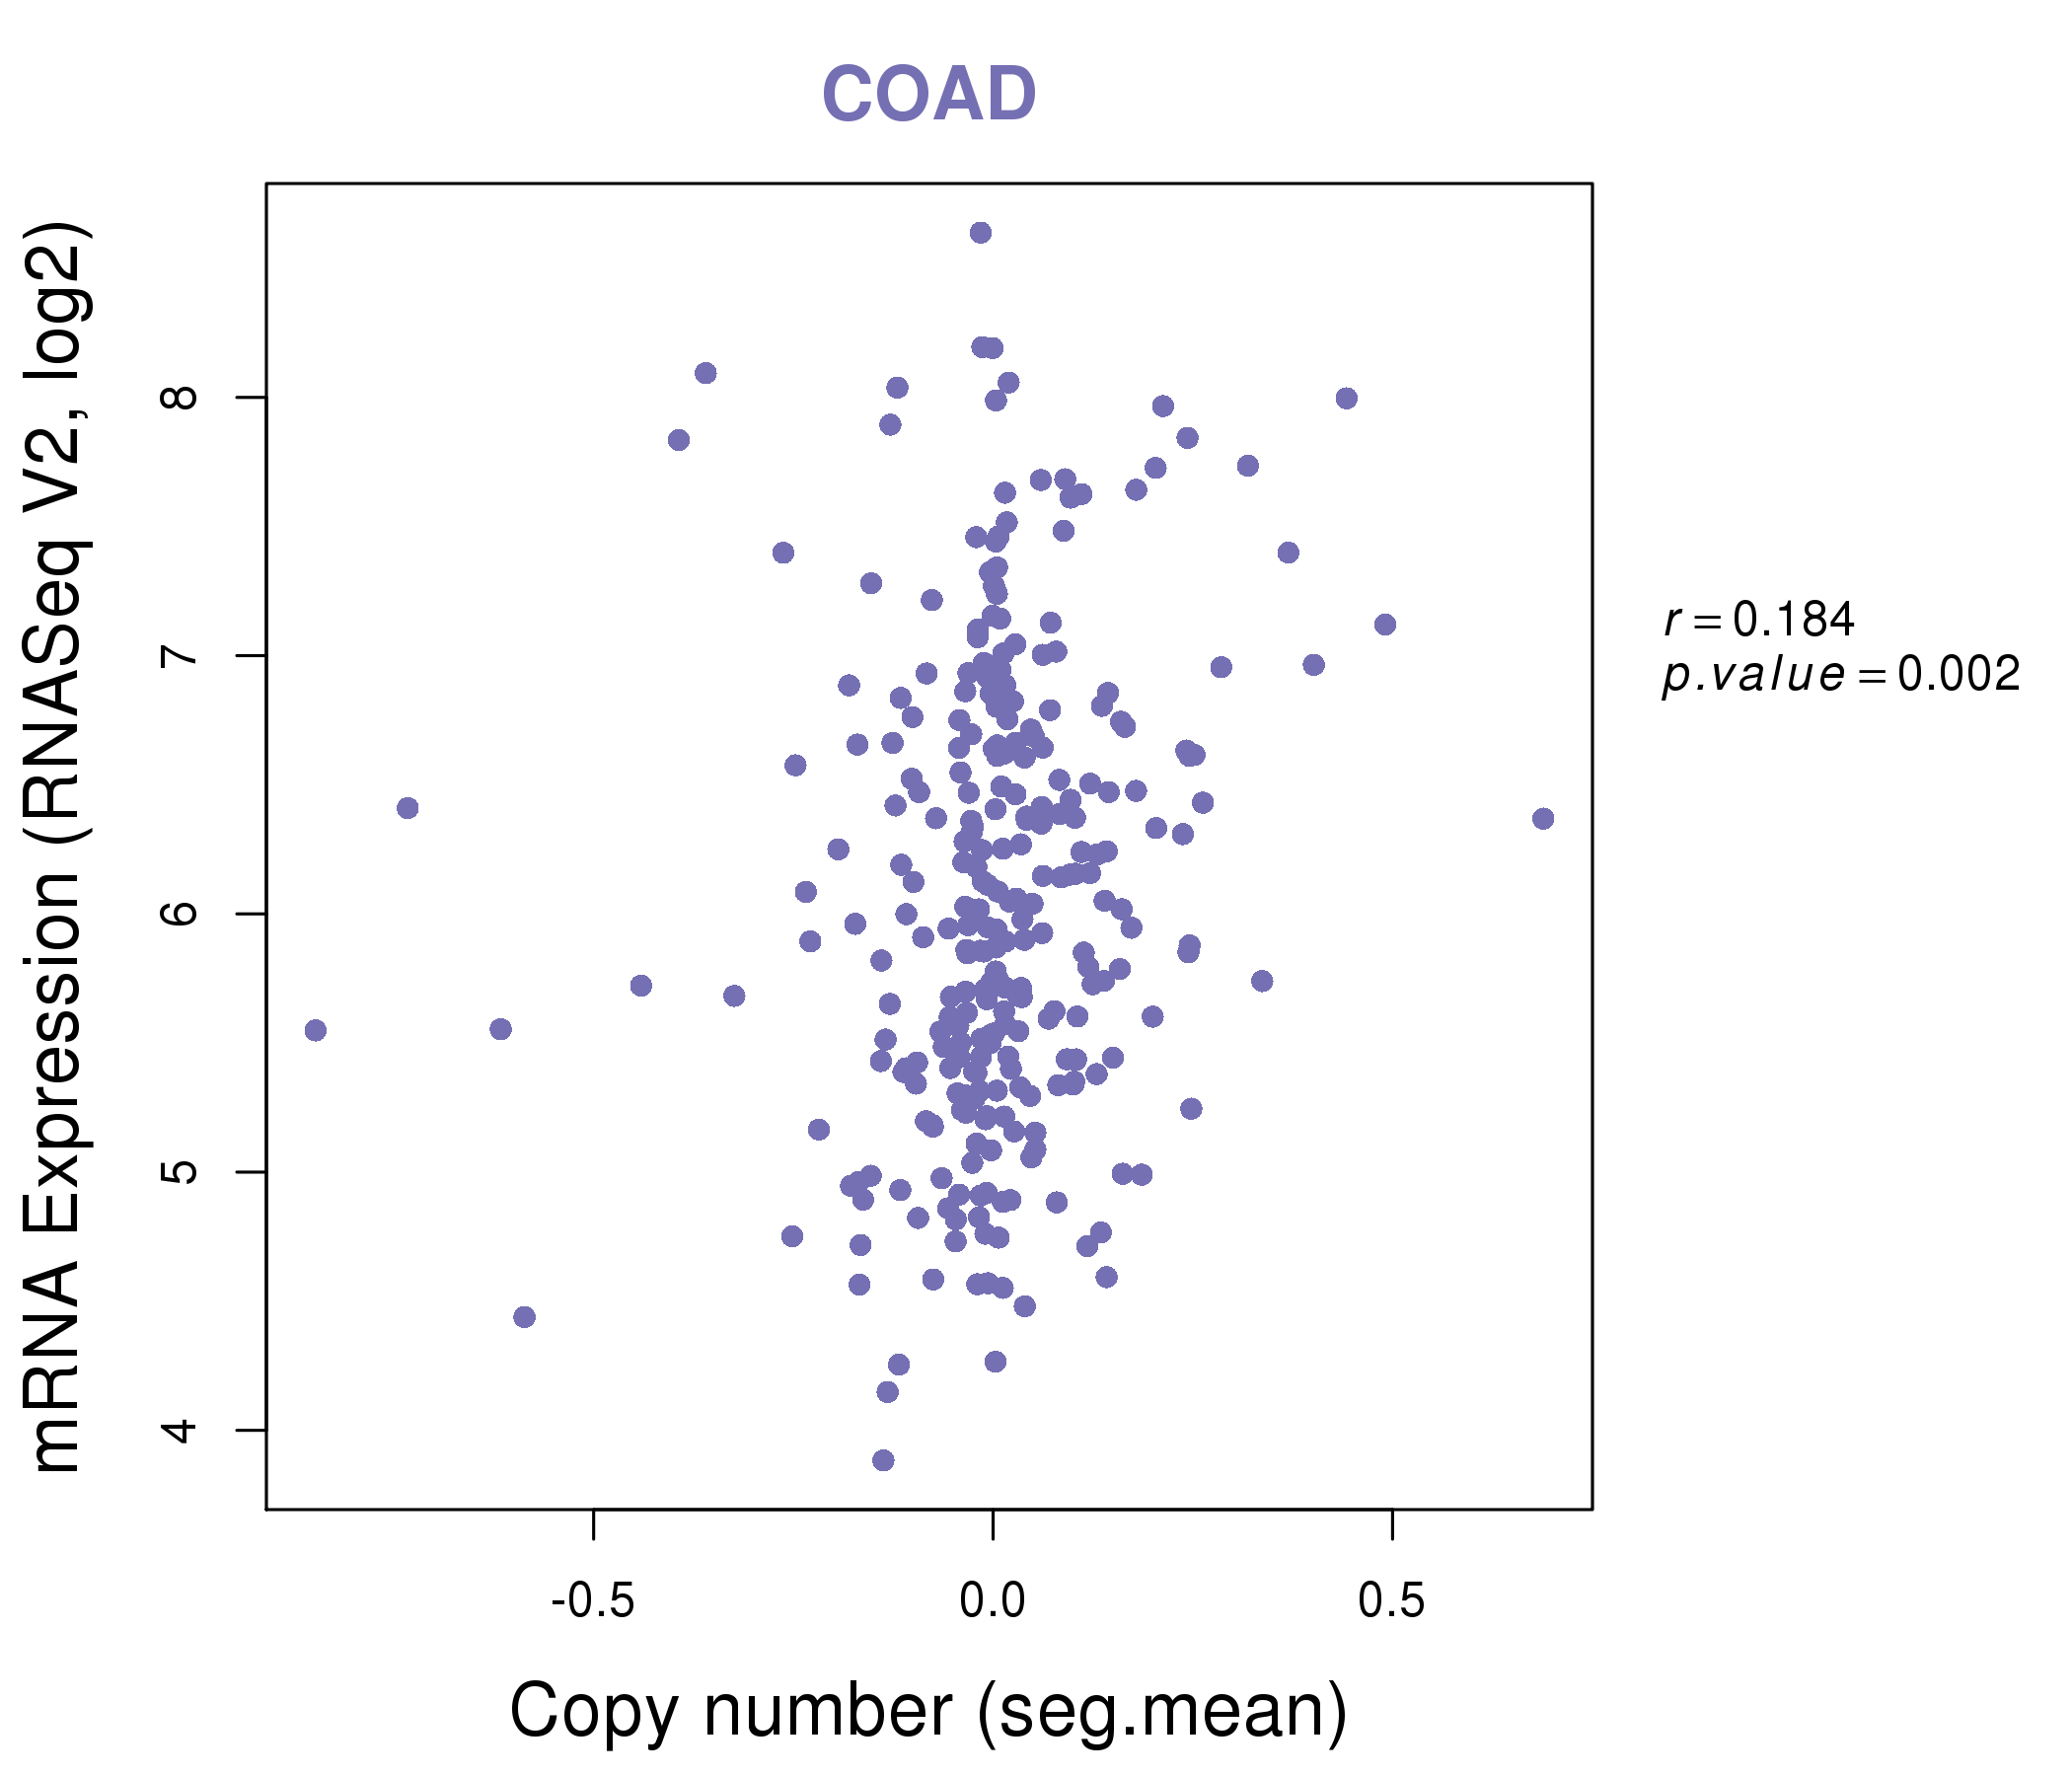
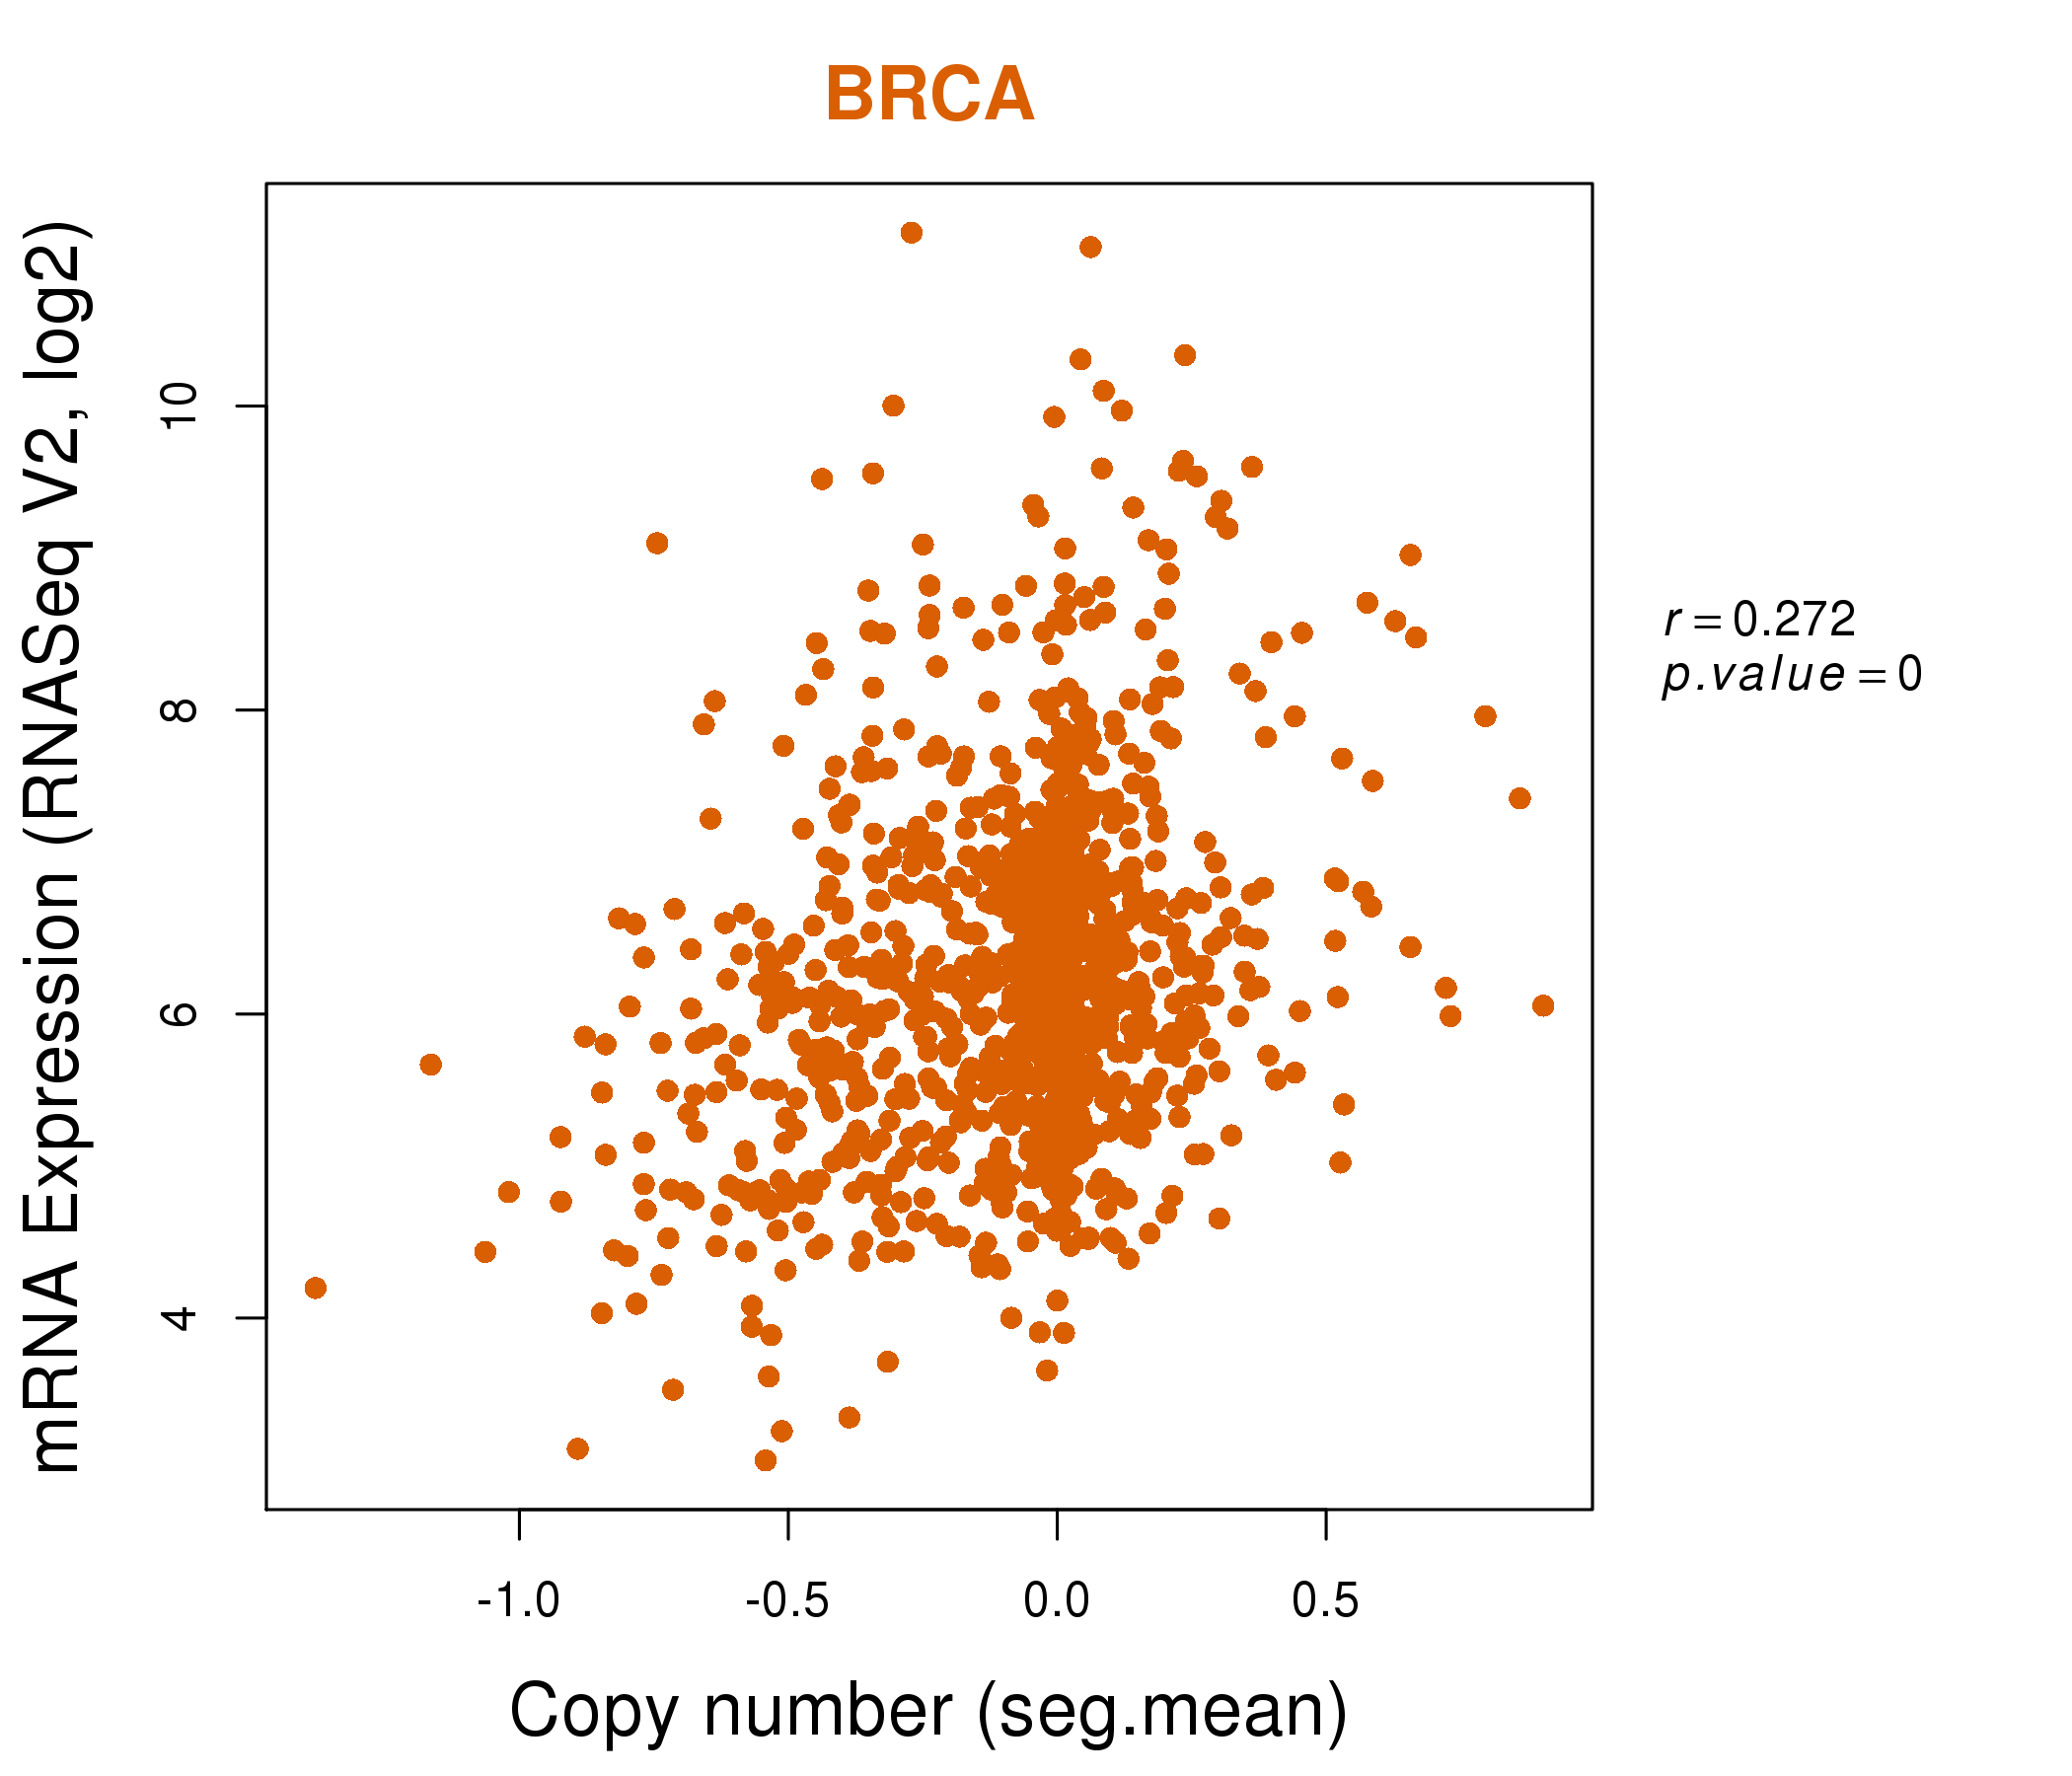
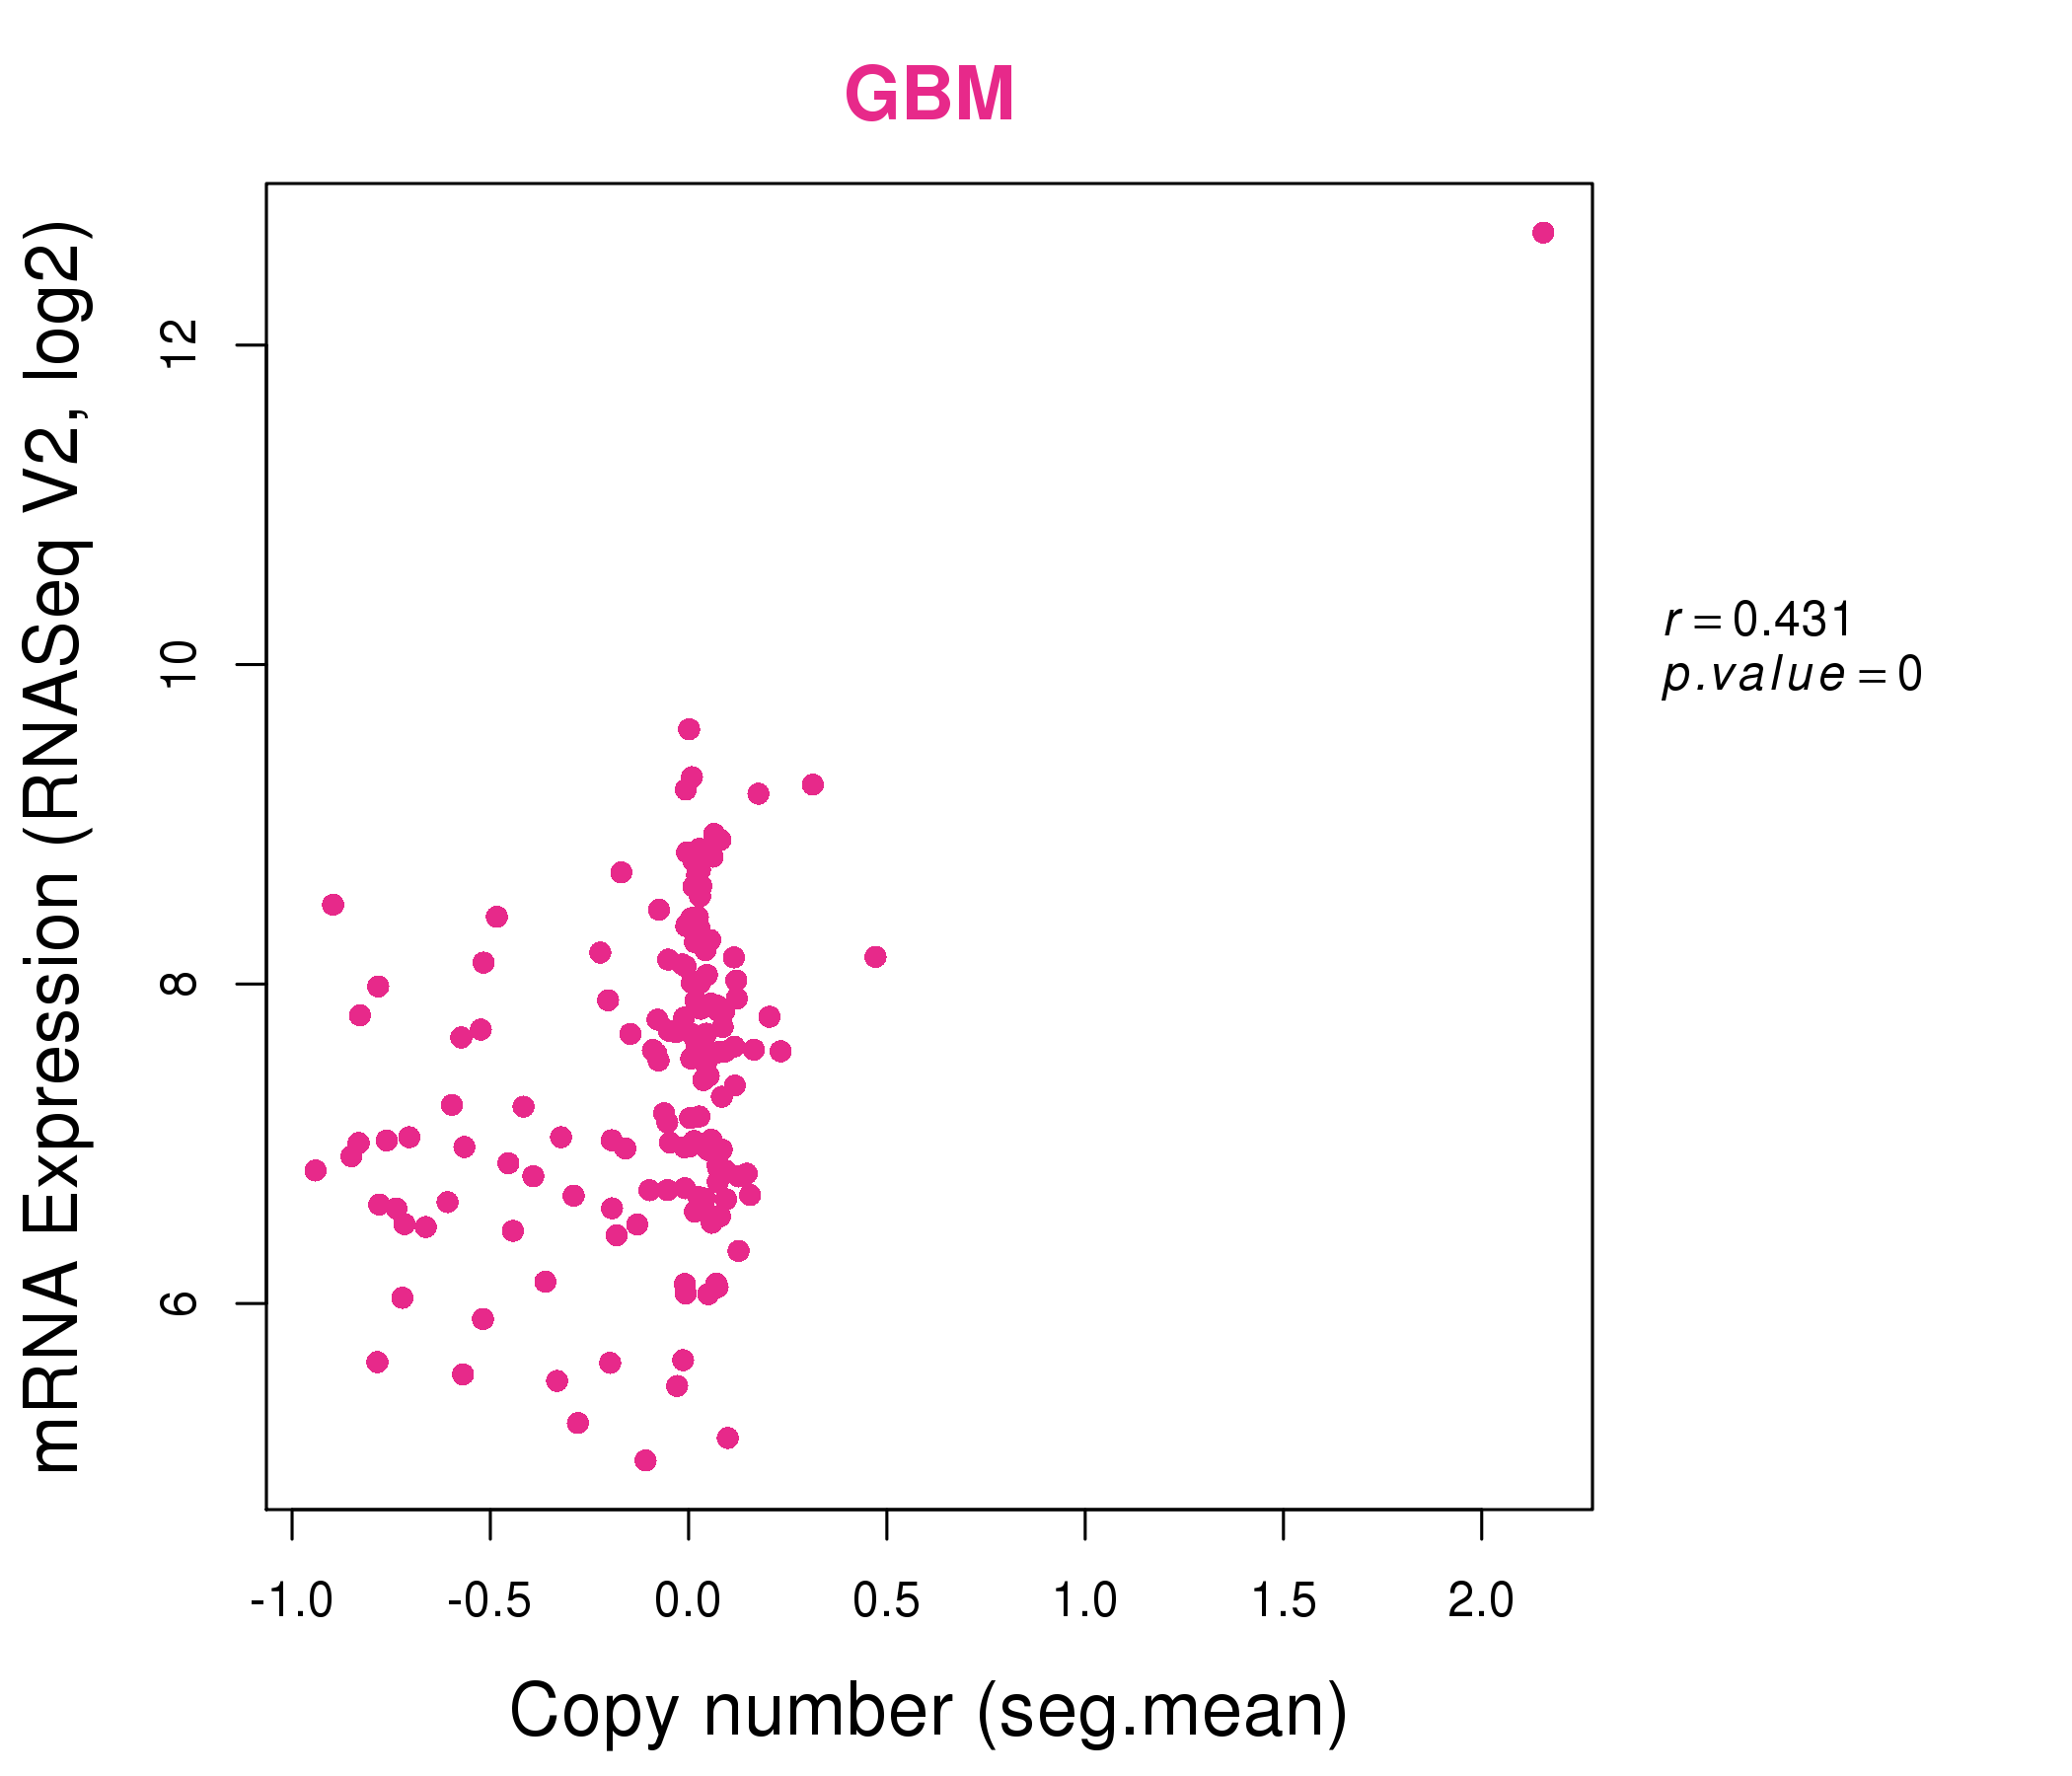
| * This plots show the correlation between CNV and gene expression. |
: Open all plots for all cancer types
 |
|
 |
|
| Top |
| Gene-Gene Network Information |
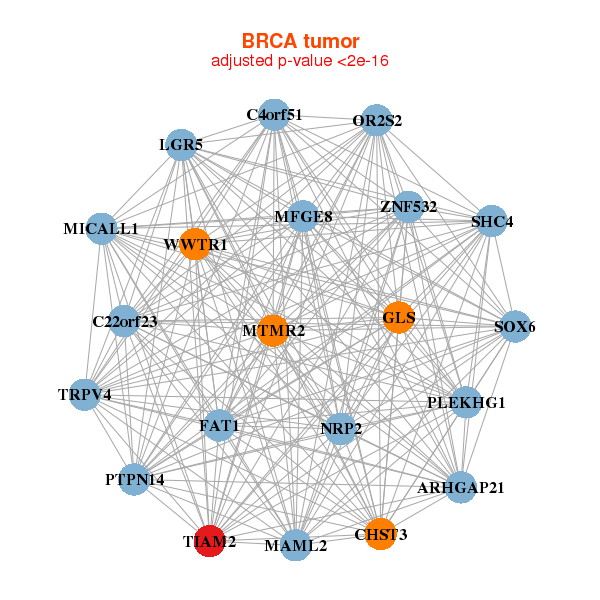
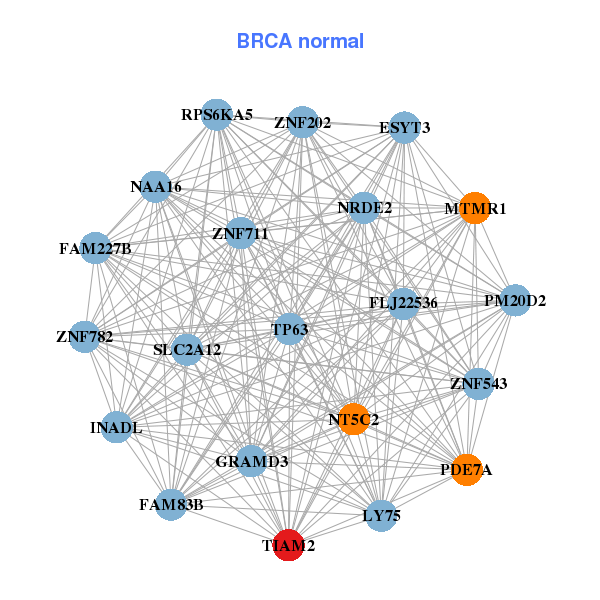
| * Co-Expression network figures were drawn using R package igraph. Only the top 20 genes with the highest correlations were shown. Red circle: input gene, orange circle: cell metabolism gene, sky circle: other gene |
: Open all plots for all cancer types
 |
|
| ARHGAP21,C22orf23,C4orf51,CHST3,FAT1,GLS,LGR5, MAML2,MFGE8,MICALL1,MTMR2,NRP2,OR2S2,PLEKHG1, PTPN14,SHC4,SOX6,TIAM2,TRPV4,WWTR1,ZNF532 | NRDE2,FAM227B,ESYT3,FAM83B,FLJ22536,GRAMD3,INADL, LY75,MTMR1,NAA16,NT5C2,PDE7A,PM20D2,RPS6KA5, SLC2A12,TIAM2,TP63,ZNF202,ZNF543,ZNF711,ZNF782 |
 |
|
| AEBP1,CLDN18,COL8A2,DLL1,DPYSL2,ETV1,ETV5, FKBP15,FZD1,LOC100129034,PCDHB12,PCDHGA1,PCDHGA2,PCDHGA3, PCDHGA5,PCDHGA6,ROR1,TIAM2,TRIM8,ZFPM1,ZNF618 | CPS1,DAB1,DFNA5,FTCD,GRIA4,HOXC11,HOXC8, KHK,LRAT,MTTP,OAT,PDZD7,PHYHIPL,PMP22, RHOBTB2,SEC14L2,SUSD2,TIAM2,TM4SF4,TMPRSS15,TNFSF15 |
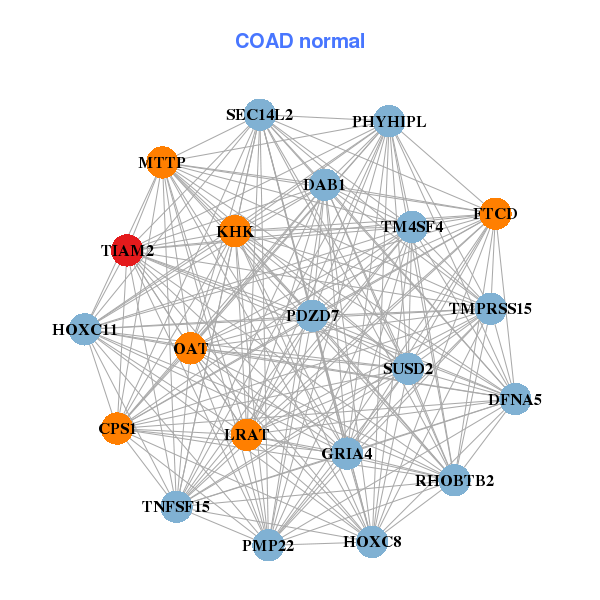
| * Co-Expression network figures were drawn using R package igraph. Only the top 20 genes with the highest correlations were shown. Red circle: input gene, orange circle: cell metabolism gene, sky circle: other gene |
: Open all plots for all cancer types
| Top |
: Open all interacting genes' information including KEGG pathway for all interacting genes from DAVID
| Top |
| Pharmacological Information for TIAM2 |
| There's no related Drug. |
| Top |
| Cross referenced IDs for TIAM2 |
| * We obtained these cross-references from Uniprot database. It covers 150 different DBs, 18 categories. http://www.uniprot.org/help/cross_references_section |
: Open all cross reference information
|
Copyright © 2016-Present - The Univsersity of Texas Health Science Center at Houston @ |