|
||||||||||||||||||||||||||||||||||||||||||||||||||||||||||||||||||||||||||||||||||||||||||||||||||||||||||||||||||||||||||||||||||||||||||||||||||||||||||||||||||||||||||||||||||||||||||||||||||||||||||||||||||||||||||||||||||||||||||||||||||||||||||||||||||||||||||||||||||||||||||||||||||||||||||||||||||||||||||
| |
| Phenotypic Information (metabolism pathway, cancer, disease, phenome) |
| |
| |
| Gene-Gene Network Information: Co-Expression Network, Interacting Genes & KEGG |
| |
|


| Gene Summary for FBXL5 |
| Top |
| Phenotypic Information for FBXL5(metabolism pathway, cancer, disease, phenome) |
| Cancer | CGAP: FBXL5 |
| Familial Cancer Database: FBXL5 | |
| * This gene is included in those cancer gene databases. |
|
|
|
|
|
| . | ||||||||||||||||||||||||||||||||||||||||||||||||||||||||||||||||||||||||||||||||||||||||||||||||||||||||||||||||||||||||||||||||||||||||||||||||||||||||||||||||||||||||||||||||||||||||||||||||||||||||||||||||||||||||||||||||||||||||||||||||||||||||||||||||||||||||||||||||||||||||||||||||||||||||||||||||||||
Oncogene 1 | Significant driver gene in | |||||||||||||||||||||||||||||||||||||||||||||||||||||||||||||||||||||||||||||||||||||||||||||||||||||||||||||||||||||||||||||||||||||||||||||||||||||||||||||||||||||||||||||||||||||||||||||||||||||||||||||||||||||||||||||||||||||||||||||||||||||||||||||||||||||||||||||||||||||||||||||||||||||||||||||||||||||||||
| cf) number; DB name 1 Oncogene; http://nar.oxfordjournals.org/content/35/suppl_1/D721.long, 2 Tumor Suppressor gene; https://bioinfo.uth.edu/TSGene/, 3 Cancer Gene Census; http://www.nature.com/nrc/journal/v4/n3/abs/nrc1299.html, 4 CancerGenes; http://nar.oxfordjournals.org/content/35/suppl_1/D721.long, 5 Network of Cancer Gene; http://ncg.kcl.ac.uk/index.php, 1Therapeutic Vulnerabilities in Cancer; http://cbio.mskcc.org/cancergenomics/statius/ |
| REACTOME_METABOLISM_OF_PROTEINS | |
| OMIM | 605655; gene. 605655; gene. |
| Orphanet | |
| Disease | KEGG Disease: FBXL5 |
| MedGen: FBXL5 (Human Medical Genetics with Condition) | |
| ClinVar: FBXL5 | |
| Phenotype | MGI: FBXL5 (International Mouse Phenotyping Consortium) |
| PhenomicDB: FBXL5 | |
| Mutations for FBXL5 |
| * Under tables are showing count per each tissue to give us broad intuition about tissue specific mutation patterns.You can go to the detailed page for each mutation database's web site. |
| There's no structural variation information in COSMIC data for this gene. |
| * From mRNA Sanger sequences, Chitars2.0 arranged chimeric transcripts. This table shows FBXL5 related fusion information. |
| ID | Head Gene | Tail Gene | Accession | Gene_a | qStart_a | qEnd_a | Chromosome_a | tStart_a | tEnd_a | Gene_a | qStart_a | qEnd_a | Chromosome_a | tStart_a | tEnd_a |
| T18548 | PXT1 | 39 | 58 | 6 | 36401851 | 36401870 | FBXL5 | 48 | 149 | 4 | 15606810 | 15606911 | |
| Top |
| Mutation type/ Tissue ID | brca | cns | cerv | endome | haematopo | kidn | Lintest | liver | lung | ns | ovary | pancre | prost | skin | stoma | thyro | urina | |||
| Total # sample | 1 | |||||||||||||||||||
| GAIN (# sample) | ||||||||||||||||||||
| LOSS (# sample) | 1 |
| cf) Tissue ID; Tissue type (1; Breast, 2; Central_nervous_system, 3; Cervix, 4; Endometrium, 5; Haematopoietic_and_lymphoid_tissue, 6; Kidney, 7; Large_intestine, 8; Liver, 9; Lung, 10; NS, 11; Ovary, 12; Pancreas, 13; Prostate, 14; Skin, 15; Stomach, 16; Thyroid, 17; Urinary_tract) |
| Top |
|
 |
| Top |
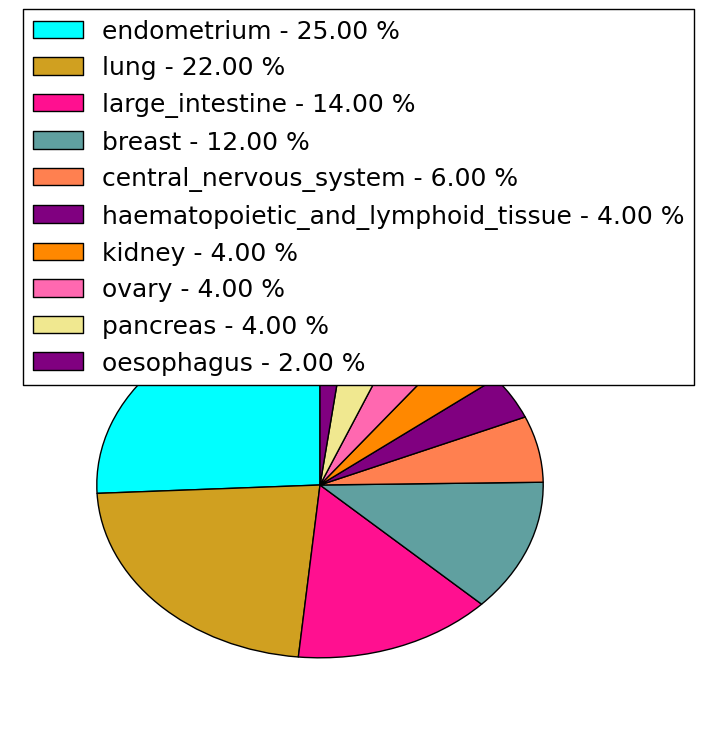
| Stat. for Non-Synonymous SNVs (# total SNVs=48) | (# total SNVs=8) |
 | 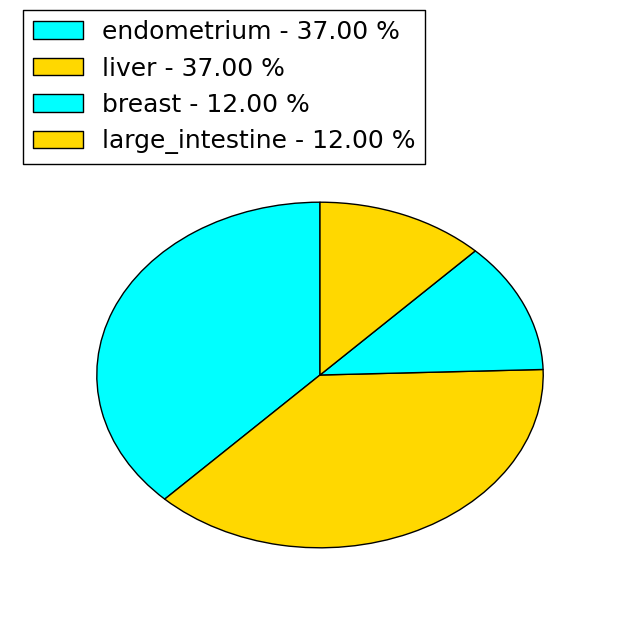 |
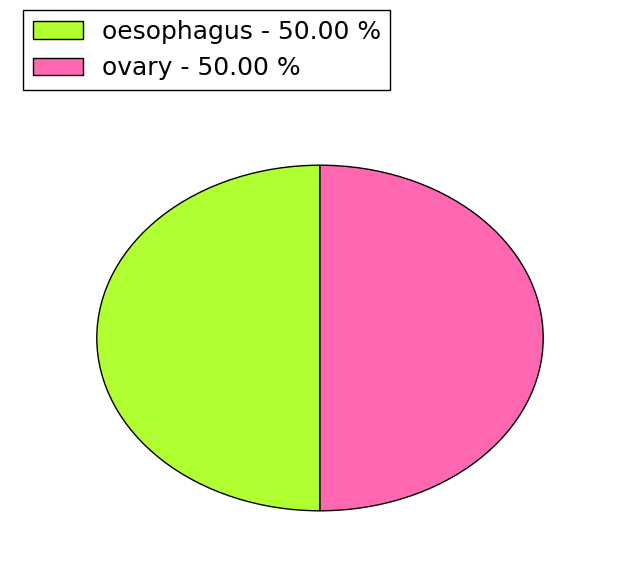
(# total SNVs=2) | (# total SNVs=0) |
 |
| Top |
| * When you move the cursor on each content, you can see more deailed mutation information on the Tooltip. Those are primary_site,primary_histology,mutation(aa),pubmedID. |
| GRCh37 position | Mutation(aa) | Unique sampleID count |
| chr4:15627285-15627285 | p.W480C | 3 |
| chr4:15632339-15632339 | p.E281A | 2 |
| chr4:15626989-15626989 | p.P579L | 2 |
| chr4:15627406-15627406 | p.S440C | 2 |
| chr4:15627042-15627042 | p.S561S | 2 |
| chr4:15627436-15627436 | p.A430V | 2 |
| chr4:15627206-15627206 | p.M507V | 2 |
| chr4:15626978-15626978 | p.D583Y | 2 |
| chr4:15640266-15640266 | p.I150V | 1 |
| chr4:15627274-15627274 | p.A484G | 1 |
| Top |
|
 |
| Point Mutation/ Tissue ID | 1 | 2 | 3 | 4 | 5 | 6 | 7 | 8 | 9 | 10 | 11 | 12 | 13 | 14 | 15 | 16 | 17 | 18 | 19 | 20 |
| # sample | 1 | 4 | 4 | 2 | 1 | 1 | 2 | 1 | 3 | 5 | 11 | |||||||||
| # mutation | 1 | 4 | 4 | 2 | 1 | 1 | 3 | 1 | 3 | 5 | 12 | |||||||||
| nonsynonymous SNV | 3 | 3 | 2 | 1 | 1 | 3 | 1 | 3 | 5 | 9 | ||||||||||
| synonymous SNV | 1 | 1 | 1 | 3 |
| cf) Tissue ID; Tissue type (1; BLCA[Bladder Urothelial Carcinoma], 2; BRCA[Breast invasive carcinoma], 3; CESC[Cervical squamous cell carcinoma and endocervical adenocarcinoma], 4; COAD[Colon adenocarcinoma], 5; GBM[Glioblastoma multiforme], 6; Glioma Low Grade, 7; HNSC[Head and Neck squamous cell carcinoma], 8; KICH[Kidney Chromophobe], 9; KIRC[Kidney renal clear cell carcinoma], 10; KIRP[Kidney renal papillary cell carcinoma], 11; LAML[Acute Myeloid Leukemia], 12; LUAD[Lung adenocarcinoma], 13; LUSC[Lung squamous cell carcinoma], 14; OV[Ovarian serous cystadenocarcinoma ], 15; PAAD[Pancreatic adenocarcinoma], 16; PRAD[Prostate adenocarcinoma], 17; SKCM[Skin Cutaneous Melanoma], 18:STAD[Stomach adenocarcinoma], 19:THCA[Thyroid carcinoma], 20:UCEC[Uterine Corpus Endometrial Carcinoma]) |
| Top |
| * We represented just top 10 SNVs. When you move the cursor on each content, you can see more deailed mutation information on the Tooltip. Those are primary_site, primary_histology, mutation(aa), pubmedID. |
| Genomic Position | Mutation(aa) | Unique sampleID count |
| chr4:15626978 | p.D582Y,FBXL5 | 2 |
| chr4:15629638 | p.E280A,FBXL5 | 1 |
| chr4:15607391 | p.L577L,FBXL5 | 1 |
| chr4:15640297 | p.S242S,FBXL5 | 1 |
| chr4:15627231 | p.M568V,FBXL5 | 1 |
| chr4:15632339 | p.S242L,FBXL5 | 1 |
| chr4:15614001 | p.A543T,FBXL5 | 1 |
| chr4:15642491 | p.S539P,FBXL5 | 1 |
| chr4:15627233 | p.F216F,FBXL5 | 1 |
| chr4:15638154 | p.S530I,FBXL5 | 1 |
| * Copy number data were extracted from TCGA using R package TCGA-Assembler. The URLs of all public data files on TCGA DCC data server were gathered on Jan-05-2015. Function ProcessCNAData in TCGA-Assembler package was used to obtain gene-level copy number value which is calculated as the average copy number of the genomic region of a gene. |
 |
| cf) Tissue ID[Tissue type]: BLCA[Bladder Urothelial Carcinoma], BRCA[Breast invasive carcinoma], CESC[Cervical squamous cell carcinoma and endocervical adenocarcinoma], COAD[Colon adenocarcinoma], GBM[Glioblastoma multiforme], Glioma Low Grade, HNSC[Head and Neck squamous cell carcinoma], KICH[Kidney Chromophobe], KIRC[Kidney renal clear cell carcinoma], KIRP[Kidney renal papillary cell carcinoma], LAML[Acute Myeloid Leukemia], LUAD[Lung adenocarcinoma], LUSC[Lung squamous cell carcinoma], OV[Ovarian serous cystadenocarcinoma ], PAAD[Pancreatic adenocarcinoma], PRAD[Prostate adenocarcinoma], SKCM[Skin Cutaneous Melanoma], STAD[Stomach adenocarcinoma], THCA[Thyroid carcinoma], UCEC[Uterine Corpus Endometrial Carcinoma] |
| Top |
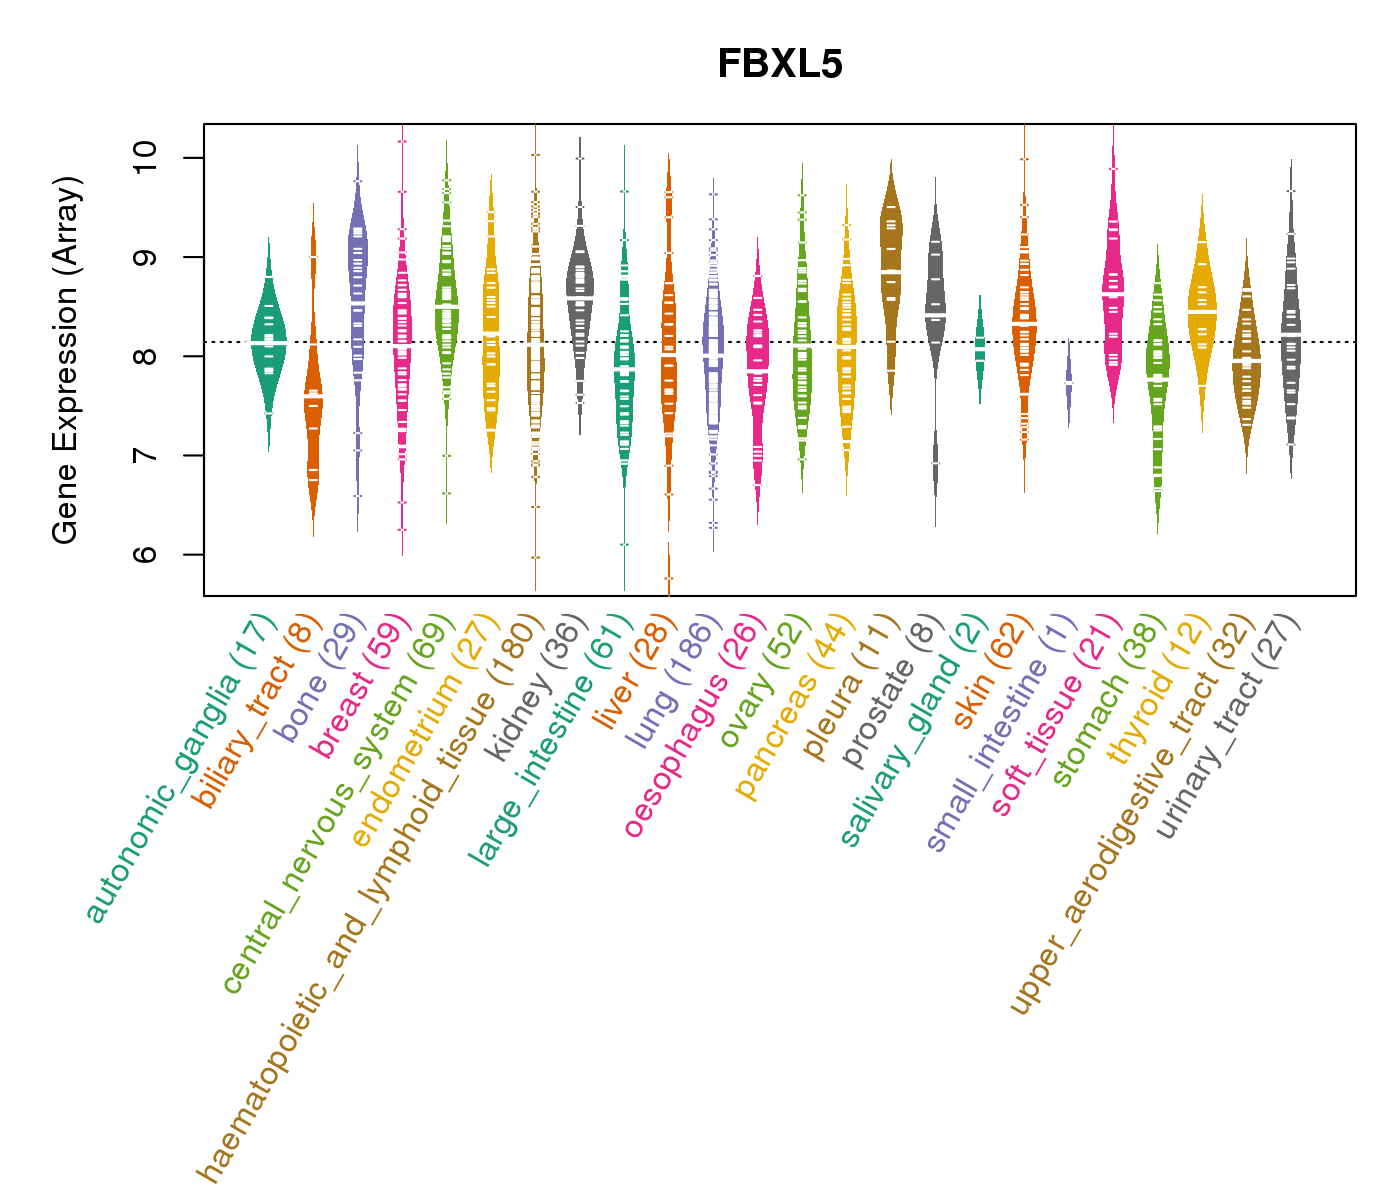
| Gene Expression for FBXL5 |
| * CCLE gene expression data were extracted from CCLE_Expression_Entrez_2012-10-18.res: Gene-centric RMA-normalized mRNA expression data. |
 |
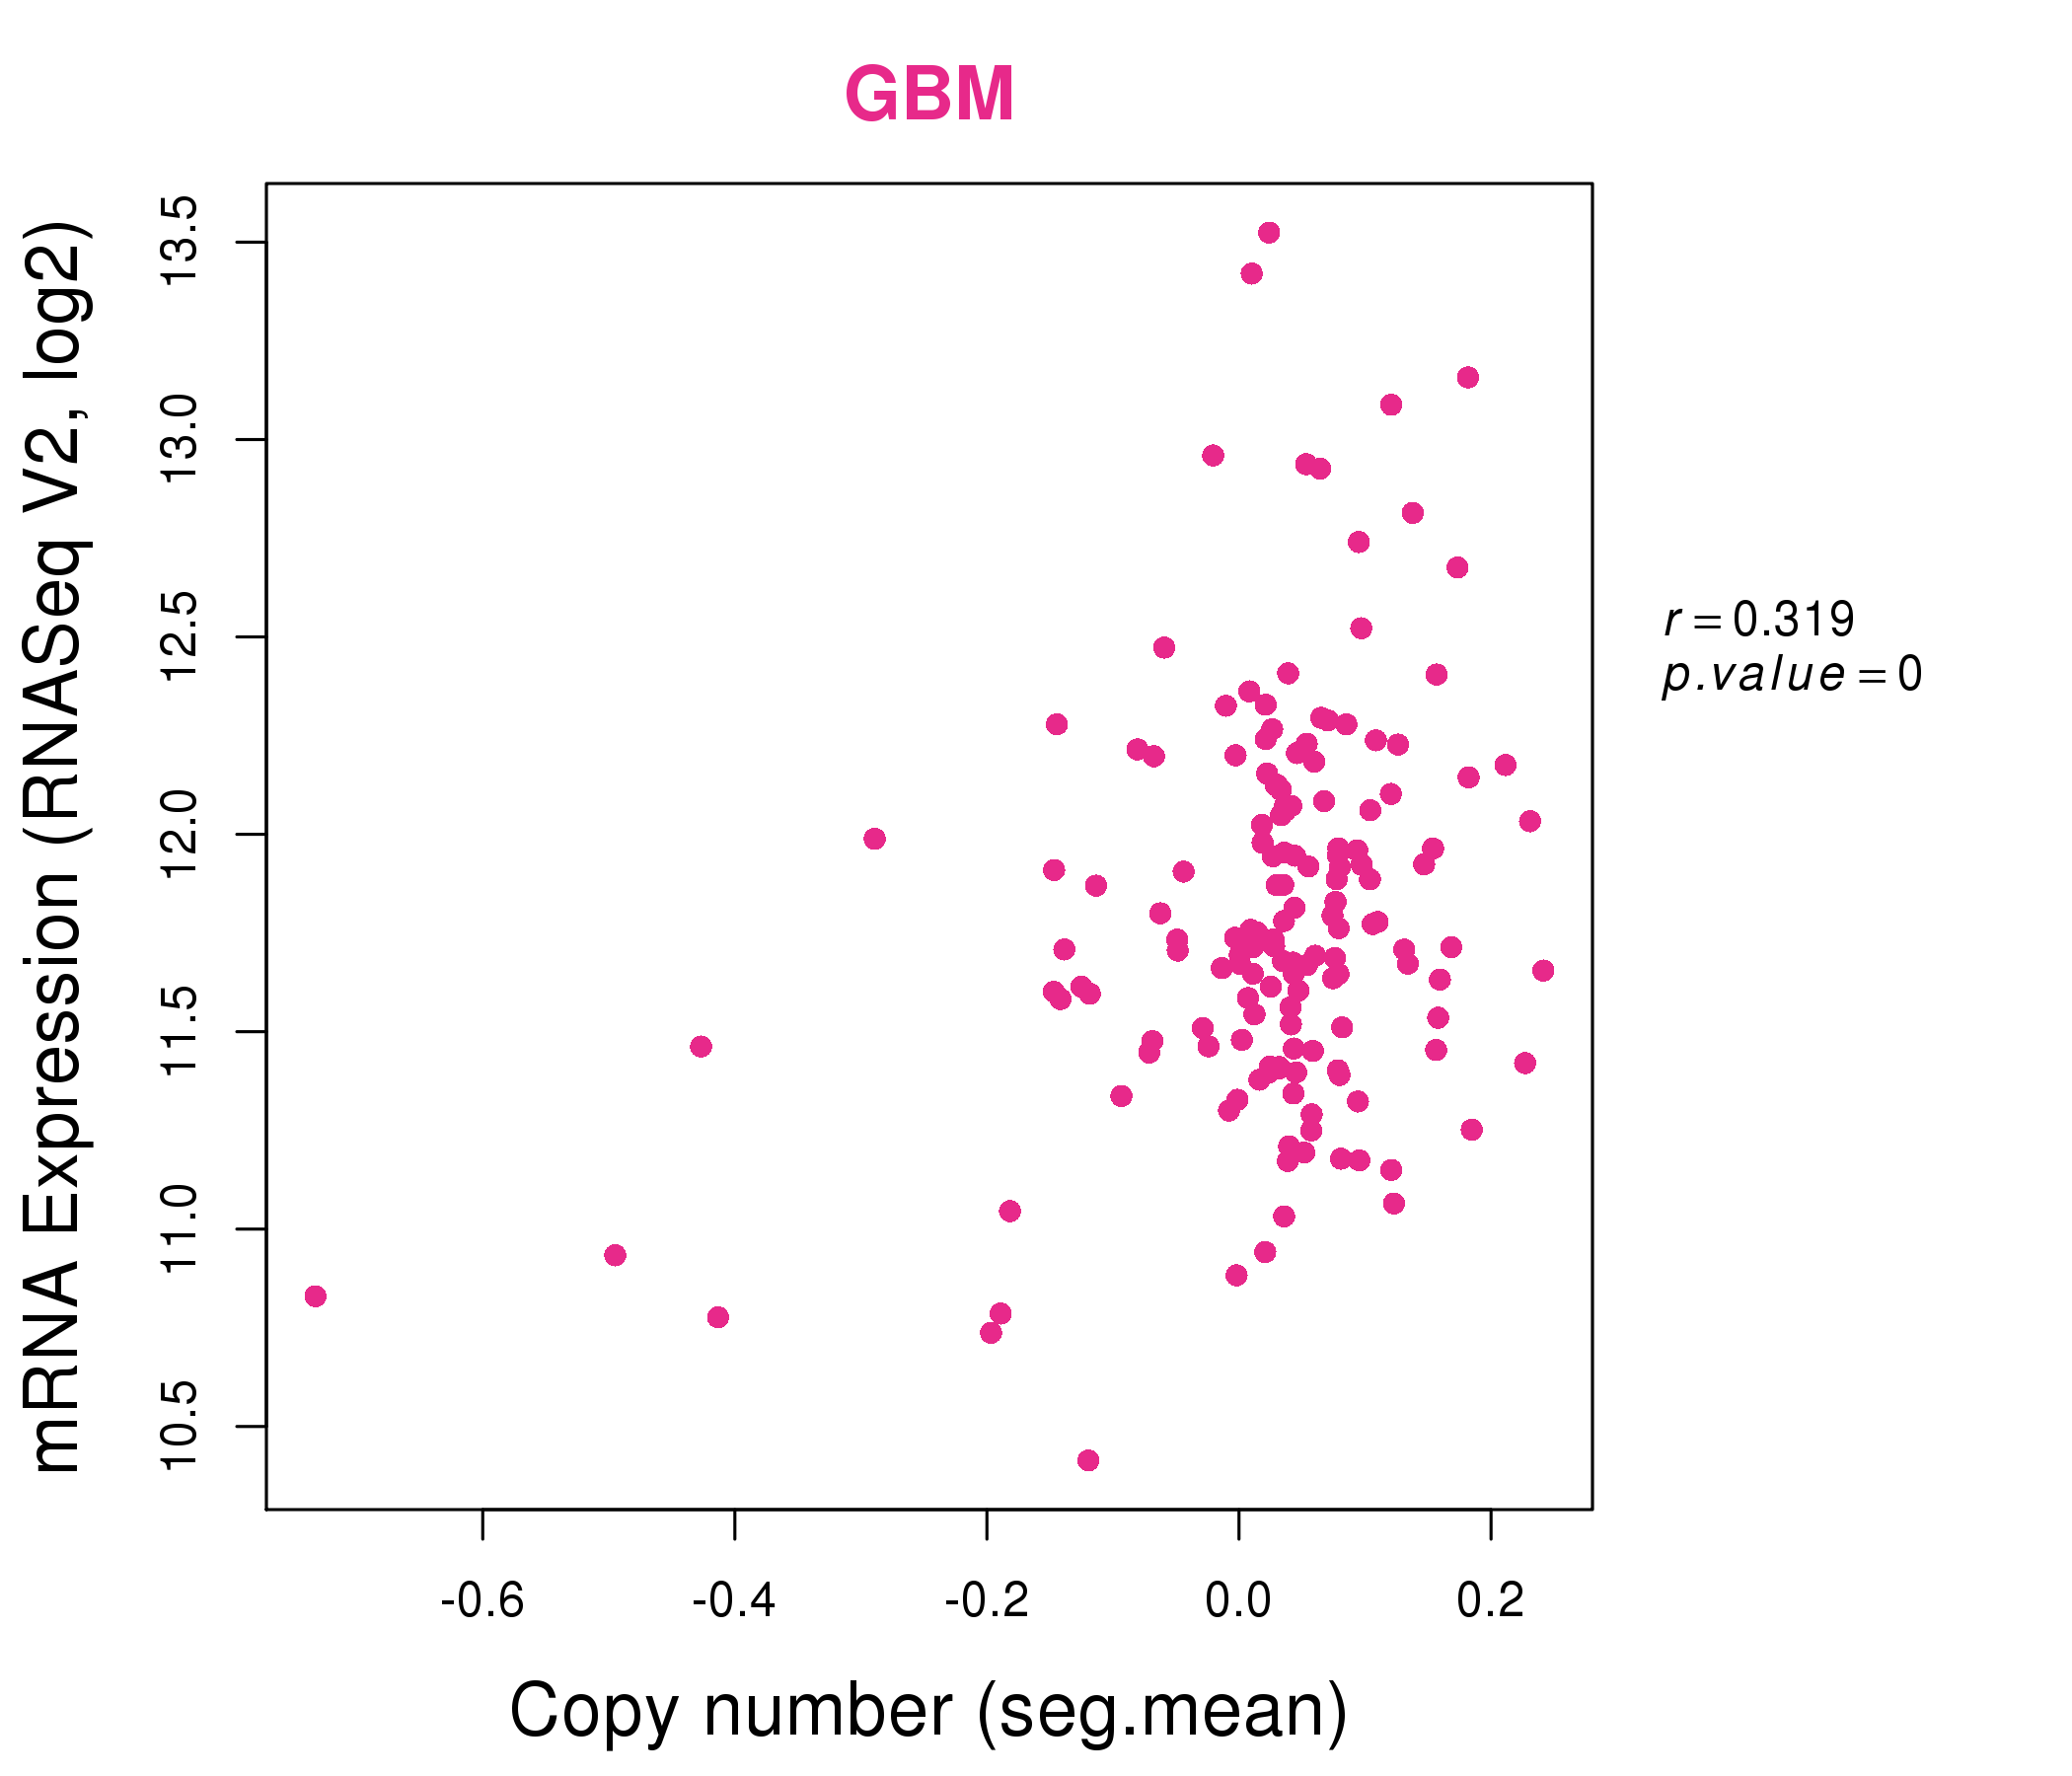
| * Normalized gene expression data of RNASeqV2 was extracted from TCGA using R package TCGA-Assembler. The URLs of all public data files on TCGA DCC data server were gathered at Jan-05-2015. Only eight cancer types have enough normal control samples for differential expression analysis. (t test, adjusted p<0.05 (using Benjamini-Hochberg FDR)) |
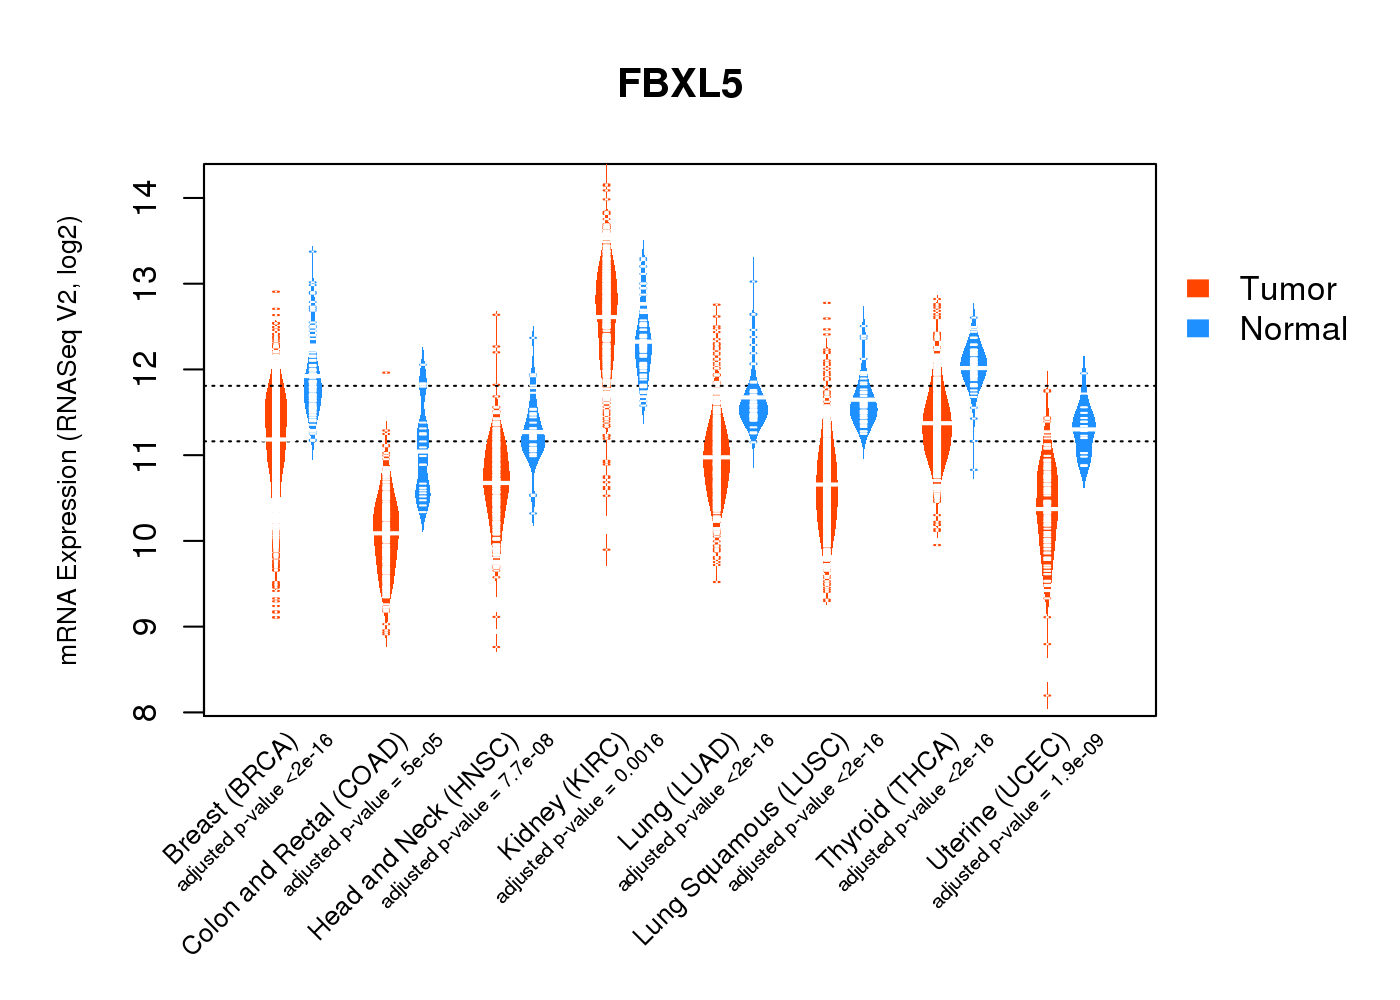 |
| Top |
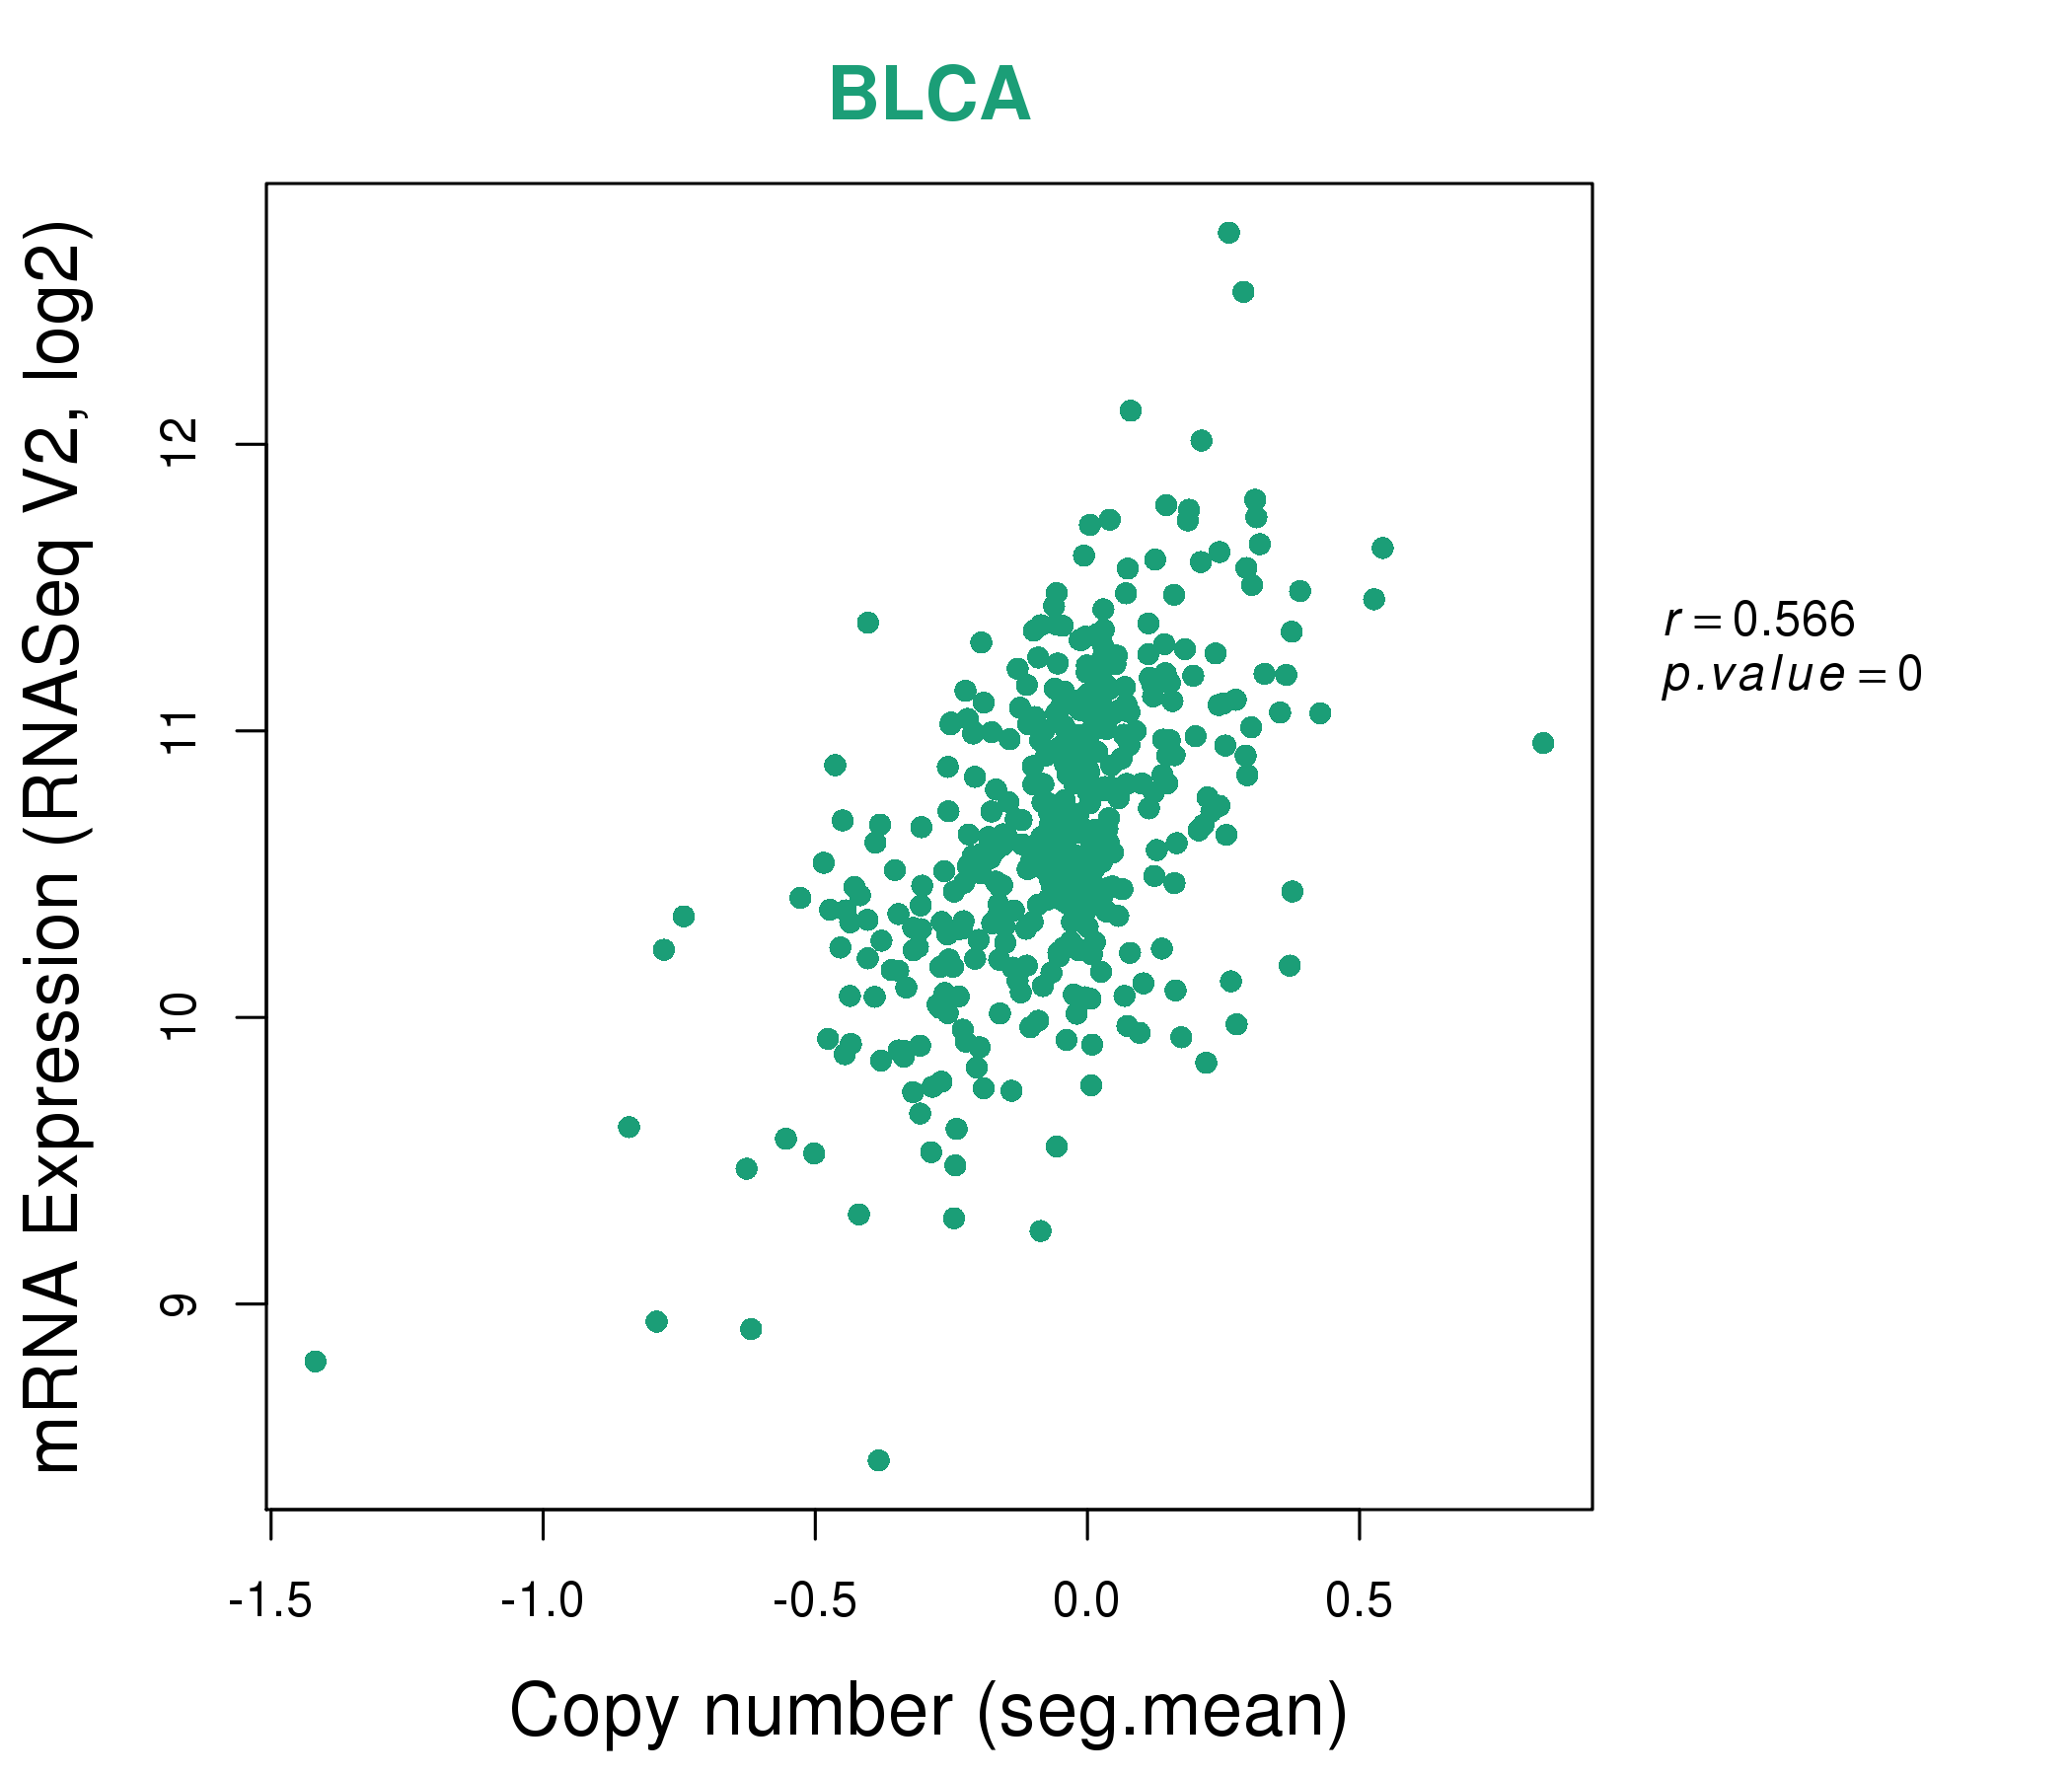
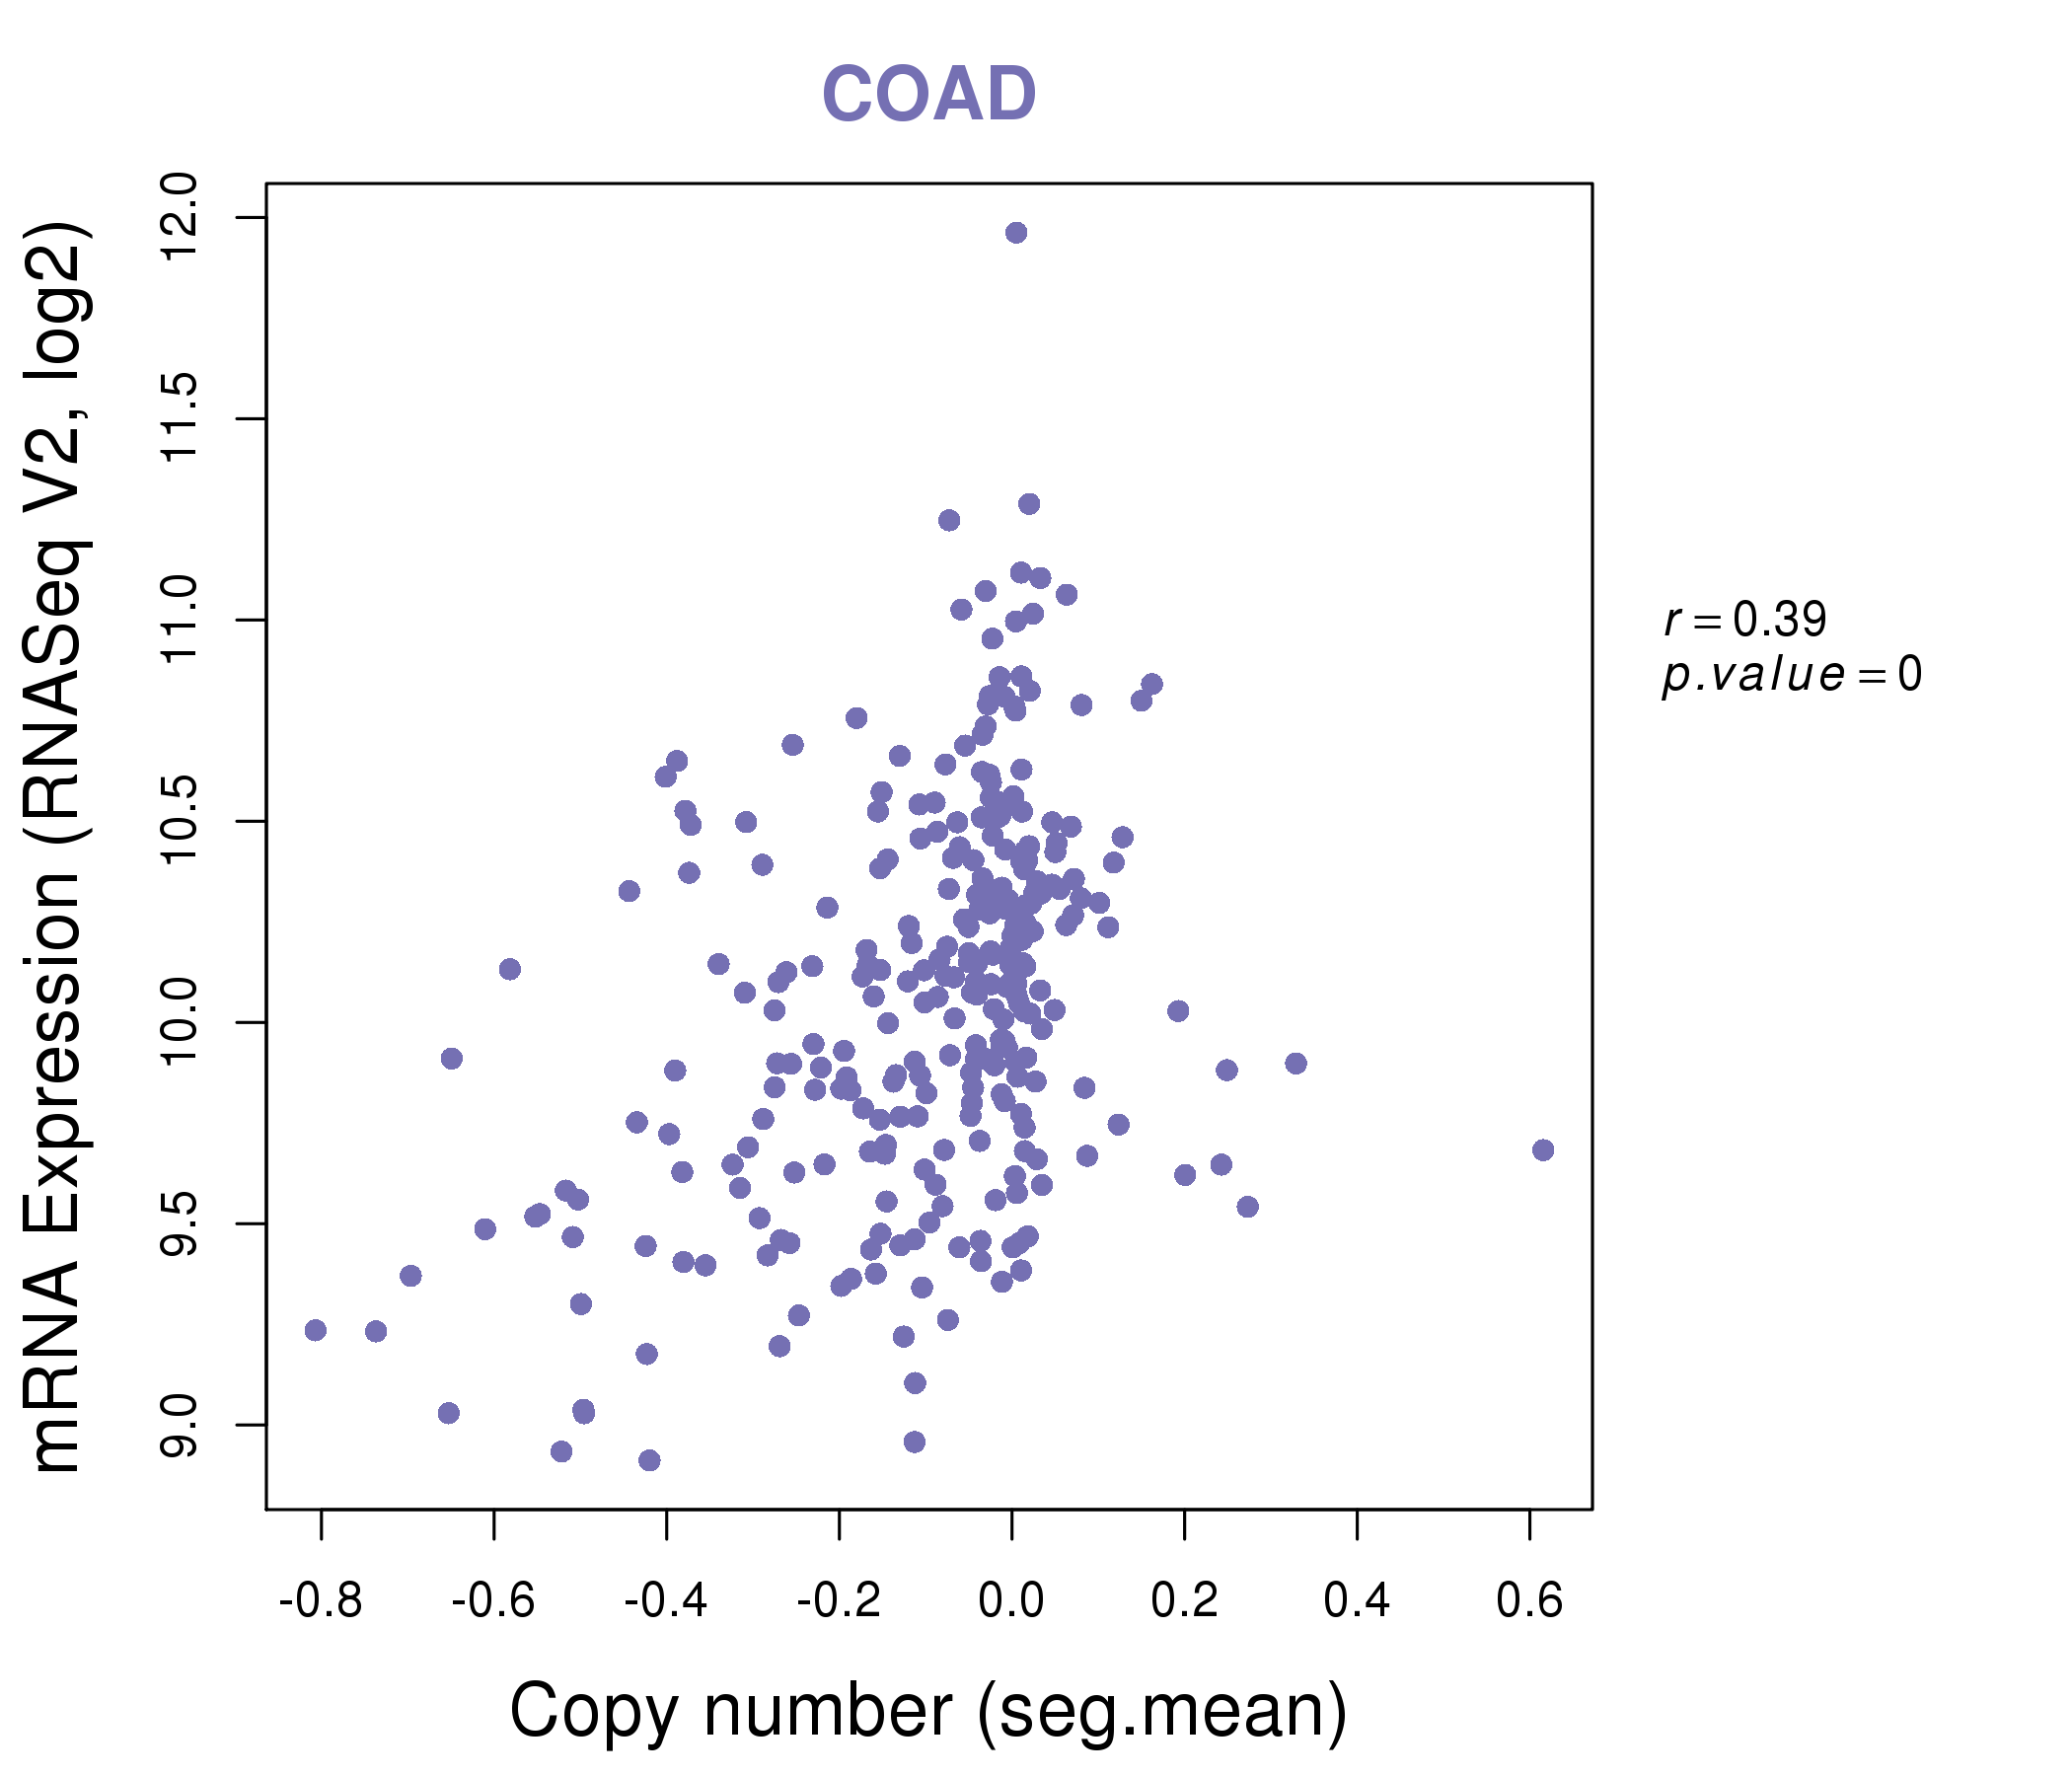
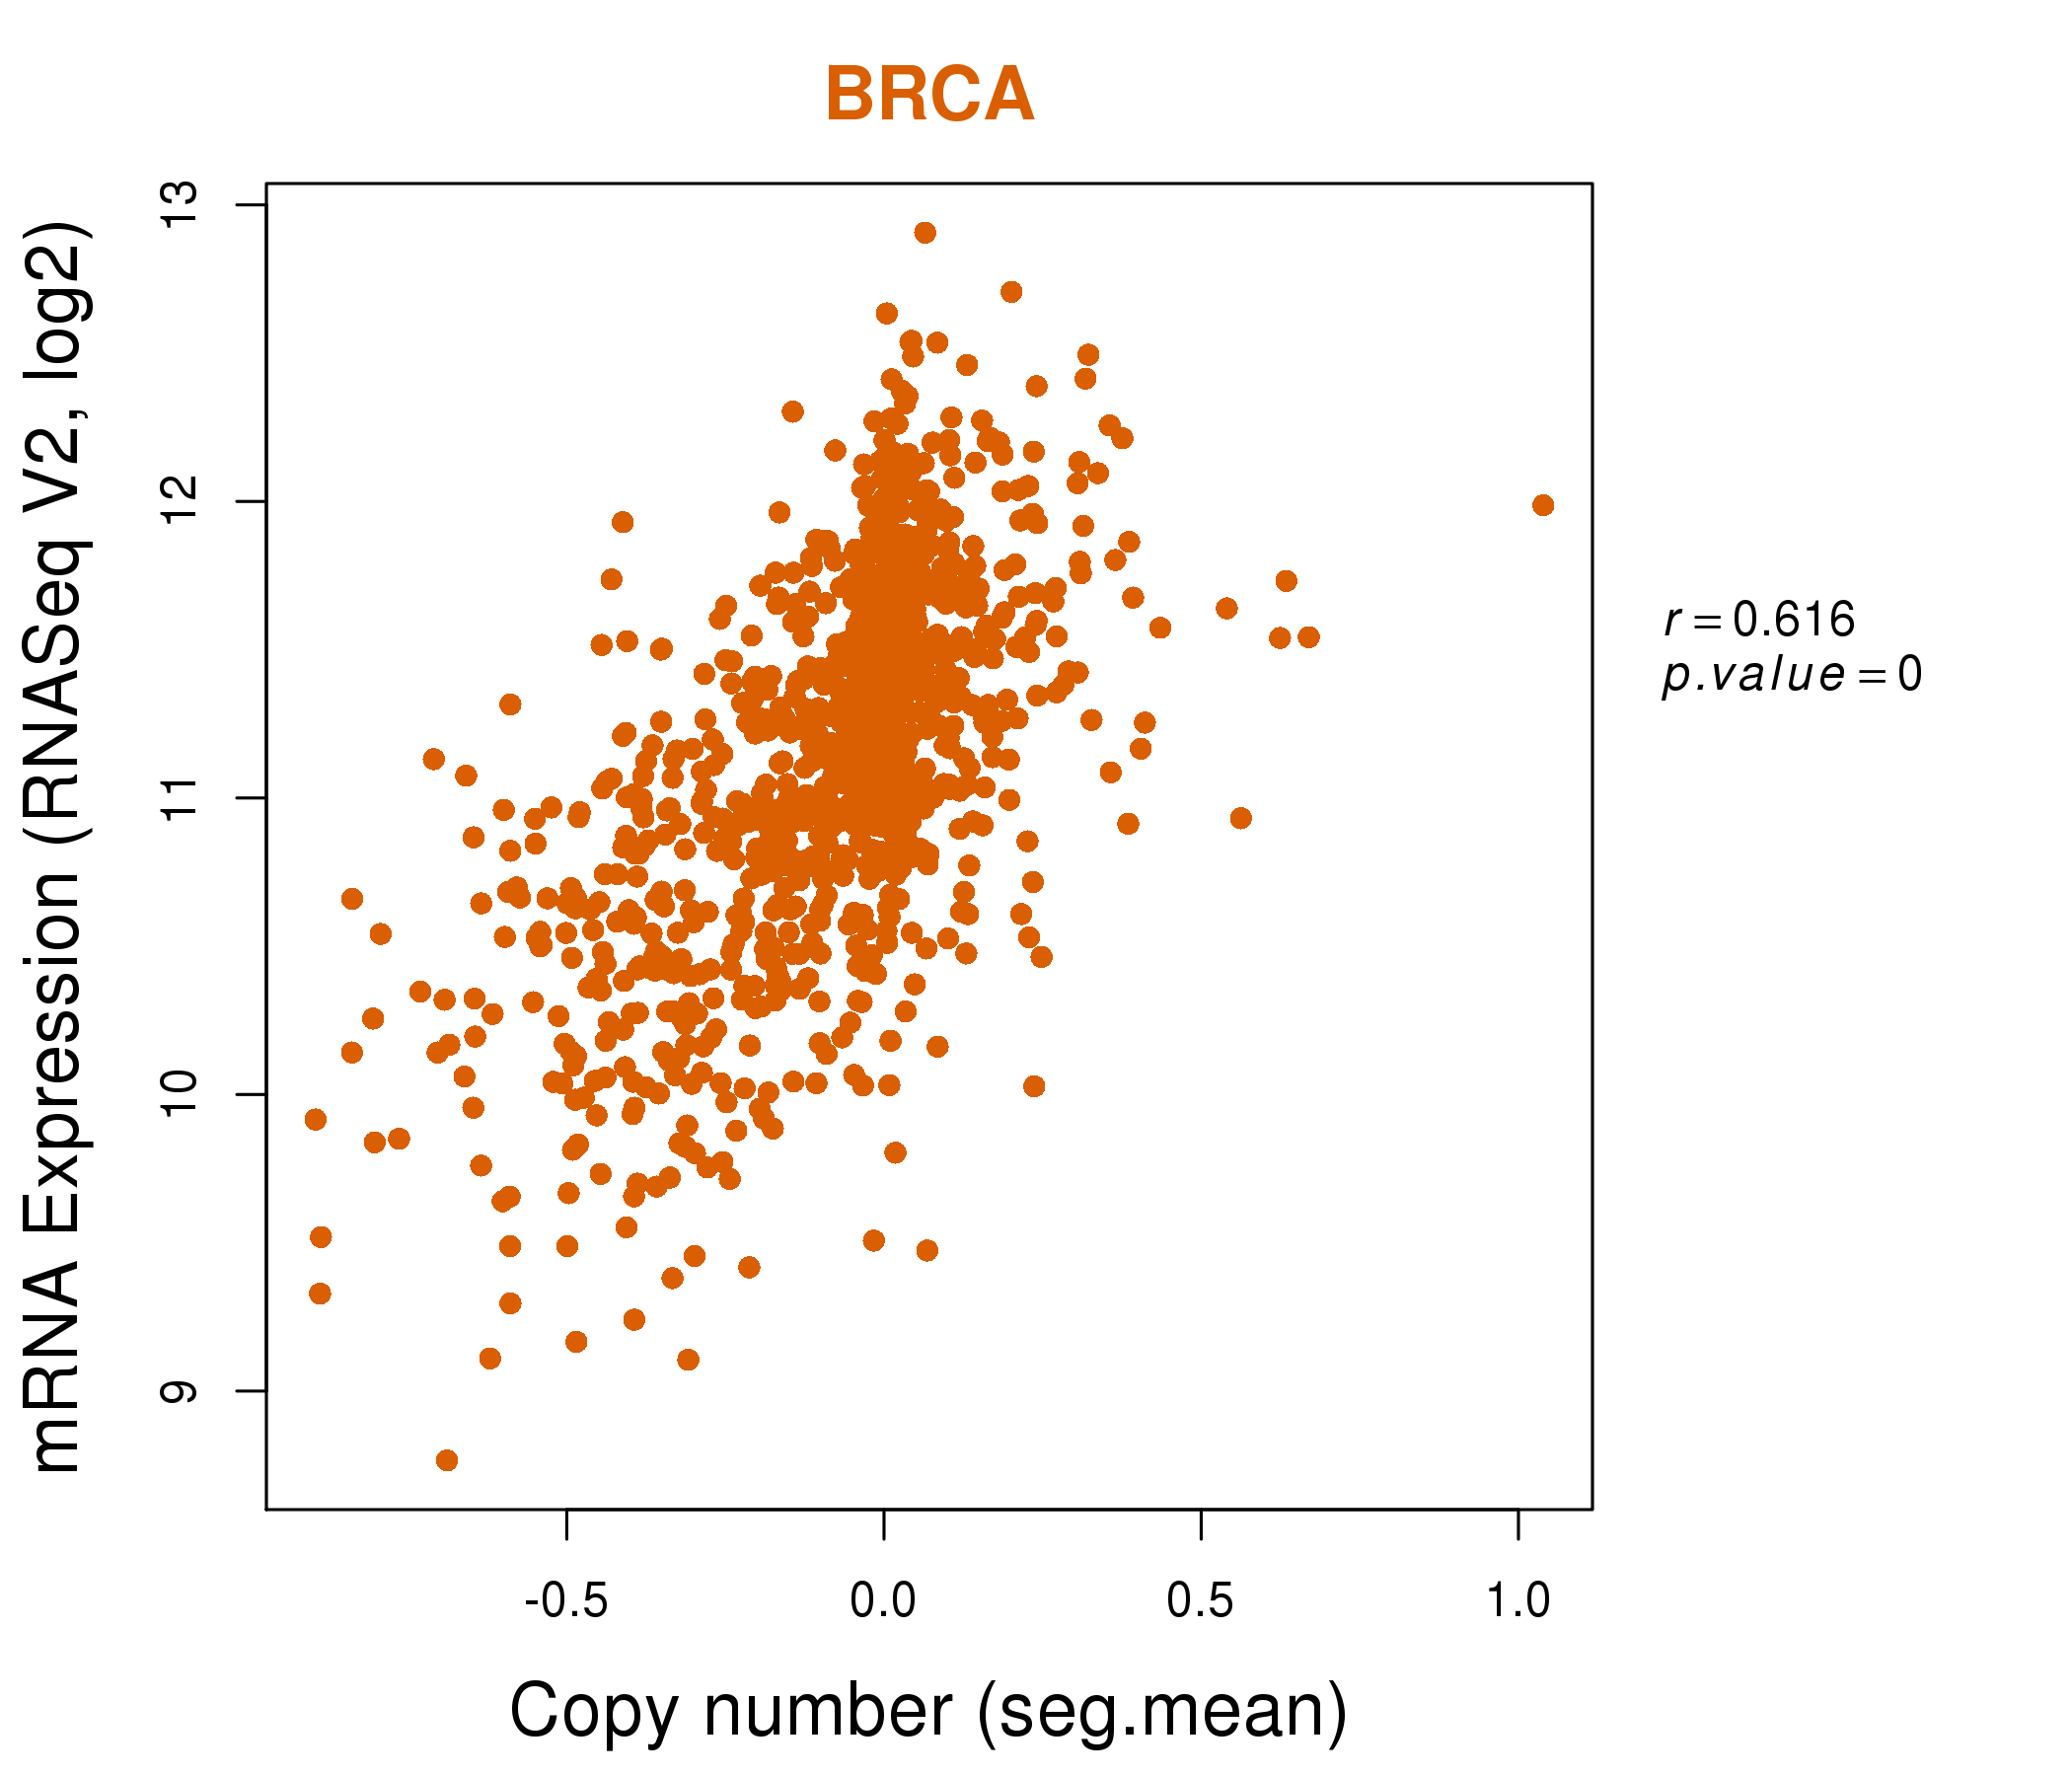
| * This plots show the correlation between CNV and gene expression. |
: Open all plots for all cancer types
 |
|
 |
|
| Top |
| Gene-Gene Network Information |
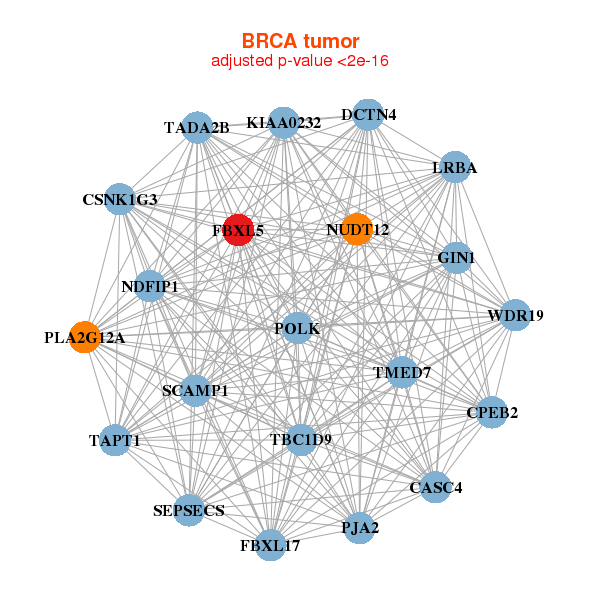
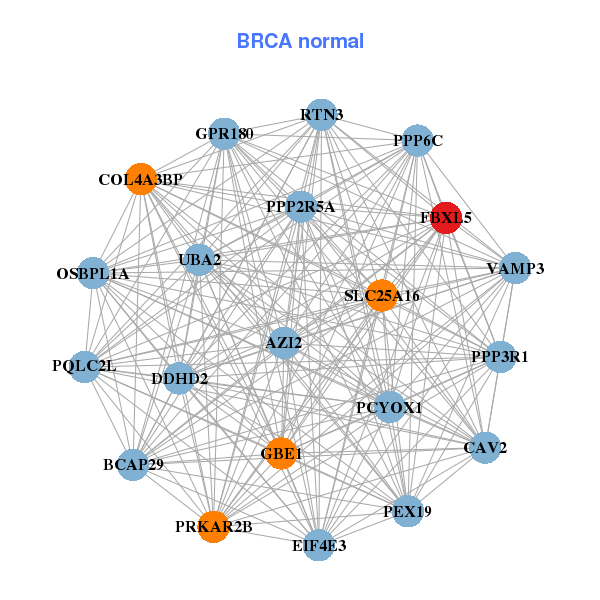
| * Co-Expression network figures were drawn using R package igraph. Only the top 20 genes with the highest correlations were shown. Red circle: input gene, orange circle: cell metabolism gene, sky circle: other gene |
: Open all plots for all cancer types
 |
|
| CASC4,CPEB2,CSNK1G3,DCTN4,FBXL17,FBXL5,GIN1, KIAA0232,LRBA,NDFIP1,NUDT12,PJA2,PLA2G12A,POLK, SCAMP1,SEPSECS,TADA2B,TAPT1,TBC1D9,TMED7,WDR19 | AZI2,BCAP29,PQLC2L,CAV2,COL4A3BP,DDHD2,EIF4E3, FBXL5,GBE1,GPR180,OSBPL1A,PCYOX1,PEX19,PPP2R5A, PPP3R1,PPP6C,PRKAR2B,RTN3,SLC25A16,UBA2,VAMP3 |
 |
|
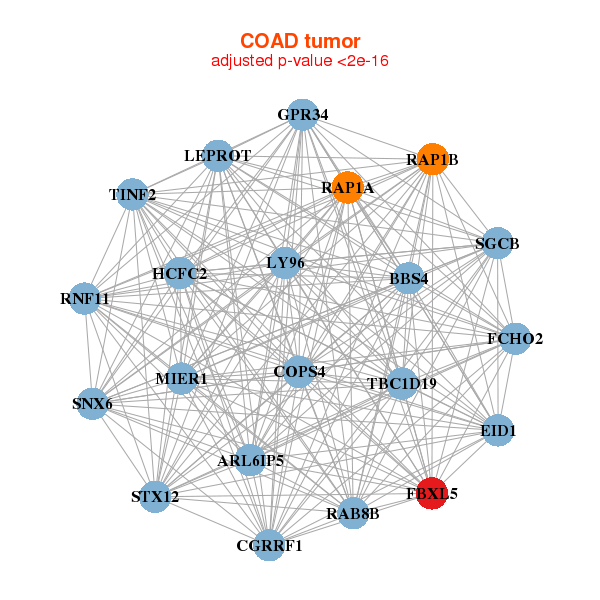
| ARL6IP5,BBS4,CGRRF1,COPS4,EID1,FBXL5,FCHO2, GPR34,HCFC2,LEPROT,LY96,MIER1,RAB8B,RAP1A, RAP1B,RNF11,SGCB,SNX6,STX12,TBC1D19,TINF2 | ARMC1,BTF3L4,FAM204A,C11orf58,BRK1,COPS2,DNAJC8, SMIM11,FBXL5,FUNDC2,MANBAL,PCGF6,PCNP,PFDN1, RWDD1,SNAPIN,SNX3,TCEAL8,UBE2Q2,ZCRB1,ZNF32 |

| * Co-Expression network figures were drawn using R package igraph. Only the top 20 genes with the highest correlations were shown. Red circle: input gene, orange circle: cell metabolism gene, sky circle: other gene |
: Open all plots for all cancer types
| Top |
: Open all interacting genes' information including KEGG pathway for all interacting genes from DAVID
| Top |
| Pharmacological Information for FBXL5 |
| There's no related Drug. |
| Top |
| Cross referenced IDs for FBXL5 |
| * We obtained these cross-references from Uniprot database. It covers 150 different DBs, 18 categories. http://www.uniprot.org/help/cross_references_section |
: Open all cross reference information
|
Copyright © 2016-Present - The Univsersity of Texas Health Science Center at Houston @ |