|
|||||||||||||||||||||||||||||||||||||||||||||||||||||||||||||||||||||||||||||||||||||||||||||||||||||||||||||||||||||||||||||||||||||||||||||||||||||||||||||||||||||||||||||||||||||||||||||||||||||||||||||||||||||||||||||||||||||||||||||||||||||||||||||||||||||||||||||||||||||||||||||||||||||||||||||||||||||||||||||||||||||||||||||||||||||||||||||||||||||||||||||||||||||||
| |
| Phenotypic Information (metabolism pathway, cancer, disease, phenome) |
| |
| |
| Gene-Gene Network Information: Co-Expression Network, Interacting Genes & KEGG |
| |
|


| Gene Summary for GATM |
| Top |
| Phenotypic Information for GATM(metabolism pathway, cancer, disease, phenome) |
| Cancer | CGAP: GATM |
| Familial Cancer Database: GATM | |
| * This gene is included in those cancer gene databases. |
|
|
|
|
|
| . | |||||||||||||||||||||||||||||||||||||||||||||||||||||||||||||||||||||||||||||||||||||||||||||||||||||||||||||||||||||||||||||||||||||||||||||||||||||||||||||||||||||||||||||||||||||||||||||||||||||||||||||||||||||||||||||||||||||||||||||||||||||||||||||||||||||||||||||||||||||||||||||||||||||||||||||||||||||||||||||||||||||||||||||||||||||||||||||||||||||||||||||||||
Oncogene 1 | Significant driver gene in | ||||||||||||||||||||||||||||||||||||||||||||||||||||||||||||||||||||||||||||||||||||||||||||||||||||||||||||||||||||||||||||||||||||||||||||||||||||||||||||||||||||||||||||||||||||||||||||||||||||||||||||||||||||||||||||||||||||||||||||||||||||||||||||||||||||||||||||||||||||||||||||||||||||||||||||||||||||||||||||||||||||||||||||||||||||||||||||||||||||||||||||||||||||||
| cf) number; DB name 1 Oncogene; http://nar.oxfordjournals.org/content/35/suppl_1/D721.long, 2 Tumor Suppressor gene; https://bioinfo.uth.edu/TSGene/, 3 Cancer Gene Census; http://www.nature.com/nrc/journal/v4/n3/abs/nrc1299.html, 4 CancerGenes; http://nar.oxfordjournals.org/content/35/suppl_1/D721.long, 5 Network of Cancer Gene; http://ncg.kcl.ac.uk/index.php, 1Therapeutic Vulnerabilities in Cancer; http://cbio.mskcc.org/cancergenomics/statius/ |
| KEGG_GLYCINE_SERINE_AND_THREONINE_METABOLISM KEGG_ARGININE_AND_PROLINE_METABOLISM REACTOME_METABOLISM_OF_AMINO_ACIDS_AND_DERIVATIVES | |
| OMIM | |
| Orphanet | |
| Disease | KEGG Disease: GATM |
| MedGen: GATM (Human Medical Genetics with Condition) | |
| ClinVar: GATM | |
| Phenotype | MGI: GATM (International Mouse Phenotyping Consortium) |
| PhenomicDB: GATM | |
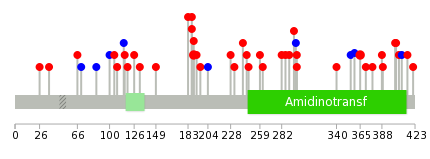
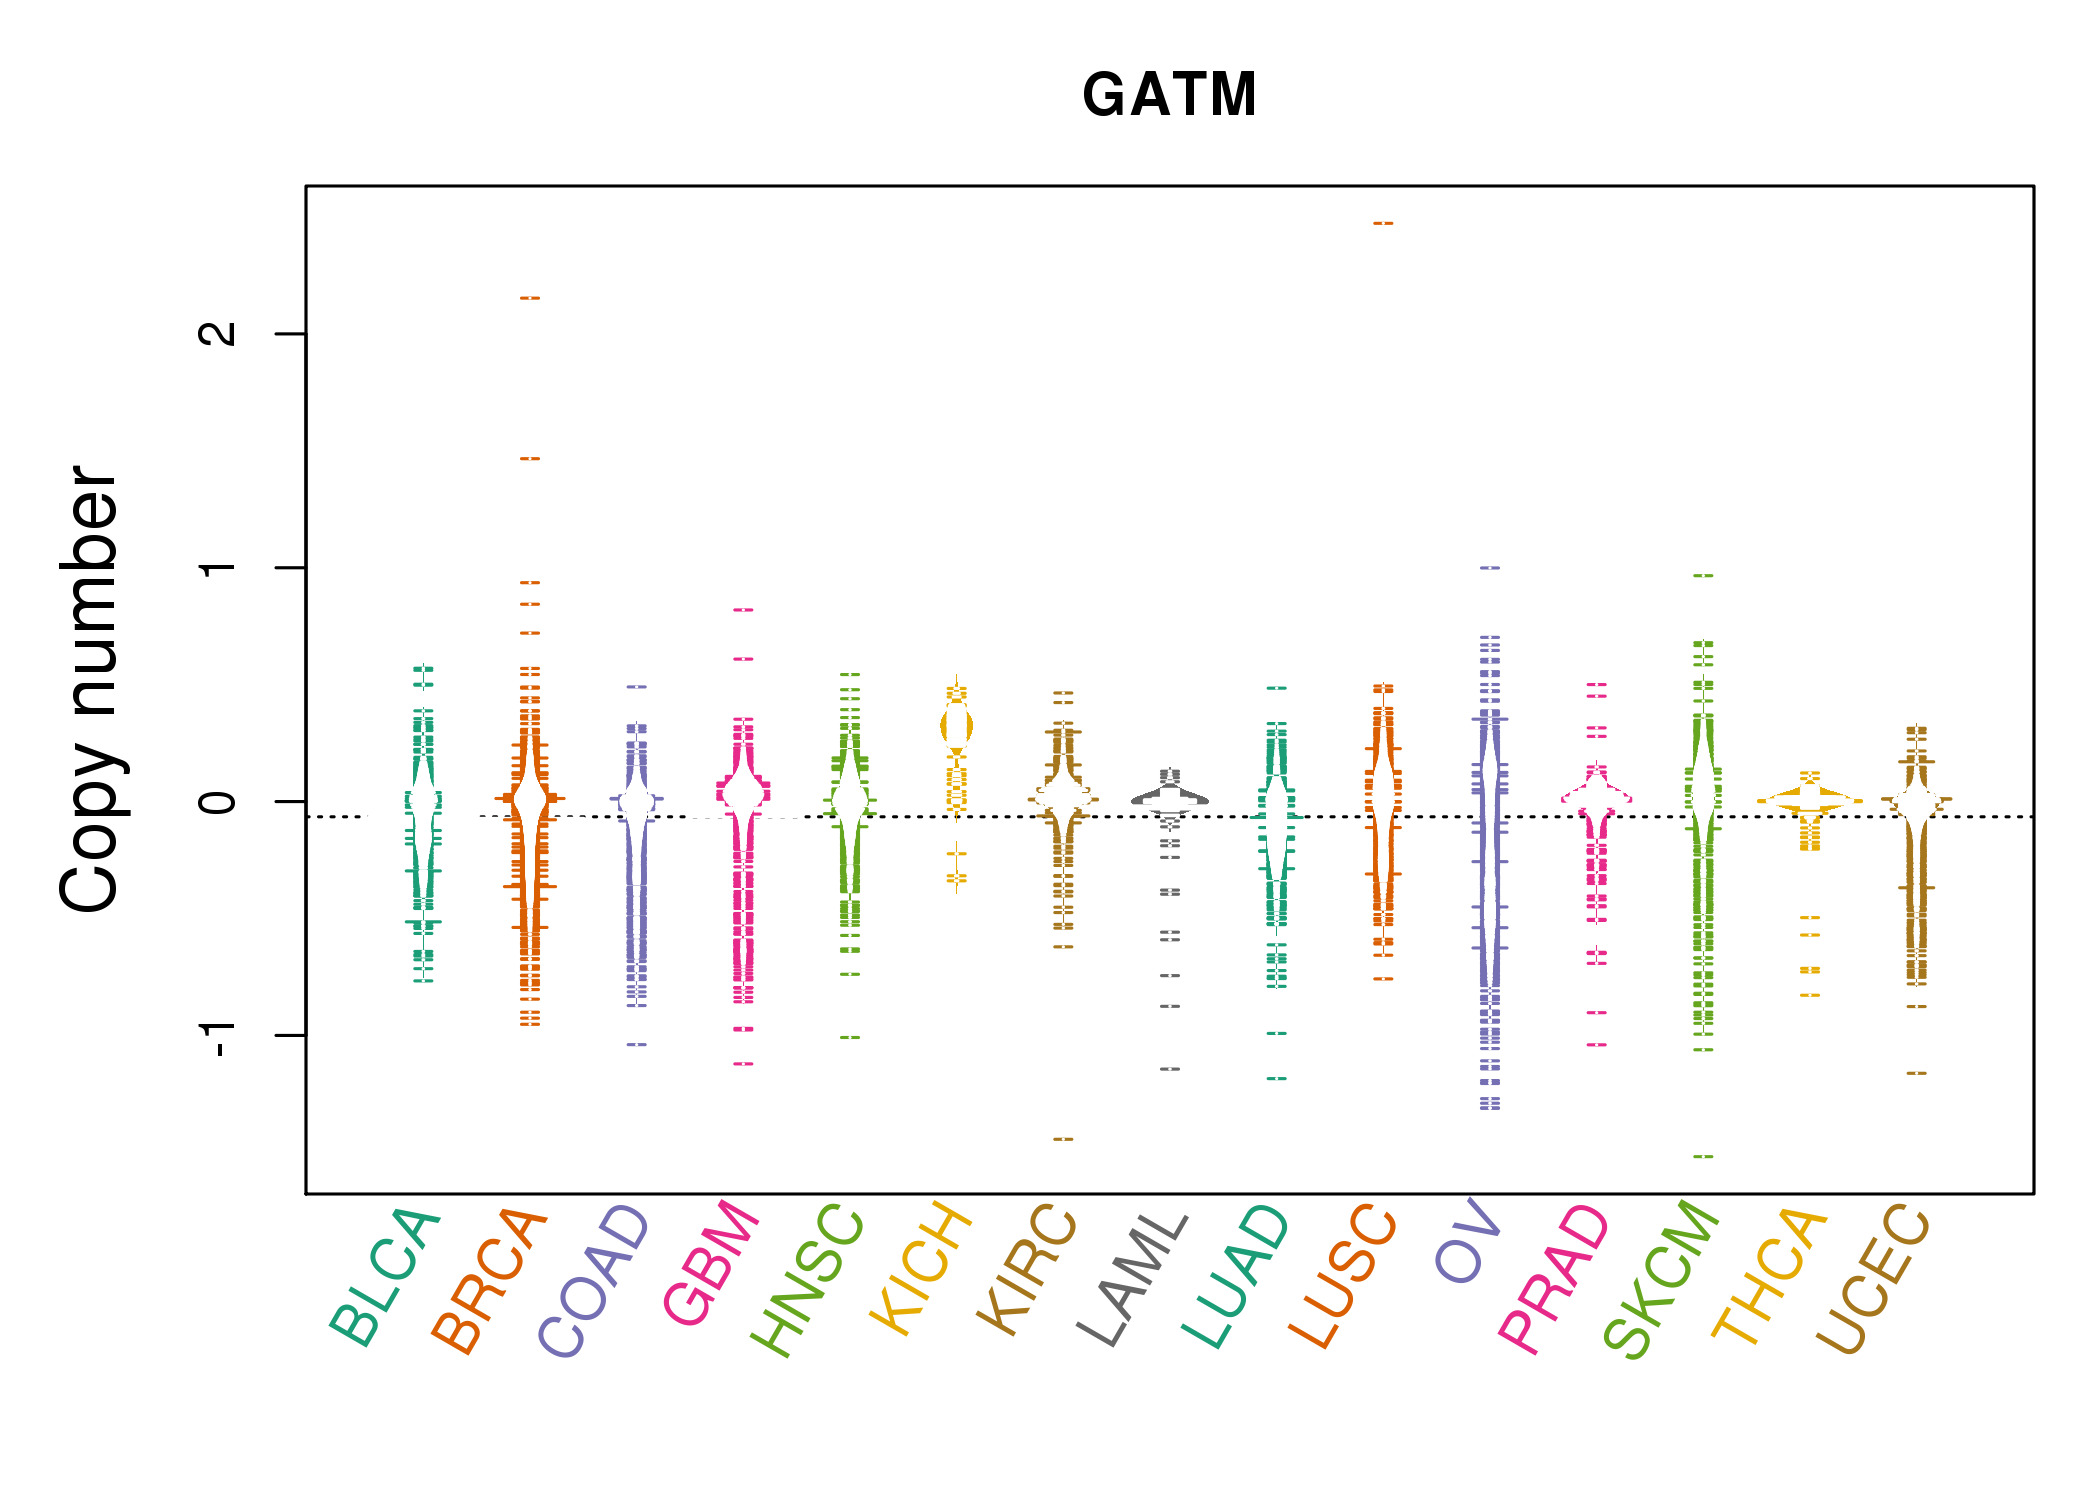
| Mutations for GATM |
| * Under tables are showing count per each tissue to give us broad intuition about tissue specific mutation patterns.You can go to the detailed page for each mutation database's web site. |
| There's no structural variation information in COSMIC data for this gene. |
| * From mRNA Sanger sequences, Chitars2.0 arranged chimeric transcripts. This table shows GATM related fusion information. |
| ID | Head Gene | Tail Gene | Accession | Gene_a | qStart_a | qEnd_a | Chromosome_a | tStart_a | tEnd_a | Gene_a | qStart_a | qEnd_a | Chromosome_a | tStart_a | tEnd_a |
| BF933512 | GATM | 4 | 194 | 15 | 45656269 | 45656463 | DDX3X | 187 | 379 | X | 41197147 | 41197339 | |
| AW861199 | WSB1 | 11 | 190 | 17 | 25630423 | 25630602 | GATM | 177 | 196 | 15 | 45657895 | 45657914 | |
| BF946024 | GATM | 14 | 316 | 15 | 45653805 | 45654108 | TSEN2 | 300 | 319 | 3 | 12560544 | 12560563 | |
| Top |
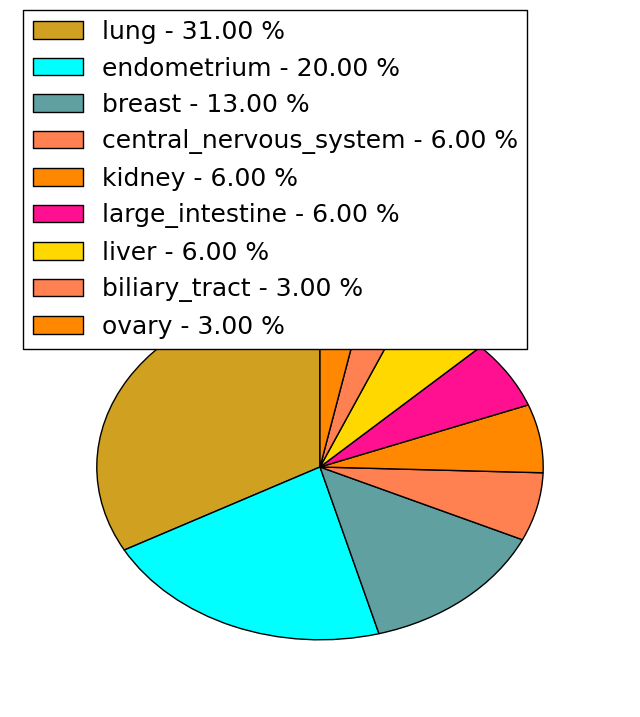
| Mutation type/ Tissue ID | brca | cns | cerv | endome | haematopo | kidn | Lintest | liver | lung | ns | ovary | pancre | prost | skin | stoma | thyro | urina | |||
| Total # sample | 1 | |||||||||||||||||||
| GAIN (# sample) | ||||||||||||||||||||
| LOSS (# sample) | 1 |
| cf) Tissue ID; Tissue type (1; Breast, 2; Central_nervous_system, 3; Cervix, 4; Endometrium, 5; Haematopoietic_and_lymphoid_tissue, 6; Kidney, 7; Large_intestine, 8; Liver, 9; Lung, 10; NS, 11; Ovary, 12; Pancreas, 13; Prostate, 14; Skin, 15; Stomach, 16; Thyroid, 17; Urinary_tract) |
| Top |
|
 |
| Top |
| Stat. for Non-Synonymous SNVs (# total SNVs=29) | (# total SNVs=5) |
 |  |
(# total SNVs=0) | (# total SNVs=0) |
| Top |
| * When you move the cursor on each content, you can see more deailed mutation information on the Tooltip. Those are primary_site,primary_histology,mutation(aa),pubmedID. |
| GRCh37 position | Mutation(aa) | Unique sampleID count |
| chr15:45656164-45656164 | p.L365V | 2 |
| chr15:45660378-45660378 | p.R189C | 2 |
| chr15:45658338-45658338 | p.S295F | 1 |
| chr15:45668891-45668891 | p.V66I | 1 |
| chr15:45658700-45658700 | p.P228S | 1 |
| chr15:45656125-45656125 | p.P378S | 1 |
| chr15:45661613-45661613 | p.N132T | 1 |
| chr15:45658353-45658353 | p.R290K | 1 |
| chr15:45668979-45668979 | p.F36L | 1 |
| chr15:45660331-45660331 | p.F204F | 1 |
| Top |
|
 |
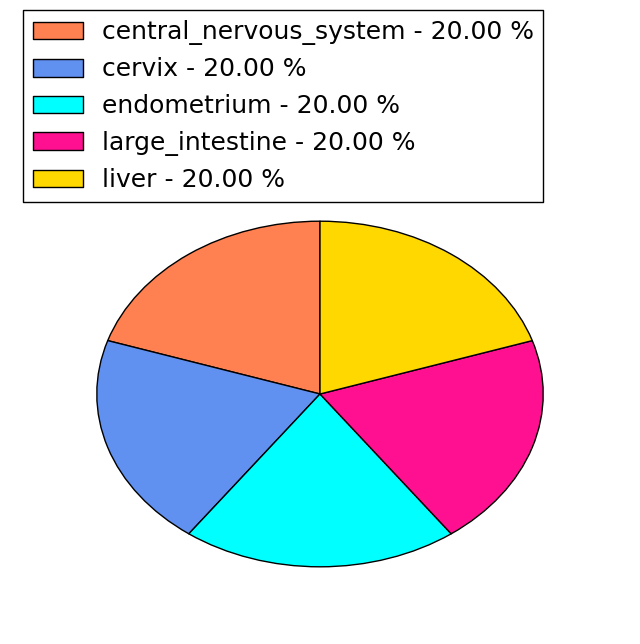
| Point Mutation/ Tissue ID | 1 | 2 | 3 | 4 | 5 | 6 | 7 | 8 | 9 | 10 | 11 | 12 | 13 | 14 | 15 | 16 | 17 | 18 | 19 | 20 |
| # sample | 1 | 4 | 1 | 3 | 2 | 2 | 2 | 6 | 2 | 1 | 5 | 4 | 6 | |||||||
| # mutation | 1 | 4 | 1 | 3 | 2 | 2 | 2 | 6 | 2 | 1 | 6 | 4 | 6 | |||||||
| nonsynonymous SNV | 1 | 4 | 2 | 2 | 2 | 2 | 6 | 1 | 1 | 4 | 3 | 5 | ||||||||
| synonymous SNV | 1 | 1 | 1 | 2 | 1 | 1 |
| cf) Tissue ID; Tissue type (1; BLCA[Bladder Urothelial Carcinoma], 2; BRCA[Breast invasive carcinoma], 3; CESC[Cervical squamous cell carcinoma and endocervical adenocarcinoma], 4; COAD[Colon adenocarcinoma], 5; GBM[Glioblastoma multiforme], 6; Glioma Low Grade, 7; HNSC[Head and Neck squamous cell carcinoma], 8; KICH[Kidney Chromophobe], 9; KIRC[Kidney renal clear cell carcinoma], 10; KIRP[Kidney renal papillary cell carcinoma], 11; LAML[Acute Myeloid Leukemia], 12; LUAD[Lung adenocarcinoma], 13; LUSC[Lung squamous cell carcinoma], 14; OV[Ovarian serous cystadenocarcinoma ], 15; PAAD[Pancreatic adenocarcinoma], 16; PRAD[Prostate adenocarcinoma], 17; SKCM[Skin Cutaneous Melanoma], 18:STAD[Stomach adenocarcinoma], 19:THCA[Thyroid carcinoma], 20:UCEC[Uterine Corpus Endometrial Carcinoma]) |
| Top |
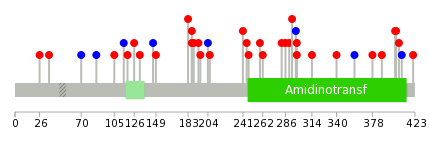
| * We represented just top 10 SNVs. When you move the cursor on each content, you can see more deailed mutation information on the Tooltip. Those are primary_site, primary_histology, mutation(aa), pubmedID. |
| Genomic Position | Mutation(aa) | Unique sampleID count |
| chr15:45658607 | p.D298Y | 1 |
| chr15:45660395 | p.R187L | 1 |
| chr15:45657019 | p.K297K | 1 |
| chr15:45669010 | p.R187C | 1 |
| chr15:45658643 | p.I293V | 1 |
| chr15:45661562 | p.P183L | 1 |
| chr15:45658282 | p.R290K | 1 |
| chr15:45658648 | p.W149L | 1 |
| chr15:45661570 | p.A286S | 1 |
| chr15:45658329 | p.P146P | 1 |
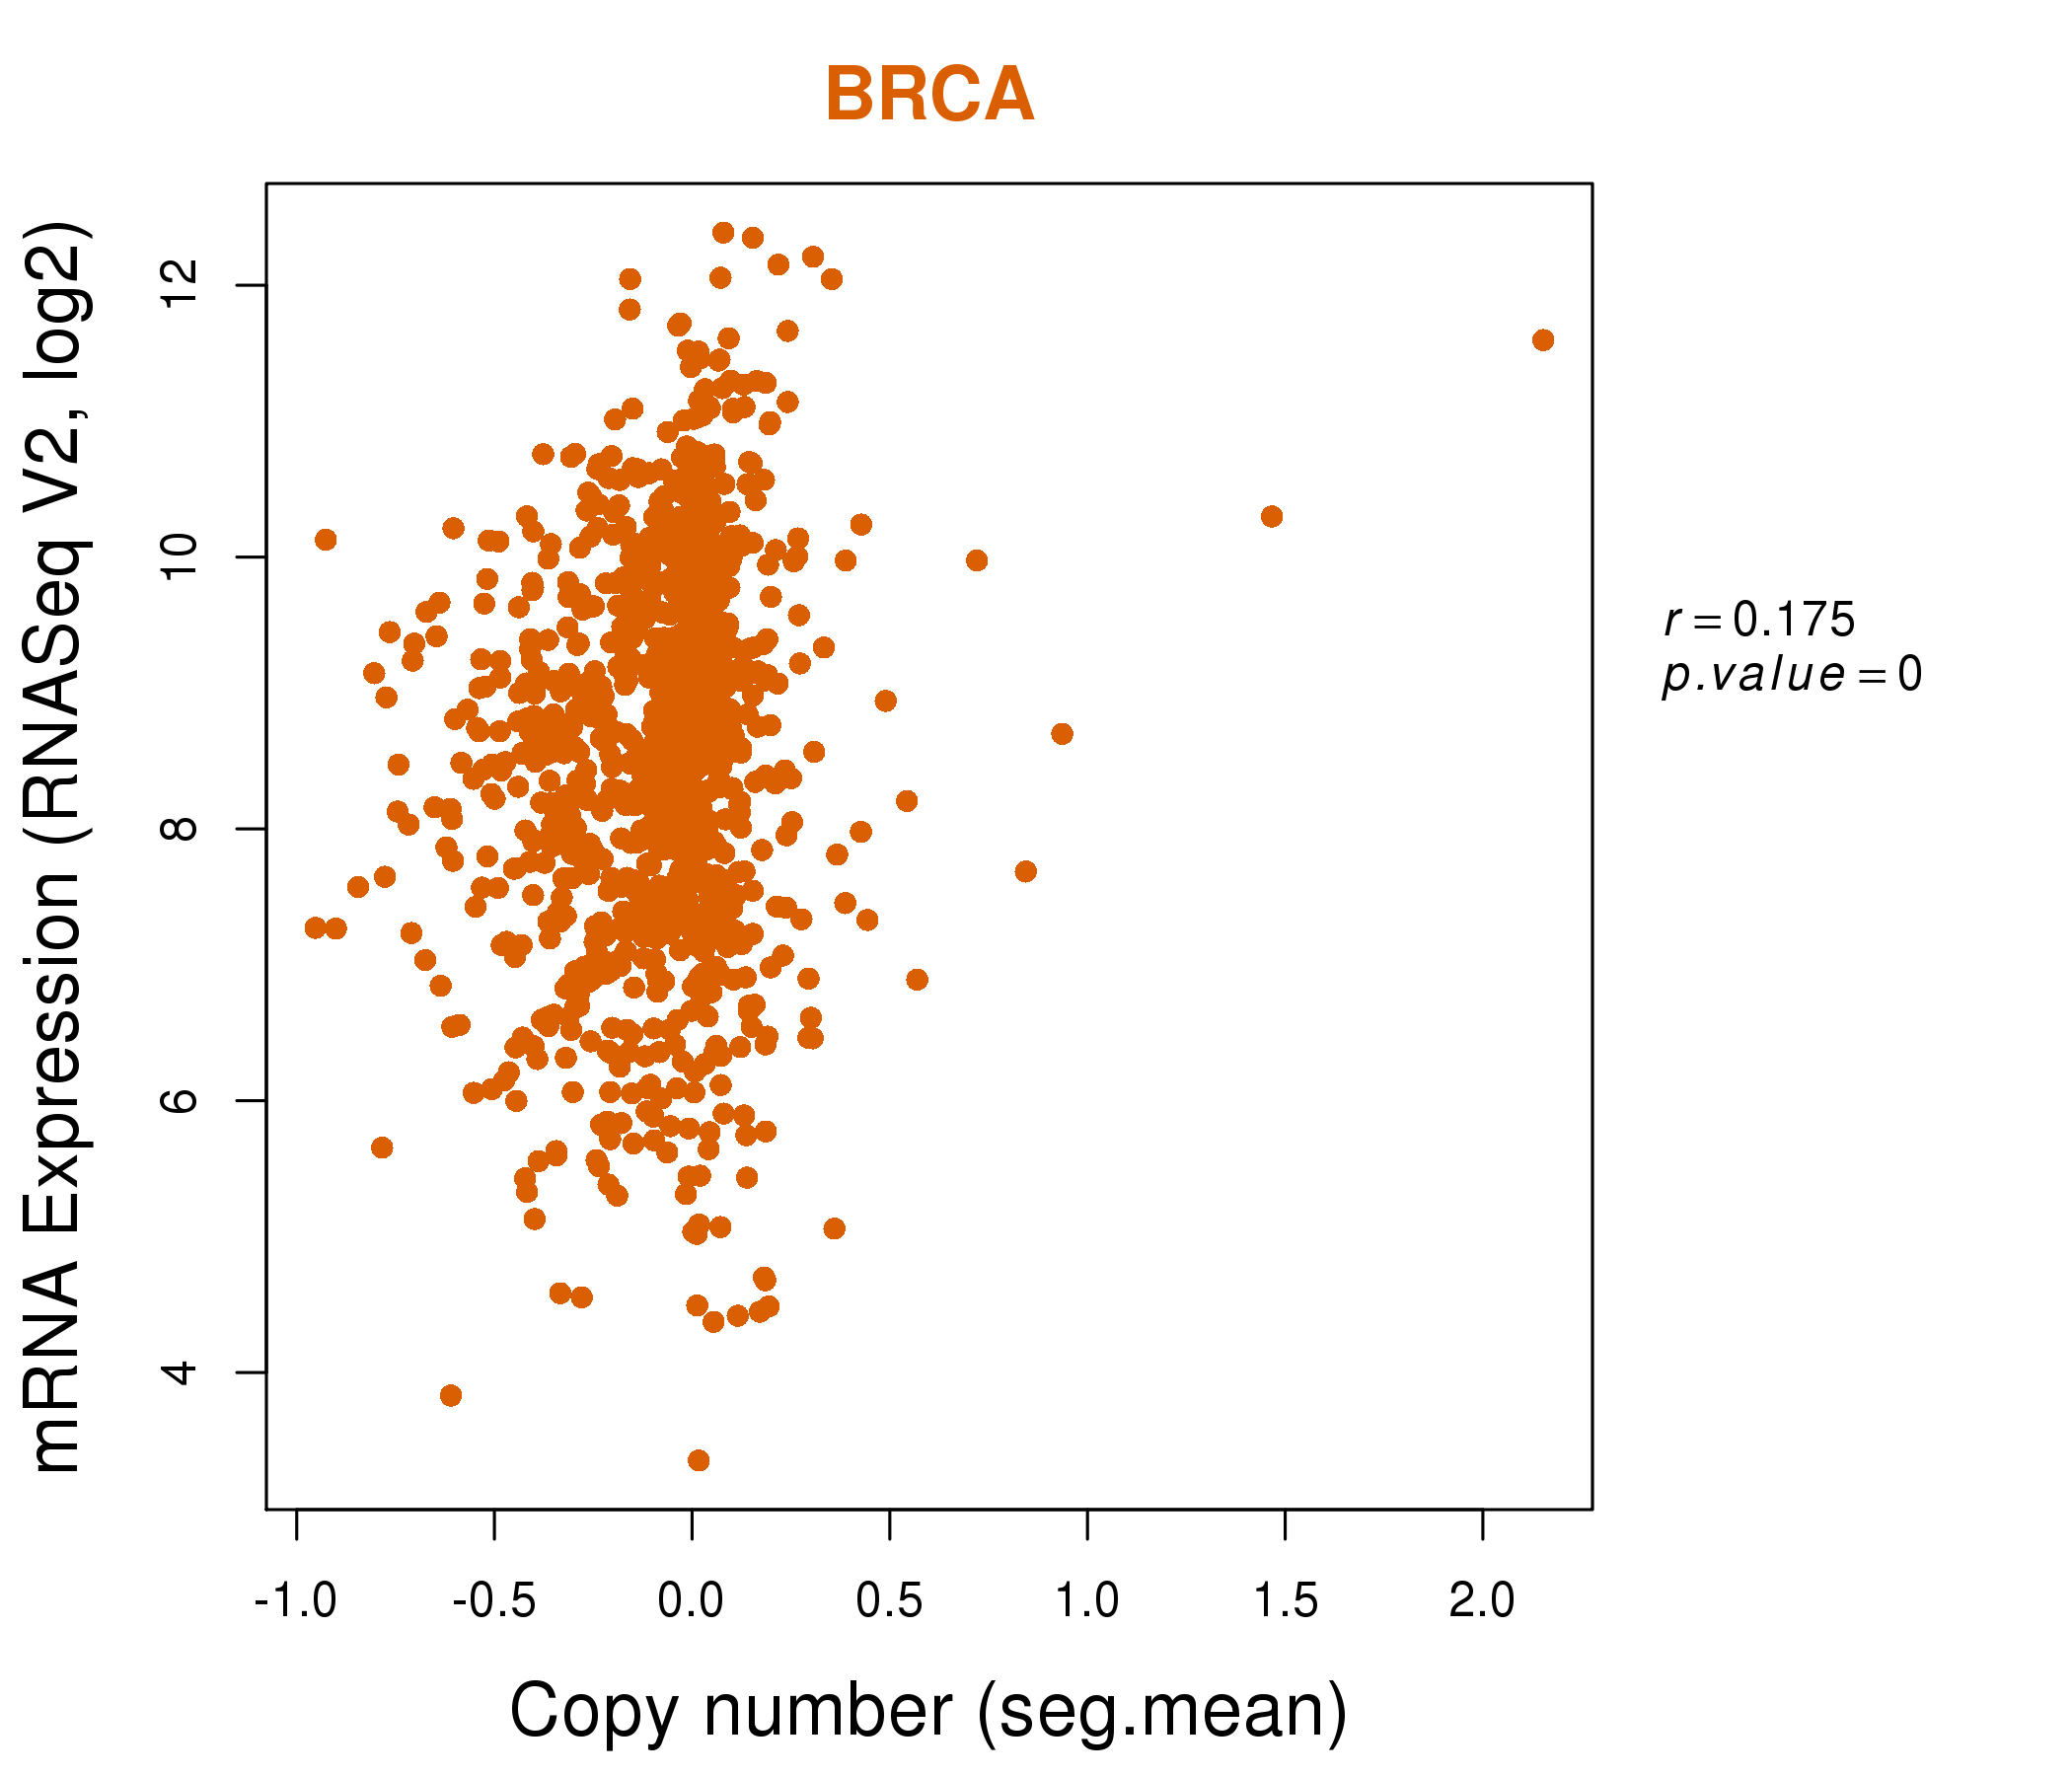
| * Copy number data were extracted from TCGA using R package TCGA-Assembler. The URLs of all public data files on TCGA DCC data server were gathered on Jan-05-2015. Function ProcessCNAData in TCGA-Assembler package was used to obtain gene-level copy number value which is calculated as the average copy number of the genomic region of a gene. |
 |
| cf) Tissue ID[Tissue type]: BLCA[Bladder Urothelial Carcinoma], BRCA[Breast invasive carcinoma], CESC[Cervical squamous cell carcinoma and endocervical adenocarcinoma], COAD[Colon adenocarcinoma], GBM[Glioblastoma multiforme], Glioma Low Grade, HNSC[Head and Neck squamous cell carcinoma], KICH[Kidney Chromophobe], KIRC[Kidney renal clear cell carcinoma], KIRP[Kidney renal papillary cell carcinoma], LAML[Acute Myeloid Leukemia], LUAD[Lung adenocarcinoma], LUSC[Lung squamous cell carcinoma], OV[Ovarian serous cystadenocarcinoma ], PAAD[Pancreatic adenocarcinoma], PRAD[Prostate adenocarcinoma], SKCM[Skin Cutaneous Melanoma], STAD[Stomach adenocarcinoma], THCA[Thyroid carcinoma], UCEC[Uterine Corpus Endometrial Carcinoma] |
| Top |
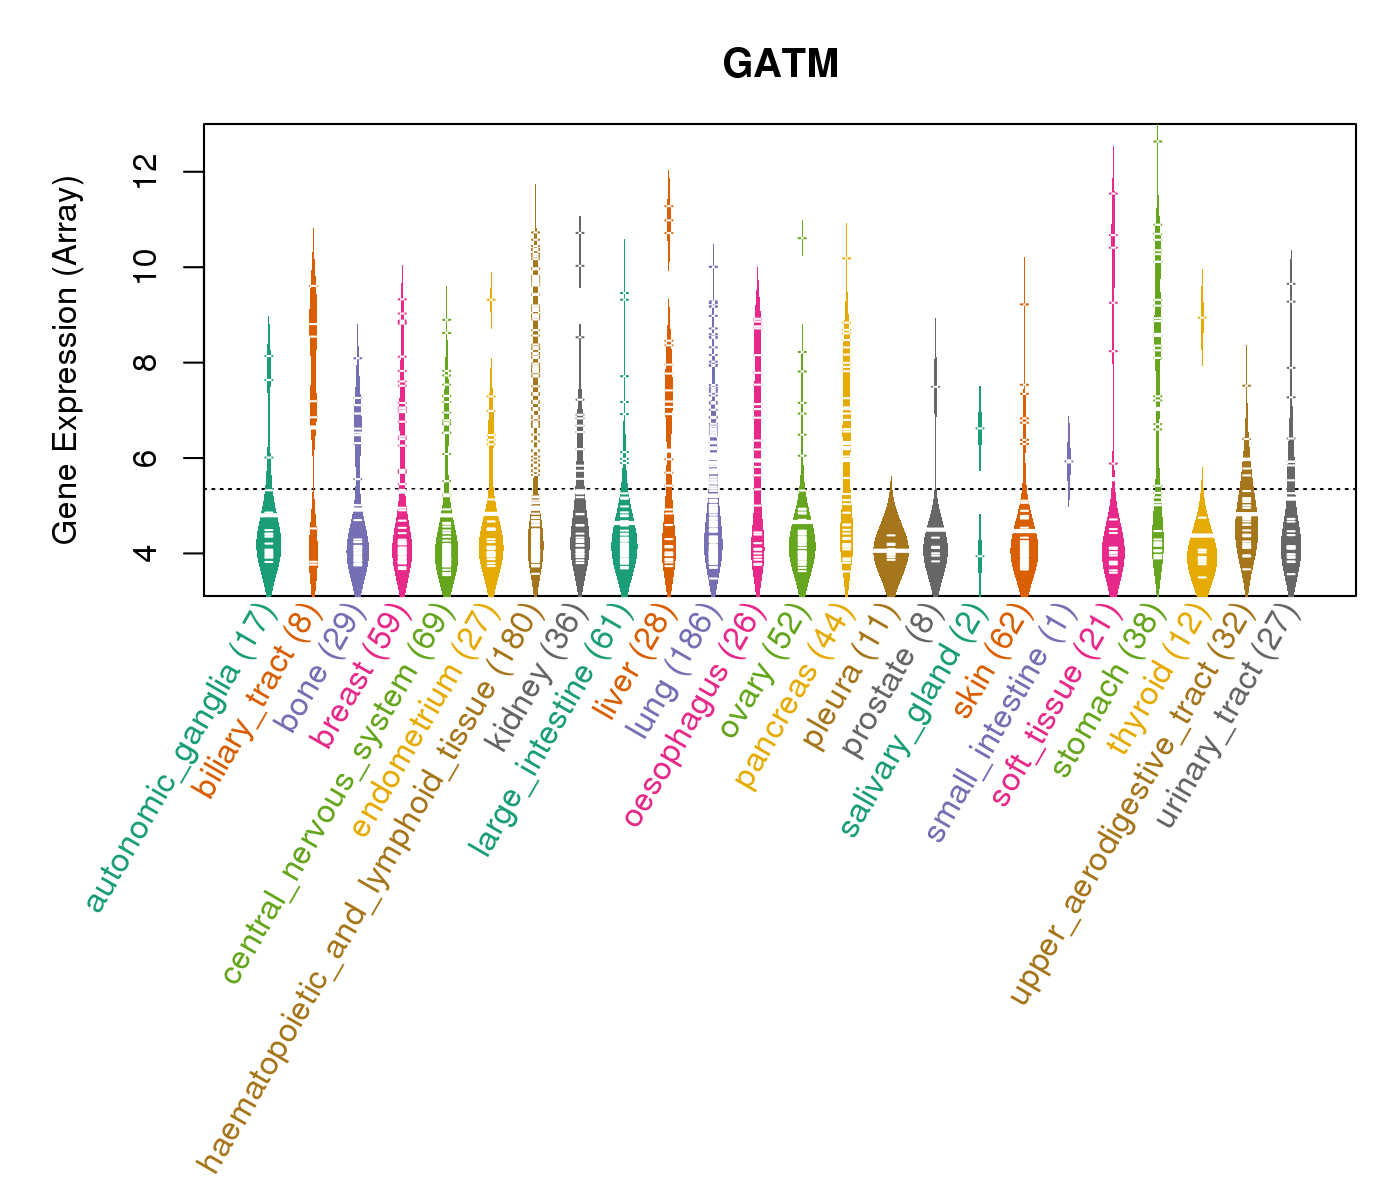
| Gene Expression for GATM |
| * CCLE gene expression data were extracted from CCLE_Expression_Entrez_2012-10-18.res: Gene-centric RMA-normalized mRNA expression data. |
 |
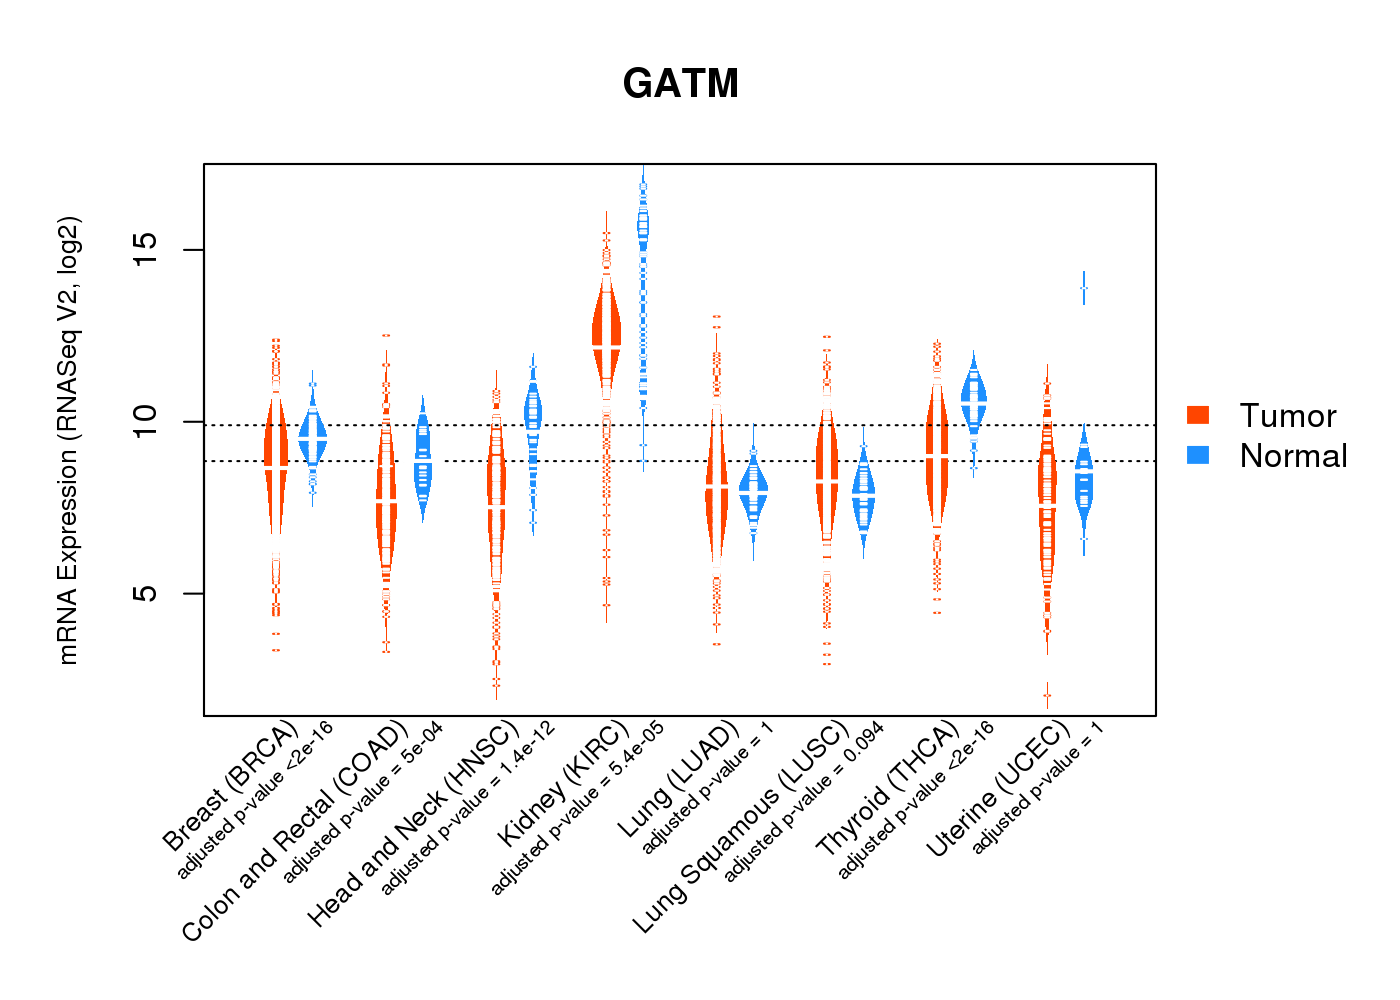
| * Normalized gene expression data of RNASeqV2 was extracted from TCGA using R package TCGA-Assembler. The URLs of all public data files on TCGA DCC data server were gathered at Jan-05-2015. Only eight cancer types have enough normal control samples for differential expression analysis. (t test, adjusted p<0.05 (using Benjamini-Hochberg FDR)) |
 |
| Top |
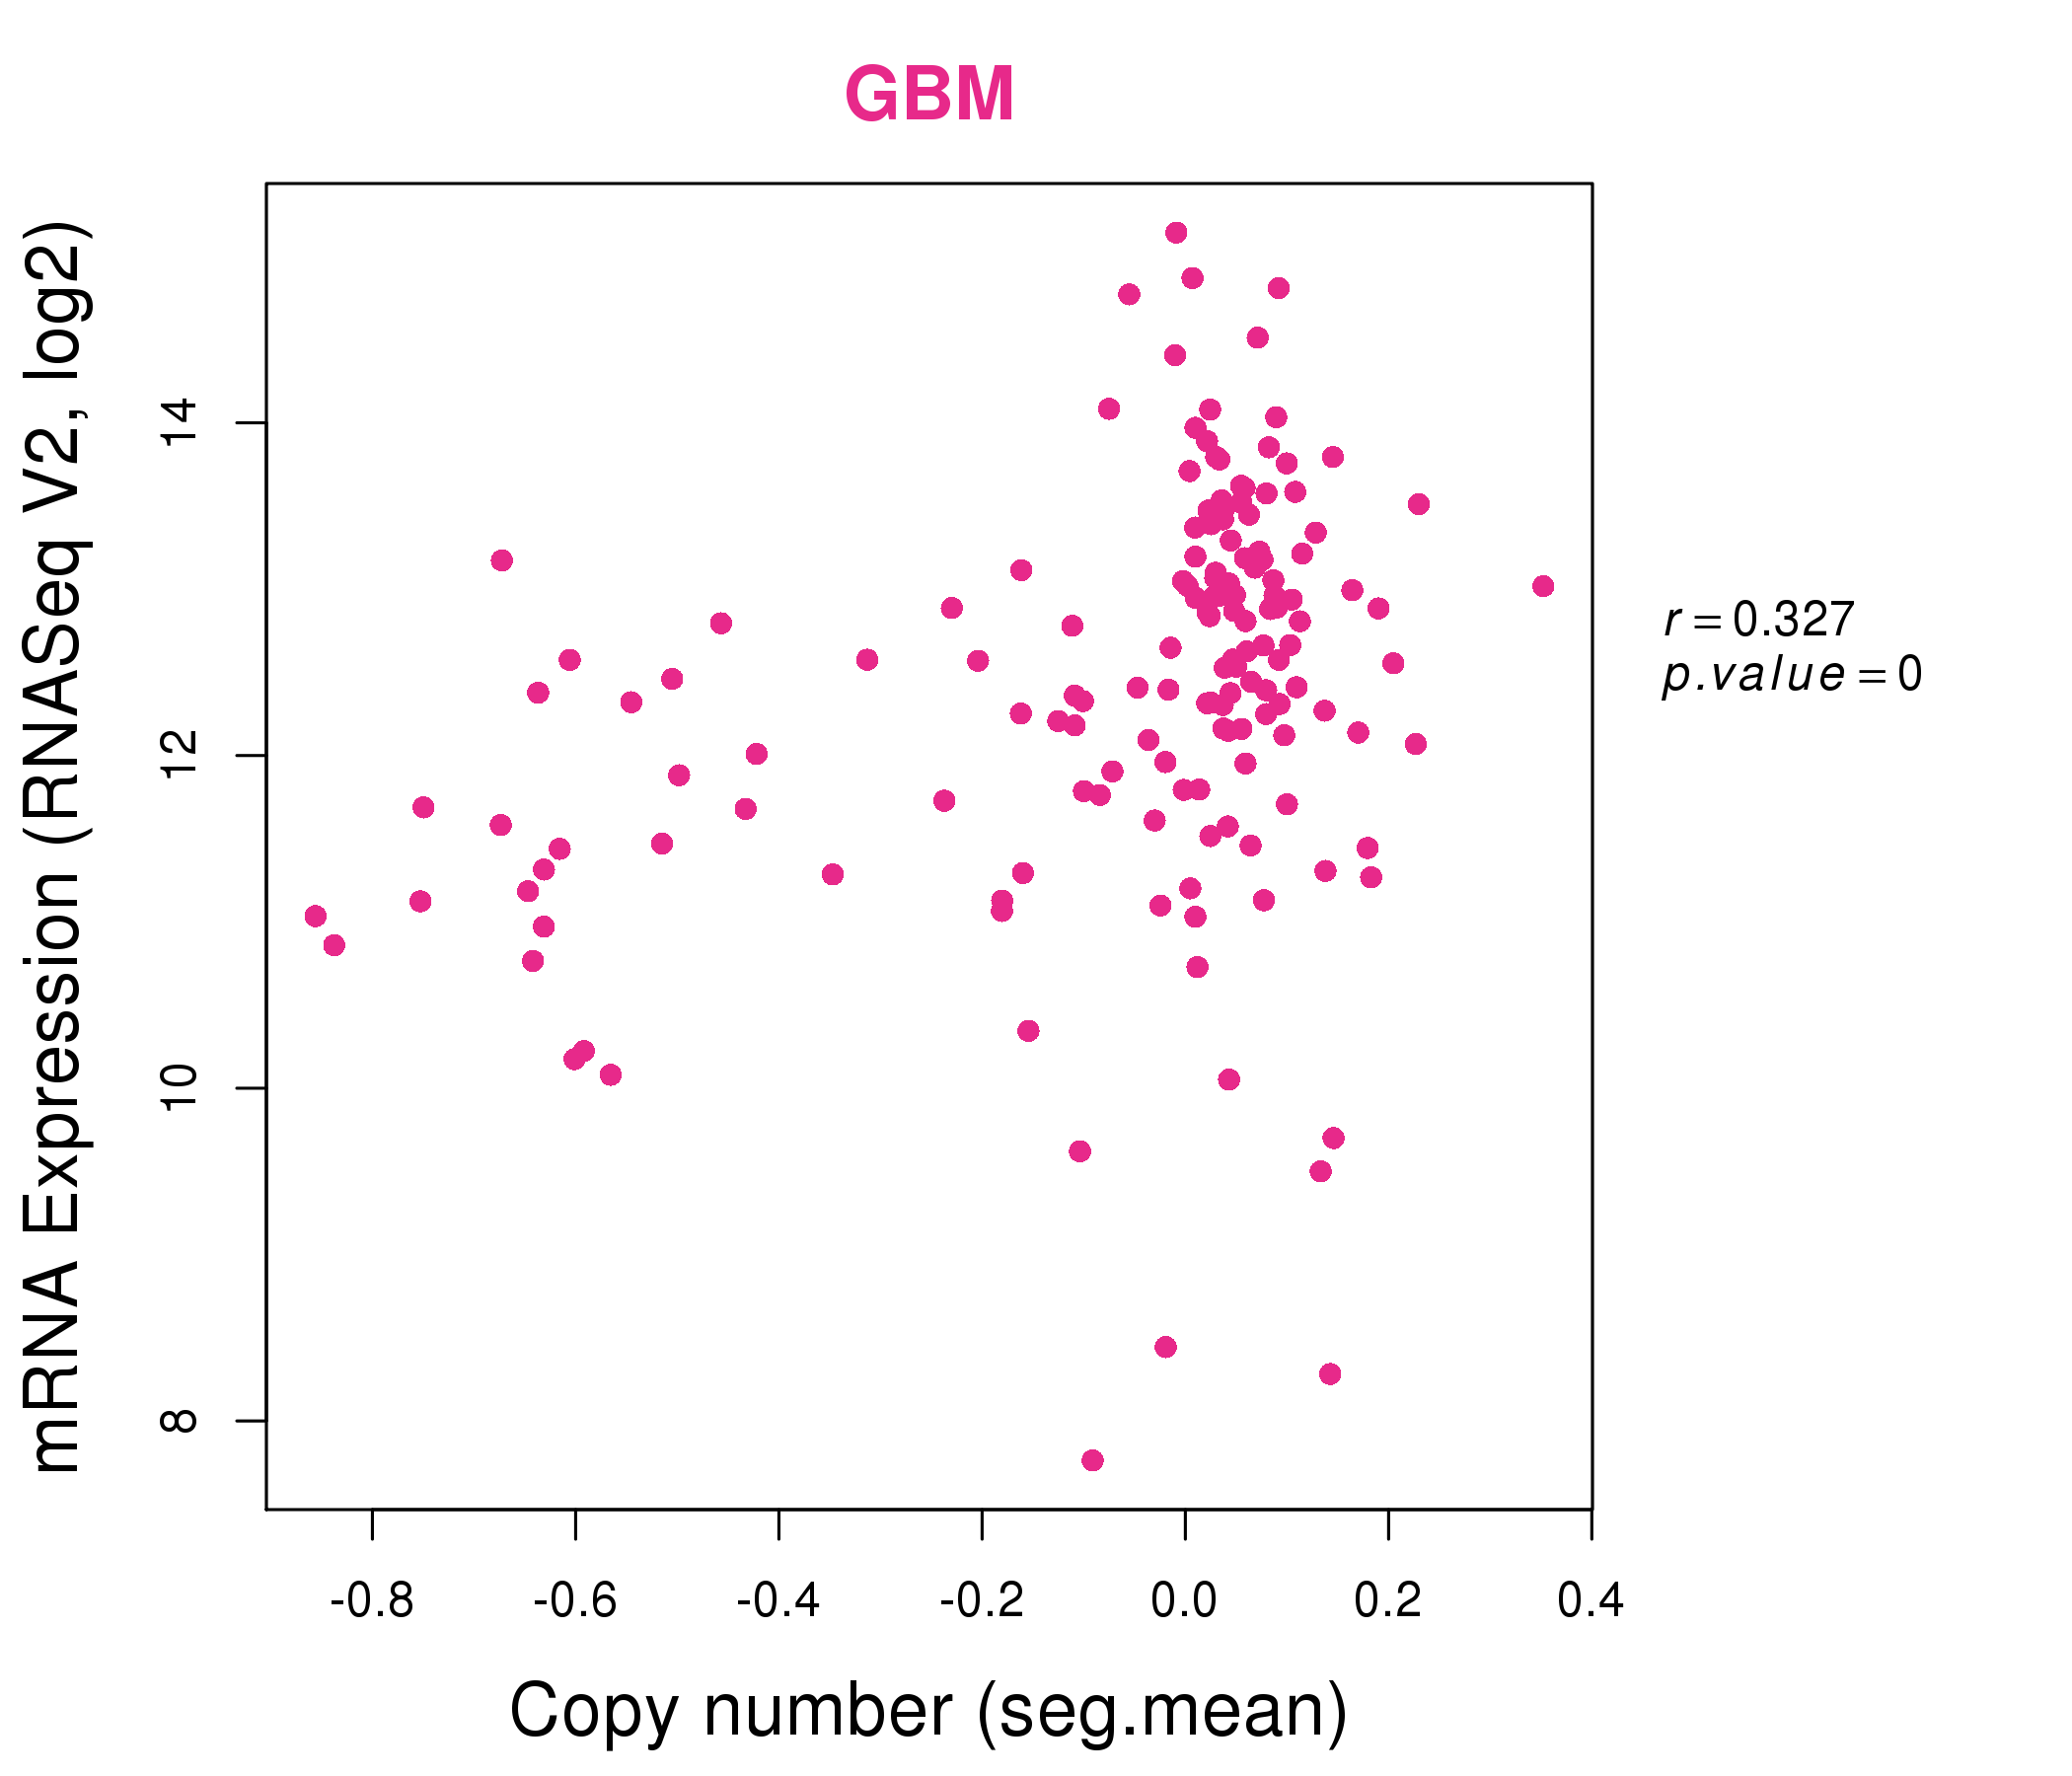
| * This plots show the correlation between CNV and gene expression. |
: Open all plots for all cancer types
 |
|
 |
|
| Top |
| Gene-Gene Network Information |
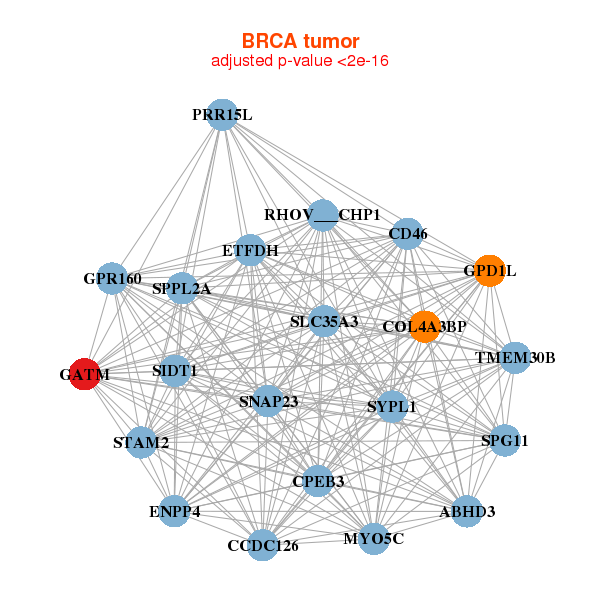
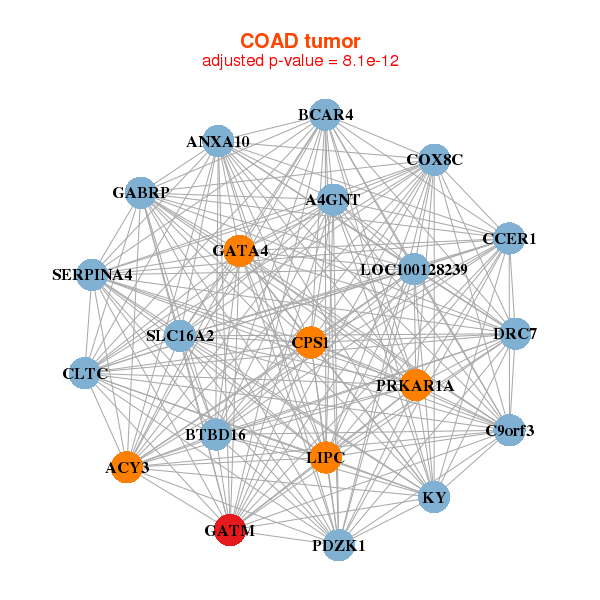
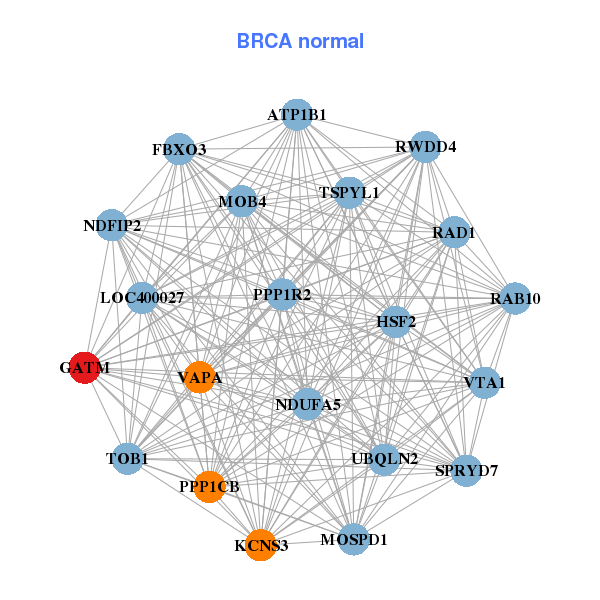
| * Co-Expression network figures were drawn using R package igraph. Only the top 20 genes with the highest correlations were shown. Red circle: input gene, orange circle: cell metabolism gene, sky circle: other gene |
: Open all plots for all cancer types
 |
| ||||
| ABHD3,CCDC126,CD46,RHOV___CHP1,COL4A3BP,CPEB3,ENPP4, ETFDH,GATM,GPD1L,GPR160,MYO5C,PRR15L,SIDT1, SLC35A3,SNAP23,SPG11,SPPL2A,STAM2,SYPL1,TMEM30B | ATP1B1,SPRYD7,FBXO3,GATM,HSF2,KCNS3,LOC400027, MOB4,MOSPD1,NDFIP2,NDUFA5,PPP1CB,PPP1R2,RAB10, RAD1,RWDD4,TOB1,TSPYL1,UBQLN2,VAPA,VTA1 | ||||
 |
| ||||
| A4GNT,ACY3,ANXA10,BCAR4,BTBD16,CCER1,C9orf3, DRC7,CLTC,COX8C,CPS1,GABRP,GATA4,GATM, KY,LIPC,LOC100128239,PDZK1,PRKAR1A,SERPINA4,SLC16A2 | AIG1,APOM,ASPA,BDH2,TMEM252,CYB5A,ESRRG, GATA5,GATM,GCNT4,HACL1,HOXC11,HOXC8,HOXC9, OAT,PEBP1,PEPD,PHEX,PHYHIPL,SAT2,TM4SF4 |
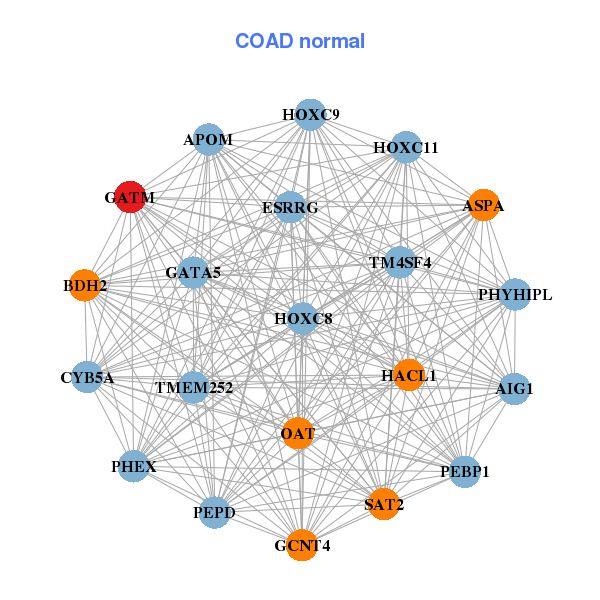
| * Co-Expression network figures were drawn using R package igraph. Only the top 20 genes with the highest correlations were shown. Red circle: input gene, orange circle: cell metabolism gene, sky circle: other gene |
: Open all plots for all cancer types
| Top |
: Open all interacting genes' information including KEGG pathway for all interacting genes from DAVID
| Top |
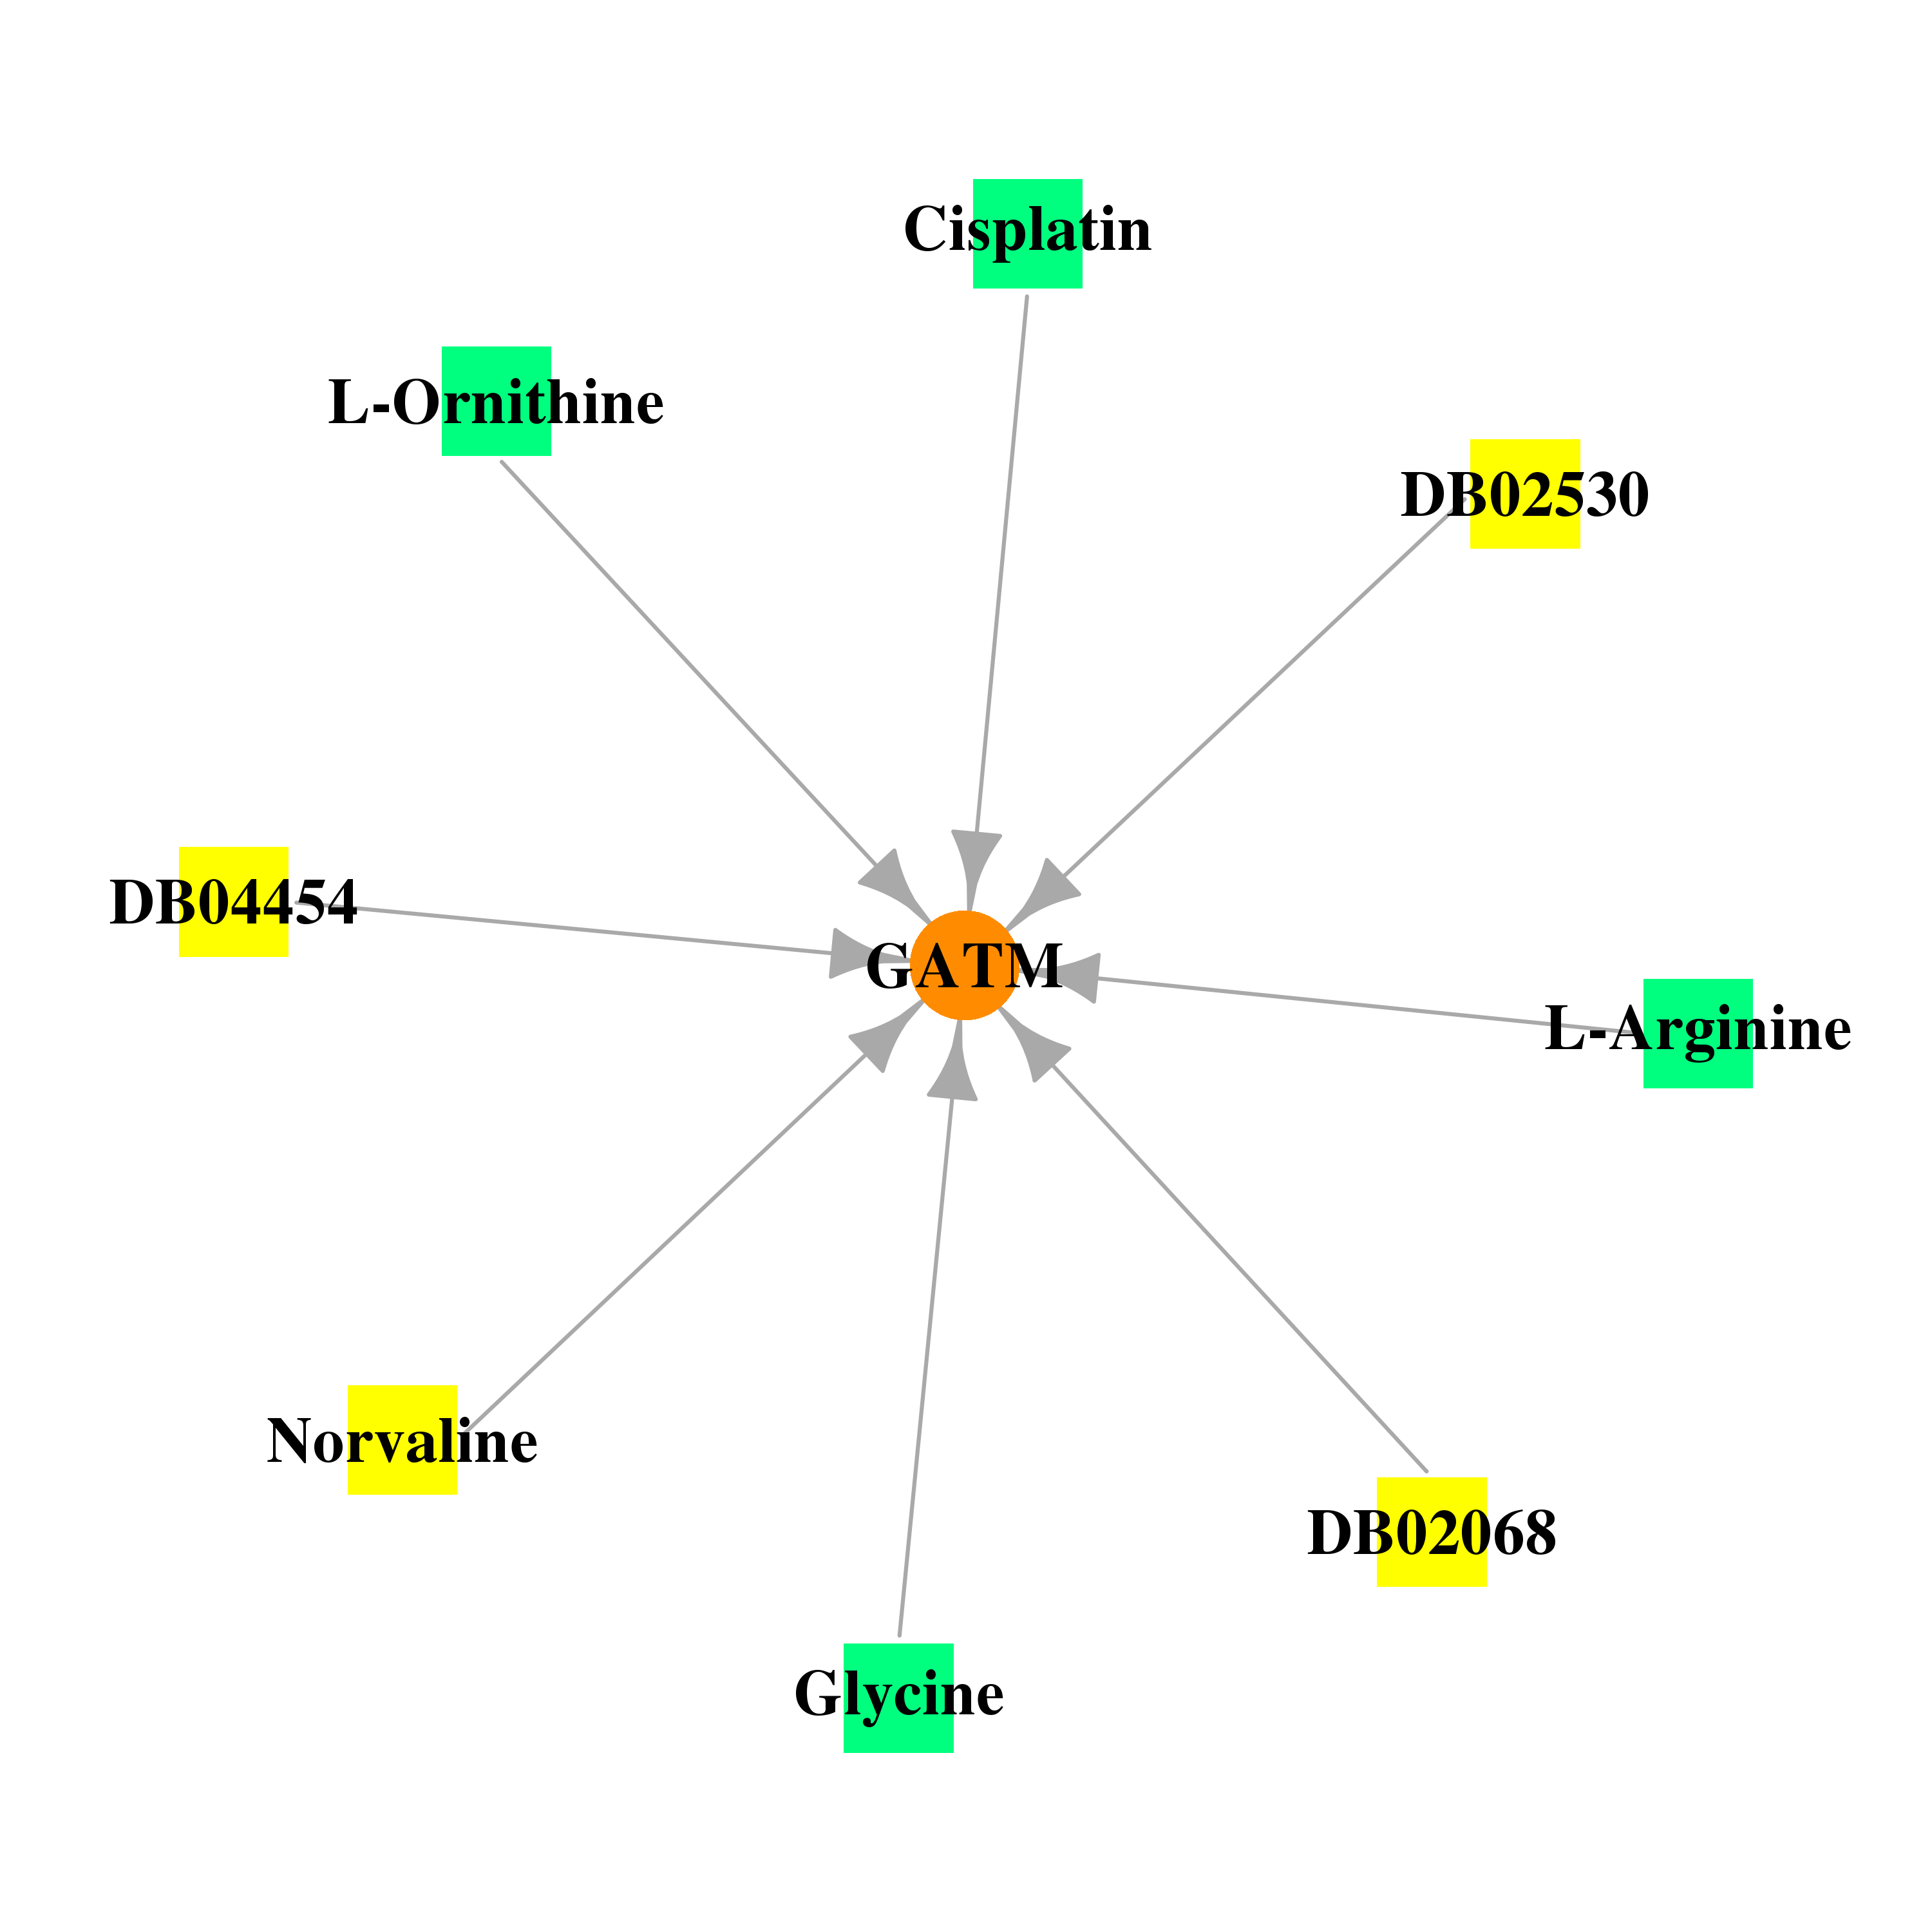
| Pharmacological Information for GATM |
| DB Category | DB Name | DB's ID and Url link |
| * Gene Centered Interaction Network. |
 |
| * Drug Centered Interaction Network. |
| DrugBank ID | Target Name | Drug Groups | Generic Name | Drug Centered Network | Drug Structure |
| DB00129 | glycine amidinotransferase (L-arginine:glycine amidinotransferase) | approved; nutraceutical | L-Ornithine | 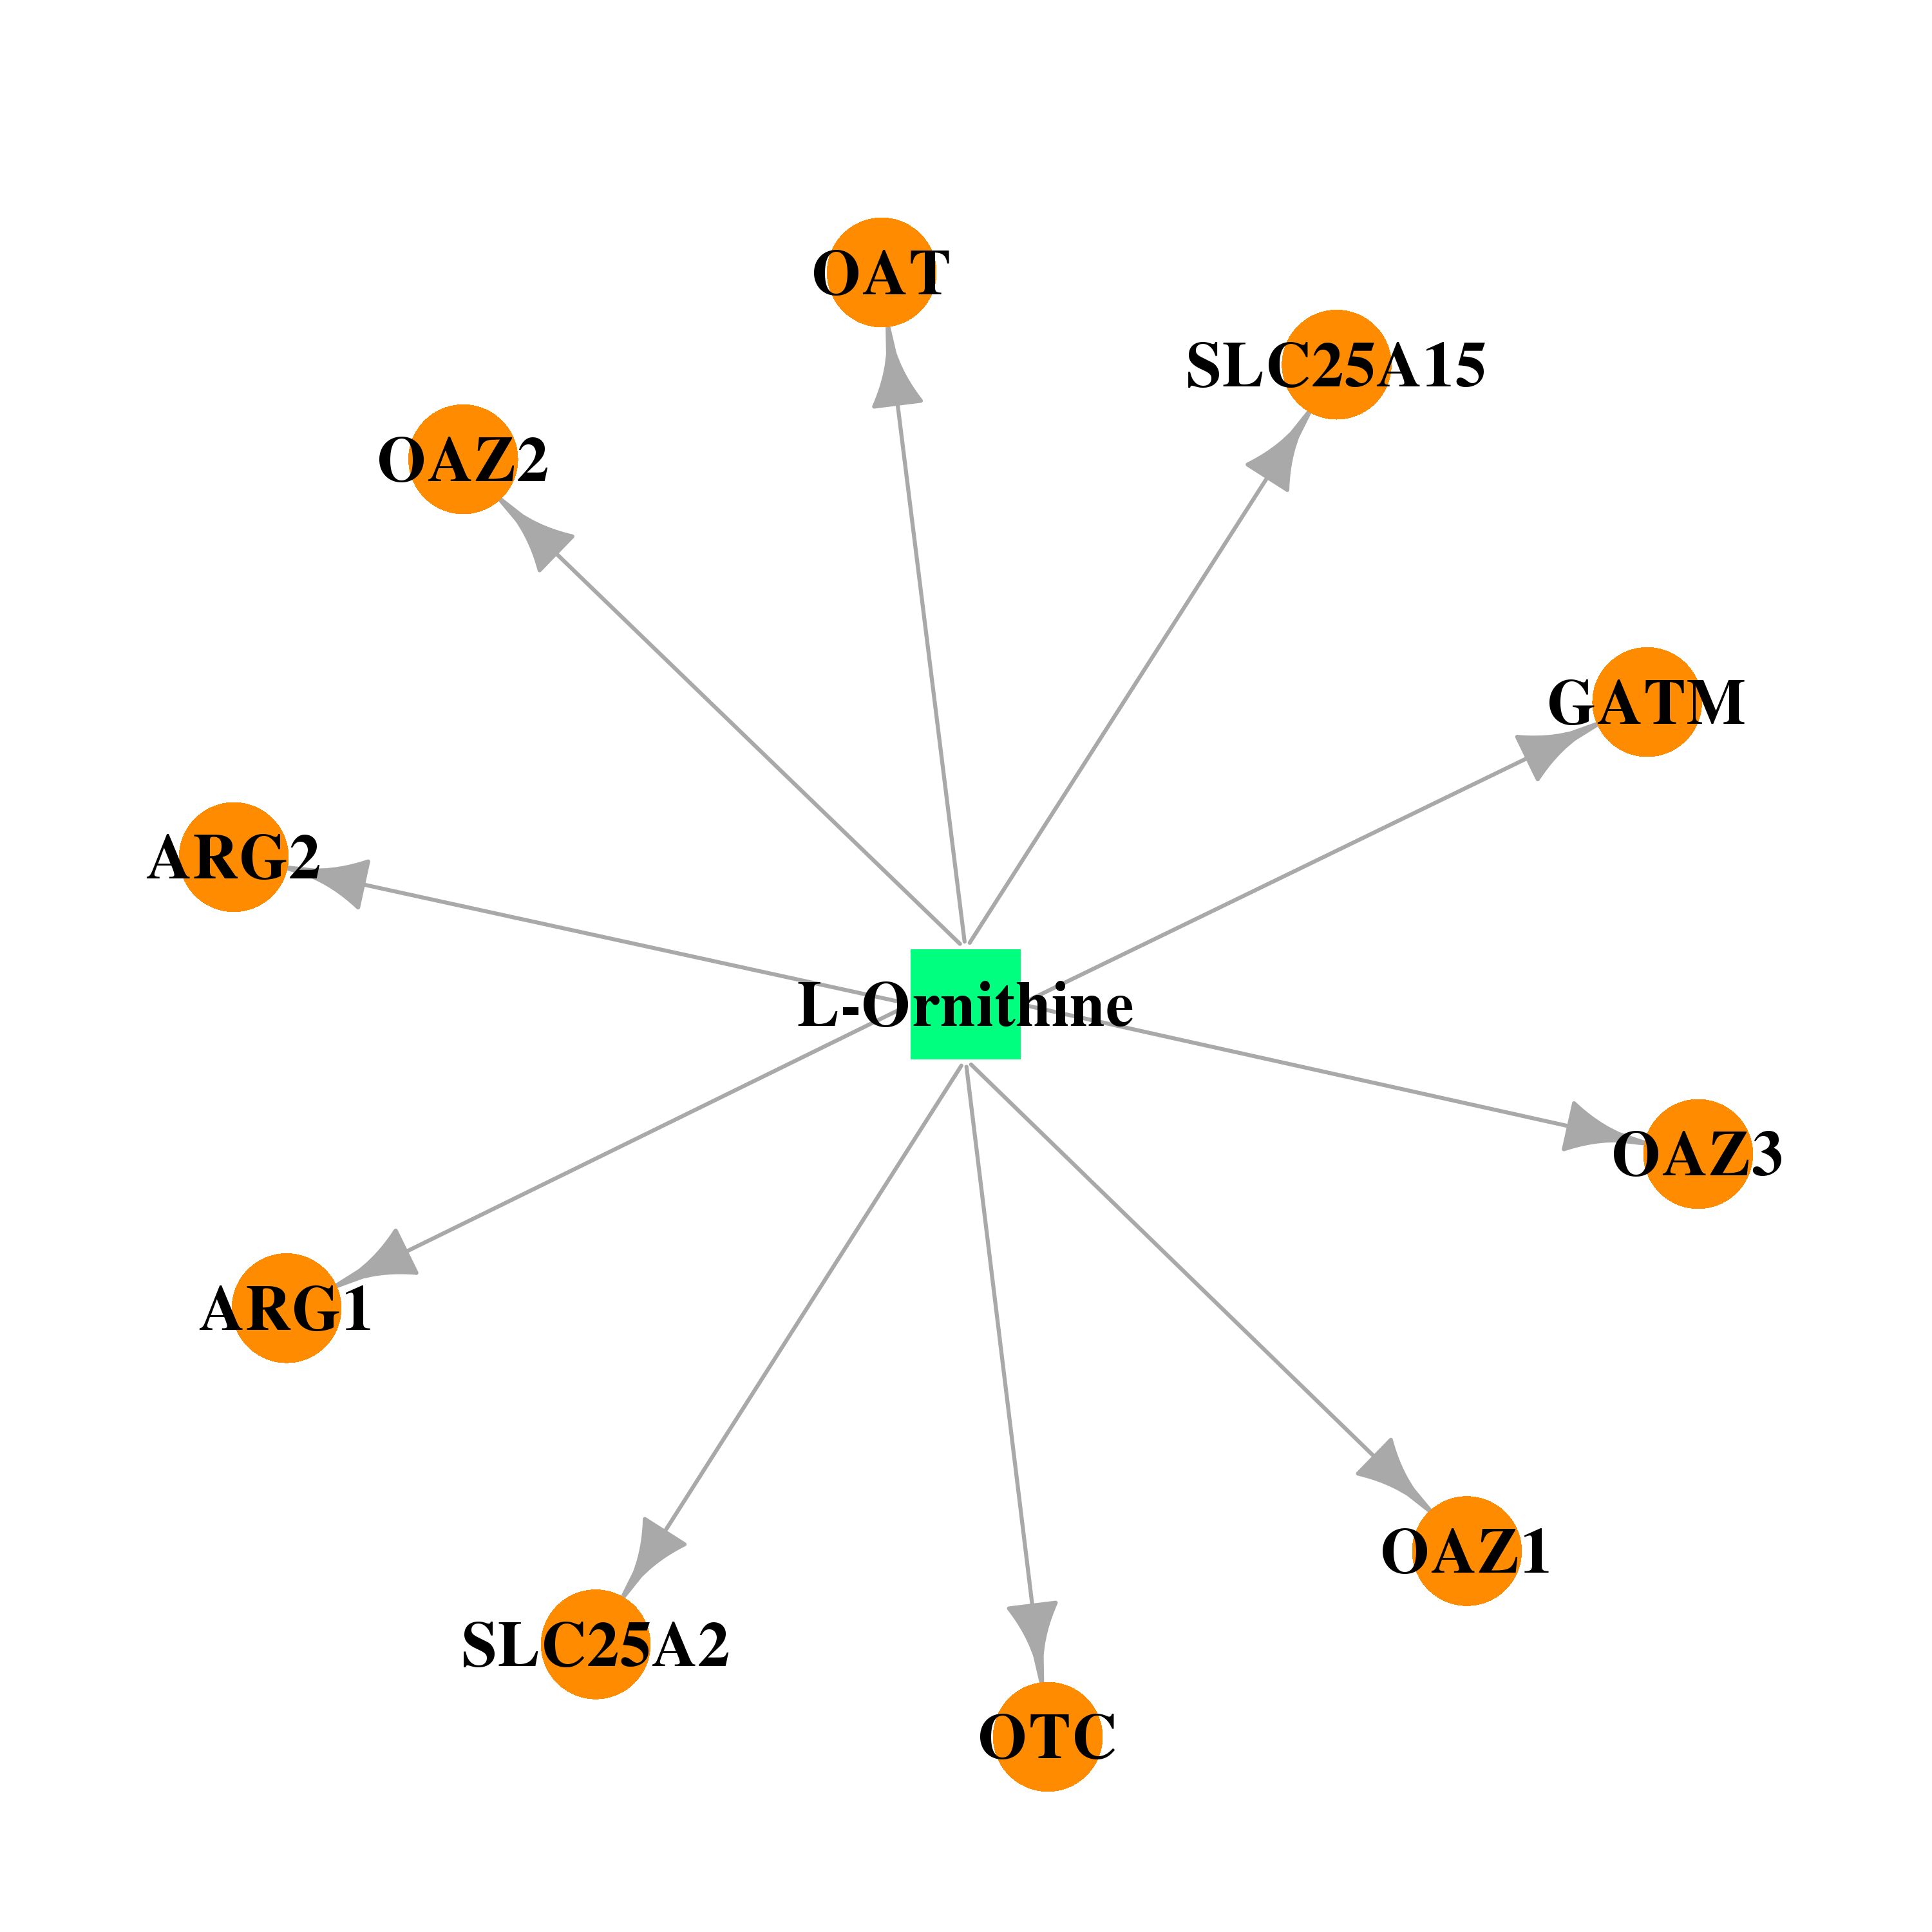 | 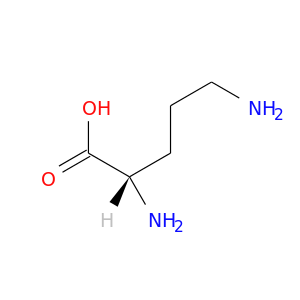 |
| DB00145 | glycine amidinotransferase (L-arginine:glycine amidinotransferase) | approved; nutraceutical | Glycine |  |  |
| DB02068 | glycine amidinotransferase (L-arginine:glycine amidinotransferase) | experimental | Delta-Amino Valeric Acid | 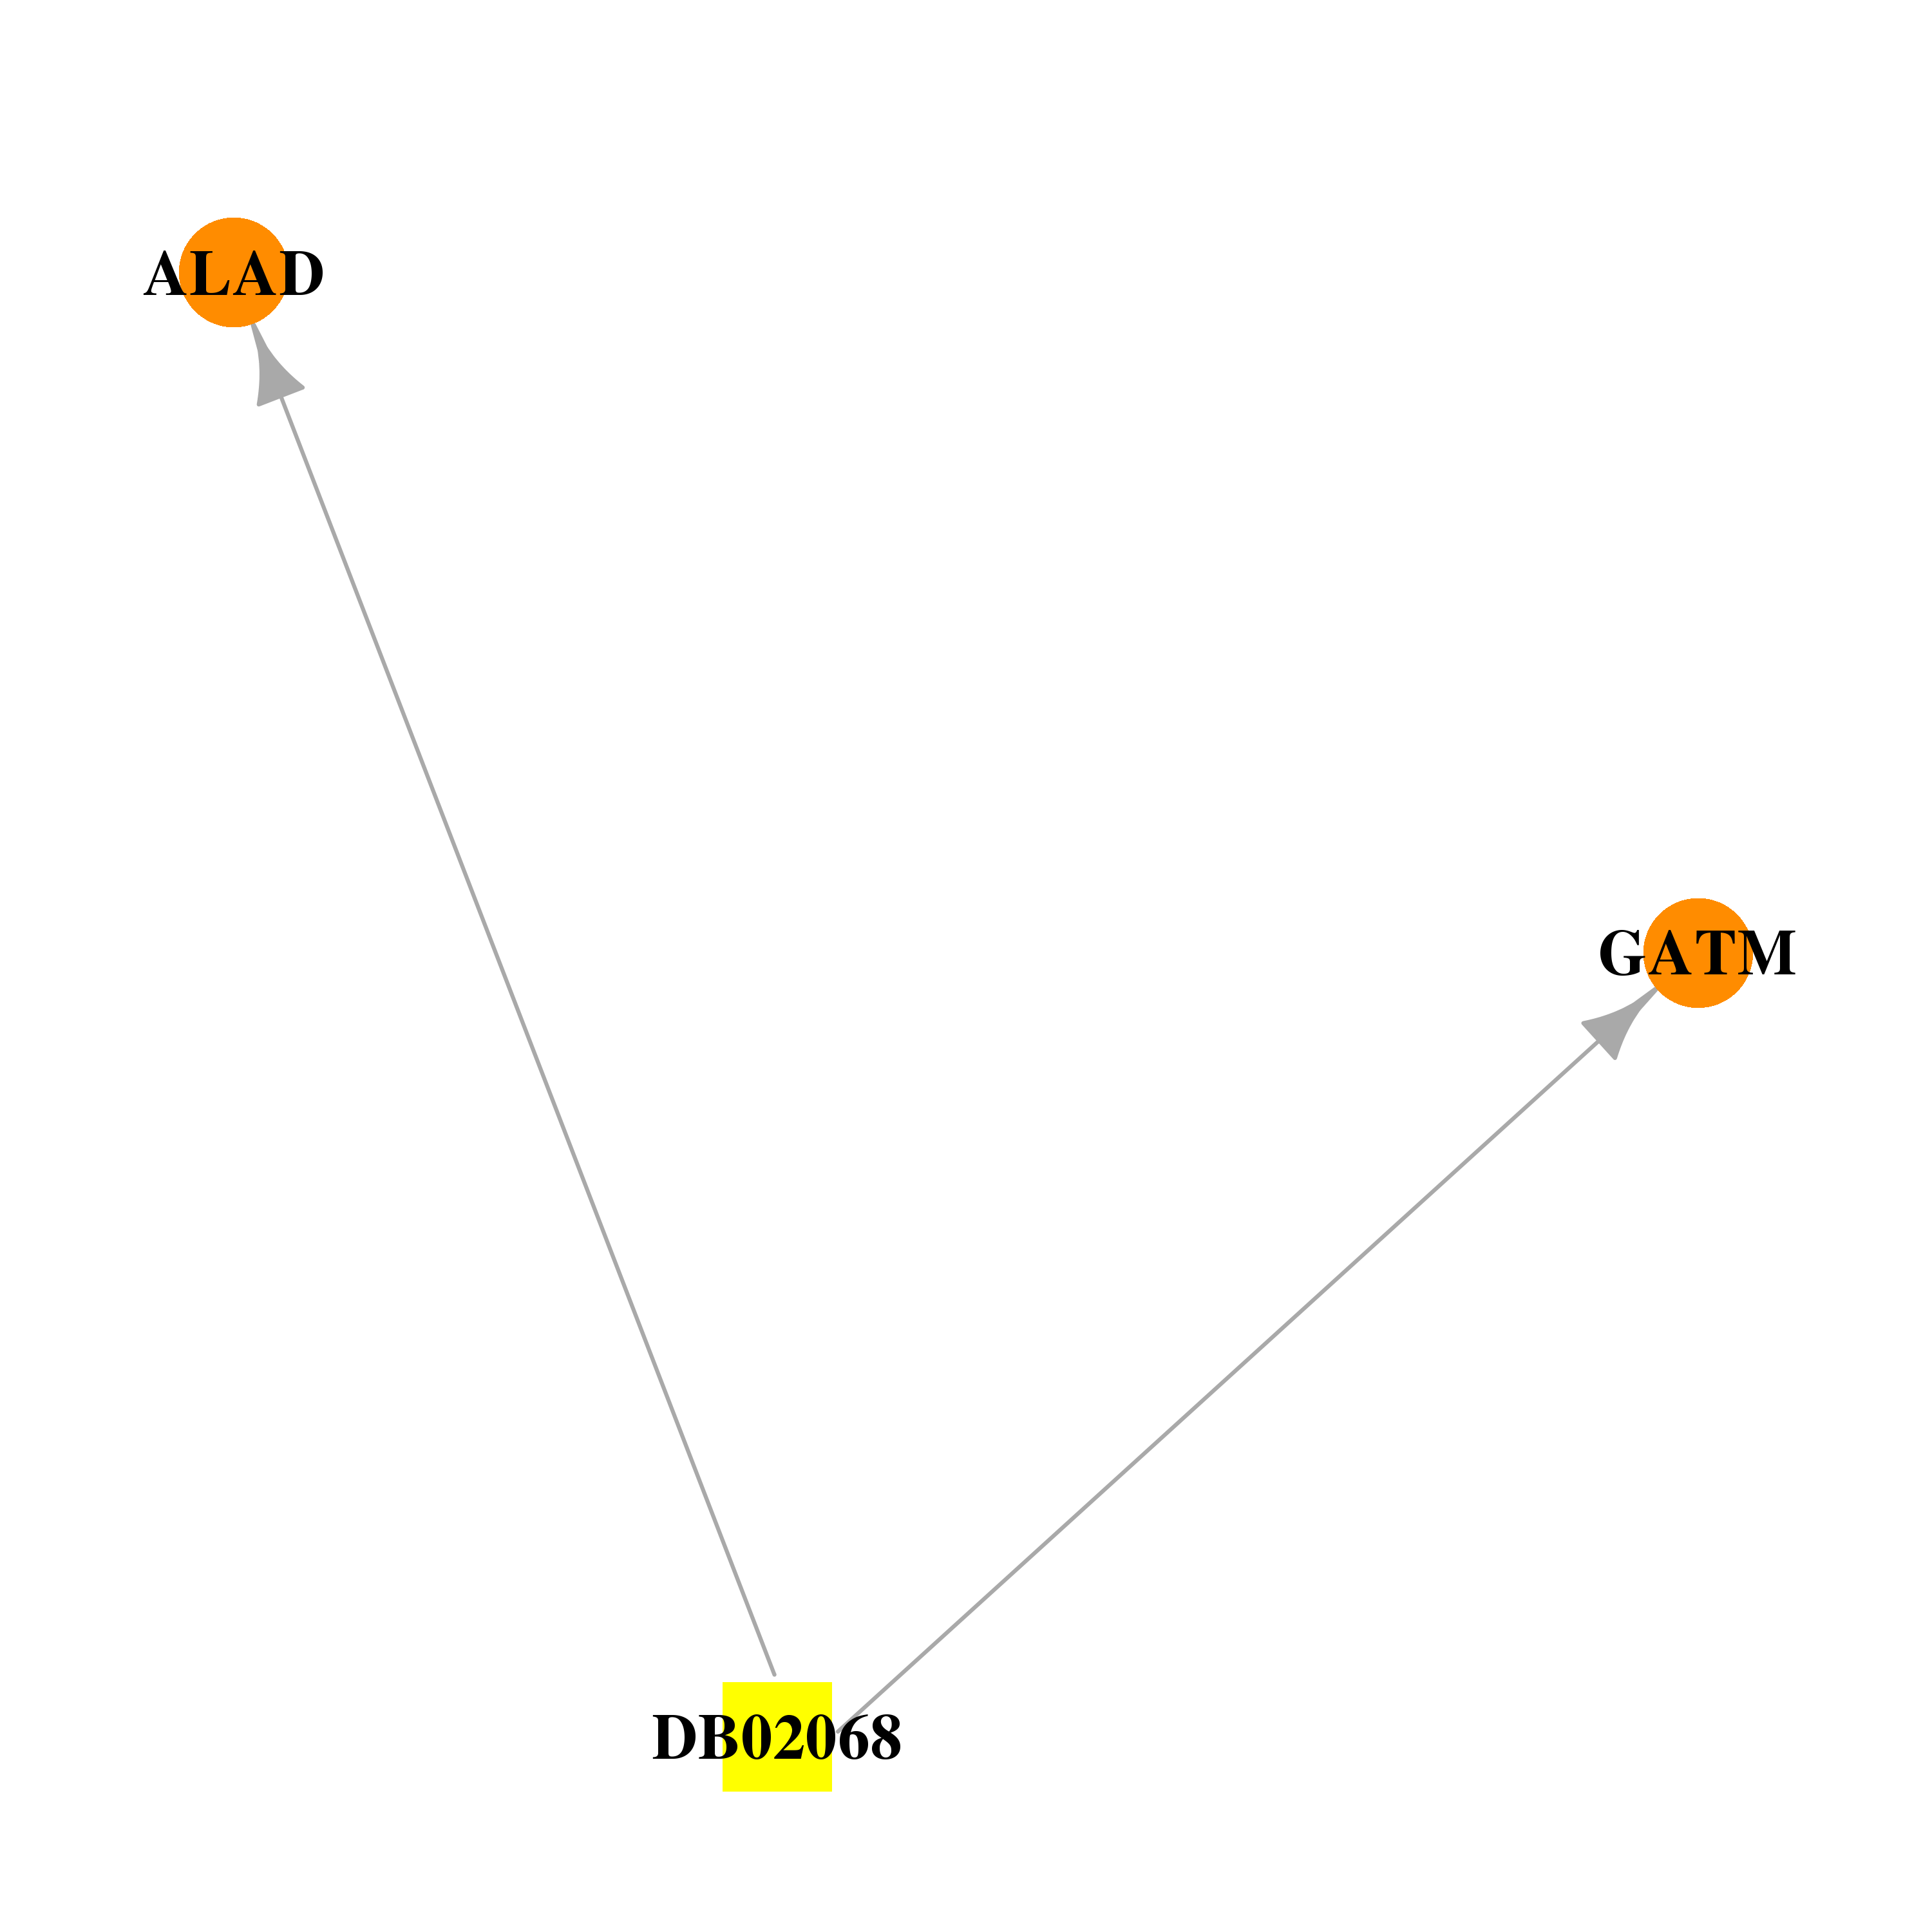 | 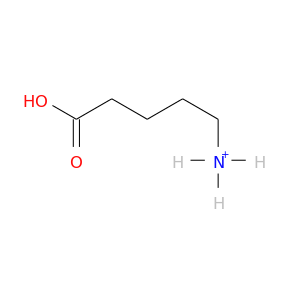 |
| DB02530 | glycine amidinotransferase (L-arginine:glycine amidinotransferase) | experimental | Gamma(Amino)-Butyric Acid |  |  |
| DB04185 | glycine amidinotransferase (L-arginine:glycine amidinotransferase) | experimental | Norvaline | 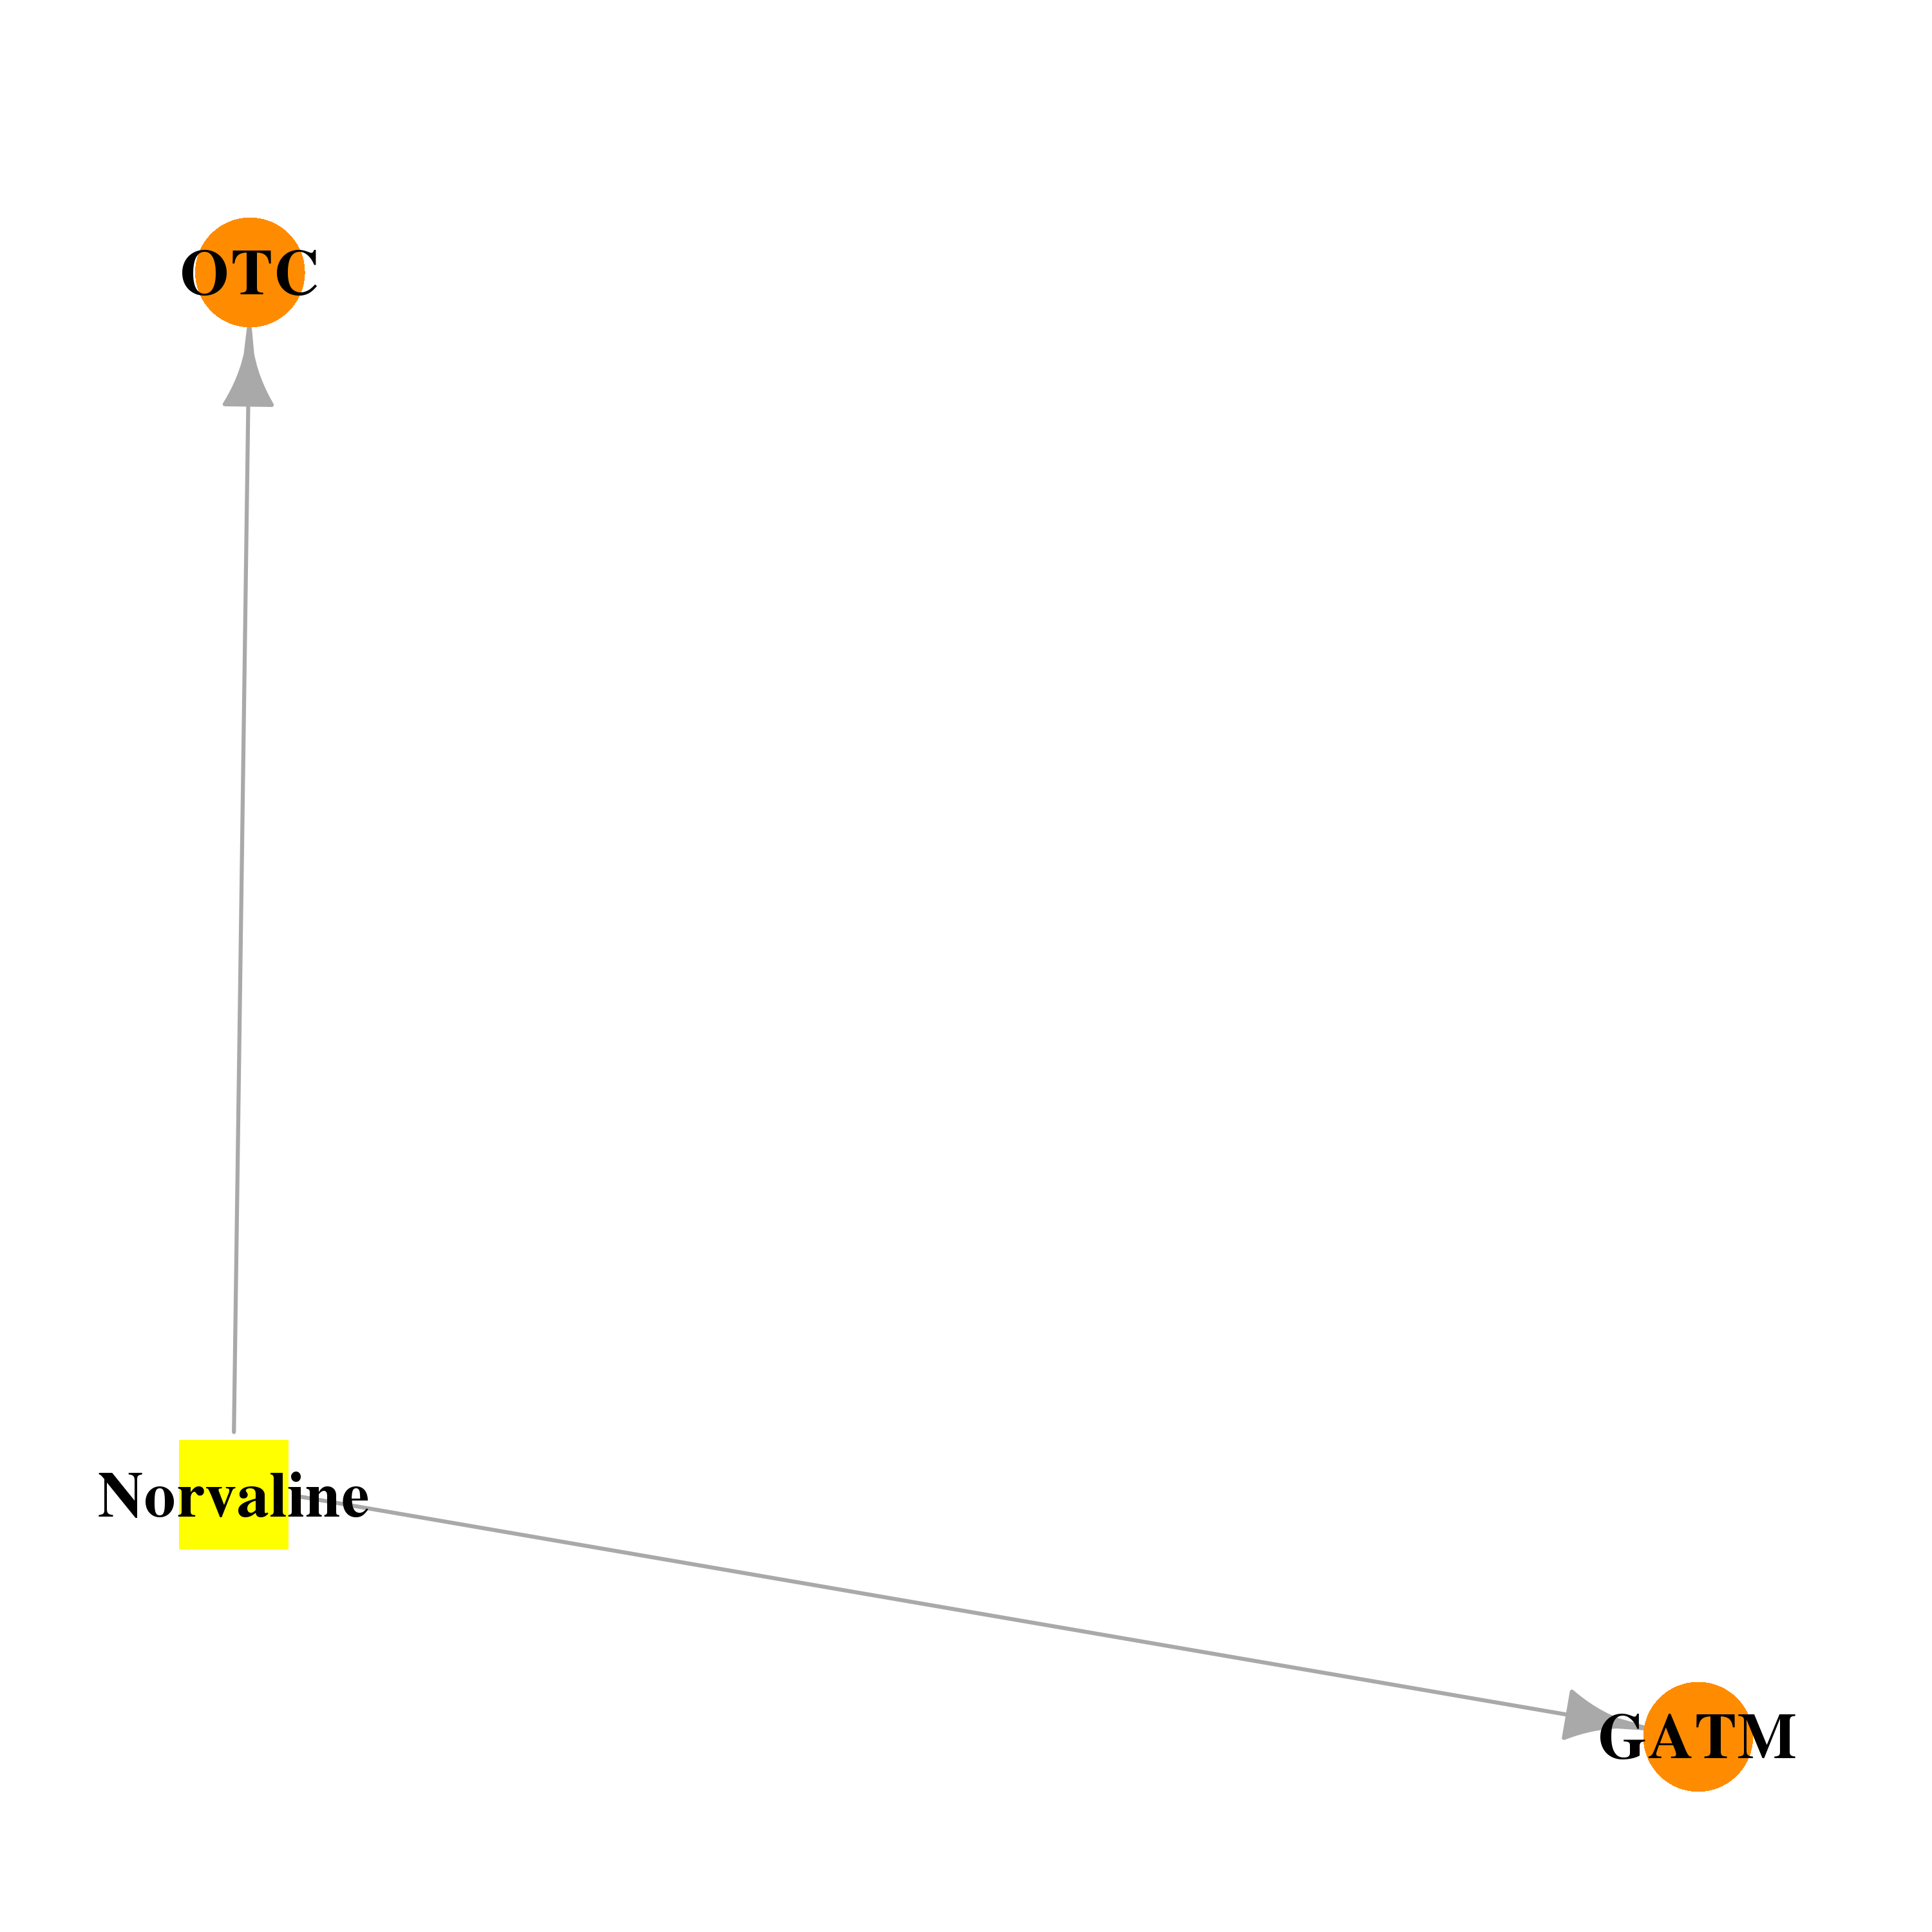 | 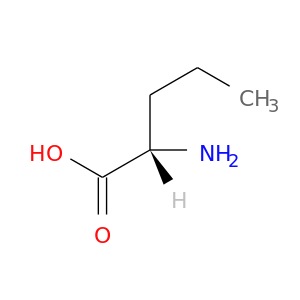 |
| DB04454 | glycine amidinotransferase (L-arginine:glycine amidinotransferase) | experimental | Alpha-Aminobutyric Acid | 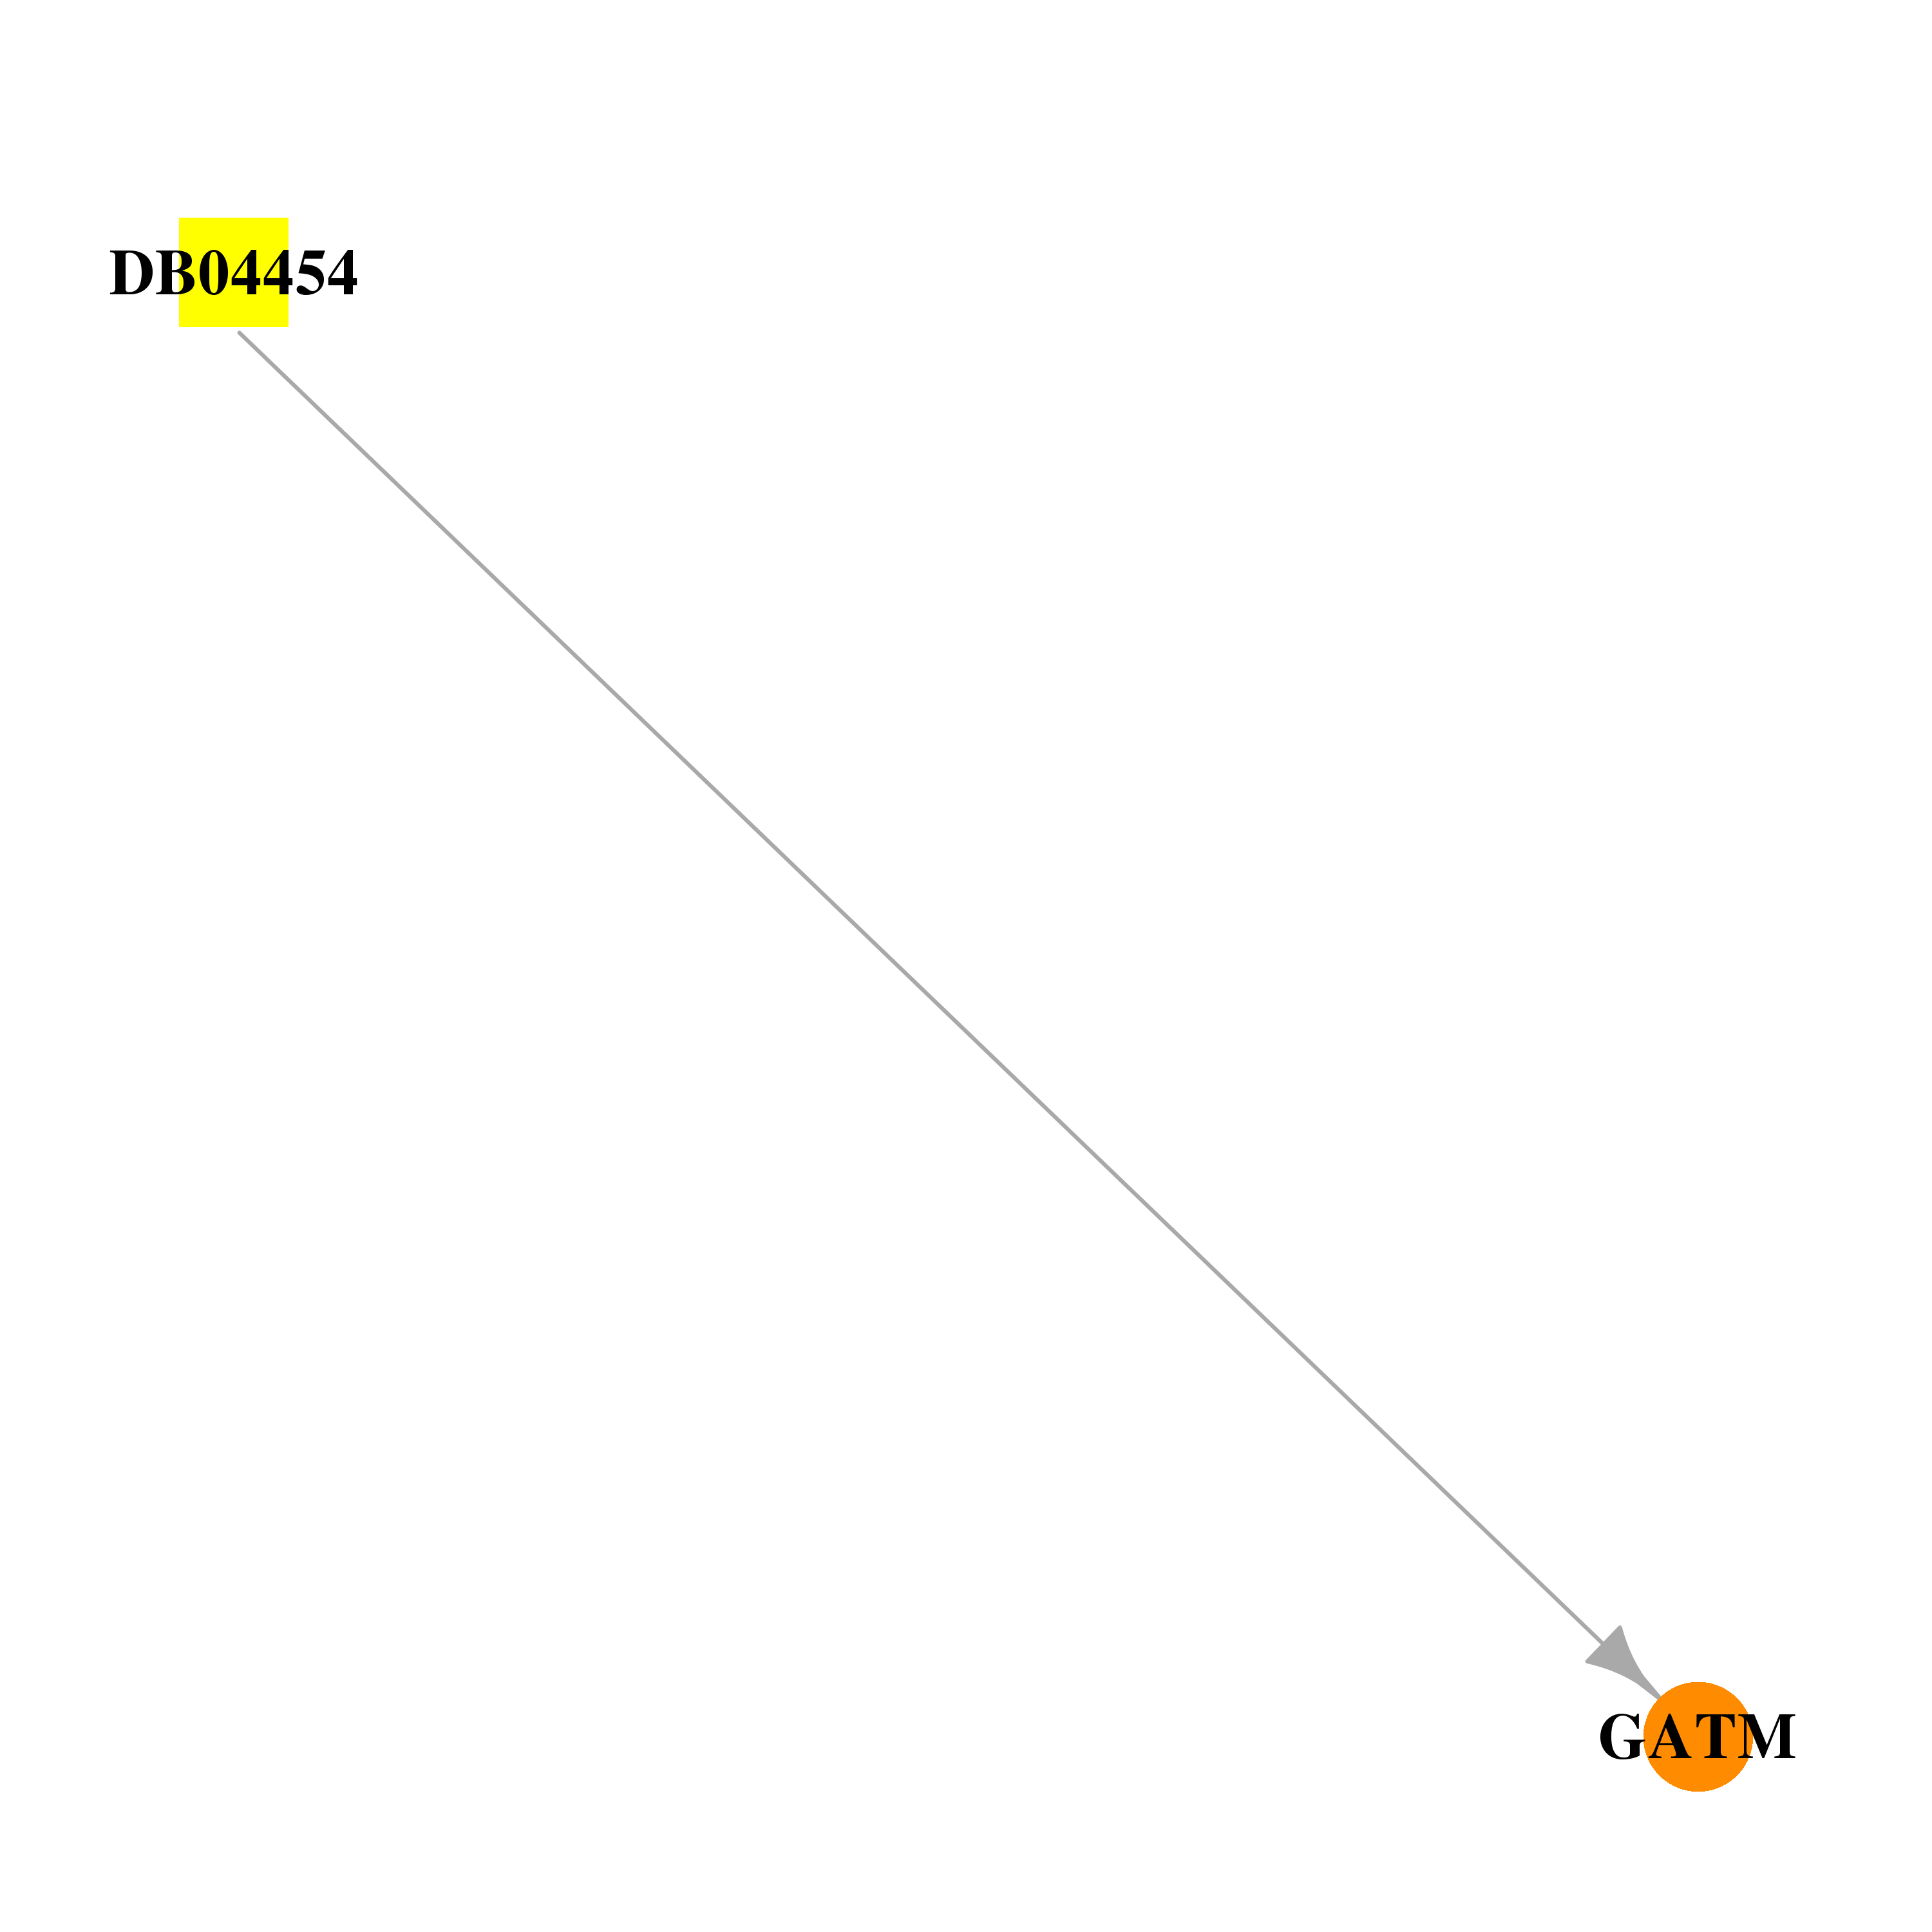 | 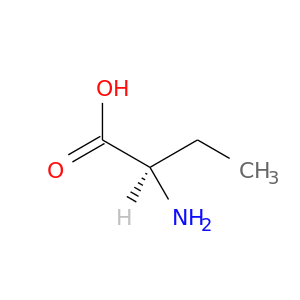 |
| DB00125 | glycine amidinotransferase (L-arginine:glycine amidinotransferase) | approved; nutraceutical | L-Arginine |  |  |
| DB00515 | glycine amidinotransferase (L-arginine:glycine amidinotransferase) | approved | Cisplatin |  |  |
| Top |
| Cross referenced IDs for GATM |
| * We obtained these cross-references from Uniprot database. It covers 150 different DBs, 18 categories. http://www.uniprot.org/help/cross_references_section |
: Open all cross reference information
|
Copyright © 2016-Present - The Univsersity of Texas Health Science Center at Houston @ |