|
|||||||||||||||||||||||||||||||||||||||||||||||||||||||||||||||||||||||||||||||||||||||||||||||||||||||||||||||||||||||||||||||||||||||||||||||||||||||||||||||||||||||||||||||||||||||||||||||||||||||||||||||||||||||||||||||||||||||||||||||||||||||||||||||||||||||||||||||||||||||||||||||||||||||||||||||||||||||||||||||||||||||||||||||||||
| |
| Phenotypic Information (metabolism pathway, cancer, disease, phenome) |
| |
| |
| Gene-Gene Network Information: Co-Expression Network, Interacting Genes & KEGG |
| |
|


| Gene Summary for GBE1 |
| Basic gene info. | Gene symbol | GBE1 |
| Gene name | glucan (1,4-alpha-), branching enzyme 1 | |
| Synonyms | APBD|GBE|GSD4 | |
| Cytomap | UCSC genome browser: 3p12.3 | |
| Genomic location | chr3 :81538849-81810950 | |
| Type of gene | protein-coding | |
| RefGenes | NM_000158.3, | |
| Ensembl id | ENSG00000114480 | |
| Description | 1,4-alpha-glucan-branching enzymeamylo-(1,4 to 1,6) transglucosidaseamylo-(1,4 to 1,6) transglycosylasebrancher enzymeglycogen branching enzymeglycogen-branching enzyme | |
| Modification date | 20141219 | |
| dbXrefs | MIM : 607839 | |
| HGNC : HGNC | ||
| Ensembl : ENSG00000114480 | ||
| HPRD : 01985 | ||
| Vega : OTTHUMG00000158978 | ||
| Protein | UniProt: go to UniProt's Cross Reference DB Table | |
| Expression | CleanEX: HS_GBE1 | |
| BioGPS: 2632 | ||
| Gene Expression Atlas: ENSG00000114480 | ||
| The Human Protein Atlas: ENSG00000114480 | ||
| Pathway | NCI Pathway Interaction Database: GBE1 | |
| KEGG: GBE1 | ||
| REACTOME: GBE1 | ||
| ConsensusPathDB | ||
| Pathway Commons: GBE1 | ||
| Metabolism | MetaCyc: GBE1 | |
| HUMANCyc: GBE1 | ||
| Regulation | Ensembl's Regulation: ENSG00000114480 | |
| miRBase: chr3 :81,538,849-81,810,950 | ||
| TargetScan: NM_000158 | ||
| cisRED: ENSG00000114480 | ||
| Context | iHOP: GBE1 | |
| cancer metabolism search in PubMed: GBE1 | ||
| UCL Cancer Institute: GBE1 | ||
| Assigned class in ccmGDB | C | |
| Top |
| Phenotypic Information for GBE1(metabolism pathway, cancer, disease, phenome) |
| Cancer | CGAP: GBE1 |
| Familial Cancer Database: GBE1 | |
| * This gene is included in those cancer gene databases. |
|
|
|
|
|
| . | |||||||||||||||||||||||||||||||||||||||||||||||||||||||||||||||||||||||||||||||||||||||||||||||||||||||||||||||||||||||||||||||||||||||||||||||||||||||||||||||||||||||||||||||||||||||||||||||||||||||||||||||||||||||||||||||||||||||||||||||||||||||||||||||||||||||||||||||||||||||||||||||||||||||||||||||||||||||||||||||||||||||||||||
Oncogene 1 | Significant driver gene in | ||||||||||||||||||||||||||||||||||||||||||||||||||||||||||||||||||||||||||||||||||||||||||||||||||||||||||||||||||||||||||||||||||||||||||||||||||||||||||||||||||||||||||||||||||||||||||||||||||||||||||||||||||||||||||||||||||||||||||||||||||||||||||||||||||||||||||||||||||||||||||||||||||||||||||||||||||||||||||||||||||||||||||||||||||
| cf) number; DB name 1 Oncogene; http://nar.oxfordjournals.org/content/35/suppl_1/D721.long, 2 Tumor Suppressor gene; https://bioinfo.uth.edu/TSGene/, 3 Cancer Gene Census; http://www.nature.com/nrc/journal/v4/n3/abs/nrc1299.html, 4 CancerGenes; http://nar.oxfordjournals.org/content/35/suppl_1/D721.long, 5 Network of Cancer Gene; http://ncg.kcl.ac.uk/index.php, 1Therapeutic Vulnerabilities in Cancer; http://cbio.mskcc.org/cancergenomics/statius/ |
| KEGG_STARCH_AND_SUCROSE_METABOLISM REACTOME_METABOLISM_OF_CARBOHYDRATES REACTOME_GLUCOSE_METABOLISM | |
| OMIM | |
| Orphanet | |
| Disease | KEGG Disease: GBE1 |
| MedGen: GBE1 (Human Medical Genetics with Condition) | |
| ClinVar: GBE1 | |
| Phenotype | MGI: GBE1 (International Mouse Phenotyping Consortium) |
| PhenomicDB: GBE1 | |
| Mutations for GBE1 |
| * Under tables are showing count per each tissue to give us broad intuition about tissue specific mutation patterns.You can go to the detailed page for each mutation database's web site. |
| - Statistics for Tissue and Mutation type | Top |
 |
| - For Inter-chromosomal Variations |
| There's no inter-chromosomal structural variation. |
| - For Intra-chromosomal Variations |
| * Intra-chromosomal variantions includes 'intrachromosomal amplicon to amplicon', 'intrachromosomal amplicon to non-amplified dna', 'intrachromosomal deletion', 'intrachromosomal fold-back inversion', 'intrachromosomal inversion', 'intrachromosomal tandem duplication', 'Intrachromosomal unknown type', 'intrachromosomal with inverted orientation', 'intrachromosomal with non-inverted orientation'. |
 |
| Sample | Symbol_a | Chr_a | Start_a | End_a | Symbol_b | Chr_b | Start_b | End_b |
| pancreas | GBE1 | chr3 | 81764439 | 81764459 | GBE1 | chr3 | 81711609 | 81711629 |
| cf) Tissue number; Tissue name (1;Breast, 2;Central_nervous_system, 3;Haematopoietic_and_lymphoid_tissue, 4;Large_intestine, 5;Liver, 6;Lung, 7;Ovary, 8;Pancreas, 9;Prostate, 10;Skin, 11;Soft_tissue, 12;Upper_aerodigestive_tract) |
| * From mRNA Sanger sequences, Chitars2.0 arranged chimeric transcripts. This table shows GBE1 related fusion information. |
| ID | Head Gene | Tail Gene | Accession | Gene_a | qStart_a | qEnd_a | Chromosome_a | tStart_a | tEnd_a | Gene_a | qStart_a | qEnd_a | Chromosome_a | tStart_a | tEnd_a |
| BF346361 | PLCB4 | 582 | 621 | 20 | 9149571 | 9149611 | GBE1 | 621 | 648 | 3 | 81780156 | 81780186 | |
| CA428629 | GBE1 | 2 | 120 | 3 | 81562616 | 81562736 | ITGA3 | 118 | 556 | 17 | 48145617 | 48149439 | |
| Top |
| Mutation type/ Tissue ID | brca | cns | cerv | endome | haematopo | kidn | Lintest | liver | lung | ns | ovary | pancre | prost | skin | stoma | thyro | urina | |||
| Total # sample | 1 | 1 | 1 | 2 | 2 | |||||||||||||||
| GAIN (# sample) | 1 | 1 | 2 | |||||||||||||||||
| LOSS (# sample) | 1 | 1 | 1 |
| cf) Tissue ID; Tissue type (1; Breast, 2; Central_nervous_system, 3; Cervix, 4; Endometrium, 5; Haematopoietic_and_lymphoid_tissue, 6; Kidney, 7; Large_intestine, 8; Liver, 9; Lung, 10; NS, 11; Ovary, 12; Pancreas, 13; Prostate, 14; Skin, 15; Stomach, 16; Thyroid, 17; Urinary_tract) |
| Top |
|
 |
| Top |
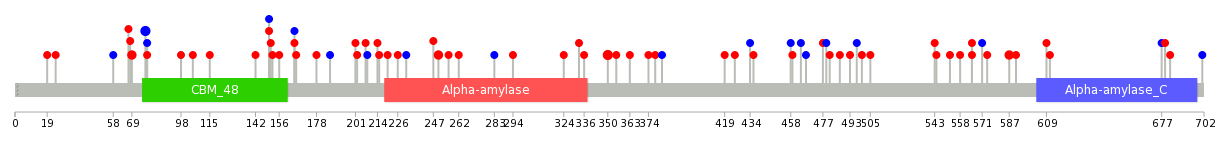
| Stat. for Non-Synonymous SNVs (# total SNVs=52) | (# total SNVs=20) |
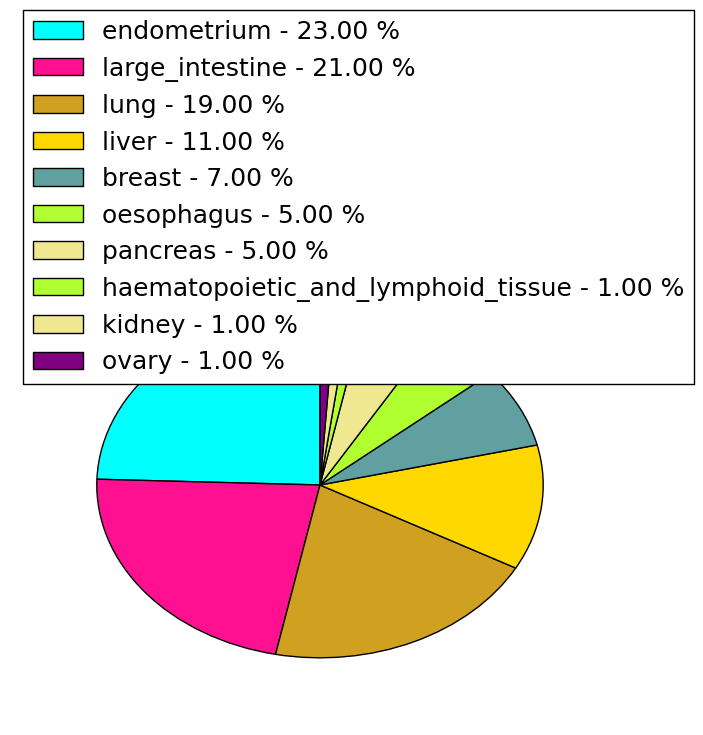 |  |
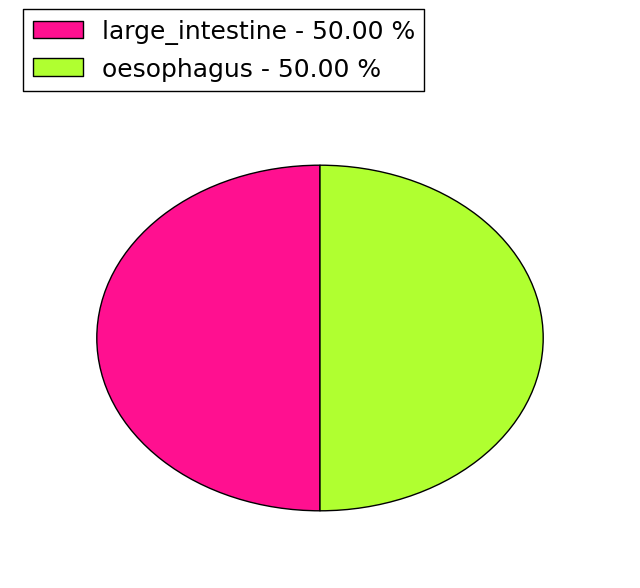
(# total SNVs=2) | (# total SNVs=0) |
 |
| Top |
| * When you move the cursor on each content, you can see more deailed mutation information on the Tooltip. Those are primary_site,primary_histology,mutation(aa),pubmedID. |
| GRCh37 position | Mutation(aa) | Unique sampleID count |
| chr3:81754677-81754677 | p.G77G | 3 |
| chr3:81643118-81643118 | p.R350H | 3 |
| chr3:81754702-81754702 | p.F69C | 2 |
| chr3:81640303-81640303 | p.S374* | 2 |
| chr3:81699052-81699052 | p.S150S | 2 |
| chr3:81695576-81695576 | p.G250A | 2 |
| chr3:81586104-81586104 | p.M587I | 2 |
| chr3:81548282-81548282 | p.N677N | 1 |
| chr3:81635323-81635323 | p.A419S | 1 |
| chr3:81699036-81699036 | p.R156C | 1 |
| Top |
|
 |
| Point Mutation/ Tissue ID | 1 | 2 | 3 | 4 | 5 | 6 | 7 | 8 | 9 | 10 | 11 | 12 | 13 | 14 | 15 | 16 | 17 | 18 | 19 | 20 |
| # sample | 2 | 4 | 13 | 1 | 2 | 2 | 2 | 1 | 9 | 4 | 1 | 13 | ||||||||
| # mutation | 1 | 4 | 12 | 1 | 2 | 2 | 2 | 1 | 9 | 4 | 1 | 14 | ||||||||
| nonsynonymous SNV | 1 | 3 | 9 | 1 | 2 | 2 | 1 | 9 | 4 | 10 | ||||||||||
| synonymous SNV | 1 | 3 | 2 | 1 | 4 |
| cf) Tissue ID; Tissue type (1; BLCA[Bladder Urothelial Carcinoma], 2; BRCA[Breast invasive carcinoma], 3; CESC[Cervical squamous cell carcinoma and endocervical adenocarcinoma], 4; COAD[Colon adenocarcinoma], 5; GBM[Glioblastoma multiforme], 6; Glioma Low Grade, 7; HNSC[Head and Neck squamous cell carcinoma], 8; KICH[Kidney Chromophobe], 9; KIRC[Kidney renal clear cell carcinoma], 10; KIRP[Kidney renal papillary cell carcinoma], 11; LAML[Acute Myeloid Leukemia], 12; LUAD[Lung adenocarcinoma], 13; LUSC[Lung squamous cell carcinoma], 14; OV[Ovarian serous cystadenocarcinoma ], 15; PAAD[Pancreatic adenocarcinoma], 16; PRAD[Prostate adenocarcinoma], 17; SKCM[Skin Cutaneous Melanoma], 18:STAD[Stomach adenocarcinoma], 19:THCA[Thyroid carcinoma], 20:UCEC[Uterine Corpus Endometrial Carcinoma]) |
| Top |
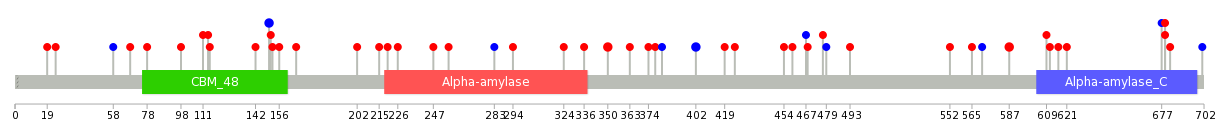
| * We represented just top 10 SNVs. When you move the cursor on each content, you can see more deailed mutation information on the Tooltip. Those are primary_site, primary_histology, mutation(aa), pubmedID. |
| Genomic Position | Mutation(aa) | Unique sampleID count |
| chr3:81643118 | p.T402T | 2 |
| chr3:81586104 | p.M587I | 2 |
| chr3:81699052 | p.S150S | 2 |
| chr3:81640218 | p.R350H | 2 |
| chr3:81640291 | p.D454Y | 1 |
| chr3:81548278 | p.T220P | 1 |
| chr3:81698040 | p.D24N | 1 |
| chr3:81630325 | p.R679C | 1 |
| chr3:81720086 | p.N677N | 1 |
| chr3:81640303 | p.S425F | 1 |
| * Copy number data were extracted from TCGA using R package TCGA-Assembler. The URLs of all public data files on TCGA DCC data server were gathered on Jan-05-2015. Function ProcessCNAData in TCGA-Assembler package was used to obtain gene-level copy number value which is calculated as the average copy number of the genomic region of a gene. |
 |
| cf) Tissue ID[Tissue type]: BLCA[Bladder Urothelial Carcinoma], BRCA[Breast invasive carcinoma], CESC[Cervical squamous cell carcinoma and endocervical adenocarcinoma], COAD[Colon adenocarcinoma], GBM[Glioblastoma multiforme], Glioma Low Grade, HNSC[Head and Neck squamous cell carcinoma], KICH[Kidney Chromophobe], KIRC[Kidney renal clear cell carcinoma], KIRP[Kidney renal papillary cell carcinoma], LAML[Acute Myeloid Leukemia], LUAD[Lung adenocarcinoma], LUSC[Lung squamous cell carcinoma], OV[Ovarian serous cystadenocarcinoma ], PAAD[Pancreatic adenocarcinoma], PRAD[Prostate adenocarcinoma], SKCM[Skin Cutaneous Melanoma], STAD[Stomach adenocarcinoma], THCA[Thyroid carcinoma], UCEC[Uterine Corpus Endometrial Carcinoma] |
| Top |
| Gene Expression for GBE1 |
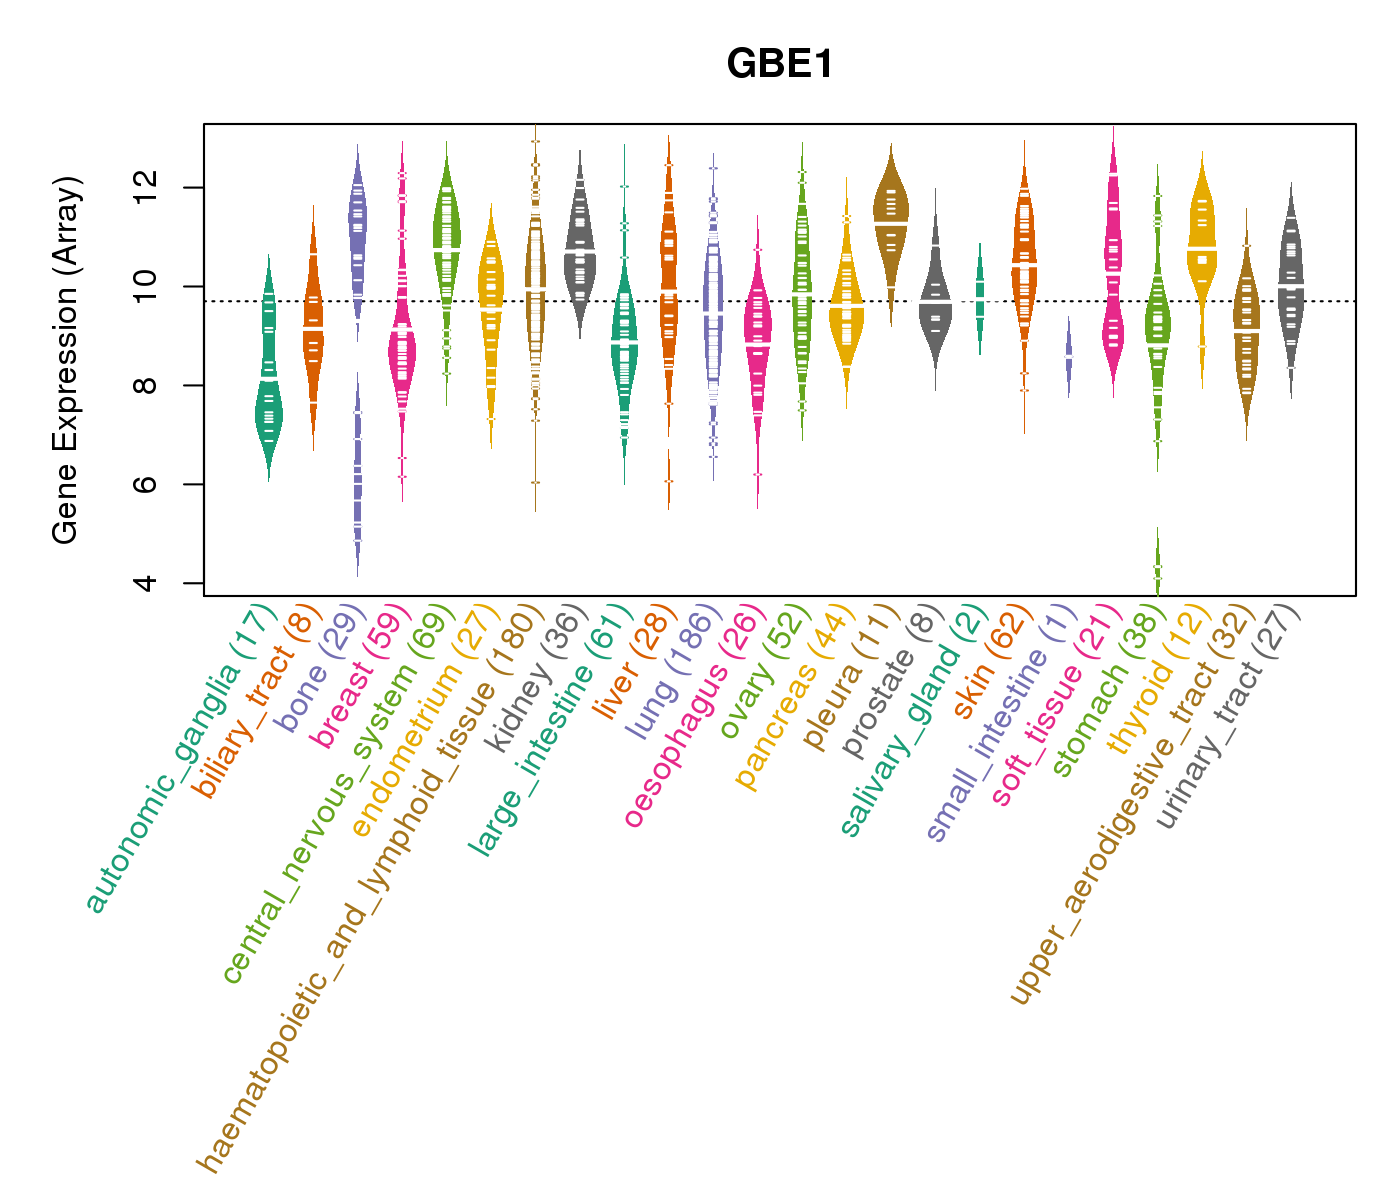
| * CCLE gene expression data were extracted from CCLE_Expression_Entrez_2012-10-18.res: Gene-centric RMA-normalized mRNA expression data. |
 |
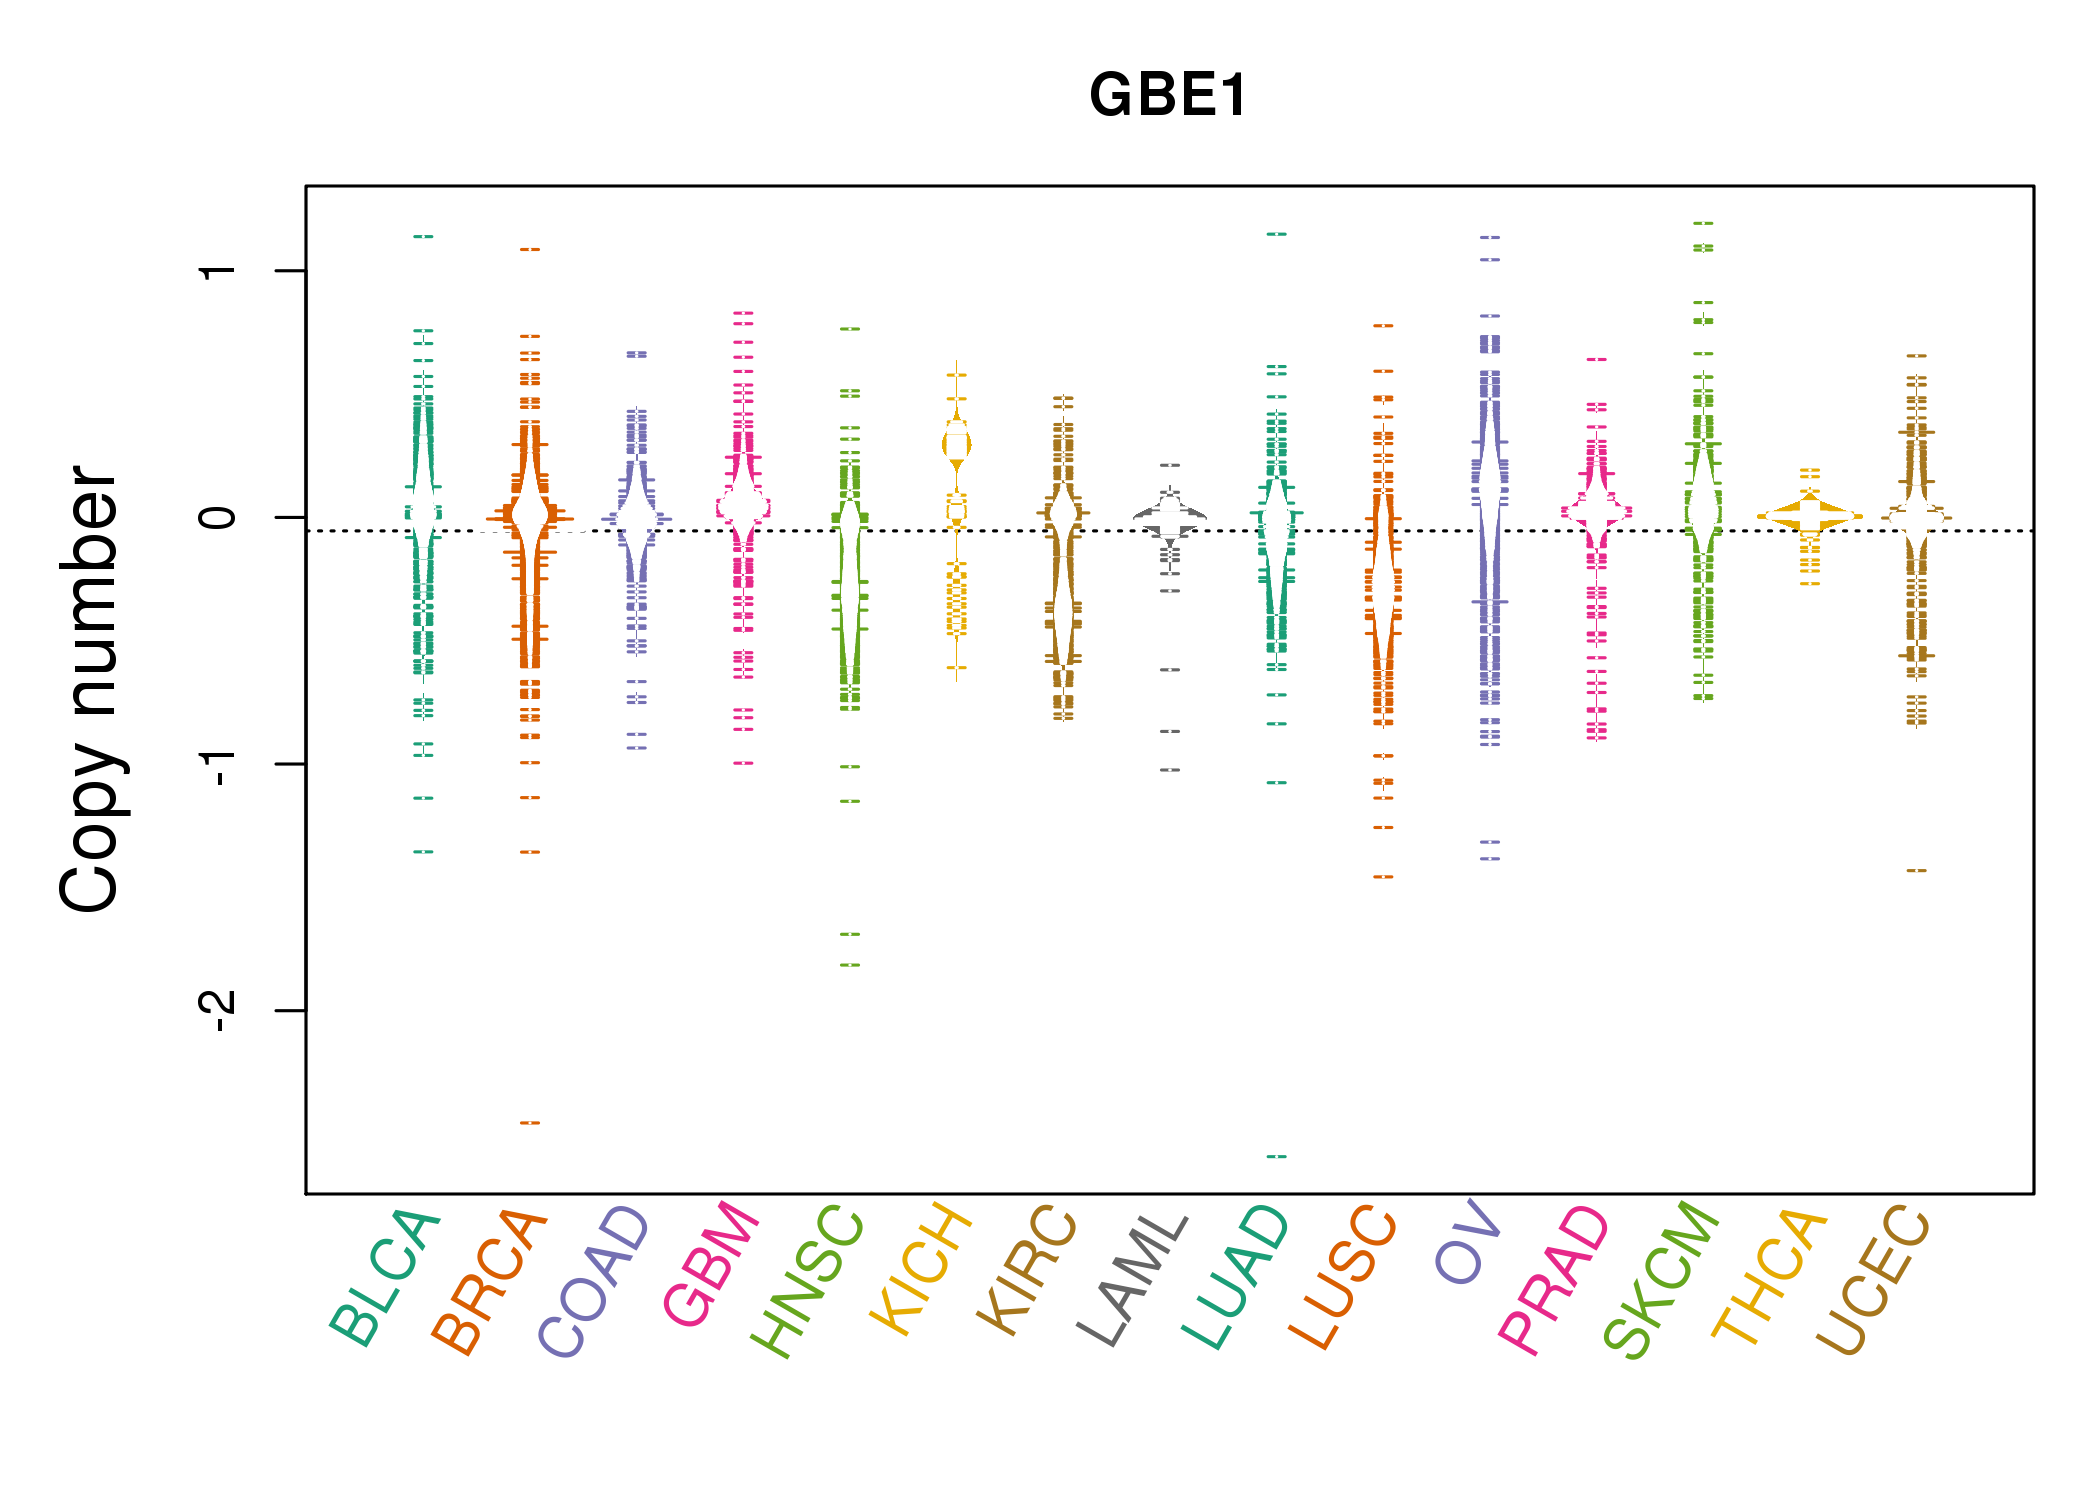
| * Normalized gene expression data of RNASeqV2 was extracted from TCGA using R package TCGA-Assembler. The URLs of all public data files on TCGA DCC data server were gathered at Jan-05-2015. Only eight cancer types have enough normal control samples for differential expression analysis. (t test, adjusted p<0.05 (using Benjamini-Hochberg FDR)) |
 |
| Top |
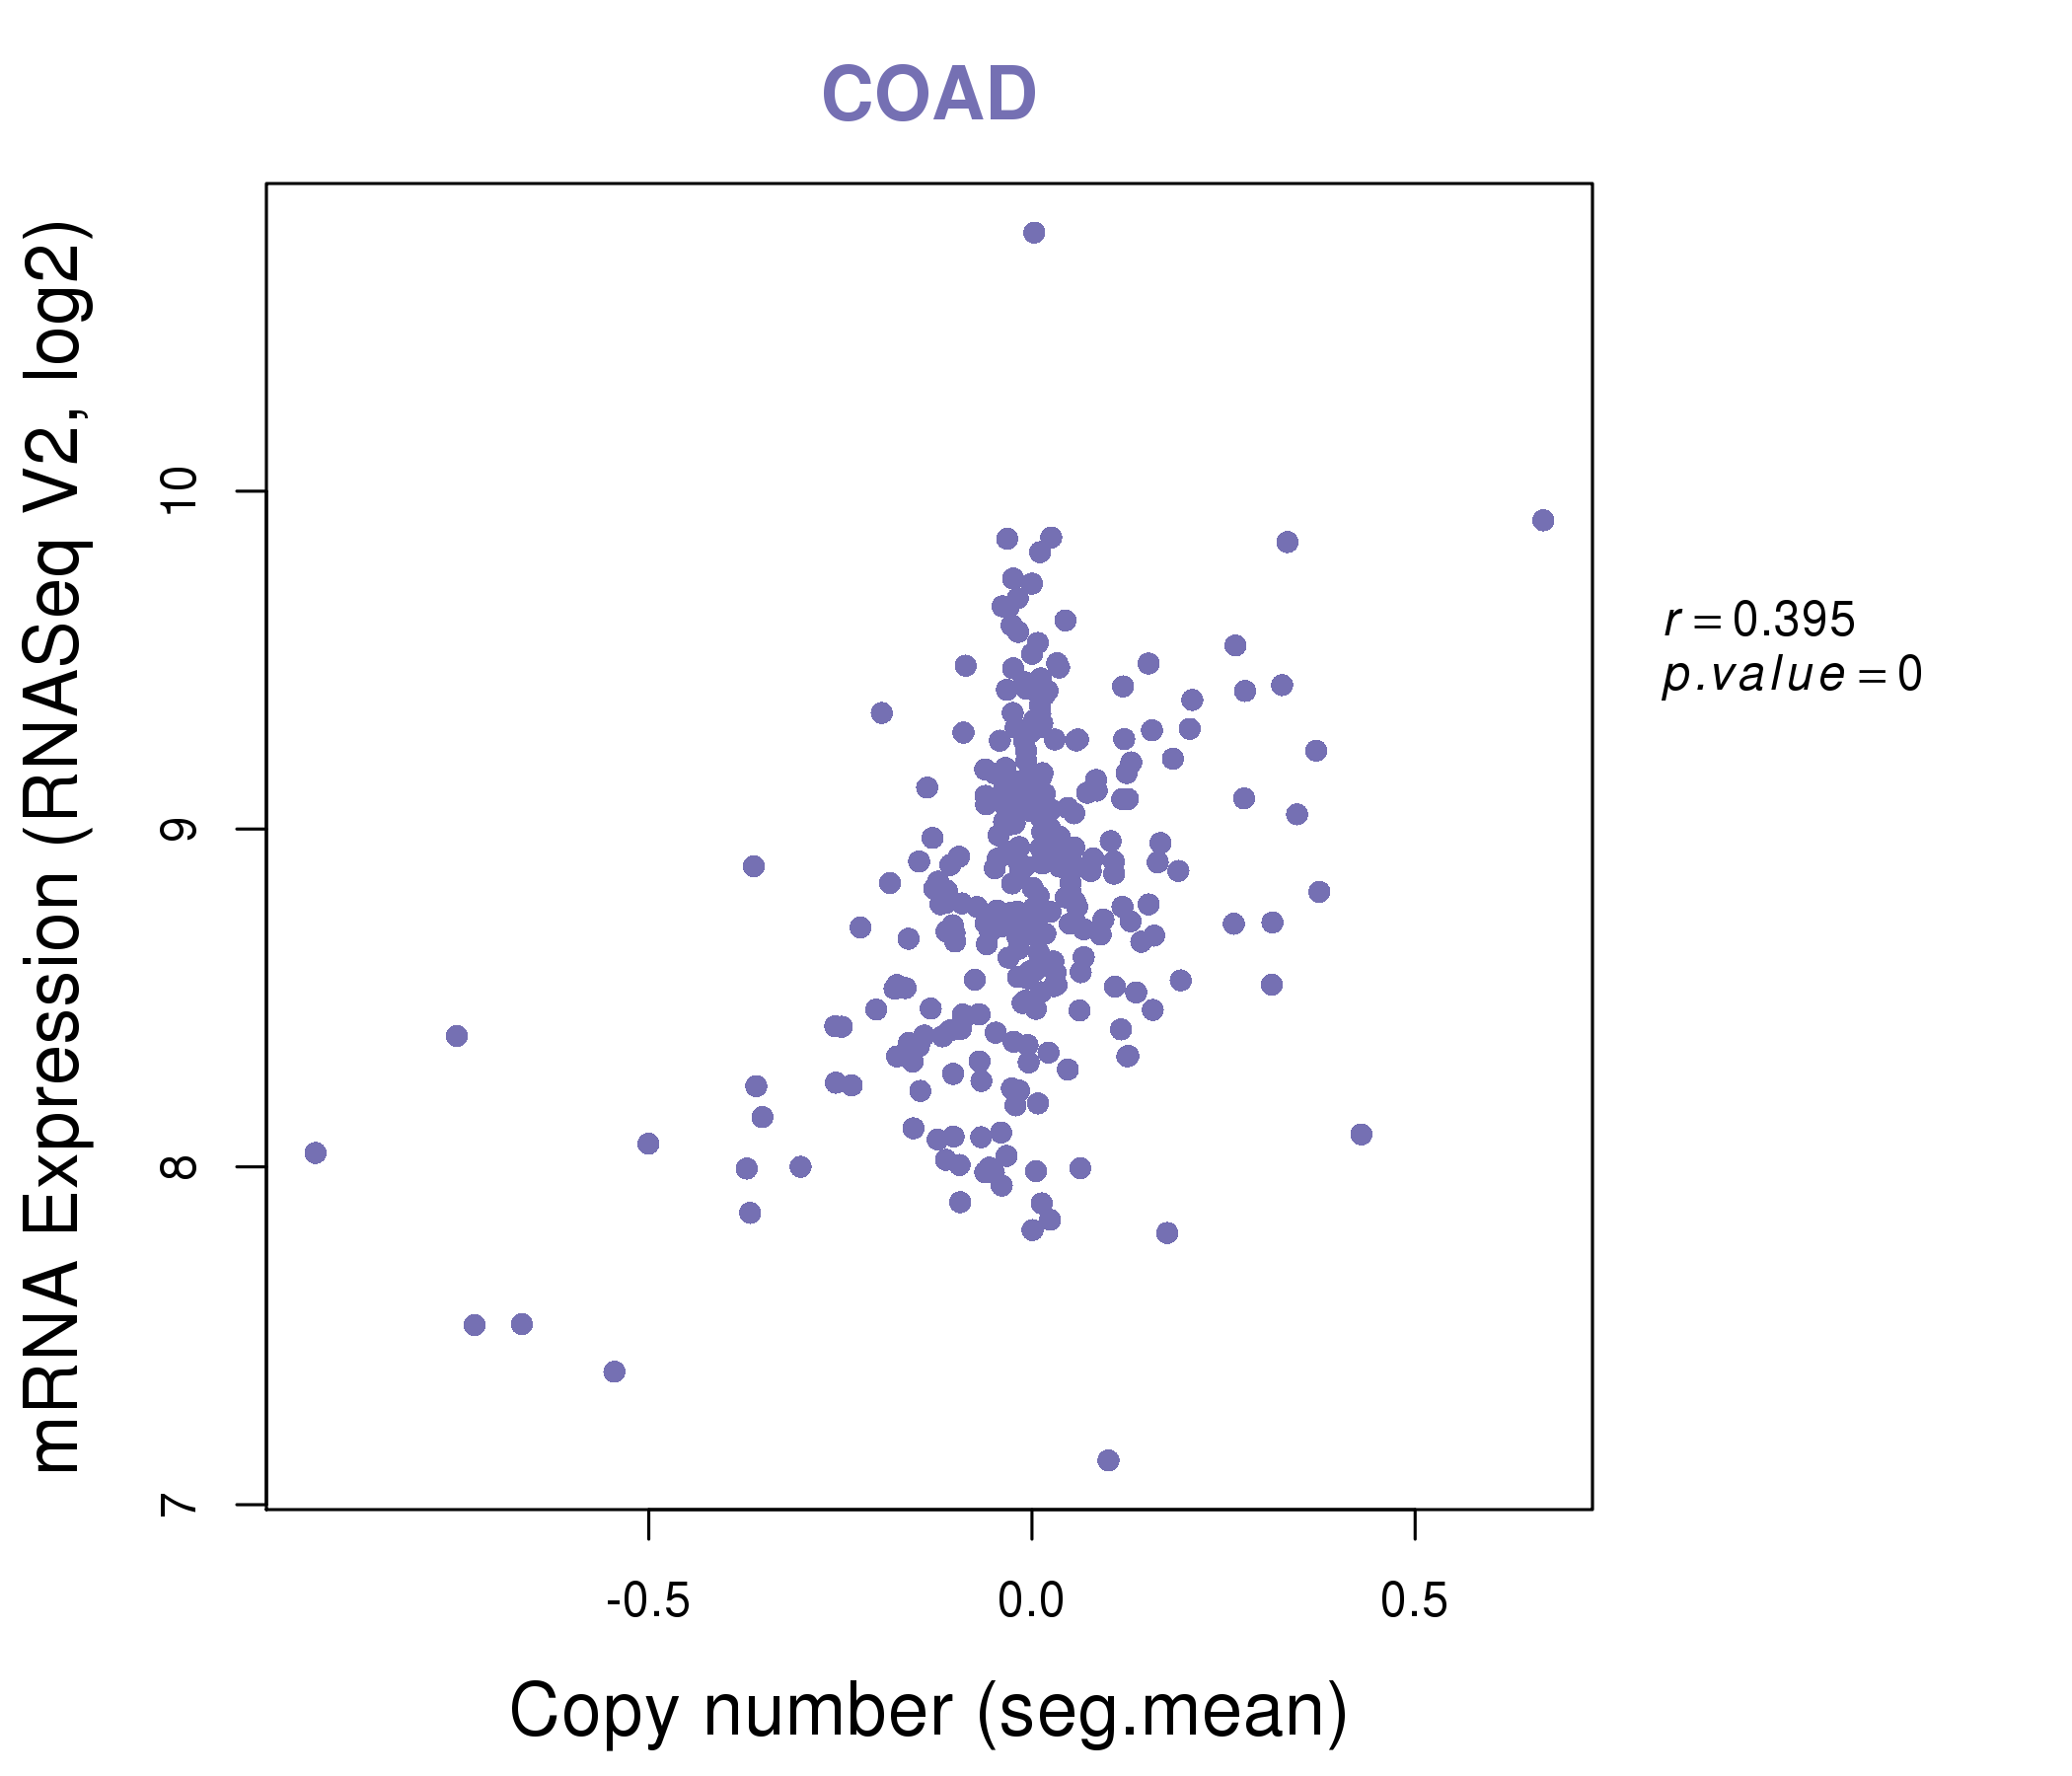
| * This plots show the correlation between CNV and gene expression. |
: Open all plots for all cancer types
 |
|
 |
|


| Top |
| Gene-Gene Network Information |
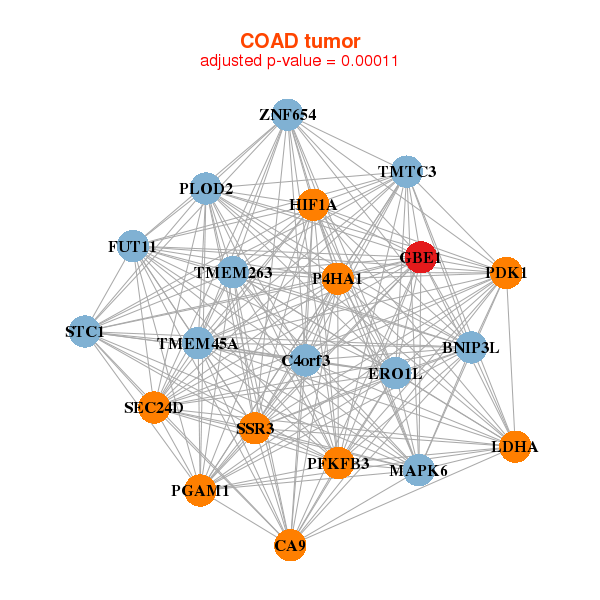
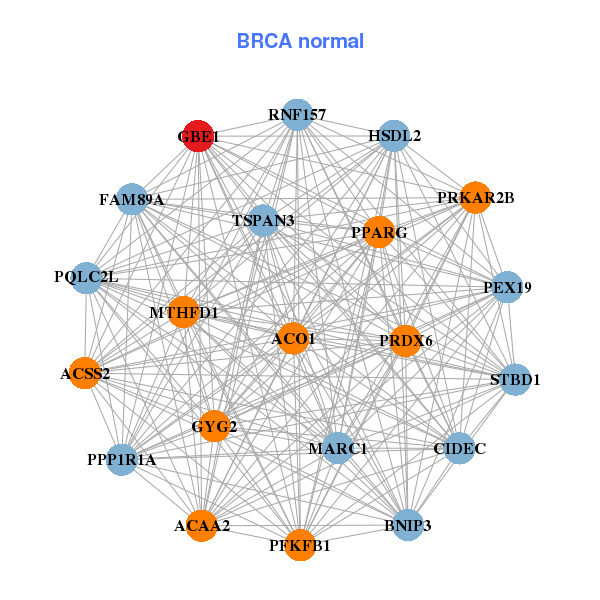
| * Co-Expression network figures were drawn using R package igraph. Only the top 20 genes with the highest correlations were shown. Red circle: input gene, orange circle: cell metabolism gene, sky circle: other gene |
: Open all plots for all cancer types
 |
| ||||
| ANO6,ATP6V1A,EOGT,CCNYL1,CD109,CHMP2B,CSGALNACT2, ERO1L,FERMT2,FNDC3B,FUT11,GBE1,ITGAV,ITGB1, KIAA1715,LIMS1,LOX,NCKAP1,P4HA1,PTPLB,ZNF654 | ACAA2,ACO1,ACSS2,BNIP3,PQLC2L,CIDEC,FAM89A, GBE1,GYG2,HSDL2,MARC1,MTHFD1,PEX19,PFKFB1, PPARG,PPP1R1A,PRDX6,PRKAR2B,RNF157,STBD1,TSPAN3 | ||||
 |
| ||||
| BNIP3L,TMEM263,C4orf3,CA9,ERO1L,FUT11,GBE1, HIF1A,LDHA,MAPK6,P4HA1,PDK1,PFKFB3,PGAM1, PLOD2,SEC24D,SSR3,STC1,TMEM45A,TMTC3,ZNF654 | ANXA2P1,CAND1,DLD,EPB41L2,FBXL17,GBE1,HNRNPK, HSPA4,IDE,INTS4P1,KIAA1279,NARS,PAK2,PARG, PPP3R1,PSMD1,RAB14,RDH8,UBE3A,UBP1,YME1L1 |
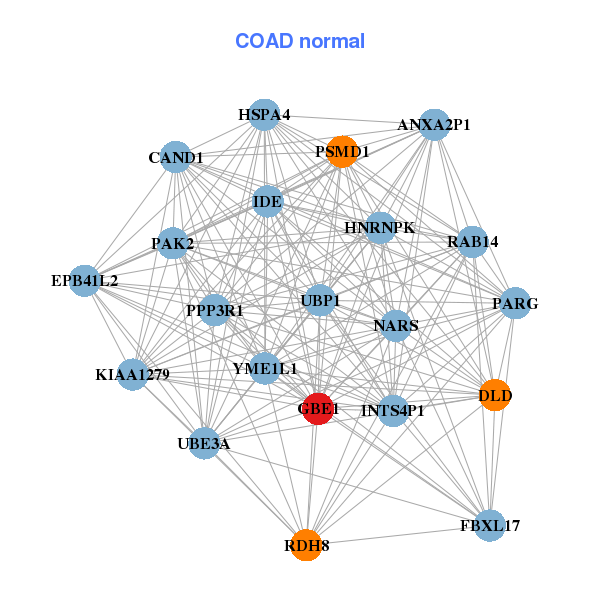
| * Co-Expression network figures were drawn using R package igraph. Only the top 20 genes with the highest correlations were shown. Red circle: input gene, orange circle: cell metabolism gene, sky circle: other gene |
: Open all plots for all cancer types
| Top |
: Open all interacting genes' information including KEGG pathway for all interacting genes from DAVID
| Top |
| Pharmacological Information for GBE1 |
| DB Category | DB Name | DB's ID and Url link |
| * Gene Centered Interaction Network. |
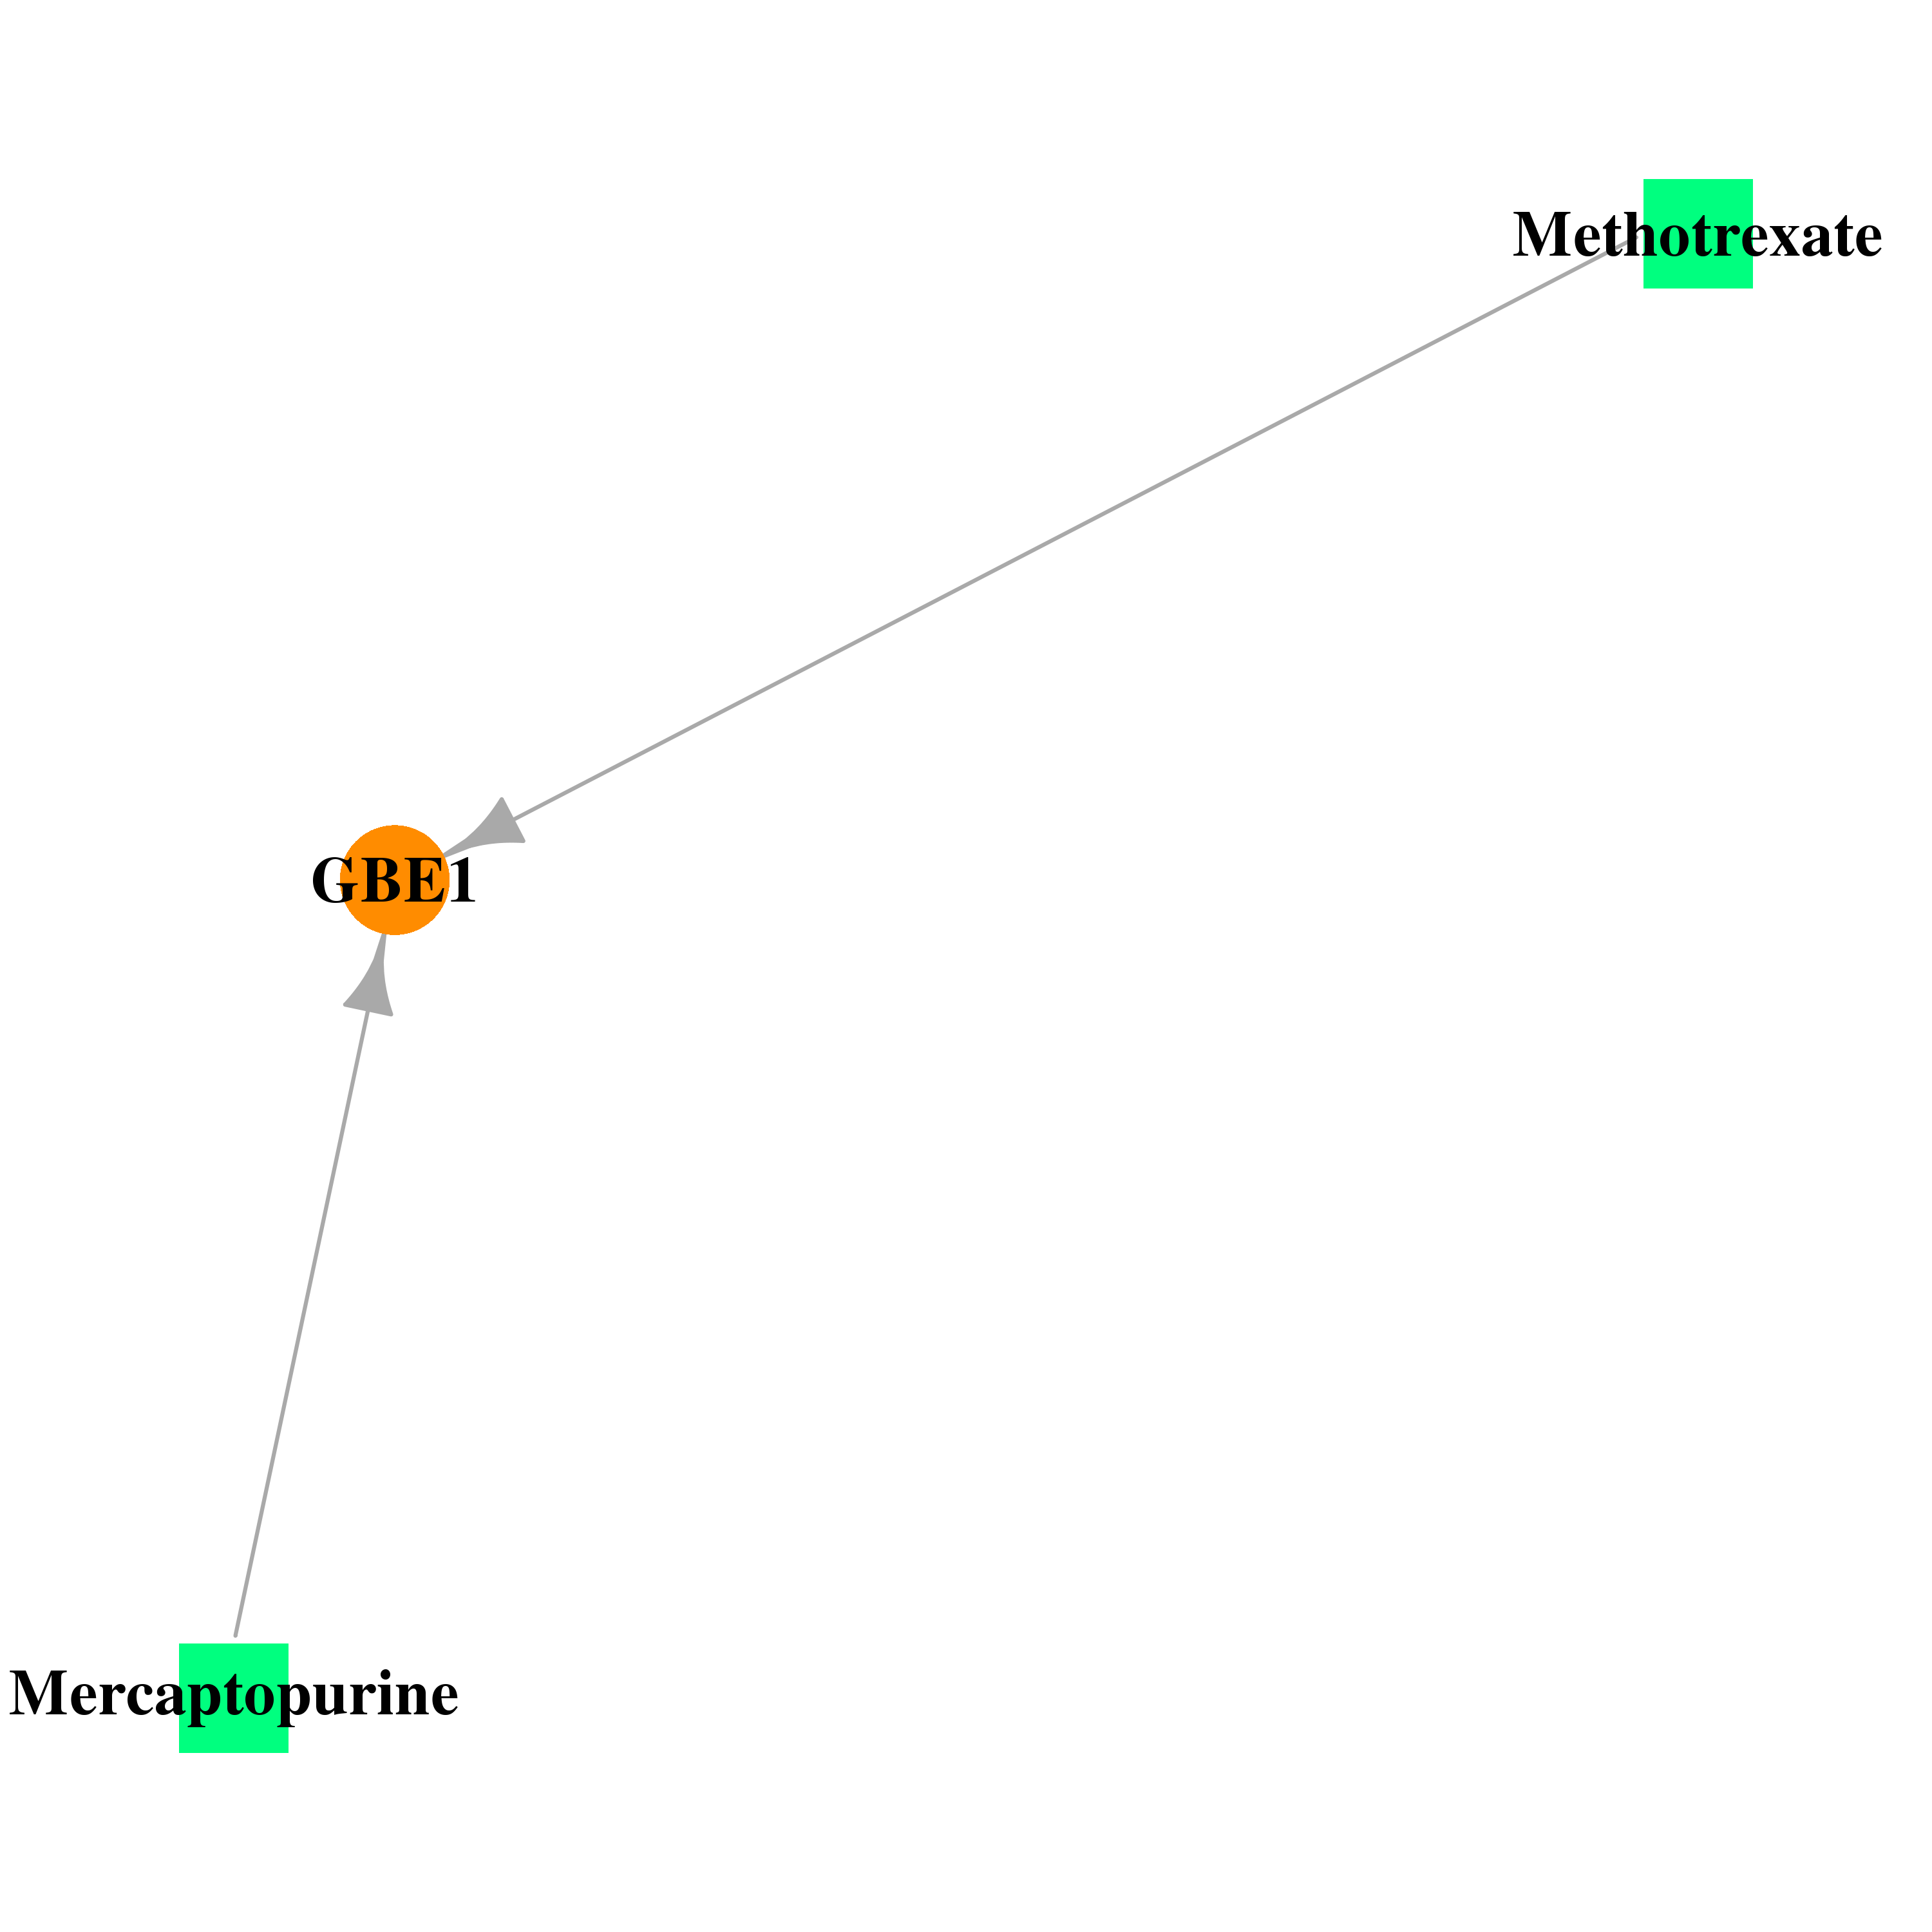 |
| * Drug Centered Interaction Network. |
| DrugBank ID | Target Name | Drug Groups | Generic Name | Drug Centered Network | Drug Structure |
| DB01033 | glucan (1,4-alpha-), branching enzyme 1 | approved | Mercaptopurine | 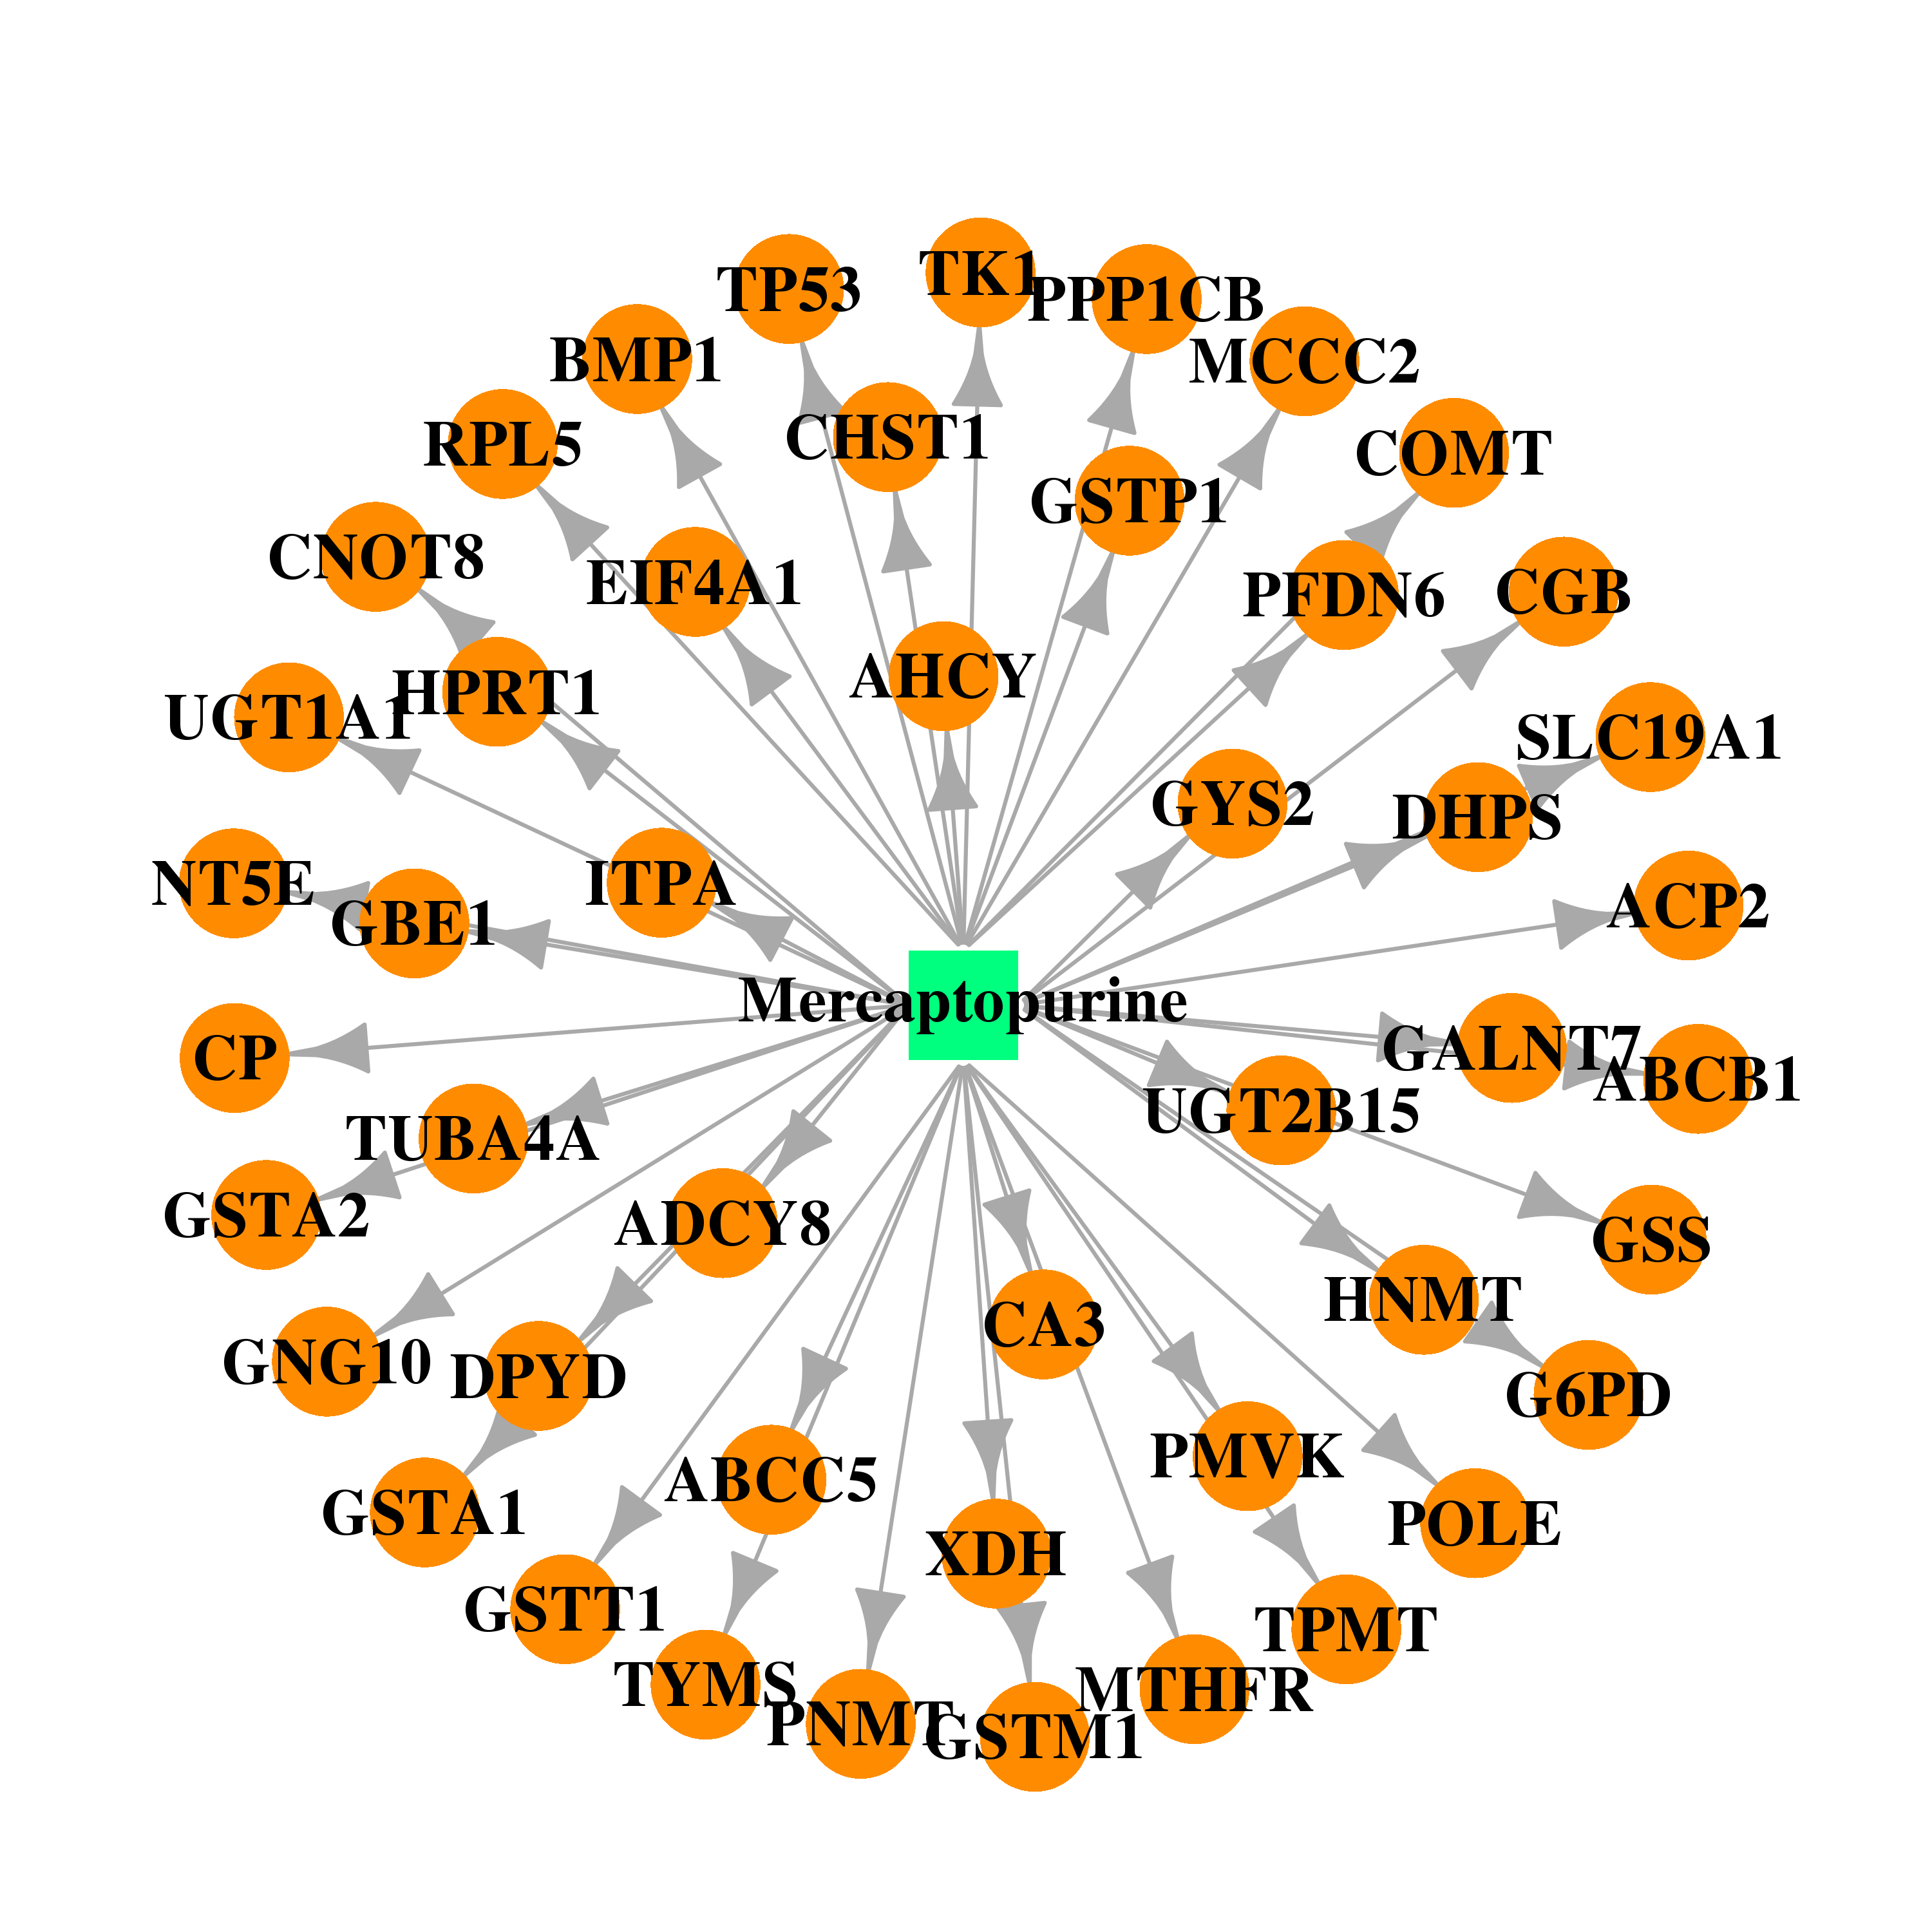 | 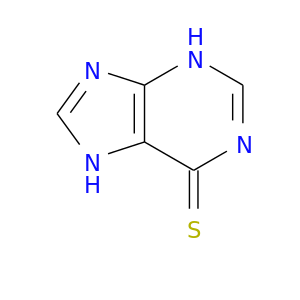 |
| DB00563 | glucan (1,4-alpha-), branching enzyme 1 | approved | Methotrexate |  |  |
| Top |
| Cross referenced IDs for GBE1 |
| * We obtained these cross-references from Uniprot database. It covers 150 different DBs, 18 categories. http://www.uniprot.org/help/cross_references_section |
: Open all cross reference information
|
Copyright © 2016-Present - The Univsersity of Texas Health Science Center at Houston @ |