|
||||||||||||||||||||||||||||||||||||||||||||||||||||||||||||||||||||||||||||||||||||||||||||||||||||||||||||||||||||||||||||||||||||||||||||||||||||||||||||||||||||||||||||||||||||||||||||||||||||||||||||||||||||||||||||||||||||||||||||||||||||||||||||||||||||||||||||||||||||||||||||||||||||||||||||||||||||||||||
| |
| Phenotypic Information (metabolism pathway, cancer, disease, phenome) |
| |
| |
| Gene-Gene Network Information: Co-Expression Network, Interacting Genes & KEGG |
| |
|


| Gene Summary for GCNT1 |
| Basic gene info. | Gene symbol | GCNT1 |
| Gene name | glucosaminyl (N-acetyl) transferase 1, core 2 | |
| Synonyms | C2GNT|C2GNT-L|C2GNT1|G6NT|NACGT2|NAGCT2 | |
| Cytomap | UCSC genome browser: 9q13 | |
| Genomic location | chr9 :79093256-79122332 | |
| Type of gene | protein-coding | |
| RefGenes | NM_001097633.1, NM_001097634.1,NM_001097635.1,NM_001097636.1,NM_001490.4, | |
| Ensembl id | ENSG00000187210 | |
| Description | beta-1,3-galactosyl-O-glycosyl-glycoprotein beta-1,6-N--acetylglucosaminyltransferasebeta-1,3-galactosyl-O-glycosyl-glycoprotein beta-1,6-N-acetylglucosaminyltransferasebeta-1,6-N-acetylglucosaminyltransferasecore 2 GnTcore 2 beta-1,6-N-acetylglucosam | |
| Modification date | 20141207 | |
| dbXrefs | MIM : 600391 | |
| HGNC : HGNC | ||
| Ensembl : ENSG00000187210 | ||
| HPRD : 02669 | ||
| Vega : OTTHUMG00000020044 | ||
| Protein | UniProt: go to UniProt's Cross Reference DB Table | |
| Expression | CleanEX: HS_GCNT1 | |
| BioGPS: 2650 | ||
| Gene Expression Atlas: ENSG00000187210 | ||
| The Human Protein Atlas: ENSG00000187210 | ||
| Pathway | NCI Pathway Interaction Database: GCNT1 | |
| KEGG: GCNT1 | ||
| REACTOME: GCNT1 | ||
| ConsensusPathDB | ||
| Pathway Commons: GCNT1 | ||
| Metabolism | MetaCyc: GCNT1 | |
| HUMANCyc: GCNT1 | ||
| Regulation | Ensembl's Regulation: ENSG00000187210 | |
| miRBase: chr9 :79,093,256-79,122,332 | ||
| TargetScan: NM_001097633 | ||
| cisRED: ENSG00000187210 | ||
| Context | iHOP: GCNT1 | |
| cancer metabolism search in PubMed: GCNT1 | ||
| UCL Cancer Institute: GCNT1 | ||
| Assigned class in ccmGDB | C | |
| Top |
| Phenotypic Information for GCNT1(metabolism pathway, cancer, disease, phenome) |
| Cancer | CGAP: GCNT1 |
| Familial Cancer Database: GCNT1 | |
| * This gene is included in those cancer gene databases. |
|
|
|
|
|
| . | ||||||||||||||||||||||||||||||||||||||||||||||||||||||||||||||||||||||||||||||||||||||||||||||||||||||||||||||||||||||||||||||||||||||||||||||||||||||||||||||||||||||||||||||||||||||||||||||||||||||||||||||||||||||||||||||||||||||||||||||||||||||||||||||||||||||||||||||||||||||||||||||||||||||||||||||||||||
Oncogene 1 | Significant driver gene in | |||||||||||||||||||||||||||||||||||||||||||||||||||||||||||||||||||||||||||||||||||||||||||||||||||||||||||||||||||||||||||||||||||||||||||||||||||||||||||||||||||||||||||||||||||||||||||||||||||||||||||||||||||||||||||||||||||||||||||||||||||||||||||||||||||||||||||||||||||||||||||||||||||||||||||||||||||||||||
| cf) number; DB name 1 Oncogene; http://nar.oxfordjournals.org/content/35/suppl_1/D721.long, 2 Tumor Suppressor gene; https://bioinfo.uth.edu/TSGene/, 3 Cancer Gene Census; http://www.nature.com/nrc/journal/v4/n3/abs/nrc1299.html, 4 CancerGenes; http://nar.oxfordjournals.org/content/35/suppl_1/D721.long, 5 Network of Cancer Gene; http://ncg.kcl.ac.uk/index.php, 1Therapeutic Vulnerabilities in Cancer; http://cbio.mskcc.org/cancergenomics/statius/ |
| REACTOME_METABOLISM_OF_PROTEINS | |
| OMIM | |
| Orphanet | |
| Disease | KEGG Disease: GCNT1 |
| MedGen: GCNT1 (Human Medical Genetics with Condition) | |
| ClinVar: GCNT1 | |
| Phenotype | MGI: GCNT1 (International Mouse Phenotyping Consortium) |
| PhenomicDB: GCNT1 | |
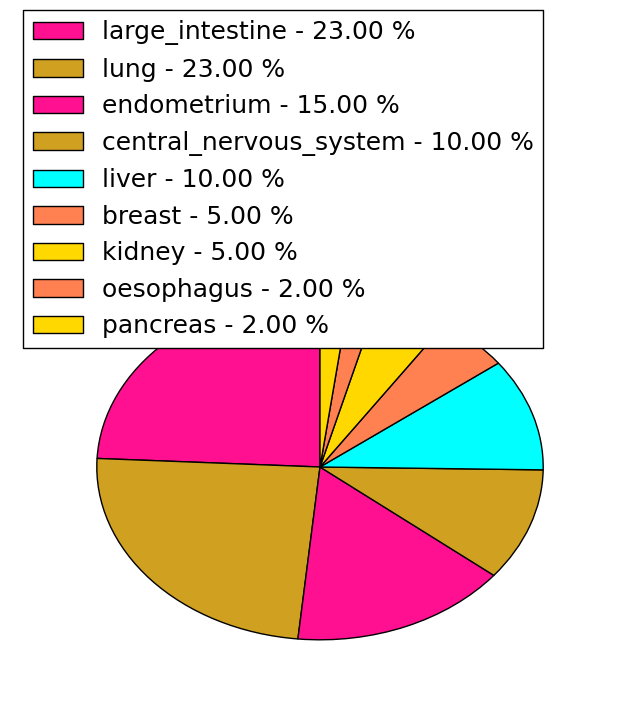
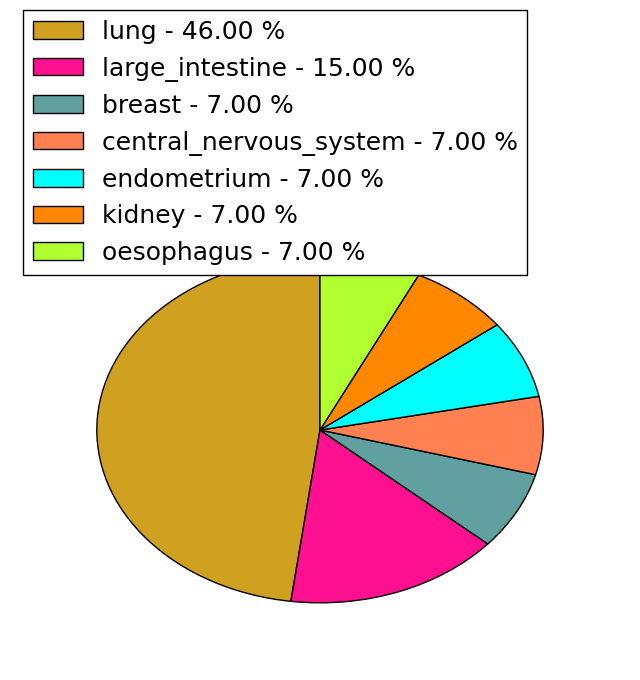
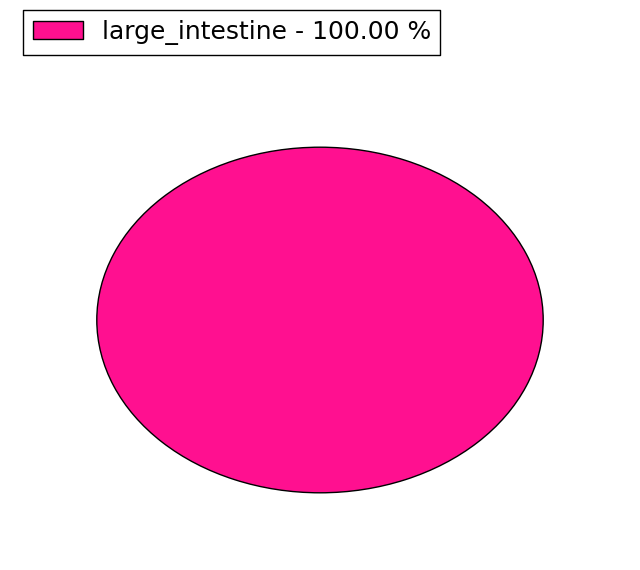
| Mutations for GCNT1 |
| * Under tables are showing count per each tissue to give us broad intuition about tissue specific mutation patterns.You can go to the detailed page for each mutation database's web site. |
| There's no structural variation information in COSMIC data for this gene. |
| * From mRNA Sanger sequences, Chitars2.0 arranged chimeric transcripts. This table shows GCNT1 related fusion information. |
| ID | Head Gene | Tail Gene | Accession | Gene_a | qStart_a | qEnd_a | Chromosome_a | tStart_a | tEnd_a | Gene_a | qStart_a | qEnd_a | Chromosome_a | tStart_a | tEnd_a |
| AJ299263 | KAT6B | 1 | 319 | 10 | 76785938 | 76786654 | GCNT1 | 300 | 390 | 9 | 79042644 | 79043011 | |
| Top |
| Mutation type/ Tissue ID | brca | cns | cerv | endome | haematopo | kidn | Lintest | liver | lung | ns | ovary | pancre | prost | skin | stoma | thyro | urina | |||
| Total # sample | 1 | |||||||||||||||||||
| GAIN (# sample) | ||||||||||||||||||||
| LOSS (# sample) | 1 |
| cf) Tissue ID; Tissue type (1; Breast, 2; Central_nervous_system, 3; Cervix, 4; Endometrium, 5; Haematopoietic_and_lymphoid_tissue, 6; Kidney, 7; Large_intestine, 8; Liver, 9; Lung, 10; NS, 11; Ovary, 12; Pancreas, 13; Prostate, 14; Skin, 15; Stomach, 16; Thyroid, 17; Urinary_tract) |
| Top |
|
 |
| Top |
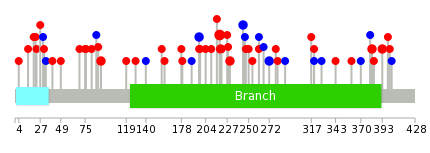
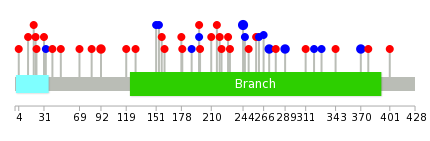
| Stat. for Non-Synonymous SNVs (# total SNVs=38) | (# total SNVs=13) |
 |  |
(# total SNVs=0) | (# total SNVs=1) |
 |
| Top |
| * When you move the cursor on each content, you can see more deailed mutation information on the Tooltip. Those are primary_site,primary_histology,mutation(aa),pubmedID. |
| GRCh37 position | Mutation(aa) | Unique sampleID count |
| chr9:79117954-79117954 | p.M219I | 4 |
| chr9:79118132-79118132 | p.E279K | 3 |
| chr9:79118113-79118113 | p.V272V | 2 |
| chr9:79117986-79117986 | p.V230A | 2 |
| chr9:79117888-79117888 | p.L197L | 2 |
| chr9:79118441-79118441 | p.I382V | 2 |
| chr9:79118029-79118029 | p.T244T | 2 |
| chr9:79117571-79117571 | p.D92N | 2 |
| chr9:79118475-79118475 | p.R393H | 2 |
| chr9:79117955-79117955 | p.D220N | 2 |
| Top |
|
 |
| Point Mutation/ Tissue ID | 1 | 2 | 3 | 4 | 5 | 6 | 7 | 8 | 9 | 10 | 11 | 12 | 13 | 14 | 15 | 16 | 17 | 18 | 19 | 20 |
| # sample | 1 | 10 | 1 | 2 | 2 | 10 | 3 | 11 | 2 | 6 | ||||||||||
| # mutation | 1 | 10 | 1 | 2 | 2 | 10 | 4 | 11 | 2 | 6 | ||||||||||
| nonsynonymous SNV | 1 | 8 | 1 | 1 | 5 | 4 | 7 | 1 | 5 | |||||||||||
| synonymous SNV | 2 | 2 | 1 | 5 | 4 | 1 | 1 |
| cf) Tissue ID; Tissue type (1; BLCA[Bladder Urothelial Carcinoma], 2; BRCA[Breast invasive carcinoma], 3; CESC[Cervical squamous cell carcinoma and endocervical adenocarcinoma], 4; COAD[Colon adenocarcinoma], 5; GBM[Glioblastoma multiforme], 6; Glioma Low Grade, 7; HNSC[Head and Neck squamous cell carcinoma], 8; KICH[Kidney Chromophobe], 9; KIRC[Kidney renal clear cell carcinoma], 10; KIRP[Kidney renal papillary cell carcinoma], 11; LAML[Acute Myeloid Leukemia], 12; LUAD[Lung adenocarcinoma], 13; LUSC[Lung squamous cell carcinoma], 14; OV[Ovarian serous cystadenocarcinoma ], 15; PAAD[Pancreatic adenocarcinoma], 16; PRAD[Prostate adenocarcinoma], 17; SKCM[Skin Cutaneous Melanoma], 18:STAD[Stomach adenocarcinoma], 19:THCA[Thyroid carcinoma], 20:UCEC[Uterine Corpus Endometrial Carcinoma]) |
| Top |
| * We represented just top 10 SNVs. When you move the cursor on each content, you can see more deailed mutation information on the Tooltip. Those are primary_site, primary_histology, mutation(aa), pubmedID. |
| Genomic Position | Mutation(aa) | Unique sampleID count |
| chr9:79118029 | p.T244T,GCNT1 | 3 |
| chr9:79118113 | p.D92N,GCNT1 | 2 |
| chr9:79118164 | p.P370P,GCNT1 | 2 |
| chr9:79117571 | p.V272V,GCNT1 | 2 |
| chr9:79118407 | p.F289F,GCNT1 | 2 |
| chr9:79117750 | p.F82C,GCNT1 | 1 |
| chr9:79117943 | p.M219I,GCNT1 | 1 |
| chr9:79117365 | p.D343G,GCNT1 | 1 |
| chr9:79117759 | p.F221C,GCNT1 | 1 |
| chr9:79117954 | p.A119T,GCNT1 | 1 |
| * Copy number data were extracted from TCGA using R package TCGA-Assembler. The URLs of all public data files on TCGA DCC data server were gathered on Jan-05-2015. Function ProcessCNAData in TCGA-Assembler package was used to obtain gene-level copy number value which is calculated as the average copy number of the genomic region of a gene. |
 |
| cf) Tissue ID[Tissue type]: BLCA[Bladder Urothelial Carcinoma], BRCA[Breast invasive carcinoma], CESC[Cervical squamous cell carcinoma and endocervical adenocarcinoma], COAD[Colon adenocarcinoma], GBM[Glioblastoma multiforme], Glioma Low Grade, HNSC[Head and Neck squamous cell carcinoma], KICH[Kidney Chromophobe], KIRC[Kidney renal clear cell carcinoma], KIRP[Kidney renal papillary cell carcinoma], LAML[Acute Myeloid Leukemia], LUAD[Lung adenocarcinoma], LUSC[Lung squamous cell carcinoma], OV[Ovarian serous cystadenocarcinoma ], PAAD[Pancreatic adenocarcinoma], PRAD[Prostate adenocarcinoma], SKCM[Skin Cutaneous Melanoma], STAD[Stomach adenocarcinoma], THCA[Thyroid carcinoma], UCEC[Uterine Corpus Endometrial Carcinoma] |
| Top |
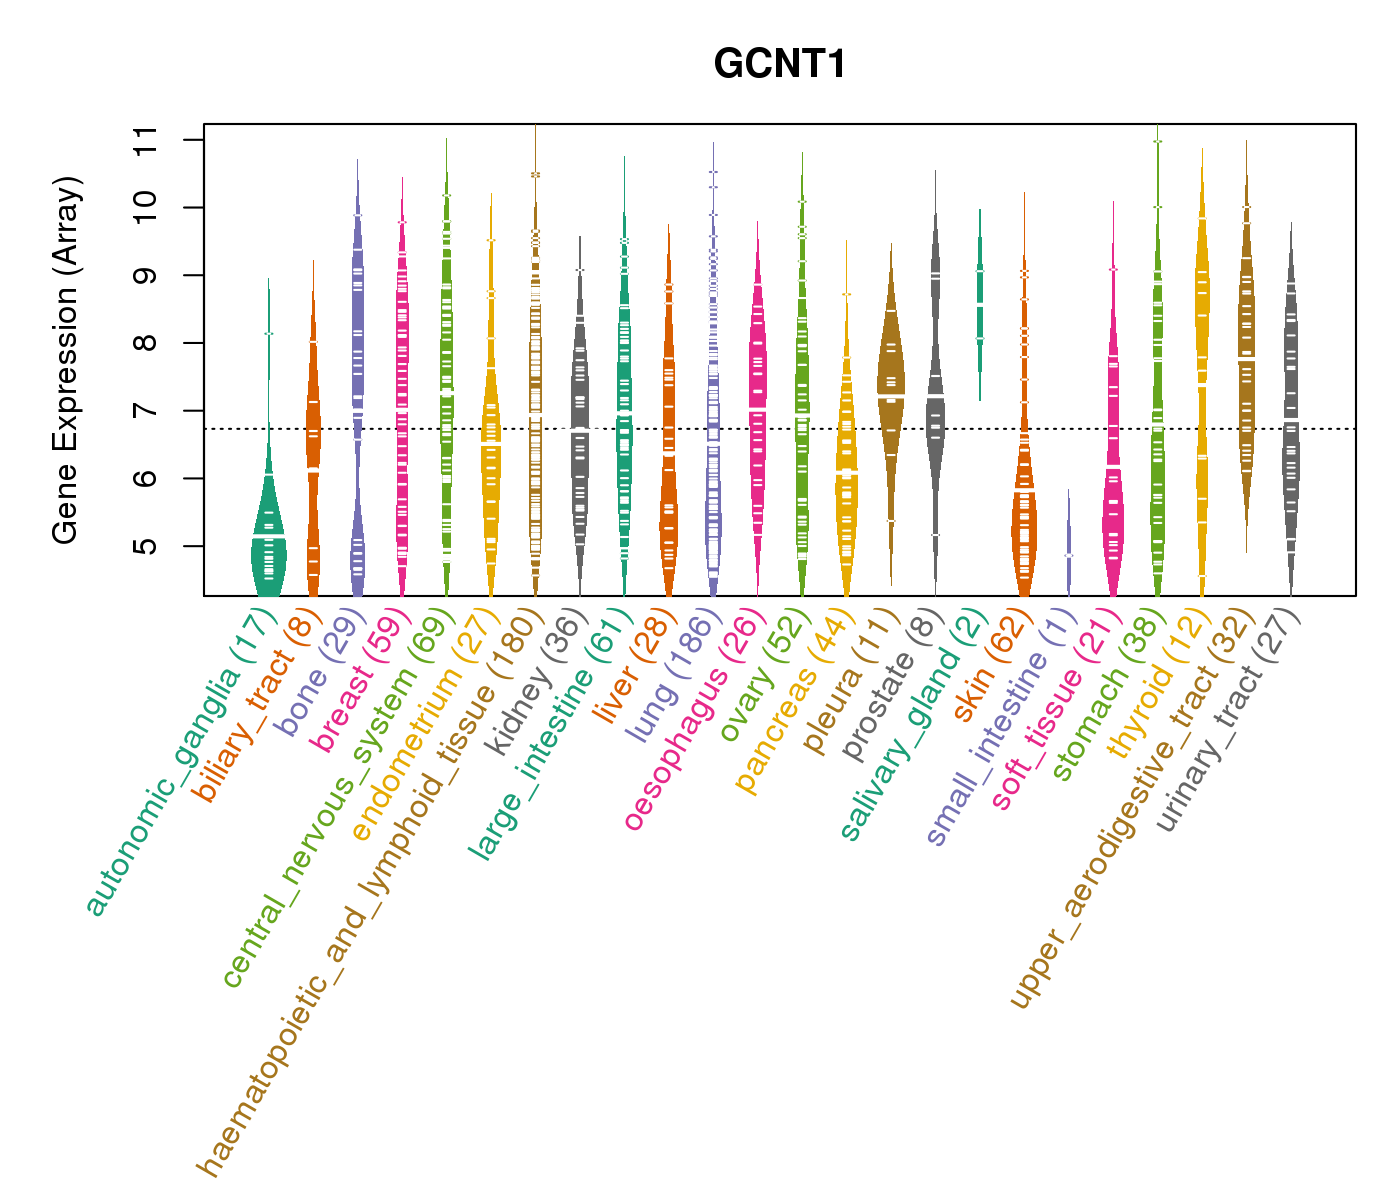
| Gene Expression for GCNT1 |
| * CCLE gene expression data were extracted from CCLE_Expression_Entrez_2012-10-18.res: Gene-centric RMA-normalized mRNA expression data. |
 |
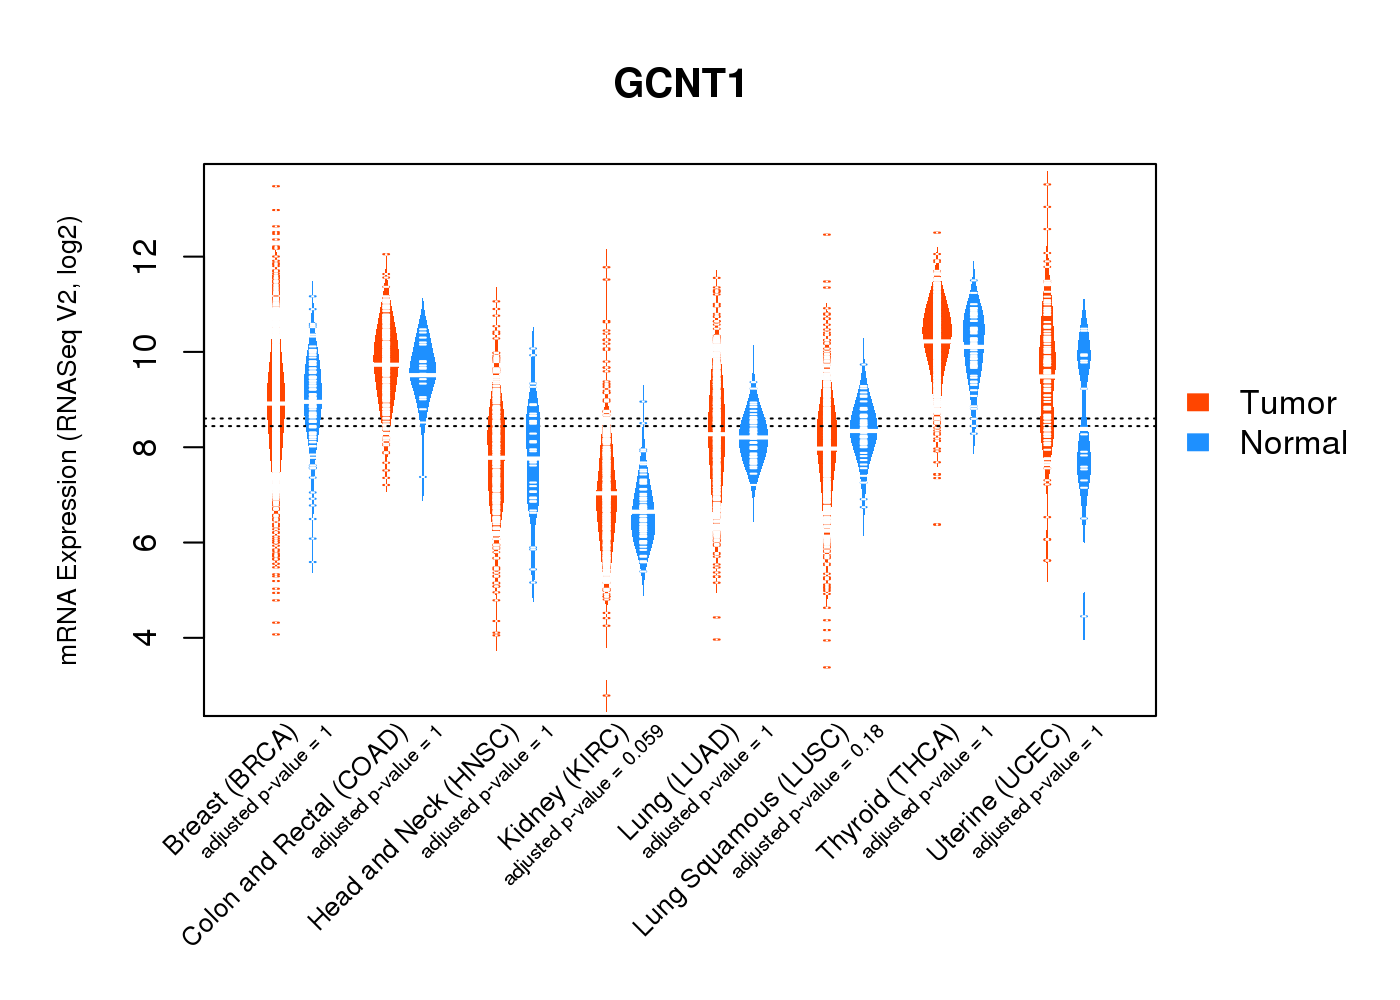
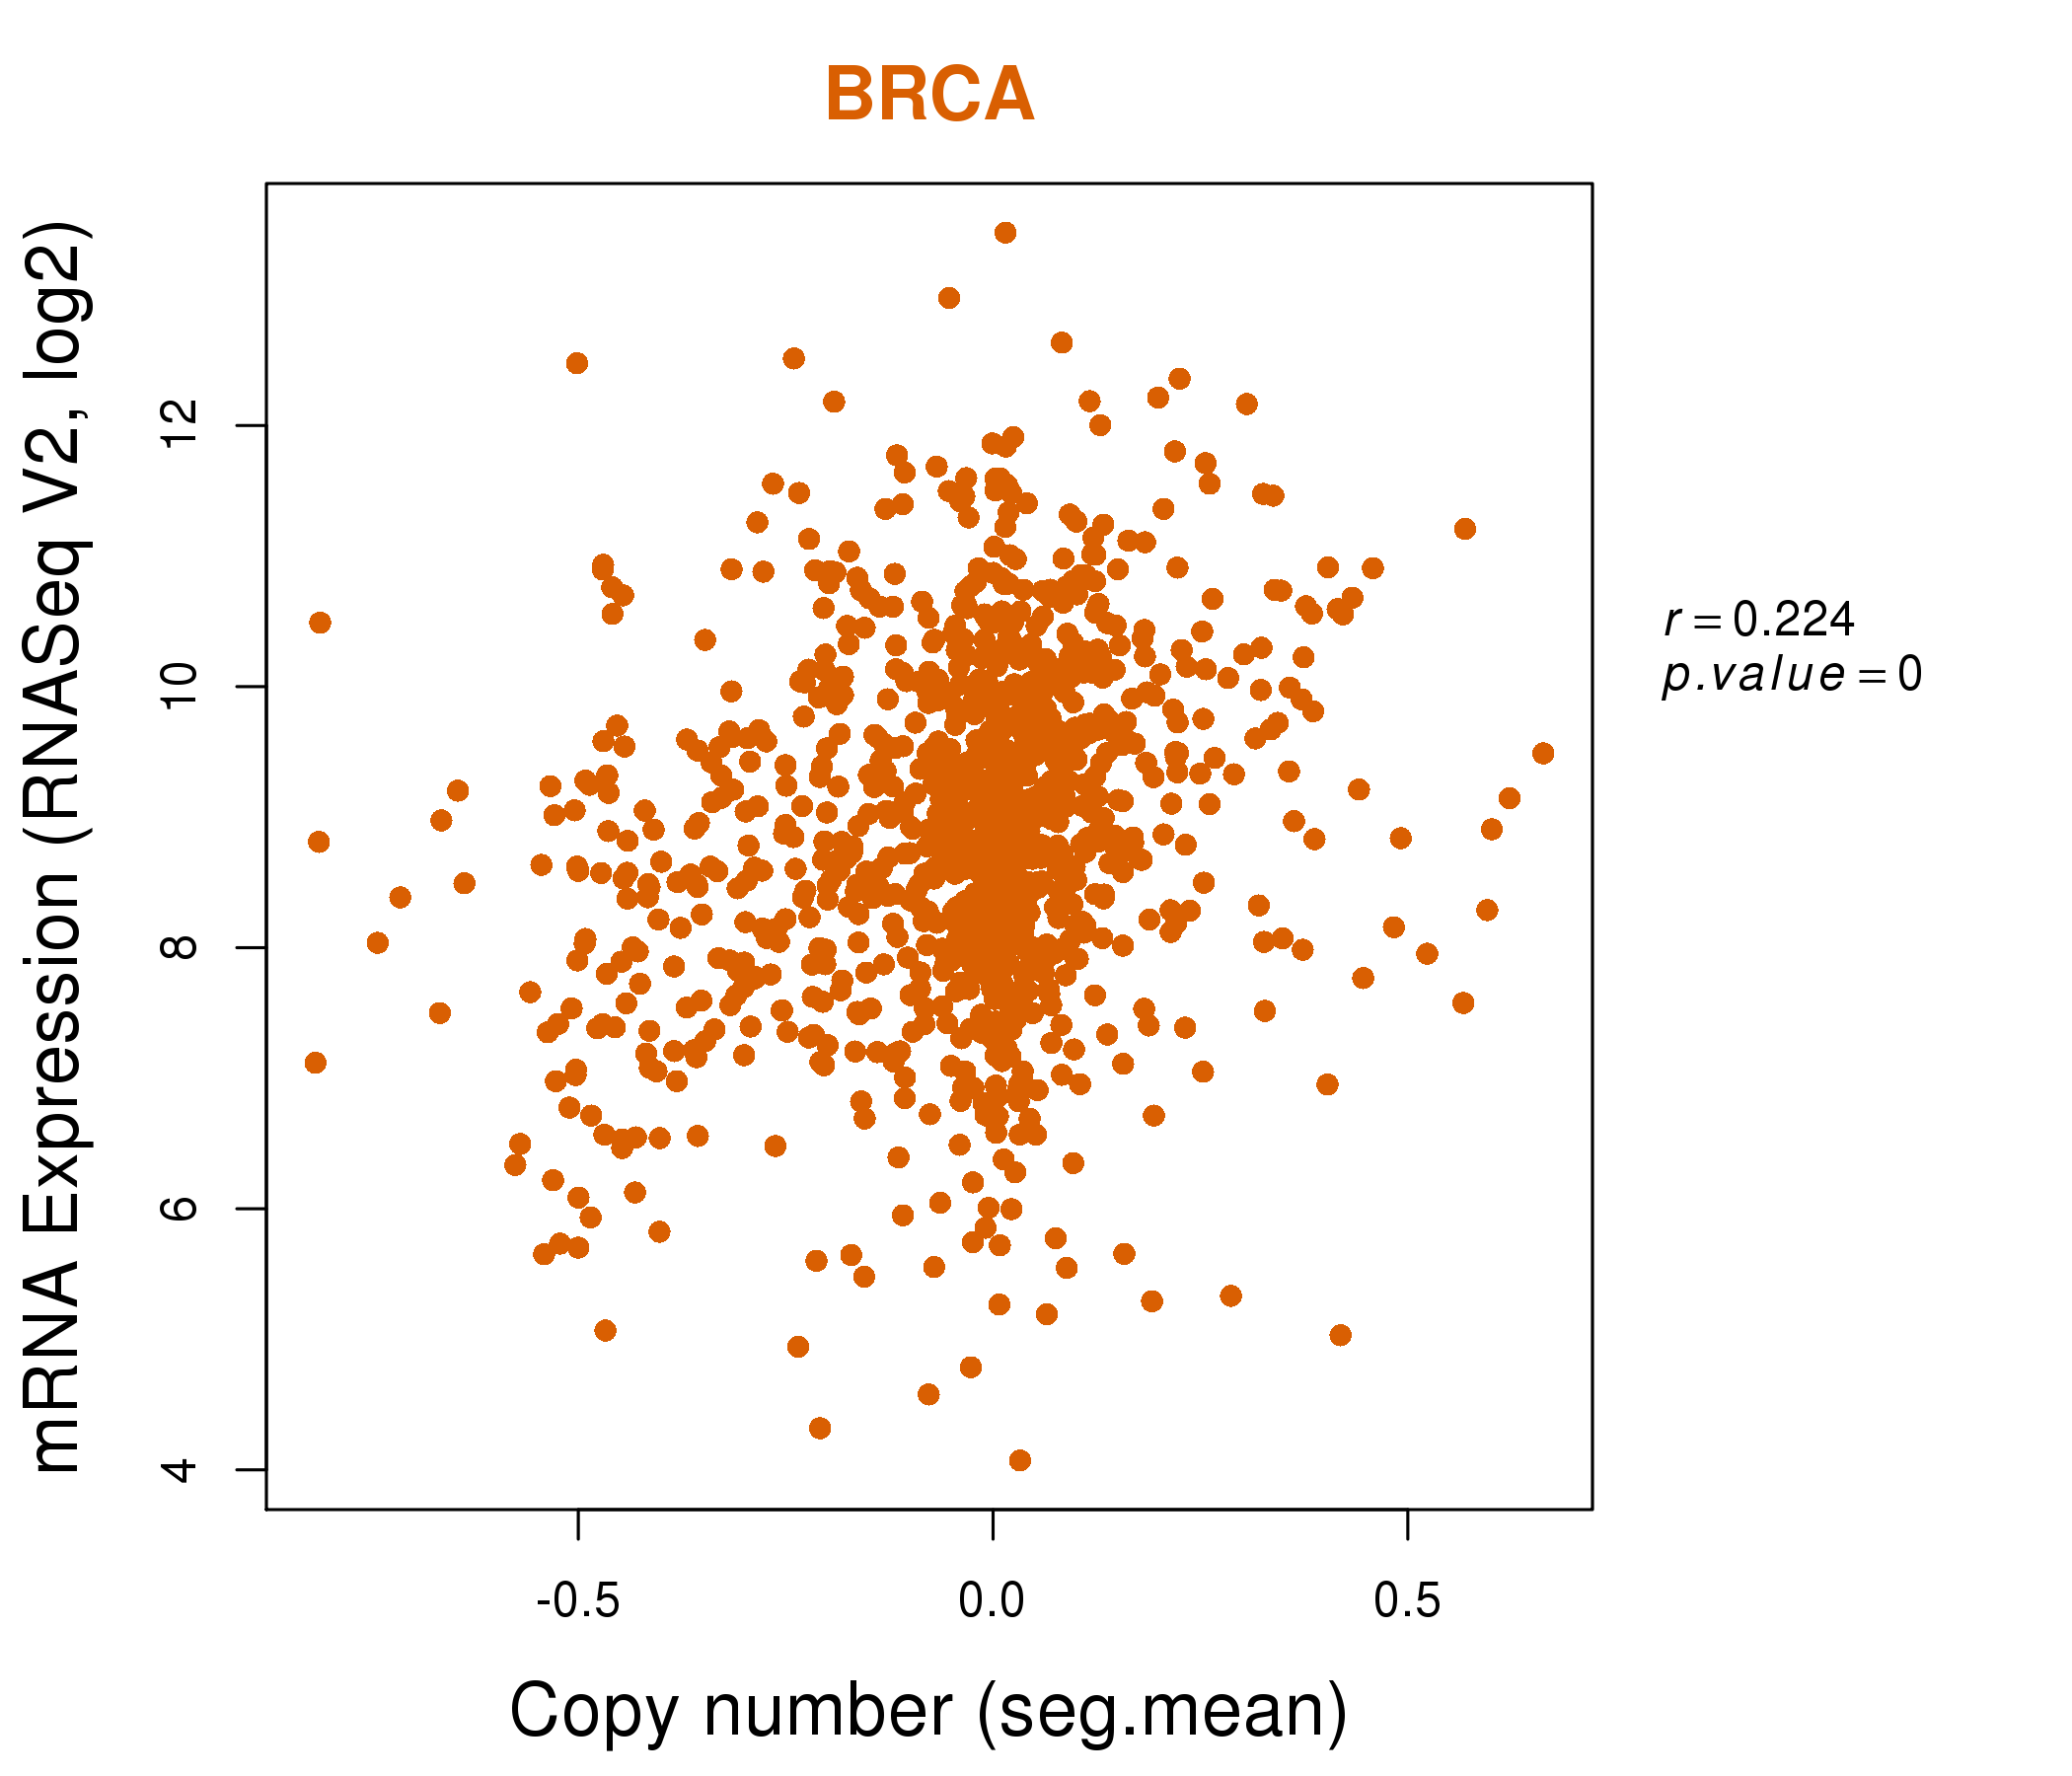
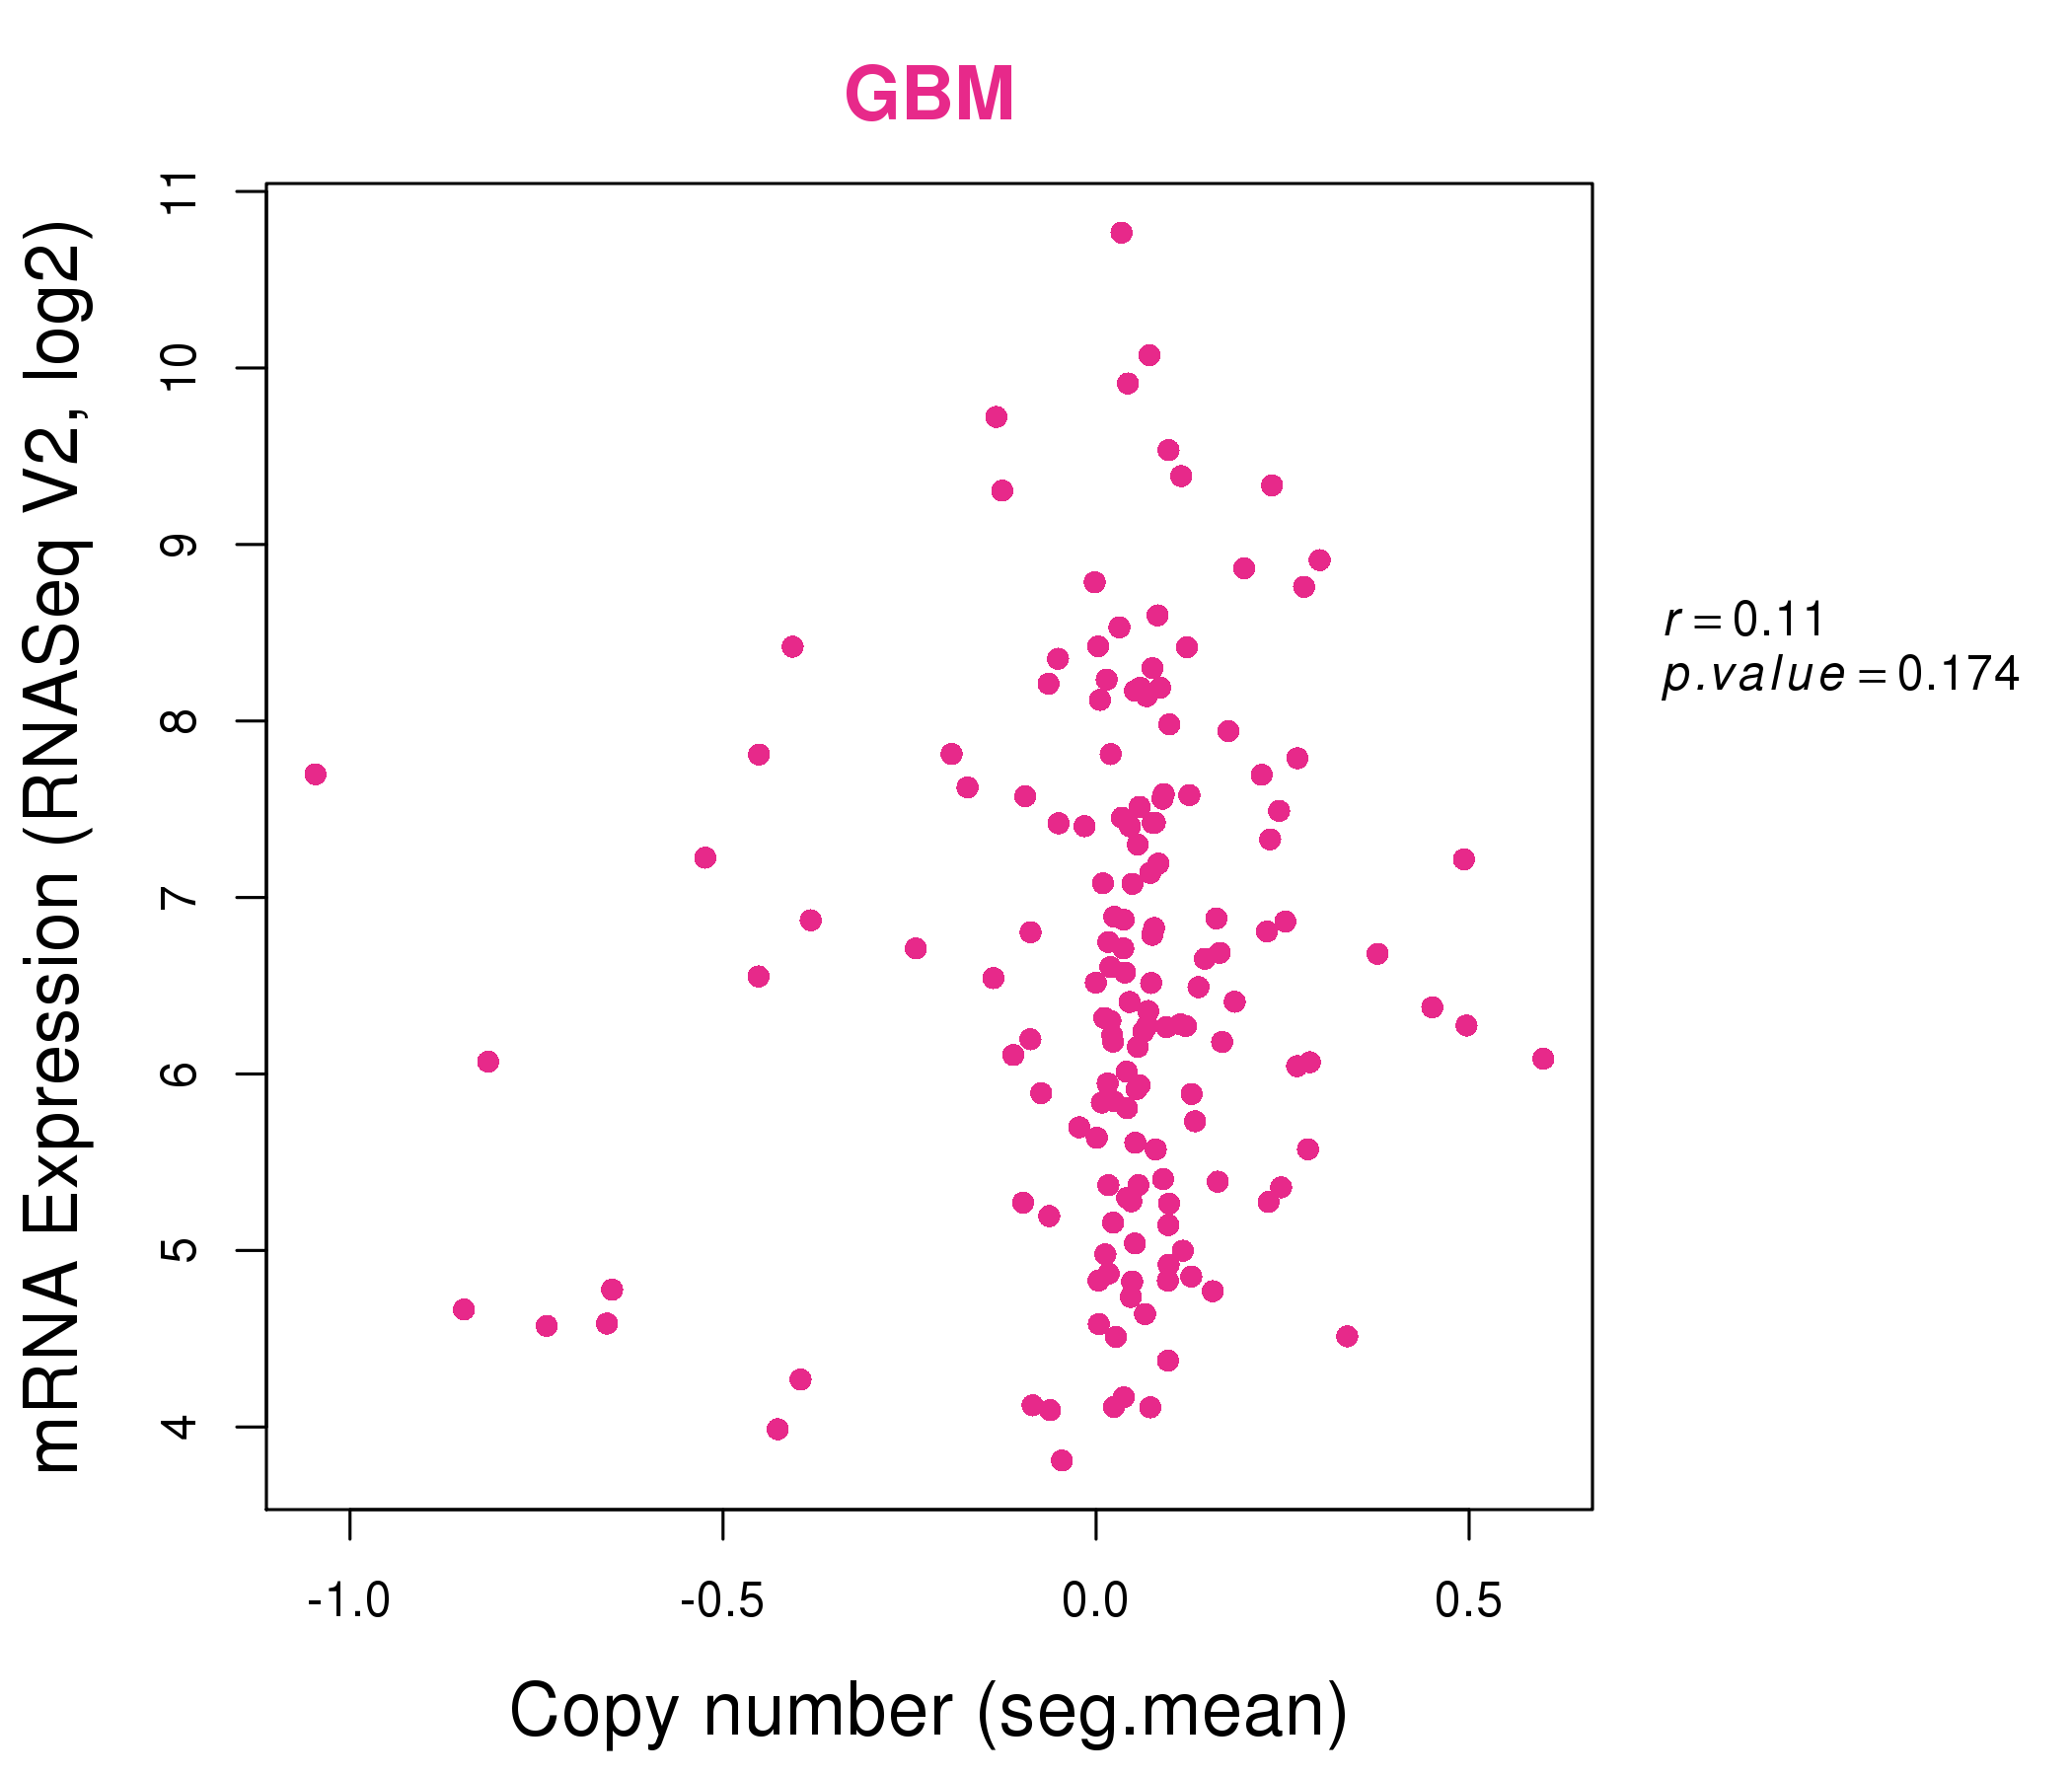
| * Normalized gene expression data of RNASeqV2 was extracted from TCGA using R package TCGA-Assembler. The URLs of all public data files on TCGA DCC data server were gathered at Jan-05-2015. Only eight cancer types have enough normal control samples for differential expression analysis. (t test, adjusted p<0.05 (using Benjamini-Hochberg FDR)) |
 |
| Top |
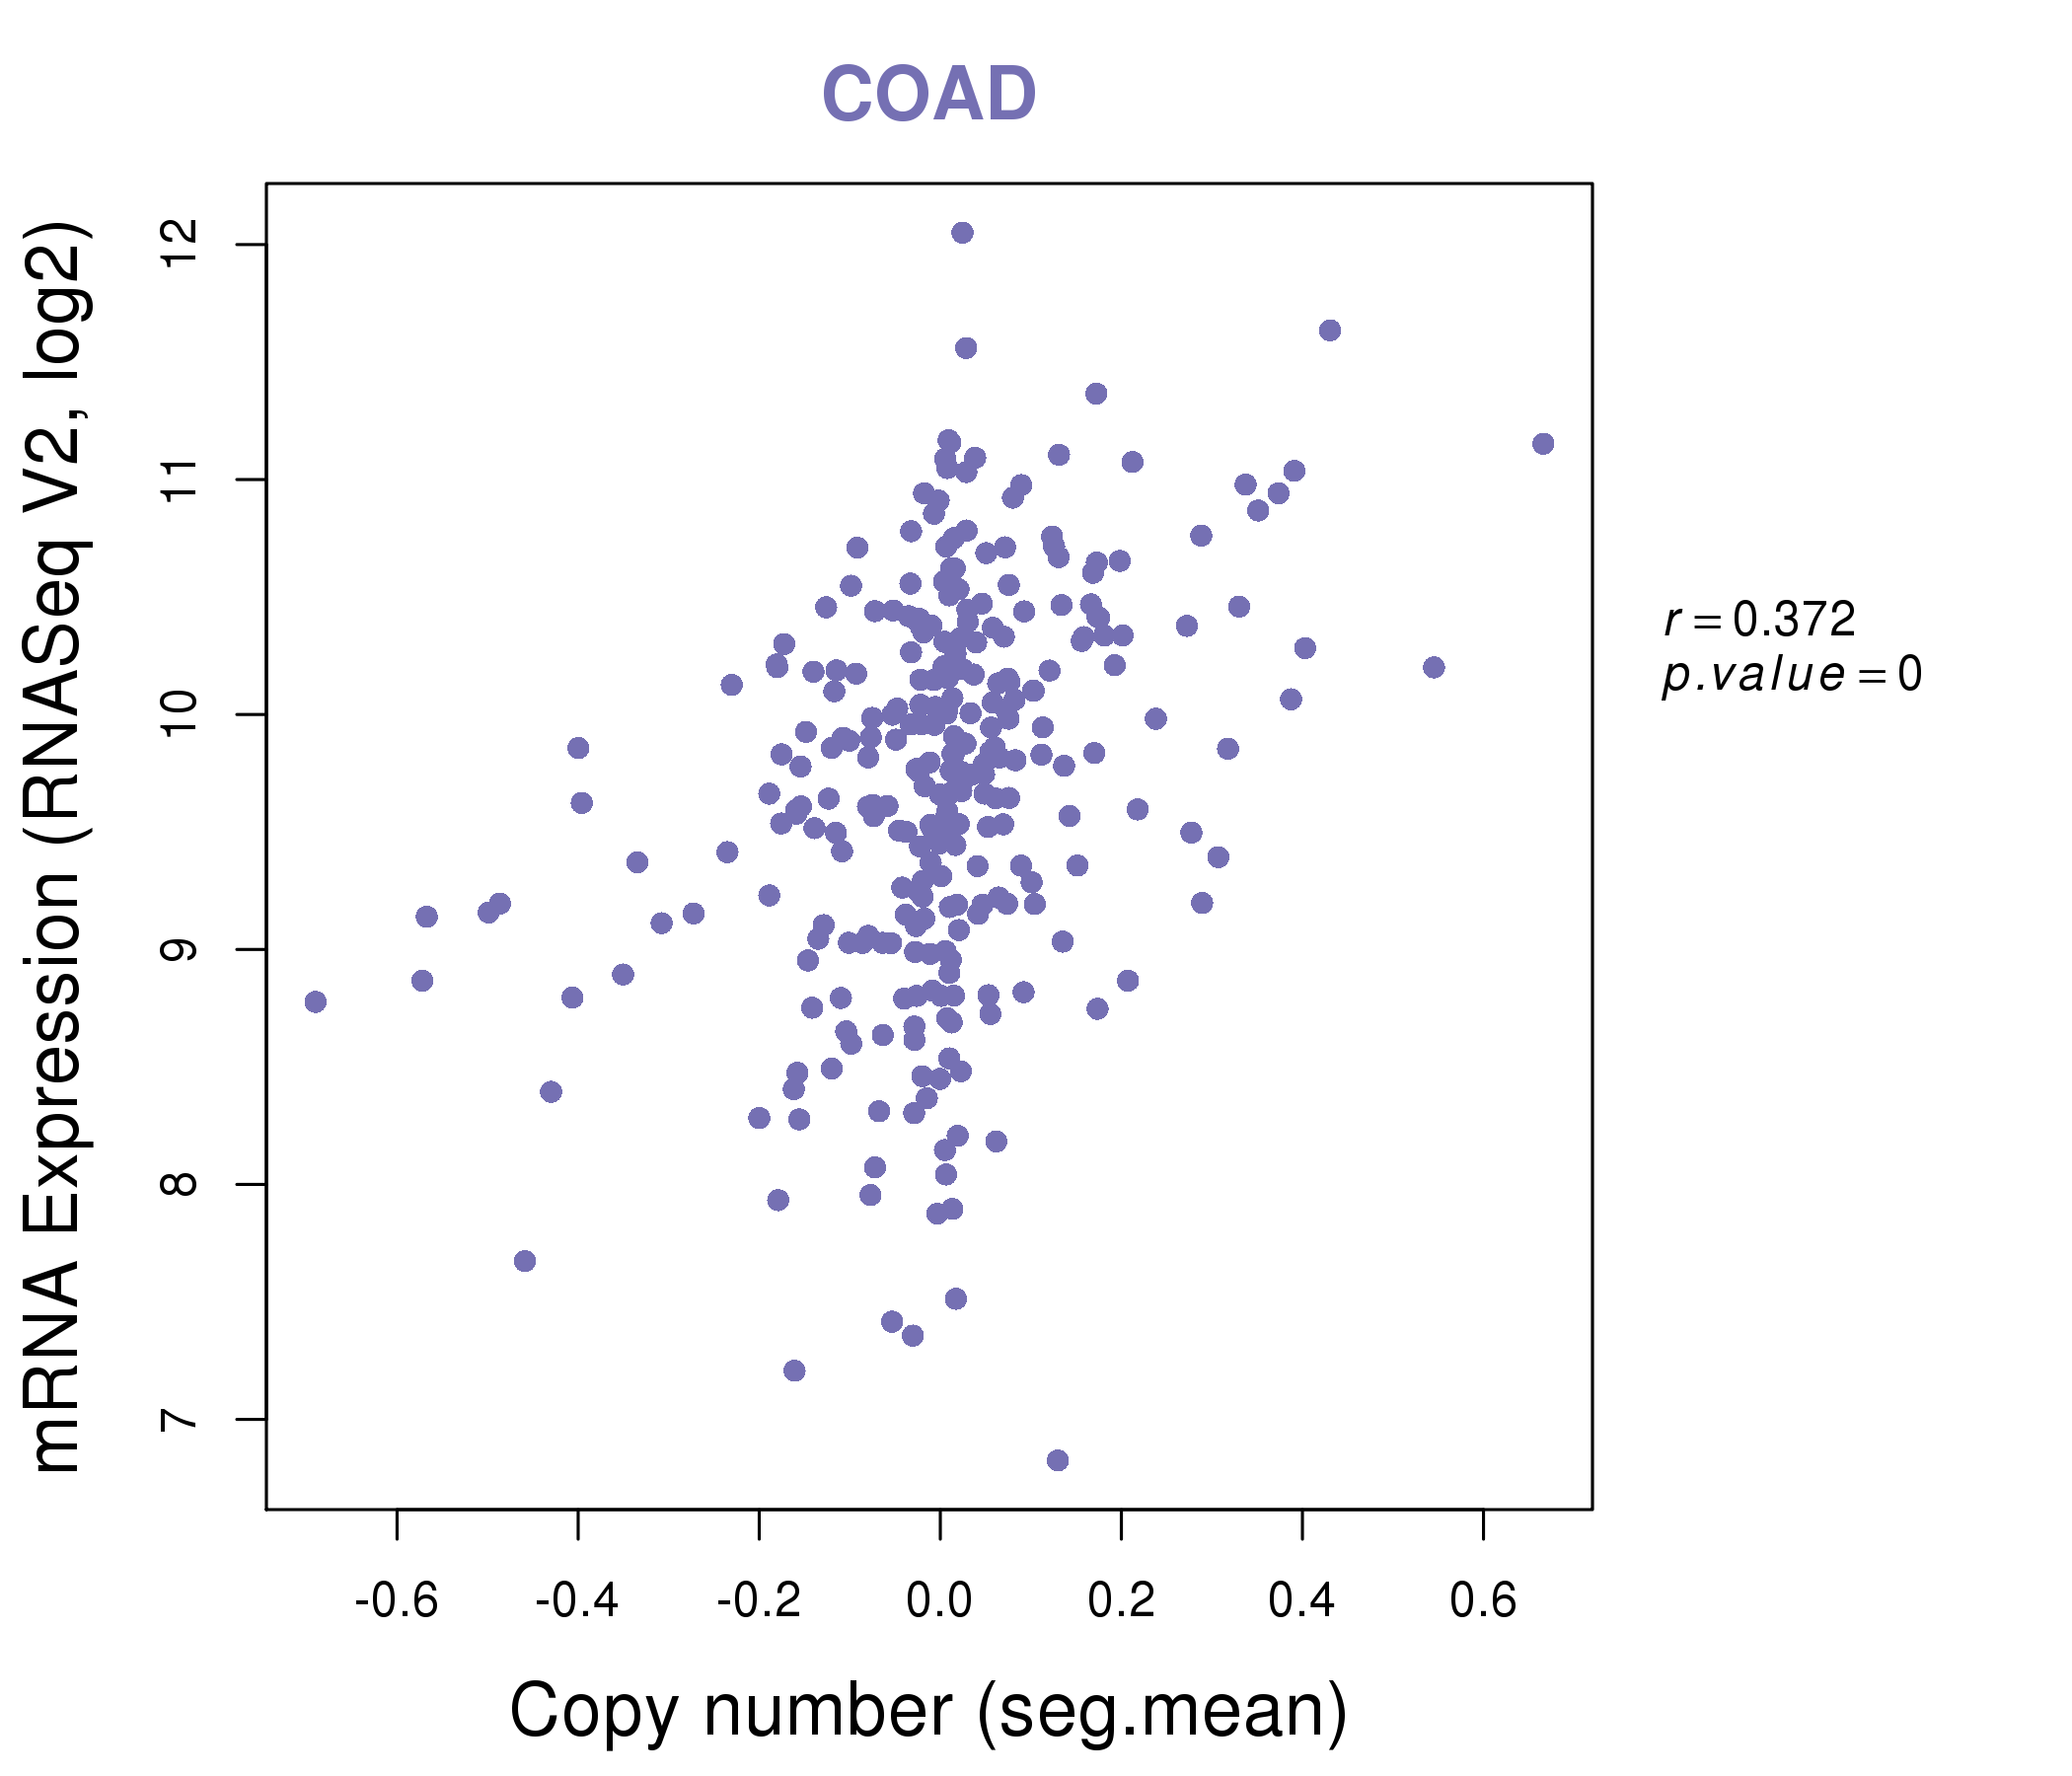
| * This plots show the correlation between CNV and gene expression. |
: Open all plots for all cancer types
 |
|
 |
|
| Top |
| Gene-Gene Network Information |
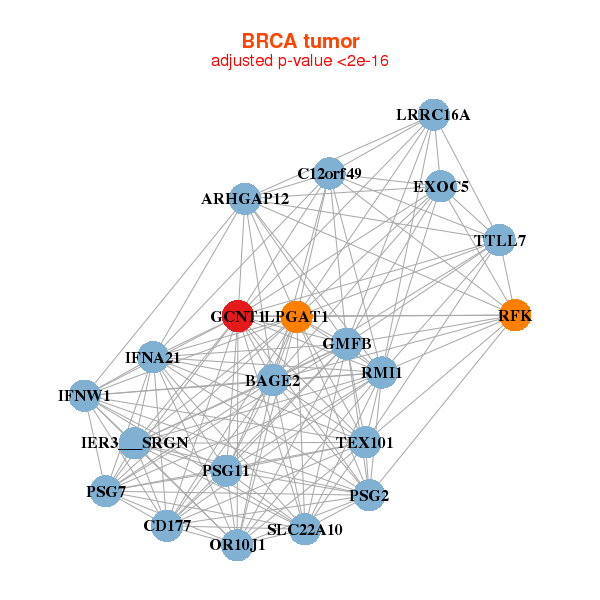
| * Co-Expression network figures were drawn using R package igraph. Only the top 20 genes with the highest correlations were shown. Red circle: input gene, orange circle: cell metabolism gene, sky circle: other gene |
: Open all plots for all cancer types
 |
|
| ARHGAP12,BAGE2,C12orf49,CD177,EXOC5,GCNT1,GMFB, IFNA21,IFNW1,LPGAT1,LRRC16A,OR10J1,IER3___SRGN,PSG11, PSG2,PSG7,RFK,RMI1,SLC22A10,TEX101,TTLL7 | ADAM17,ALDH1A3,ARF6,MB21D2,CHSY1,CRY1,CSNK1A1, EZR,FZD3,GCNT1,KLK7,LANCL3,MACC1,MFSD6, MPZL2,PER2,PPP4R1,SFPQ,TES,WEE1,ZNF365 |
 |
|
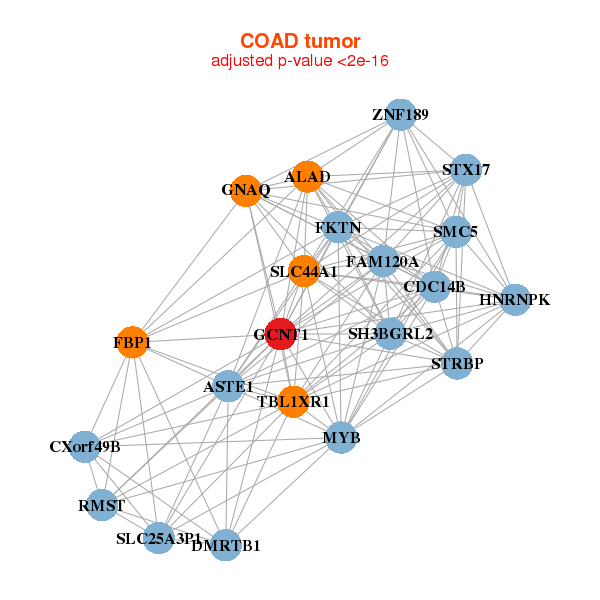
| ALAD,ASTE1,CDC14B,CXorf49B,DMRTB1,FAM120A,FBP1, FKTN,SLC25A3P1,GCNT1,GNAQ,HNRNPK,MYB,RMST, SH3BGRL2,SLC44A1,SMC5,STRBP,STX17,TBL1XR1,ZNF189 | AGGF1,ALDH6A1,TMEM260,CDC14B,COX15,FAM83B,FOXA1, GATA6,GCNT1,GFOD2,GRB7,HOXB6,HOXB8,IDH1, KIAA1804,KLF5,LOC80054,NR5A2,NRIP1,SH2D4A,TSKU |
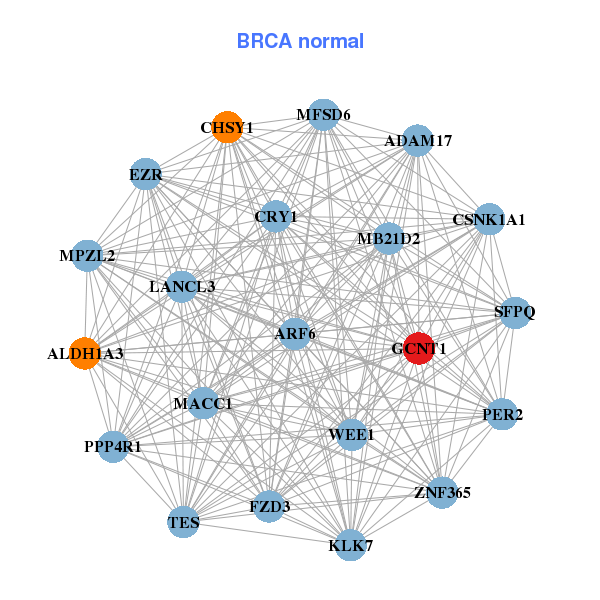
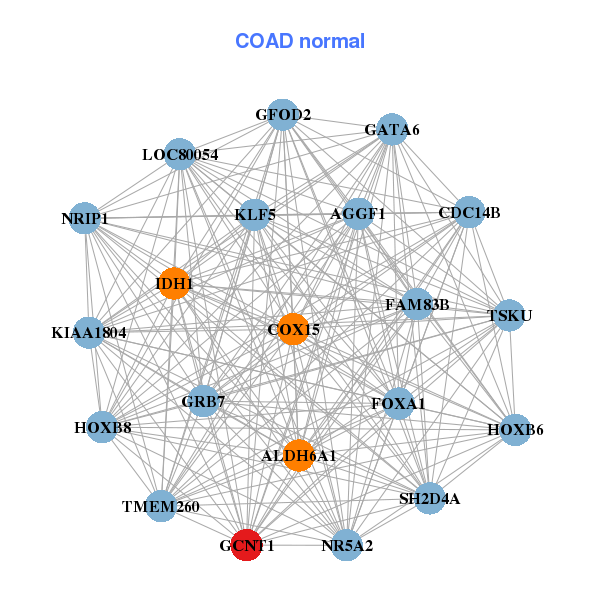
| * Co-Expression network figures were drawn using R package igraph. Only the top 20 genes with the highest correlations were shown. Red circle: input gene, orange circle: cell metabolism gene, sky circle: other gene |
: Open all plots for all cancer types
| Top |
: Open all interacting genes' information including KEGG pathway for all interacting genes from DAVID
| Top |
| Pharmacological Information for GCNT1 |
| There's no related Drug. |
| Top |
| Cross referenced IDs for GCNT1 |
| * We obtained these cross-references from Uniprot database. It covers 150 different DBs, 18 categories. http://www.uniprot.org/help/cross_references_section |
: Open all cross reference information
|
Copyright © 2016-Present - The Univsersity of Texas Health Science Center at Houston @ |