|
||||||||||||||||||||
| |
| Phenotypic Information (metabolism pathway, cancer, disease, phenome) |
| |
| |
| Gene-Gene Network Information: Co-Expression Network, Interacting Genes & KEGG |
| |
|


| Gene Summary for GFER |
| Basic gene info. | Gene symbol | GFER |
| Gene name | growth factor, augmenter of liver regeneration | |
| Synonyms | ALR|ERV1|HERV1|HPO|HPO1|HPO2|HSS | |
| Cytomap | UCSC genome browser: 16p13.3-p13.12 | |
| Genomic location | chr16 :2034149-2037750 | |
| Type of gene | protein-coding | |
| RefGenes | NM_005262.2, | |
| Ensembl id | ENSG00000127554 | |
| Description | ERV1 homologFAD-linked sulfhydryl oxidase ALRerv1-like growth factorhepatic regenerative stimulation substancehepatopoietin protein | |
| Modification date | 20141207 | |
| dbXrefs | MIM : 600924 | |
| HGNC : HGNC | ||
| Ensembl : ENSG00000127554 | ||
| HPRD : 02954 | ||
| Vega : OTTHUMG00000176896 | ||
| Protein | UniProt: go to UniProt's Cross Reference DB Table | |
| Expression | CleanEX: HS_GFER | |
| BioGPS: 2671 | ||
| Gene Expression Atlas: ENSG00000127554 | ||
| The Human Protein Atlas: ENSG00000127554 | ||
| Pathway | NCI Pathway Interaction Database: GFER | |
| KEGG: GFER | ||
| REACTOME: GFER | ||
| ConsensusPathDB | ||
| Pathway Commons: GFER | ||
| Metabolism | MetaCyc: GFER | |
| HUMANCyc: GFER | ||
| Regulation | Ensembl's Regulation: ENSG00000127554 | |
| miRBase: chr16 :2,034,149-2,037,750 | ||
| TargetScan: NM_005262 | ||
| cisRED: ENSG00000127554 | ||
| Context | iHOP: GFER | |
| cancer metabolism search in PubMed: GFER | ||
| UCL Cancer Institute: GFER | ||
| Assigned class in ccmGDB | C | |
| Top |
| Phenotypic Information for GFER(metabolism pathway, cancer, disease, phenome) |
| Cancer | CGAP: GFER |
| Familial Cancer Database: GFER | |
| * This gene is included in those cancer gene databases. |
|
|
|
|
|
| . | ||||||||||||||
Oncogene 1 | Significant driver gene in | |||||||||||||||||||
| cf) number; DB name 1 Oncogene; http://nar.oxfordjournals.org/content/35/suppl_1/D721.long, 2 Tumor Suppressor gene; https://bioinfo.uth.edu/TSGene/, 3 Cancer Gene Census; http://www.nature.com/nrc/journal/v4/n3/abs/nrc1299.html, 4 CancerGenes; http://nar.oxfordjournals.org/content/35/suppl_1/D721.long, 5 Network of Cancer Gene; http://ncg.kcl.ac.uk/index.php, 1Therapeutic Vulnerabilities in Cancer; http://cbio.mskcc.org/cancergenomics/statius/ |
| REACTOME_METABOLISM_OF_PROTEINS | |
| OMIM | |
| Orphanet | |
| Disease | KEGG Disease: GFER |
| MedGen: GFER (Human Medical Genetics with Condition) | |
| ClinVar: GFER | |
| Phenotype | MGI: GFER (International Mouse Phenotyping Consortium) |
| PhenomicDB: GFER | |
| Mutations for GFER |
| * Under tables are showing count per each tissue to give us broad intuition about tissue specific mutation patterns.You can go to the detailed page for each mutation database's web site. |
| - Statistics for Tissue and Mutation type | Top |
 |
| - For Inter-chromosomal Variations |
| There's no inter-chromosomal structural variation. |
| - For Intra-chromosomal Variations |
| There's no intra-chromosomal structural variation. |
| Sample | Symbol_a | Chr_a | Start_a | End_a | Symbol_b | Chr_b | Start_b | End_b |
| cf) Tissue number; Tissue name (1;Breast, 2;Central_nervous_system, 3;Haematopoietic_and_lymphoid_tissue, 4;Large_intestine, 5;Liver, 6;Lung, 7;Ovary, 8;Pancreas, 9;Prostate, 10;Skin, 11;Soft_tissue, 12;Upper_aerodigestive_tract) |
| * From mRNA Sanger sequences, Chitars2.0 arranged chimeric transcripts. This table shows GFER related fusion information. |
| ID | Head Gene | Tail Gene | Accession | Gene_a | qStart_a | qEnd_a | Chromosome_a | tStart_a | tEnd_a | Gene_a | qStart_a | qEnd_a | Chromosome_a | tStart_a | tEnd_a |
| Top |
| There's no copy number variation information in COSMIC data for this gene. |
| Top |
|
 |
| Top |
| Stat. for Non-Synonymous SNVs (# total SNVs=9) | (# total SNVs=3) |
 |  |
(# total SNVs=0) | (# total SNVs=0) |
| Top |
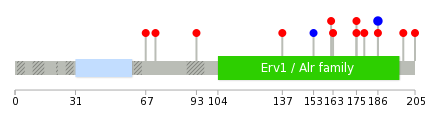
| * When you move the cursor on each content, you can see more deailed mutation information on the Tooltip. Those are primary_site,primary_histology,mutation(aa),pubmedID. |
| GRCh37 position | Mutation(aa) | Unique sampleID count |
| chr16:2035969-2035969 | p.F186F | 2 |
| chr16:2035898-2035898 | p.R163W | 1 |
| chr16:2035934-2035934 | p.N175H | 1 |
| chr16:2035935-2035935 | p.N175S | 1 |
| chr16:2035946-2035946 | p.R179S | 1 |
| chr16:2035967-2035967 | p.F186I | 1 |
| chr16:2034418-2034418 | p.R67G | 1 |
| chr16:2034434-2034434 | p.R72L | 1 |
| chr16:2036007-2036007 | p.W199L | 1 |
| chr16:2034767-2034767 | p.E93G | 1 |
| Top |
|
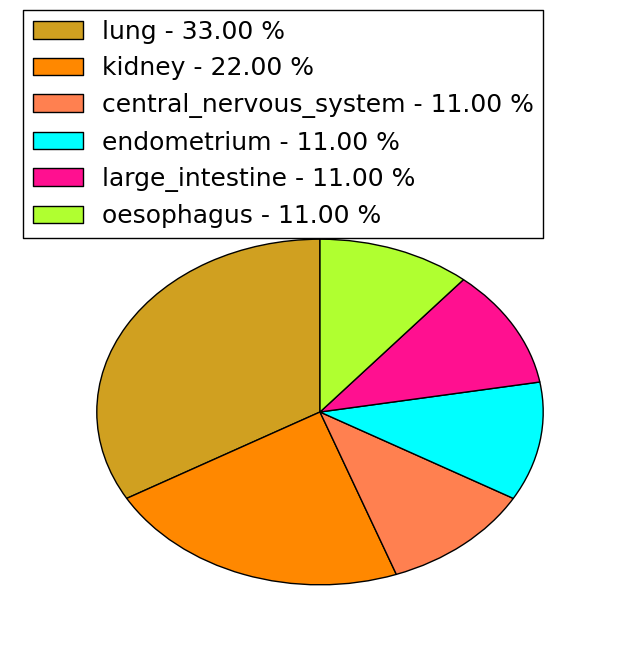
 |
| Point Mutation/ Tissue ID | 1 | 2 | 3 | 4 | 5 | 6 | 7 | 8 | 9 | 10 | 11 | 12 | 13 | 14 | 15 | 16 | 17 | 18 | 19 | 20 |
| # sample | 1 | 1 | 1 | 2 | 1 | 1 | 1 | 2 | ||||||||||||
| # mutation | 1 | 1 | 2 | 2 | 1 | 1 | 1 | 2 | ||||||||||||
| nonsynonymous SNV | 2 | 2 | 1 | 1 | 1 | 1 | ||||||||||||||
| synonymous SNV | 1 | 1 | 1 |
| cf) Tissue ID; Tissue type (1; BLCA[Bladder Urothelial Carcinoma], 2; BRCA[Breast invasive carcinoma], 3; CESC[Cervical squamous cell carcinoma and endocervical adenocarcinoma], 4; COAD[Colon adenocarcinoma], 5; GBM[Glioblastoma multiforme], 6; Glioma Low Grade, 7; HNSC[Head and Neck squamous cell carcinoma], 8; KICH[Kidney Chromophobe], 9; KIRC[Kidney renal clear cell carcinoma], 10; KIRP[Kidney renal papillary cell carcinoma], 11; LAML[Acute Myeloid Leukemia], 12; LUAD[Lung adenocarcinoma], 13; LUSC[Lung squamous cell carcinoma], 14; OV[Ovarian serous cystadenocarcinoma ], 15; PAAD[Pancreatic adenocarcinoma], 16; PRAD[Prostate adenocarcinoma], 17; SKCM[Skin Cutaneous Melanoma], 18:STAD[Stomach adenocarcinoma], 19:THCA[Thyroid carcinoma], 20:UCEC[Uterine Corpus Endometrial Carcinoma]) |
| Top |
| * We represented just top 10 SNVs. When you move the cursor on each content, you can see more deailed mutation information on the Tooltip. Those are primary_site, primary_histology, mutation(aa), pubmedID. |
| Genomic Position | Mutation(aa) | Unique sampleID count |
| chr16:2035969 | p.F186F | 2 |
| chr16:2035946 | p.E193A | 1 |
| chr16:2035967 | p.L153L | 1 |
| chr16:2035989 | p.R161S | 1 |
| chr16:2035868 | p.T162I | 1 |
| chr16:2035892 | p.R163W | 1 |
| chr16:2035896 | p.N175H | 1 |
| chr16:2035898 | p.N175S | 1 |
| chr16:2035934 | p.R179S | 1 |
| chr16:2035935 | p.F186I | 1 |
| * Copy number data were extracted from TCGA using R package TCGA-Assembler. The URLs of all public data files on TCGA DCC data server were gathered on Jan-05-2015. Function ProcessCNAData in TCGA-Assembler package was used to obtain gene-level copy number value which is calculated as the average copy number of the genomic region of a gene. |
 |
| cf) Tissue ID[Tissue type]: BLCA[Bladder Urothelial Carcinoma], BRCA[Breast invasive carcinoma], CESC[Cervical squamous cell carcinoma and endocervical adenocarcinoma], COAD[Colon adenocarcinoma], GBM[Glioblastoma multiforme], Glioma Low Grade, HNSC[Head and Neck squamous cell carcinoma], KICH[Kidney Chromophobe], KIRC[Kidney renal clear cell carcinoma], KIRP[Kidney renal papillary cell carcinoma], LAML[Acute Myeloid Leukemia], LUAD[Lung adenocarcinoma], LUSC[Lung squamous cell carcinoma], OV[Ovarian serous cystadenocarcinoma ], PAAD[Pancreatic adenocarcinoma], PRAD[Prostate adenocarcinoma], SKCM[Skin Cutaneous Melanoma], STAD[Stomach adenocarcinoma], THCA[Thyroid carcinoma], UCEC[Uterine Corpus Endometrial Carcinoma] |
| Top |
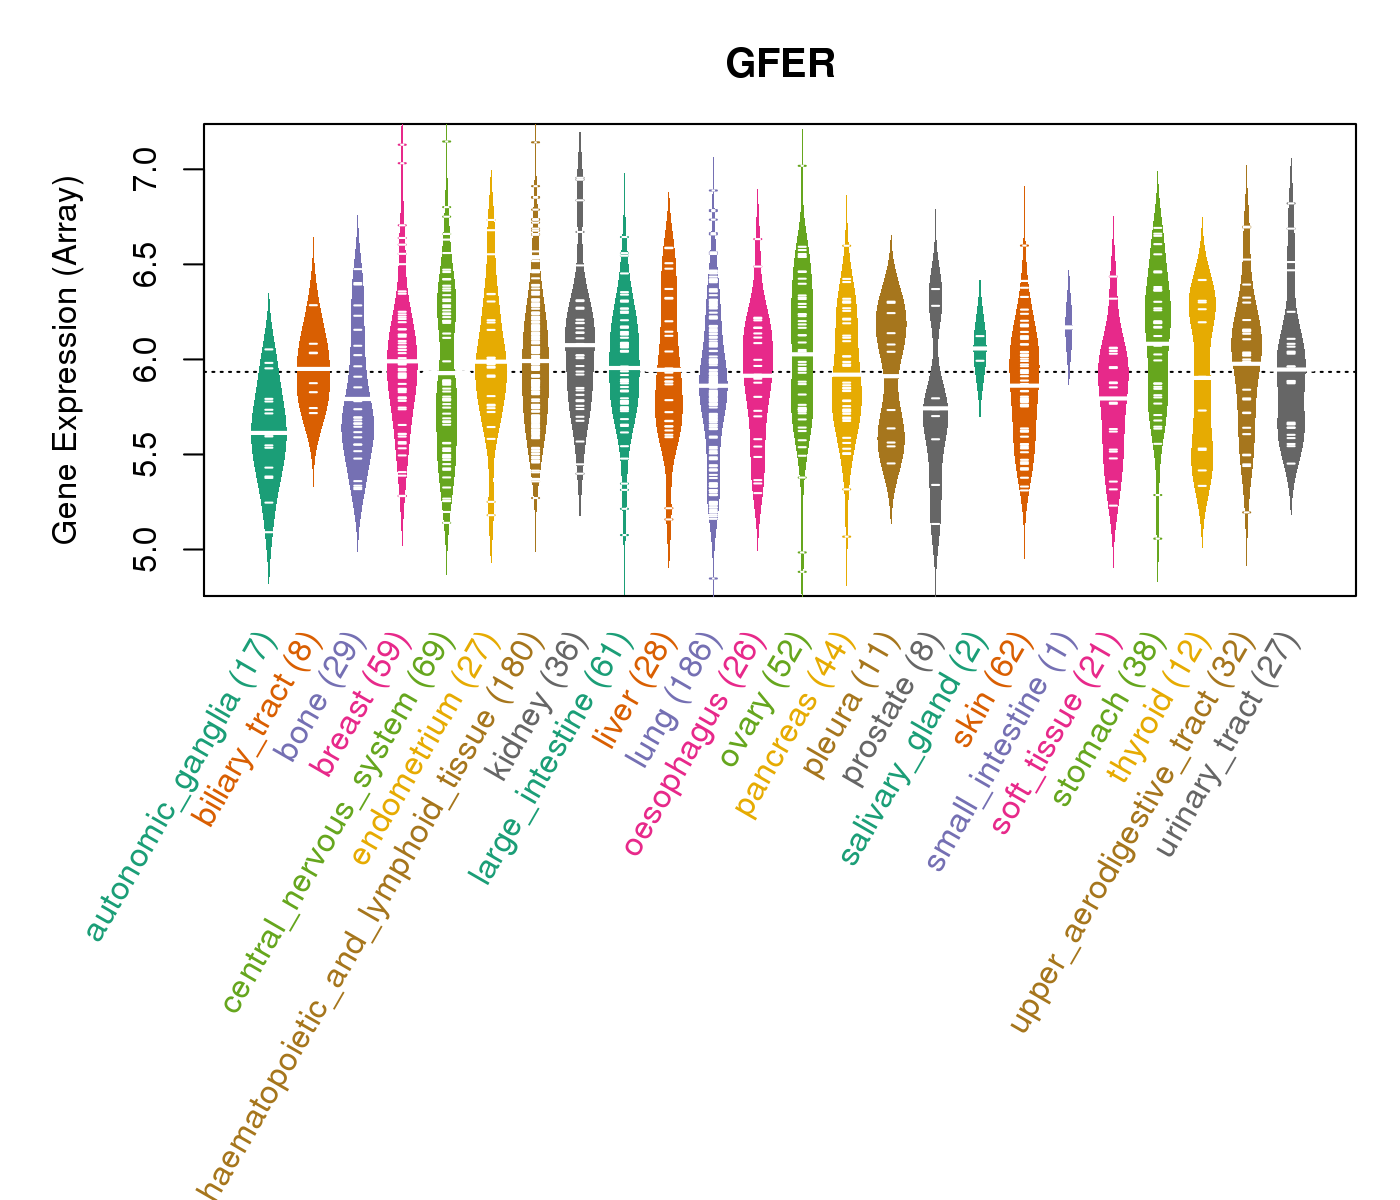
| Gene Expression for GFER |
| * CCLE gene expression data were extracted from CCLE_Expression_Entrez_2012-10-18.res: Gene-centric RMA-normalized mRNA expression data. |
 |
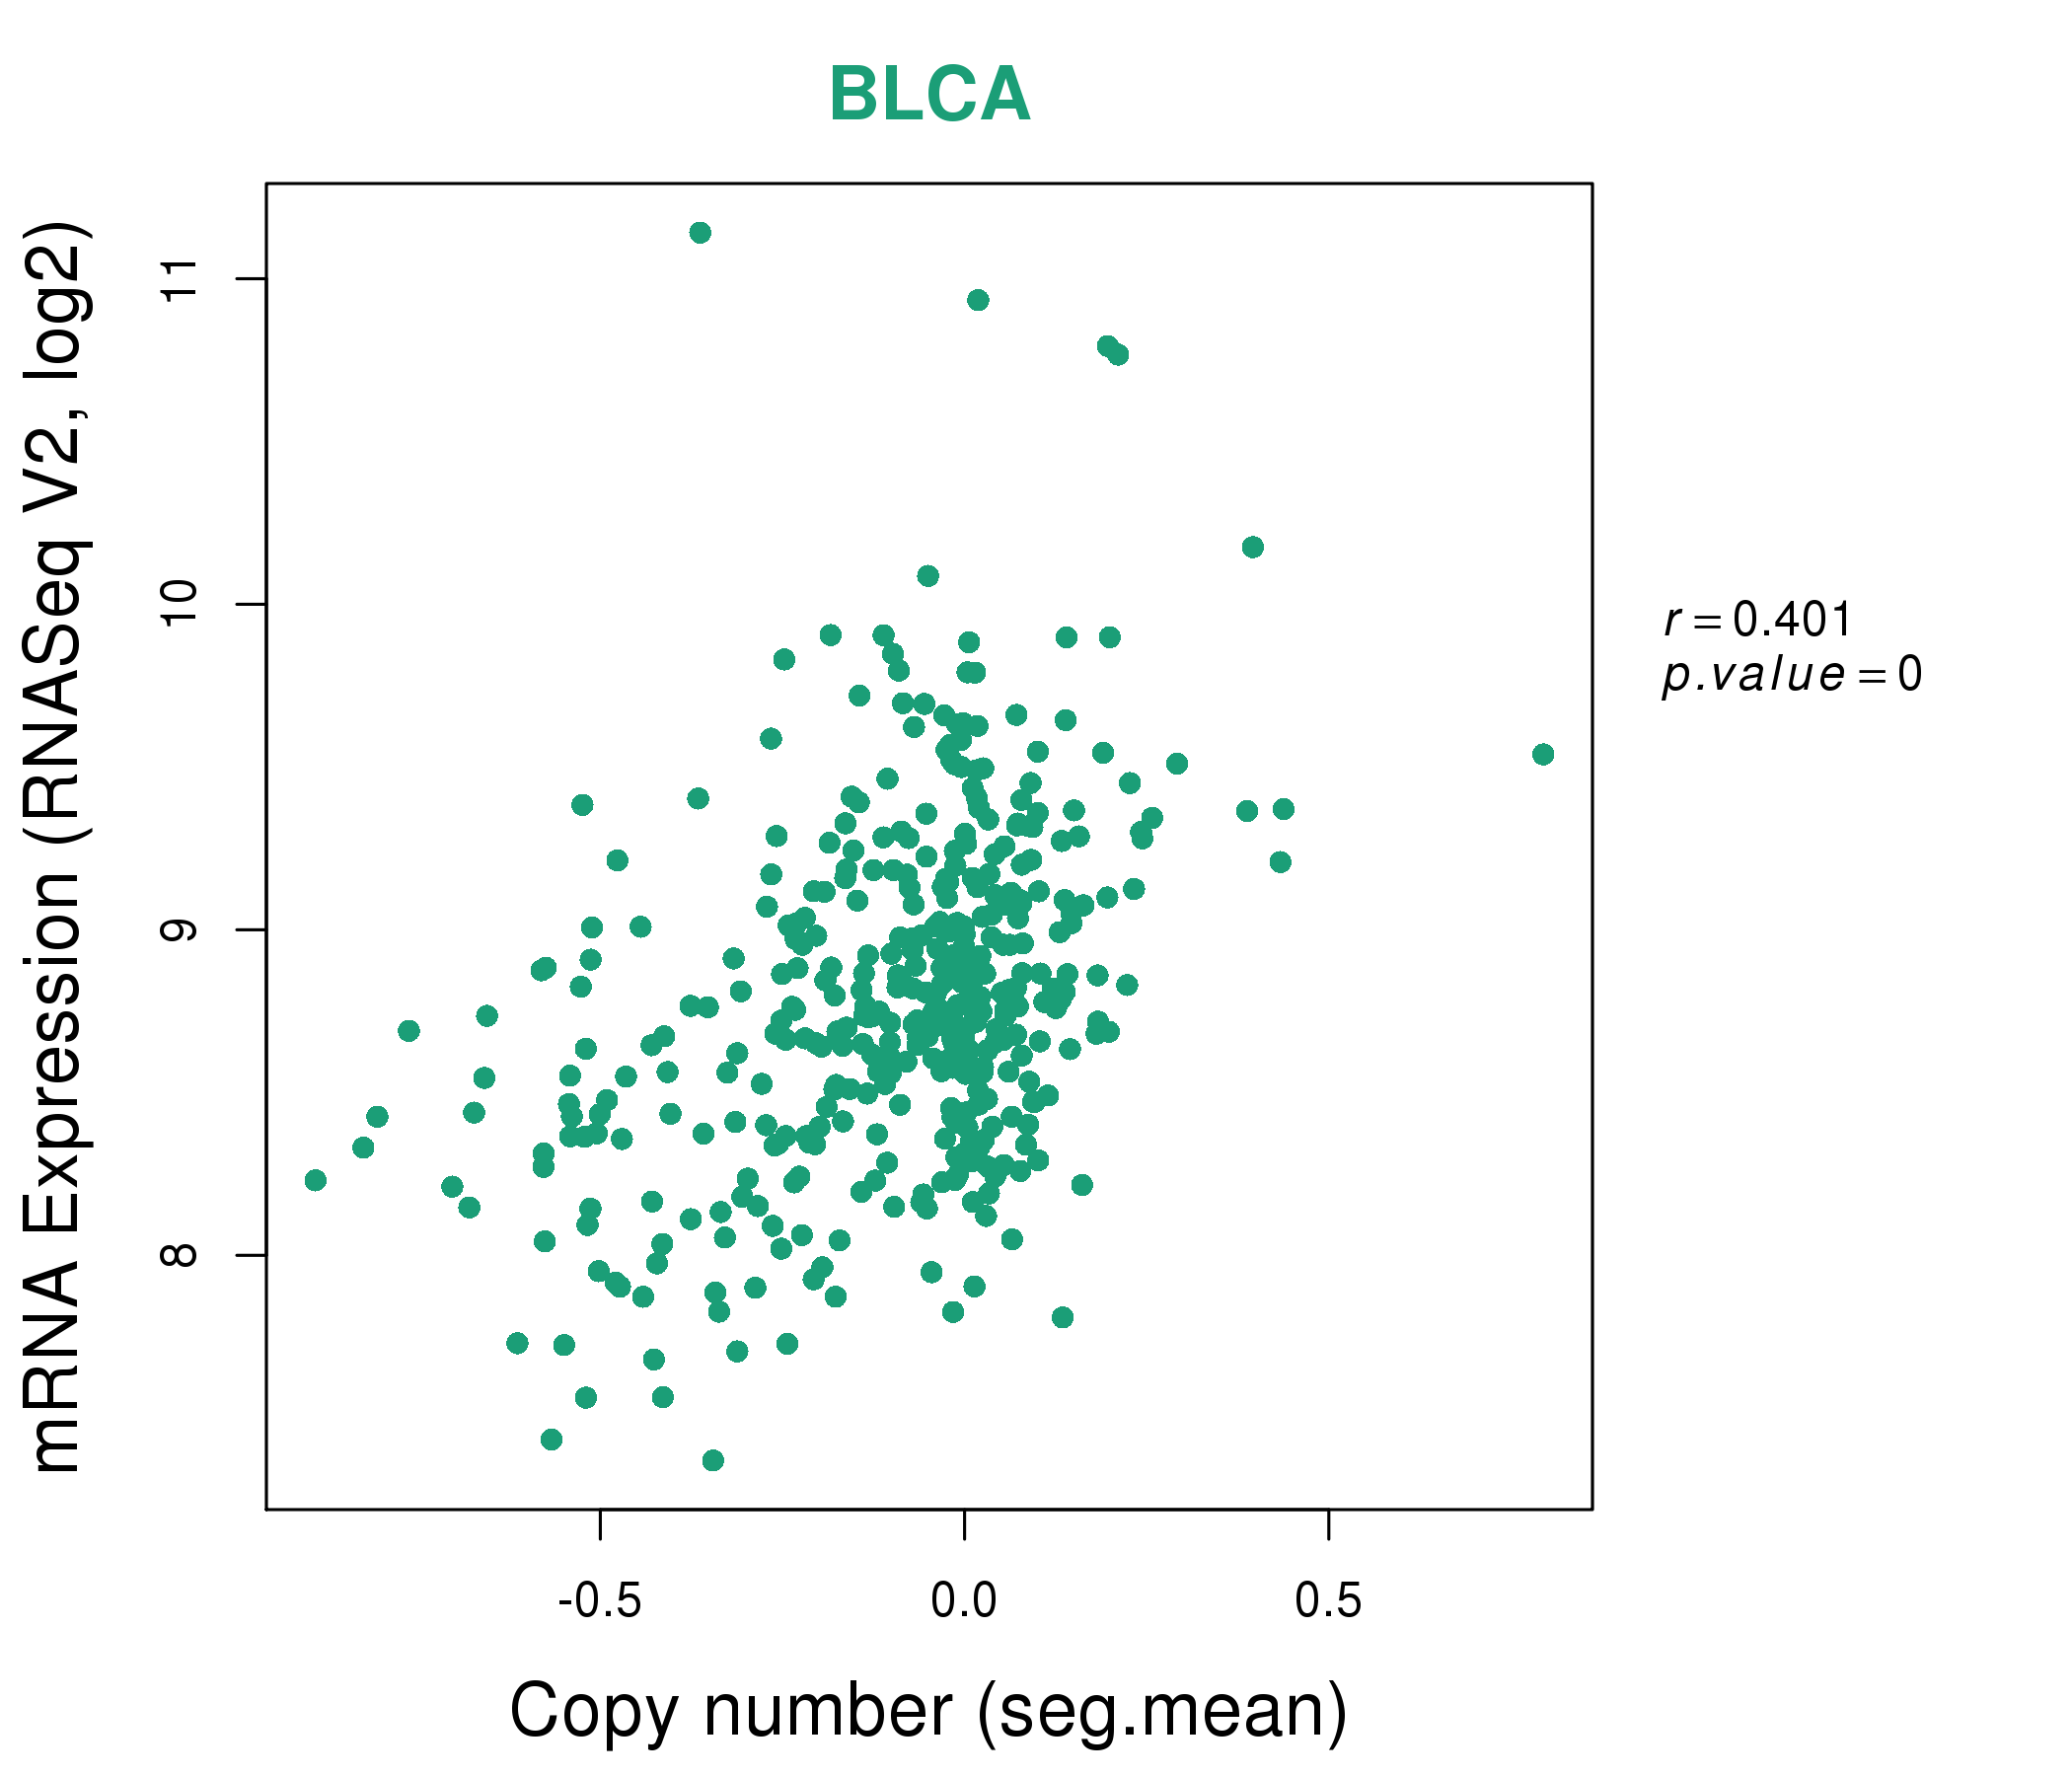
| * Normalized gene expression data of RNASeqV2 was extracted from TCGA using R package TCGA-Assembler. The URLs of all public data files on TCGA DCC data server were gathered at Jan-05-2015. Only eight cancer types have enough normal control samples for differential expression analysis. (t test, adjusted p<0.05 (using Benjamini-Hochberg FDR)) |
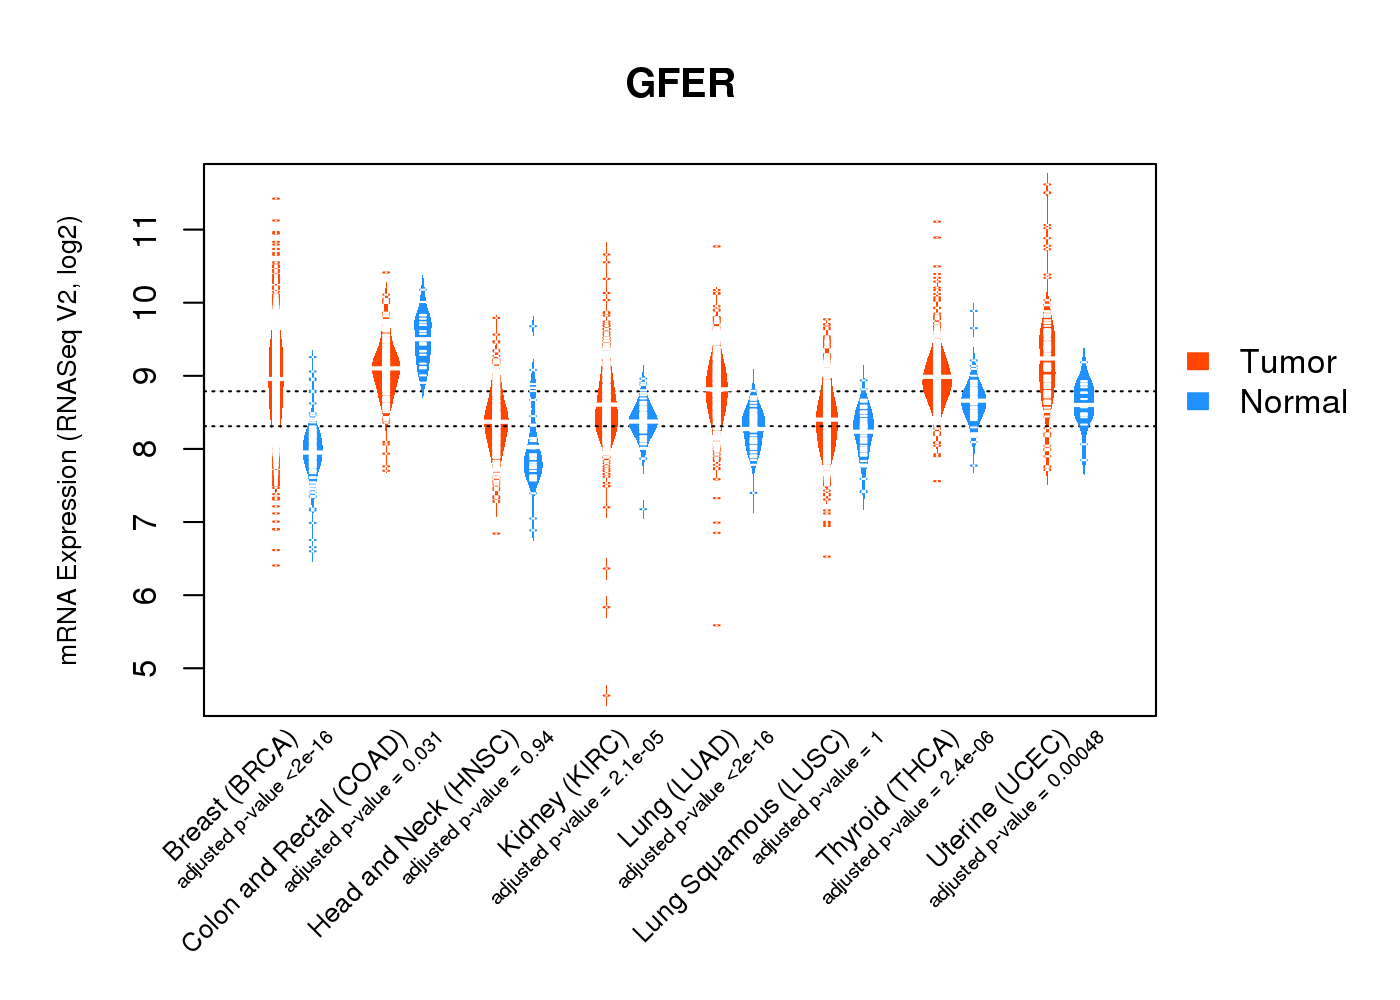 |
| Top |
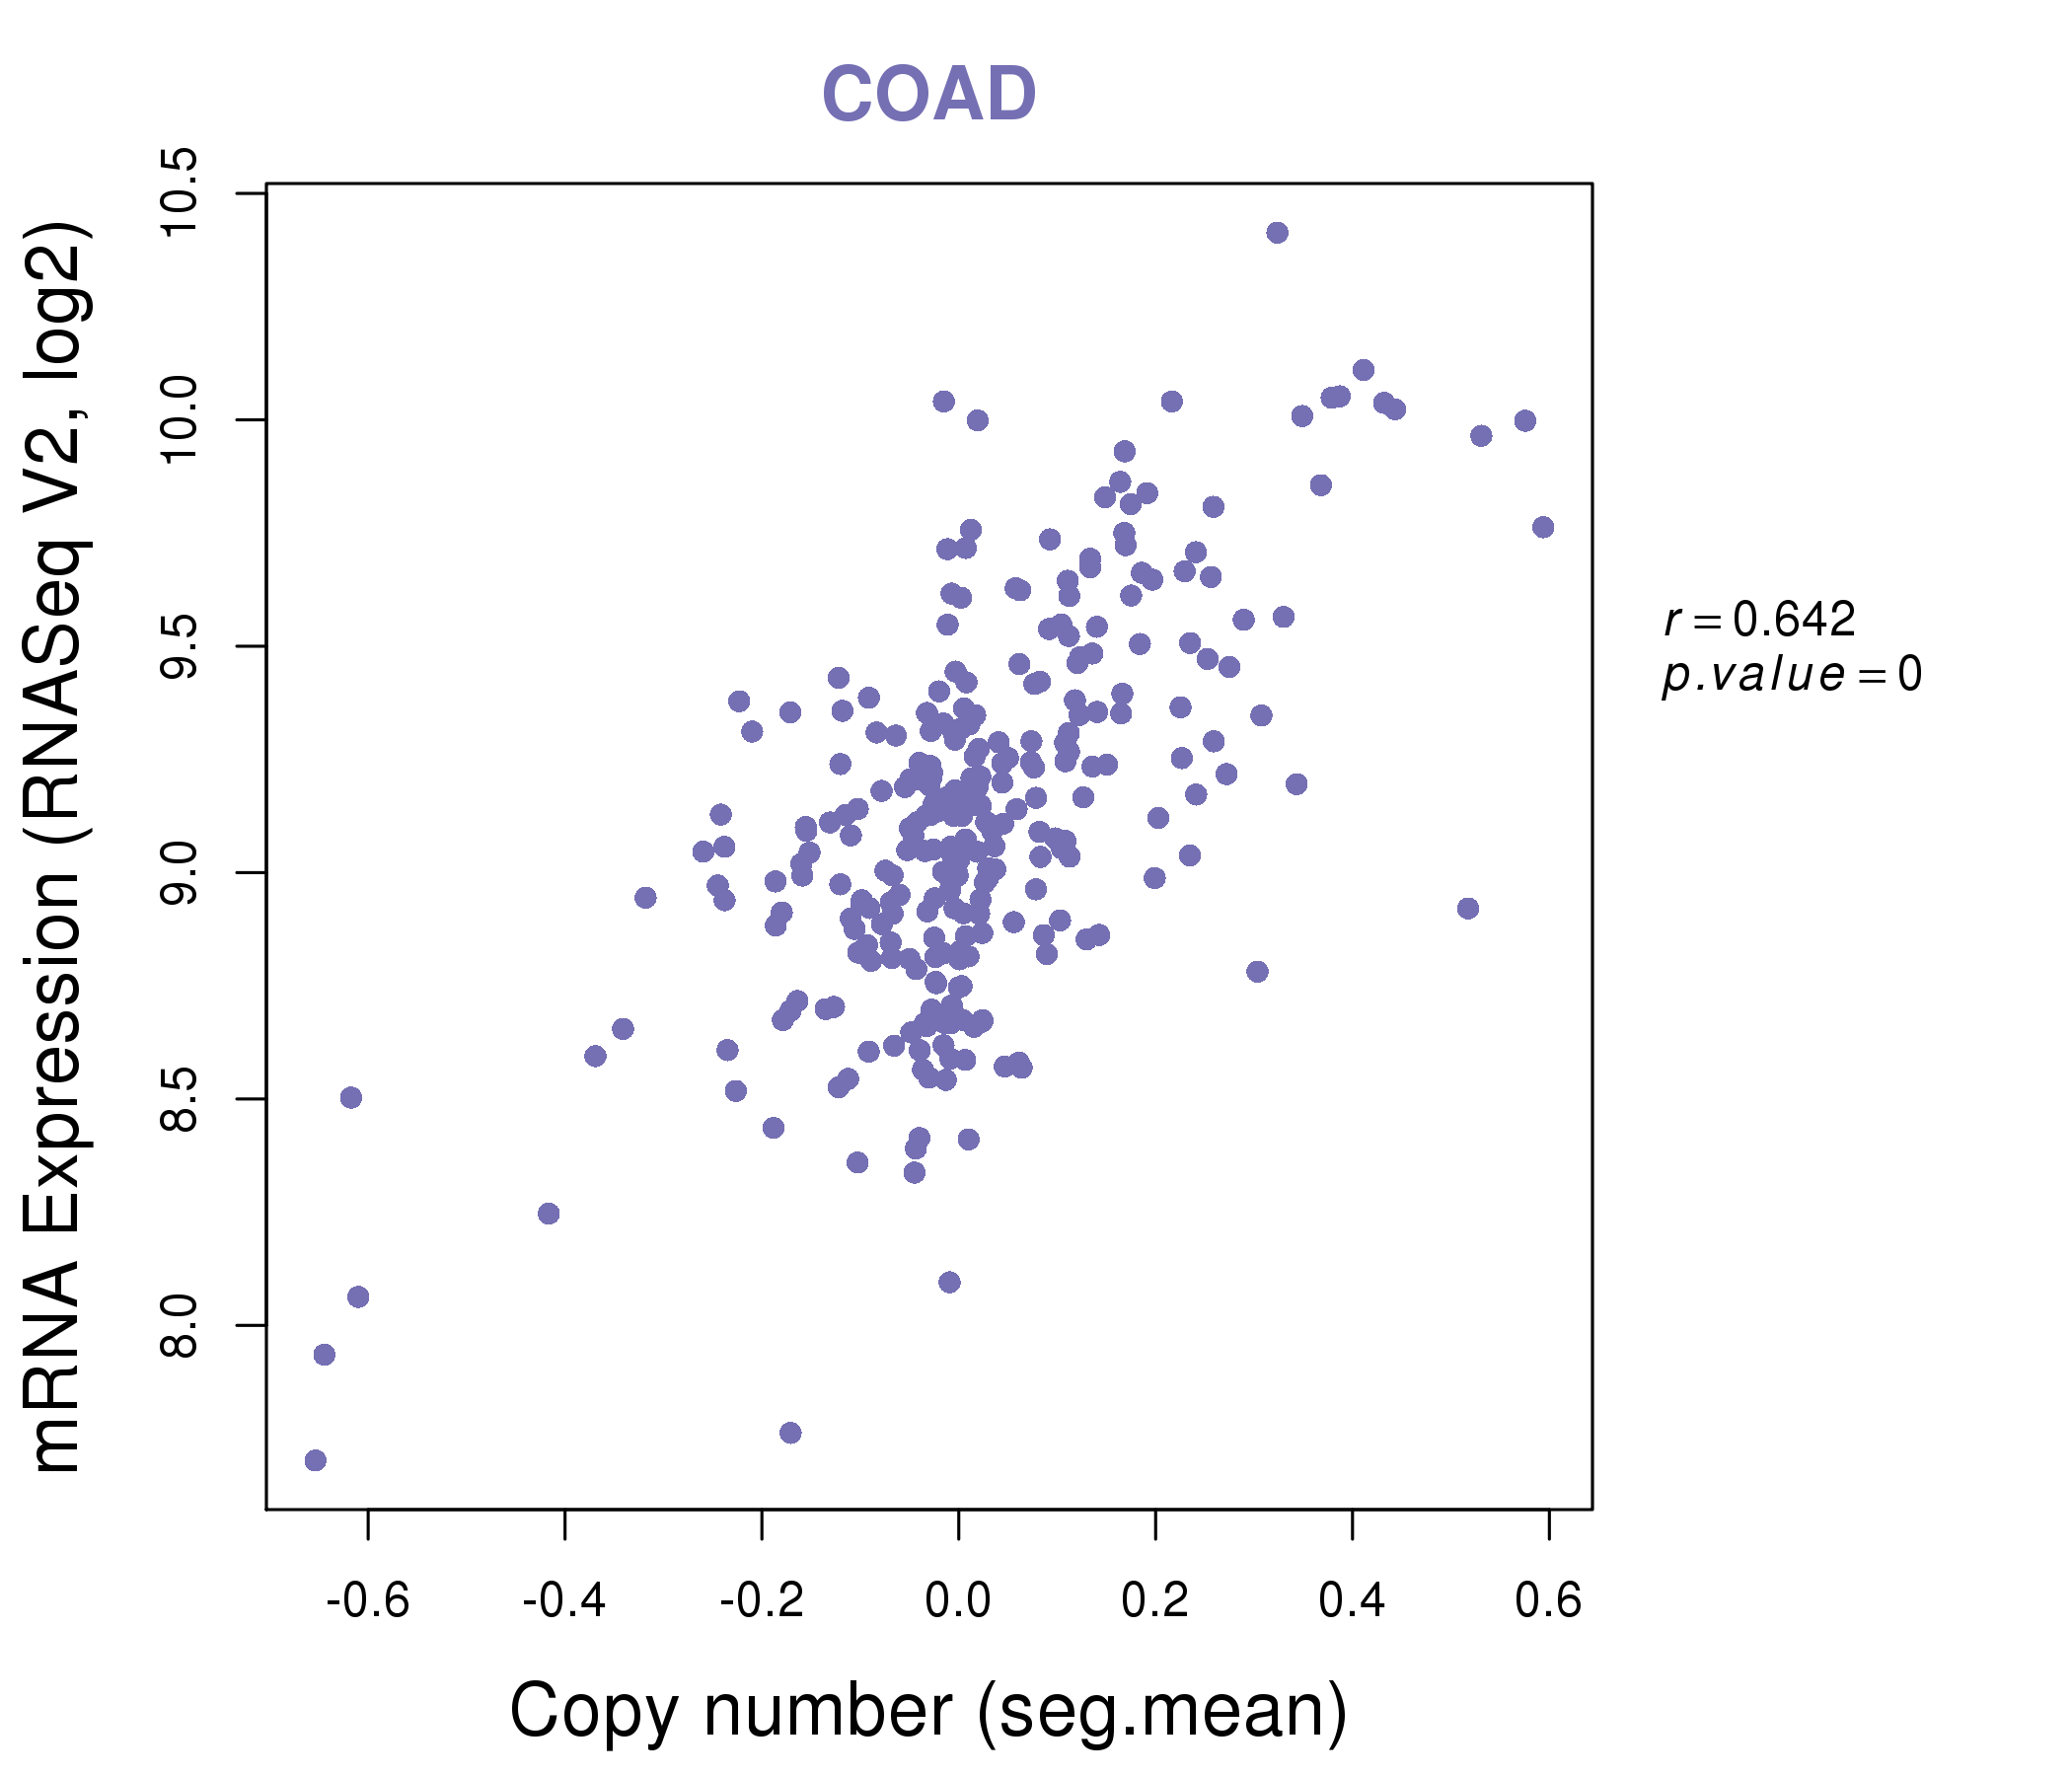
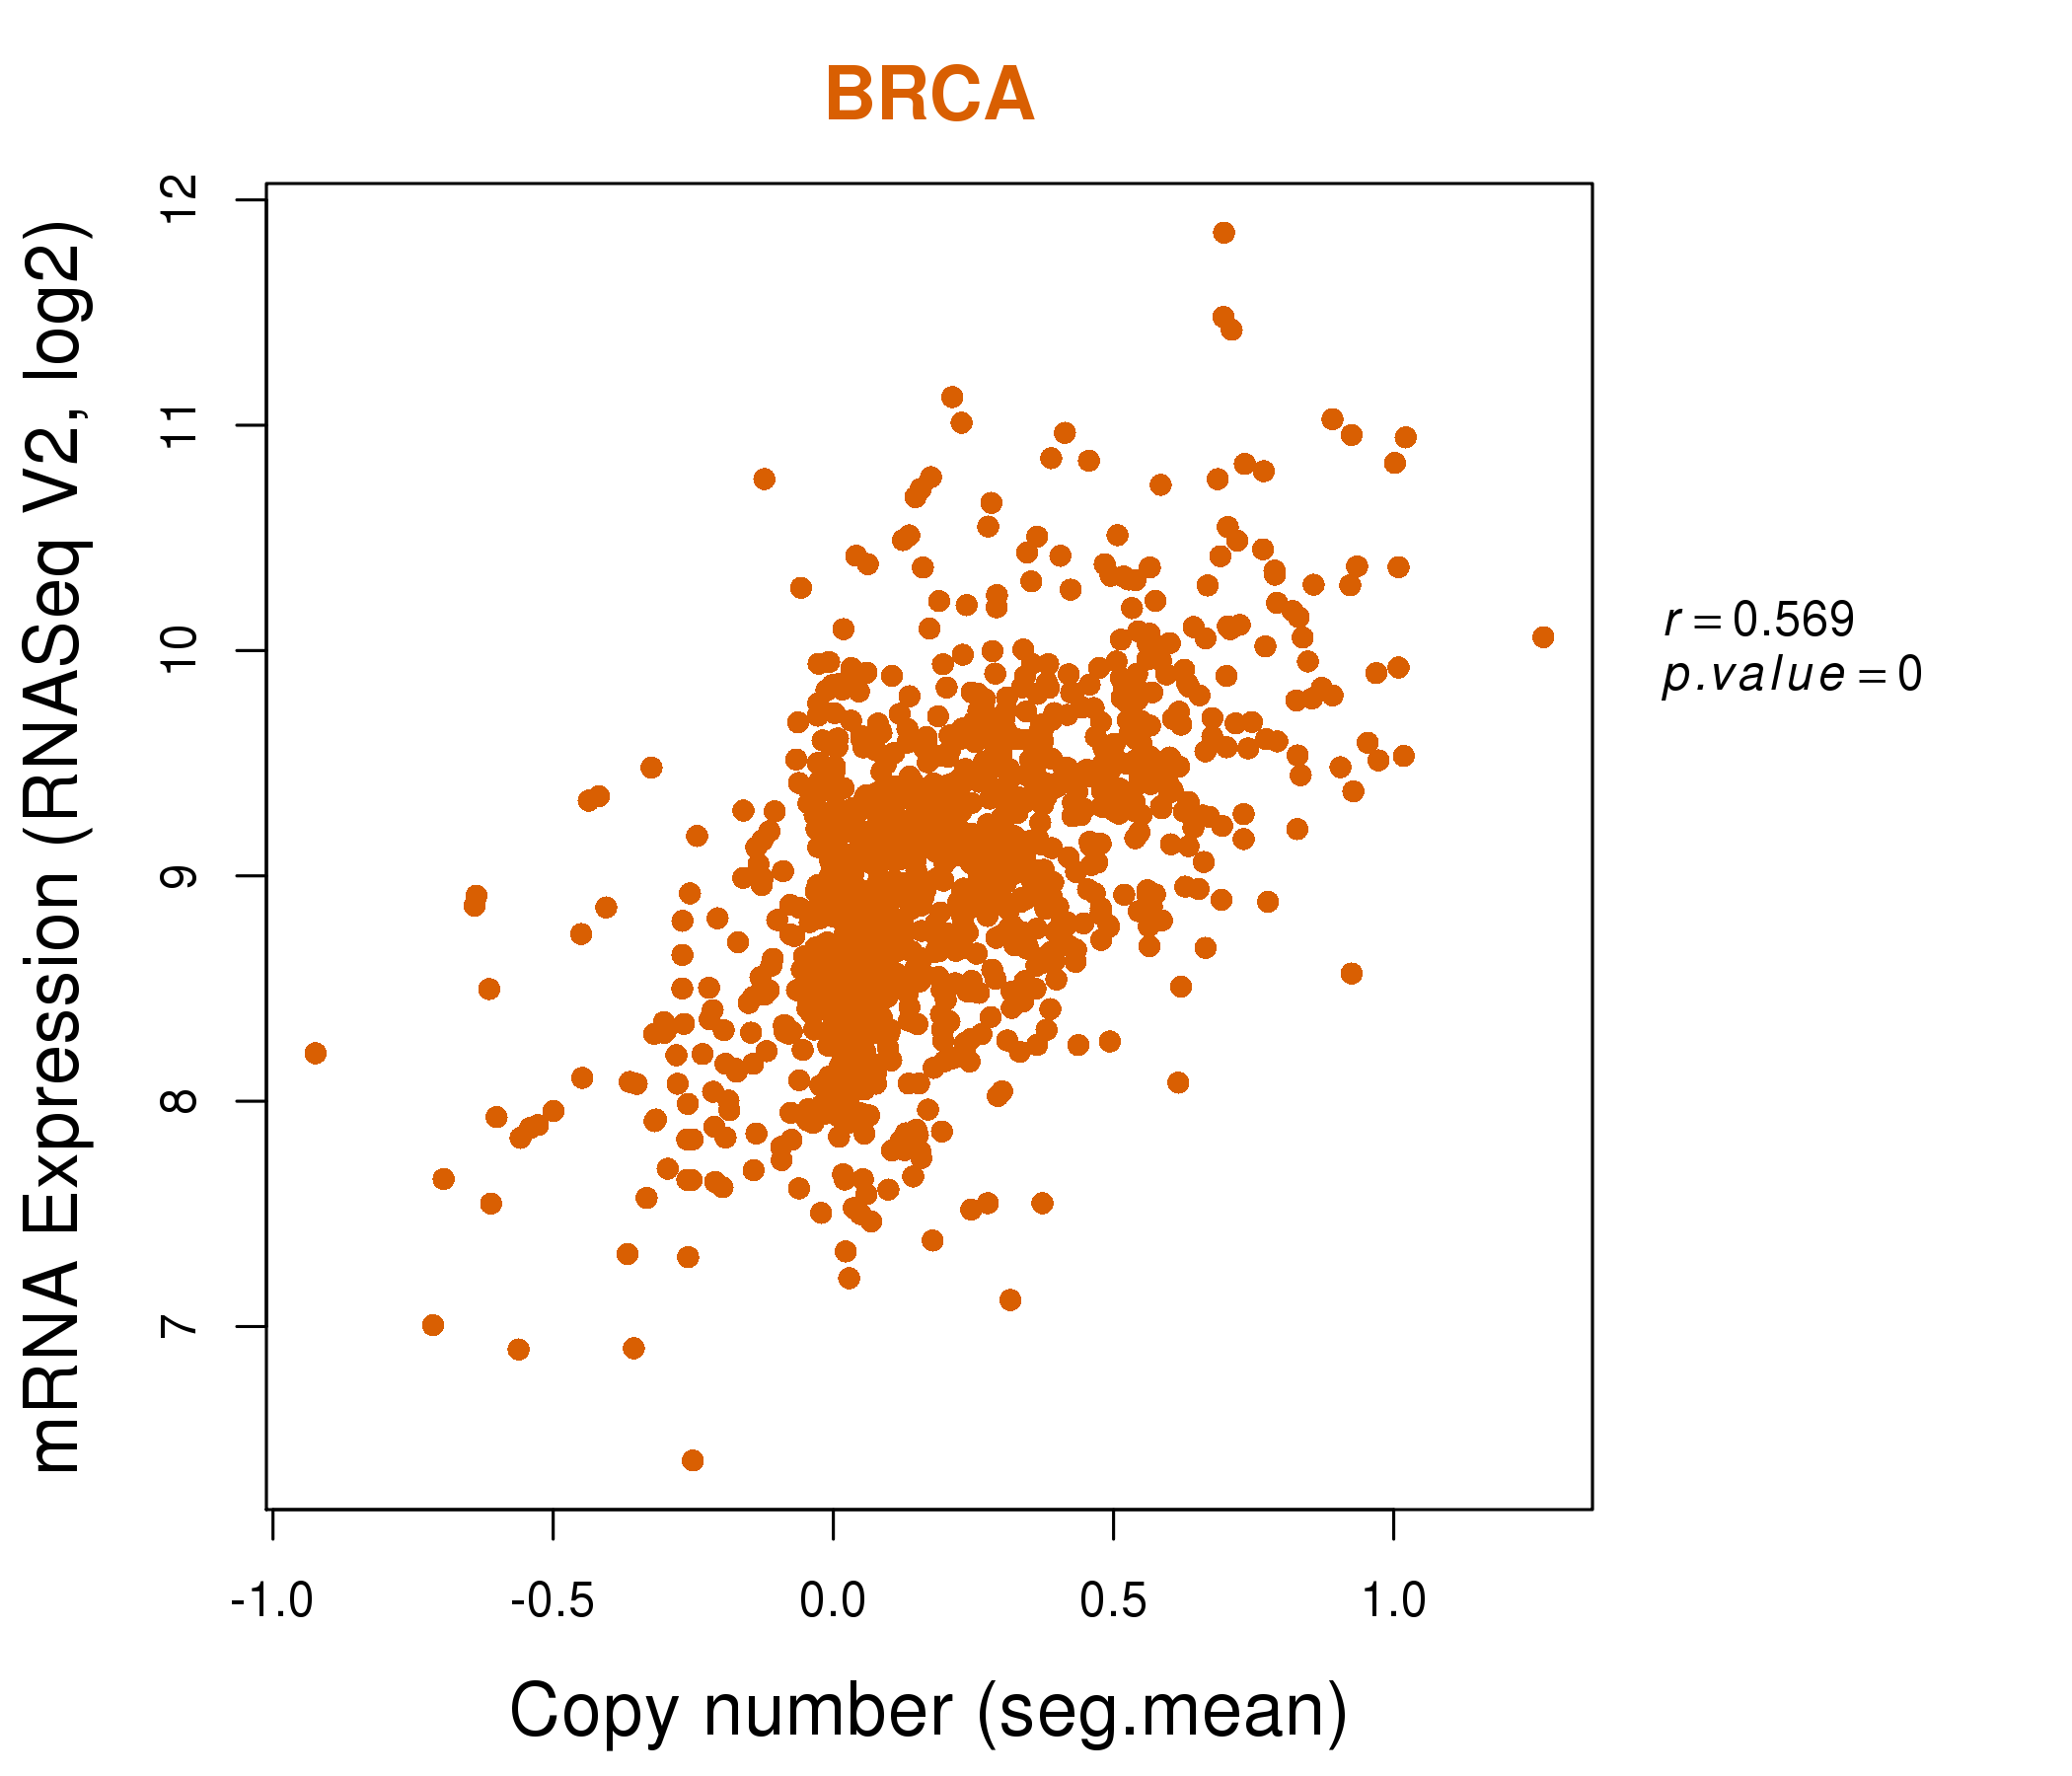
| * This plots show the correlation between CNV and gene expression. |
: Open all plots for all cancer types
 |
|
 |
|

| Top |
| Gene-Gene Network Information |
| * Co-Expression network figures were drawn using R package igraph. Only the top 20 genes with the highest correlations were shown. Red circle: input gene, orange circle: cell metabolism gene, sky circle: other gene |
: Open all plots for all cancer types
 |
| ||||
| TSR3,CD2BP2,ECI1,FAM173A,FAM195A,FLYWCH2,GFER, JMJD8,MLST8,MPG,MRPL28,MRPS34,NARFL,NDUFB10, NME3,NUBP2,PGP,RHOT2,STUB1,TBL3,ZNF205 | ARFRP1,ARL6IP4,UQCC3,TSR3,C17orf59,NELFB,DGCR6L, EDF1,GFER,HRAS,MPG,MRPL28,MRPS34,NTHL1, NUBP2,PRPF31,RPS19BP1,SSNA1,SURF2,WDR83,ZNF688 | ||||
 |
| ||||
| ATP6V0C,AXIN1,C16orf13,TSR3,CHMP1A,GFER,HAGH, HMOX2,MRPS34,NARFL,NAA60,NDUFB10,NTHL1,NUBP2, RAB40C,RHOT2,RNPS1,SPSB3,STUB1,TCEB2,UBE2I | ACY1,BCL2L1,C11orf52,GUCD1,CCL14-CCL15,CES2,DCAF11, DHRS11,EPS8L2,FAM132A,GFER,GLOD5,KIAA2013,NGEF, RAB17,SLC39A5,STRADB,TMEM120A,TMEM150B,TNNC2,USH1C |

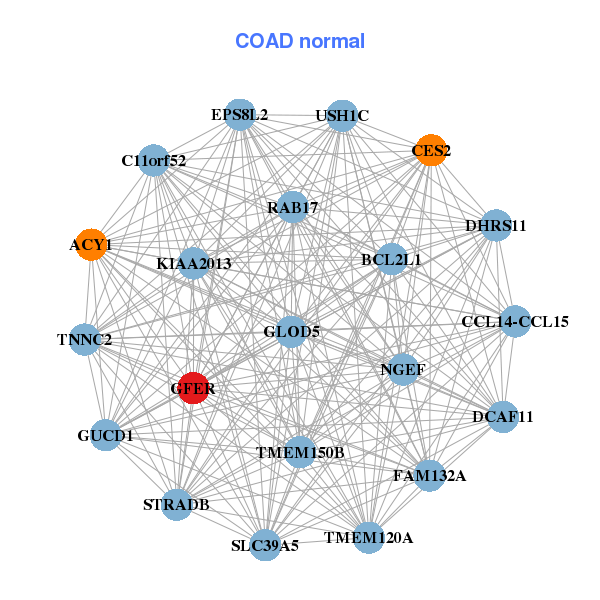
| * Co-Expression network figures were drawn using R package igraph. Only the top 20 genes with the highest correlations were shown. Red circle: input gene, orange circle: cell metabolism gene, sky circle: other gene |
: Open all plots for all cancer types
| Top |
: Open all interacting genes' information including KEGG pathway for all interacting genes from DAVID
| Top |
| Pharmacological Information for GFER |
| DB Category | DB Name | DB's ID and Url link |
| * Gene Centered Interaction Network. |
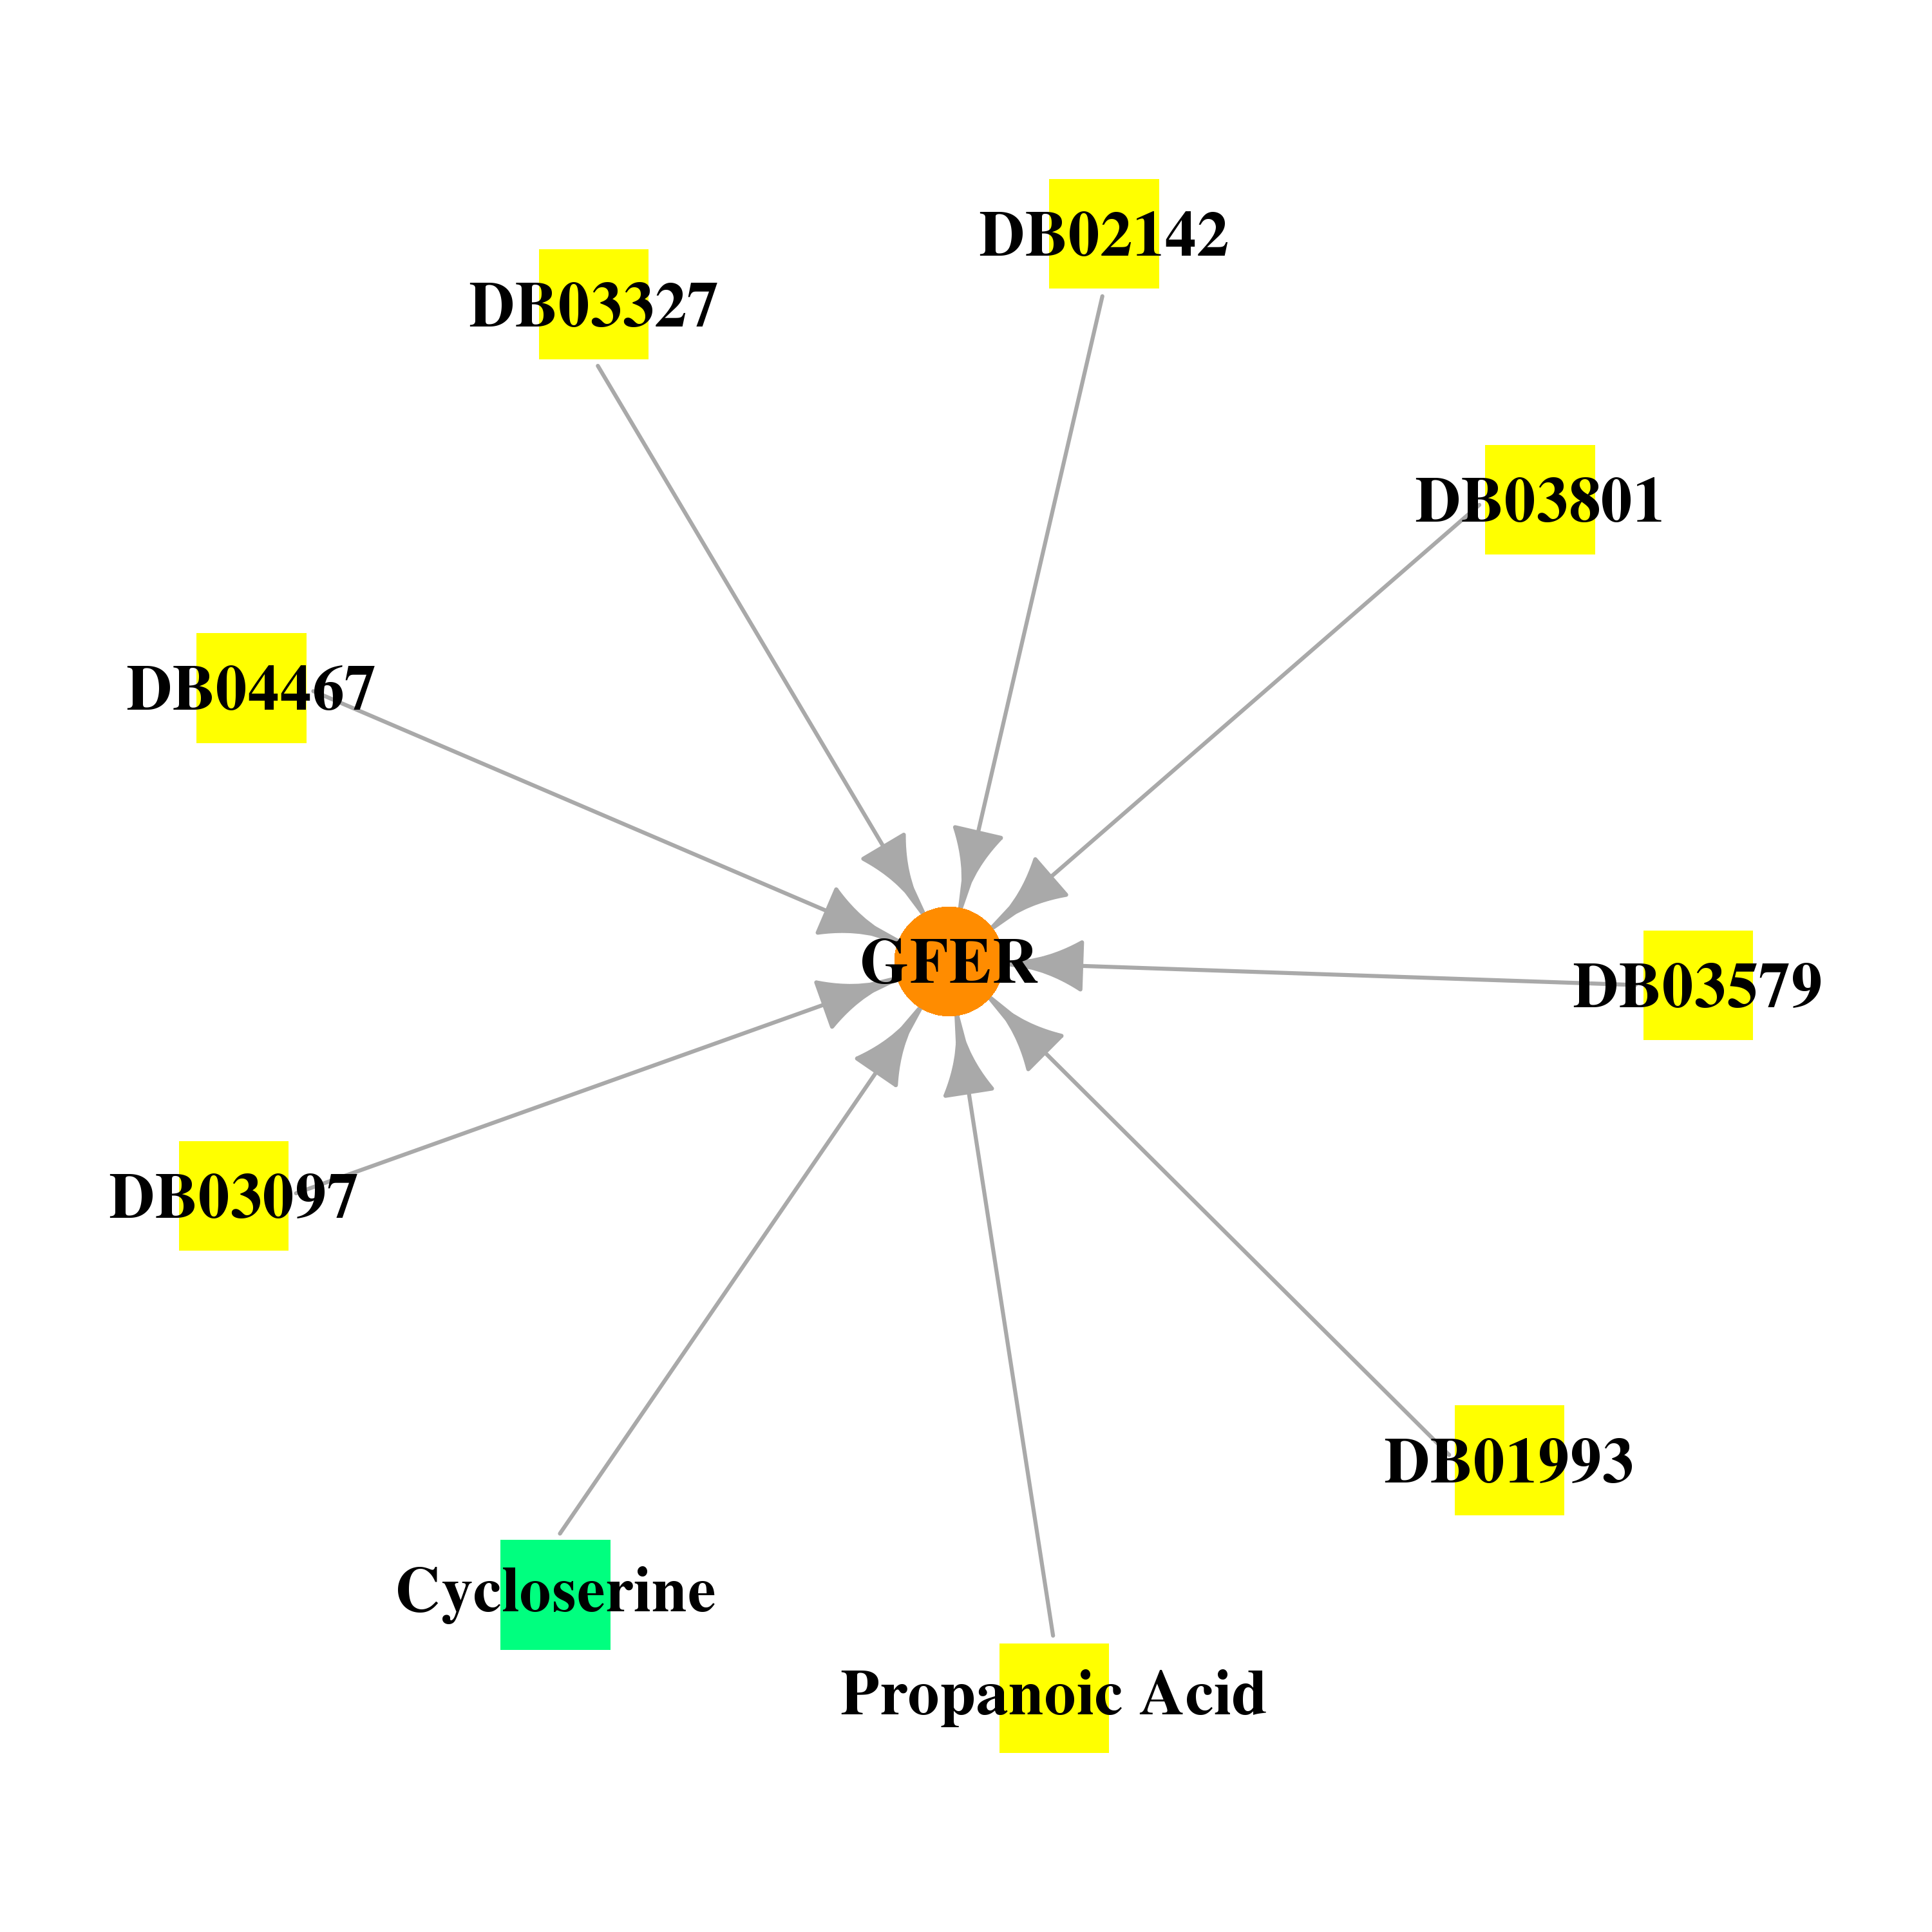 |
| * Drug Centered Interaction Network. |
| DrugBank ID | Target Name | Drug Groups | Generic Name | Drug Centered Network | Drug Structure |
| DB00260 | growth factor, augmenter of liver regeneration | approved | Cycloserine | 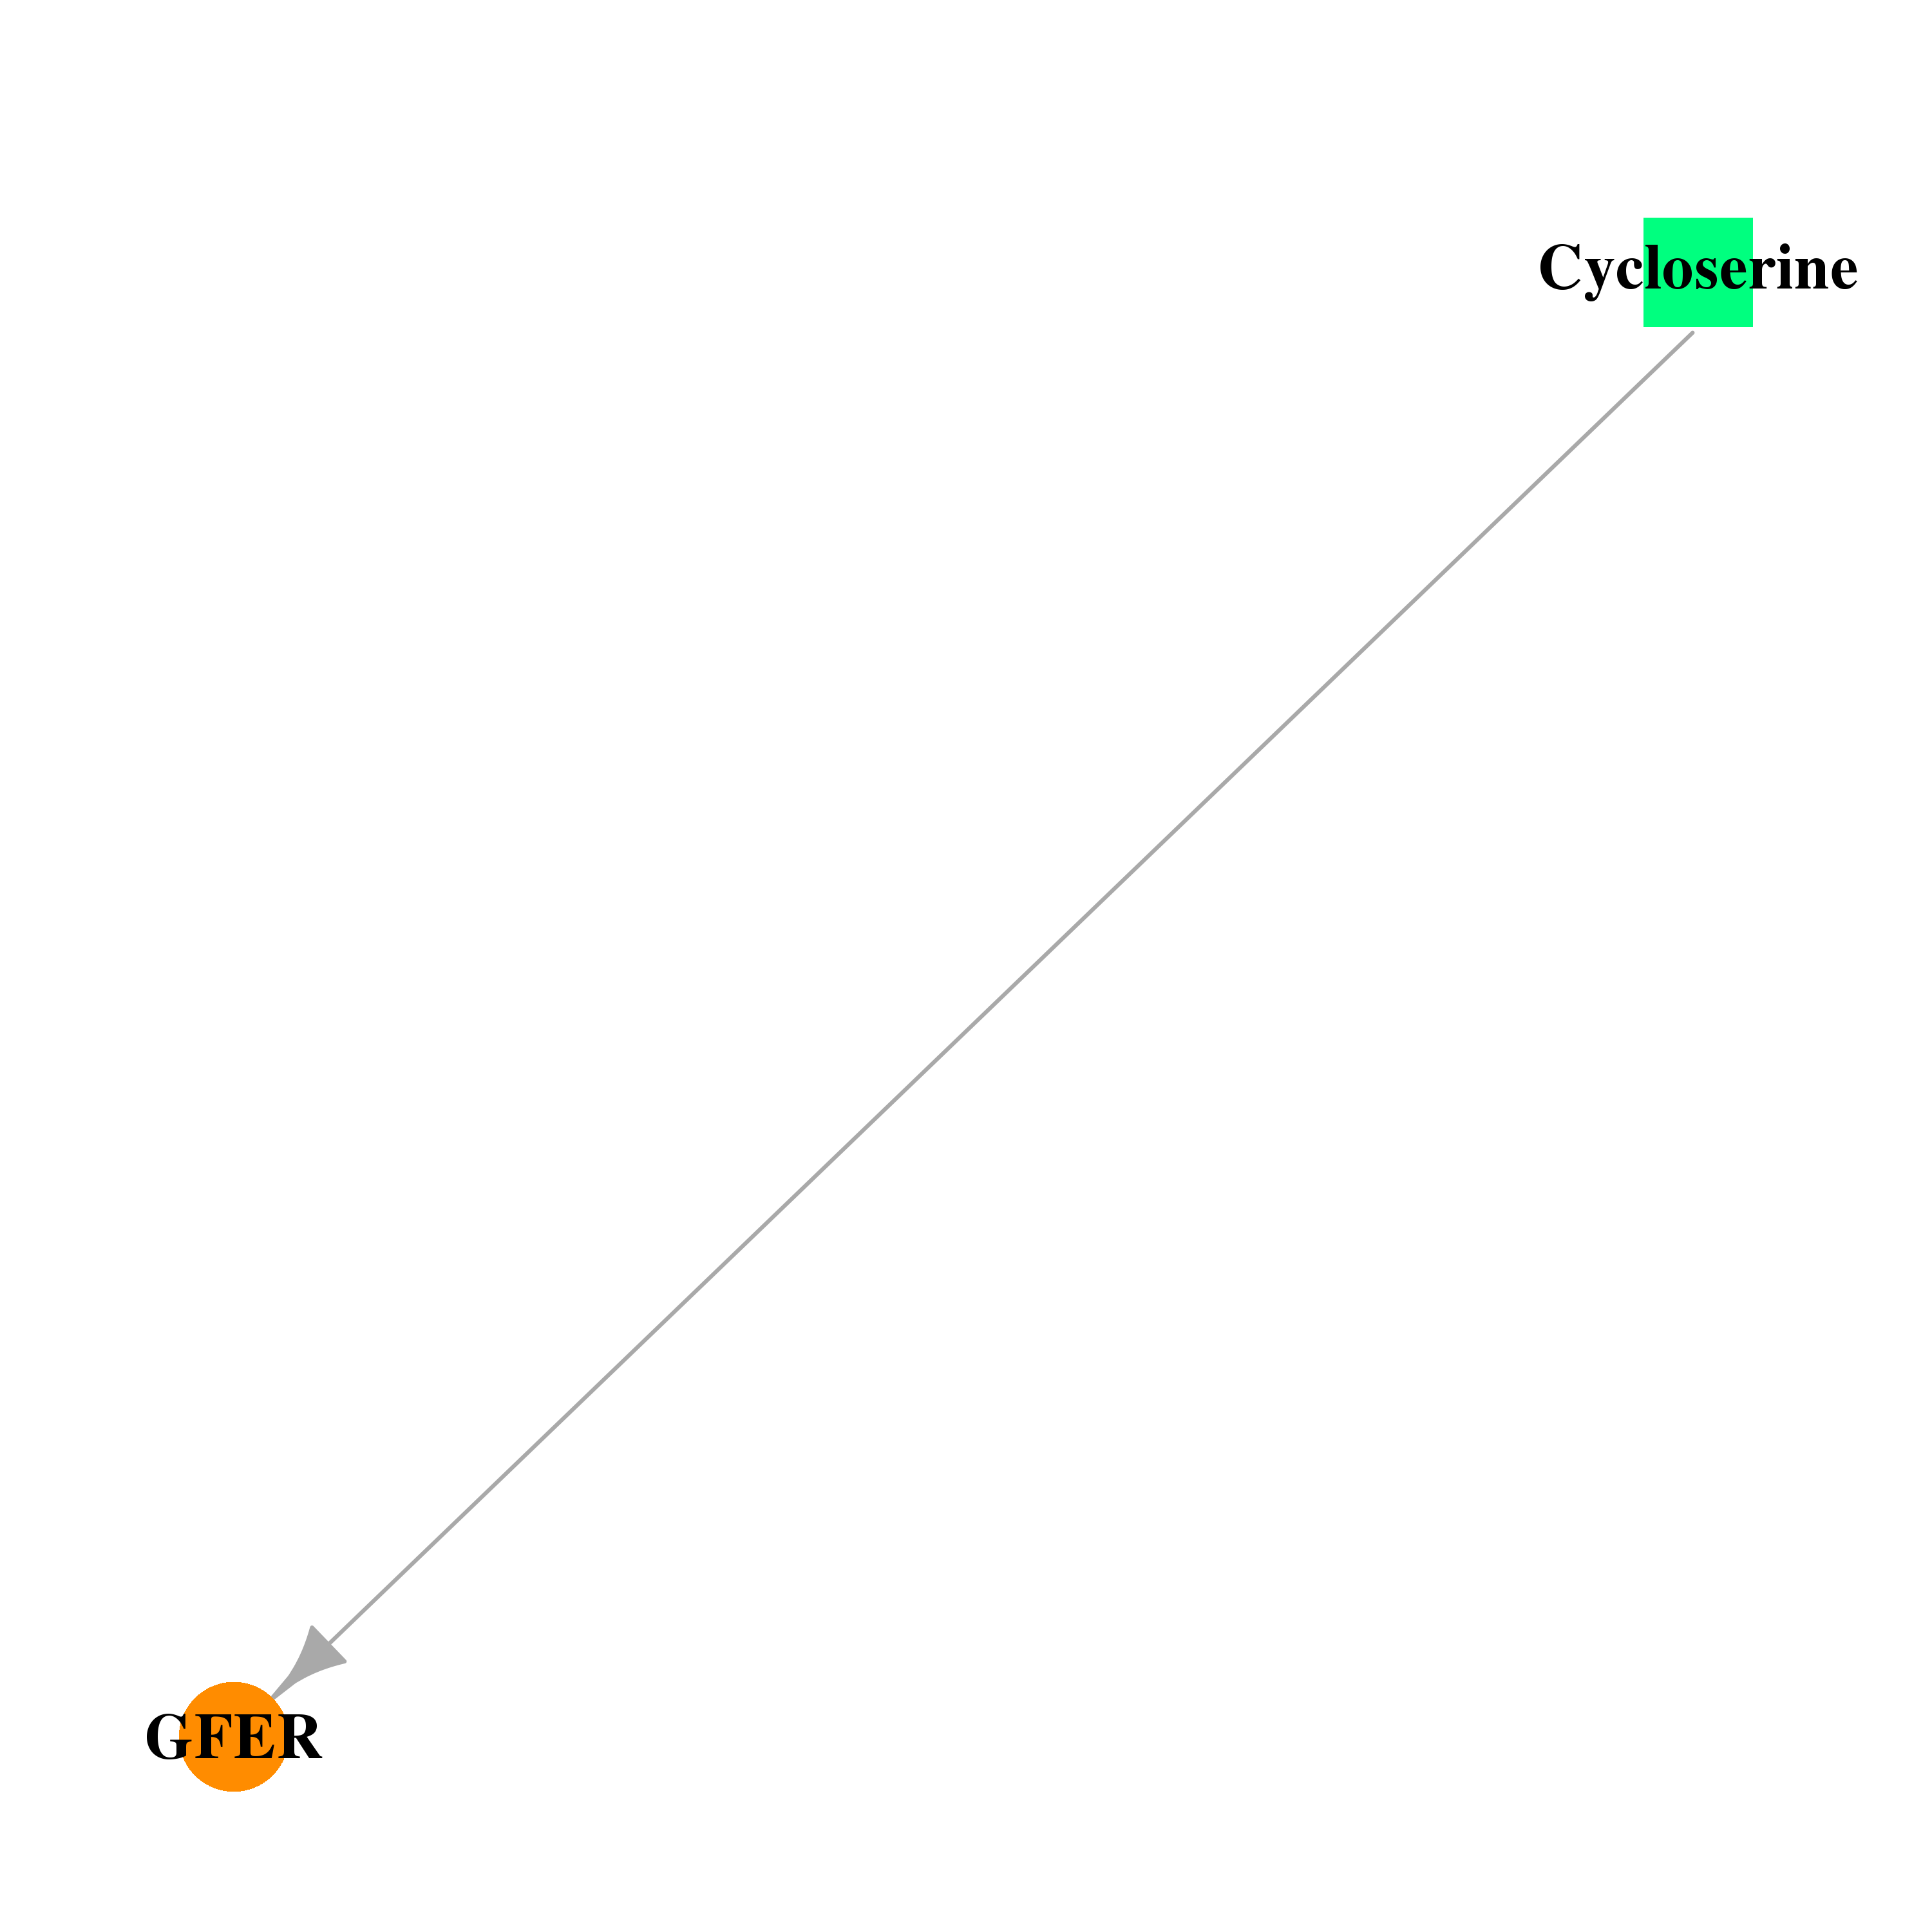 | 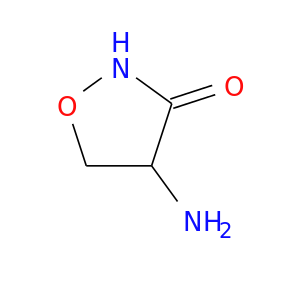 |
| DB01993 | growth factor, augmenter of liver regeneration | experimental | N-(5'-Phosphopyridoxyl)-D-Alanine | 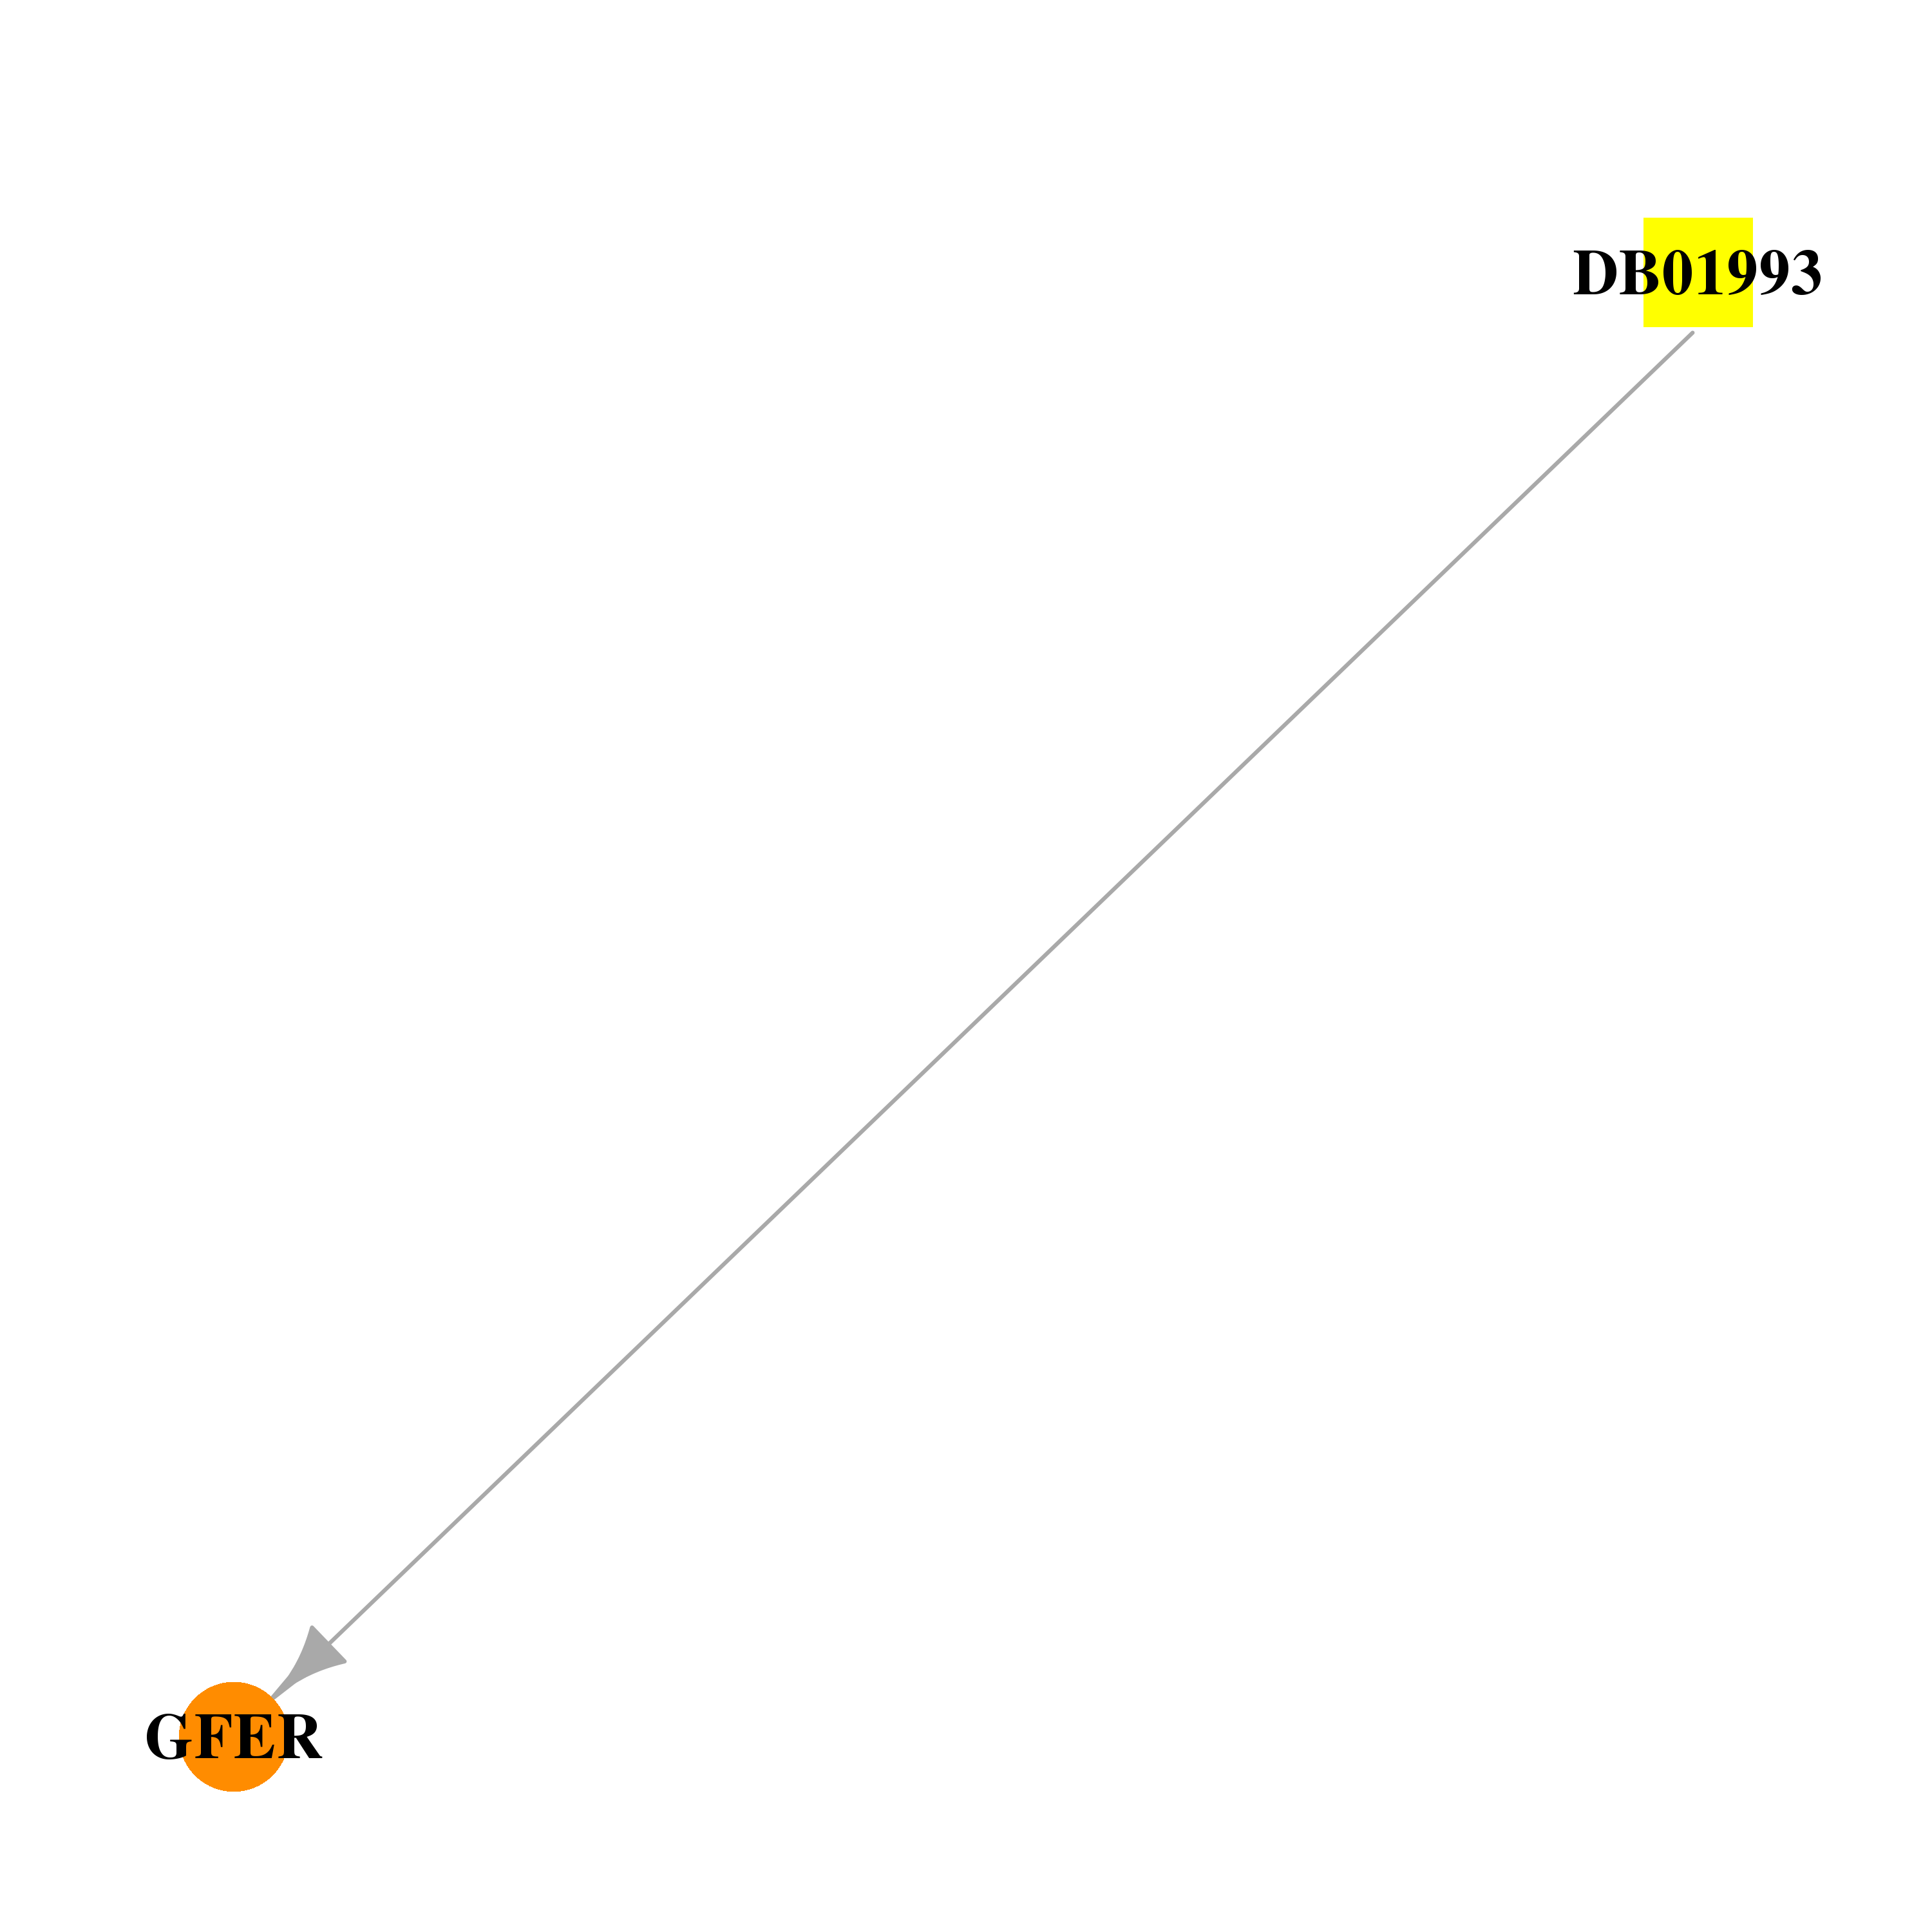 | 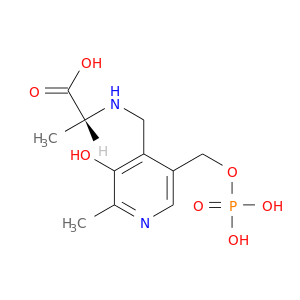 |
| DB02142 | growth factor, augmenter of liver regeneration | experimental | Pyridoxamine-5'-Phosphate |  | 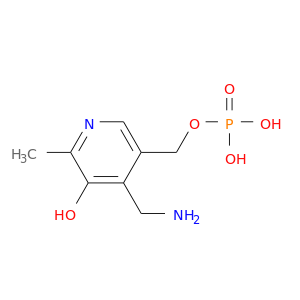 |
| DB03097 | growth factor, augmenter of liver regeneration | experimental | Pmp-Hydroxyisoxazole, Pyridoxamine-5-Phosphate-Hydroxyisoxazole |  | 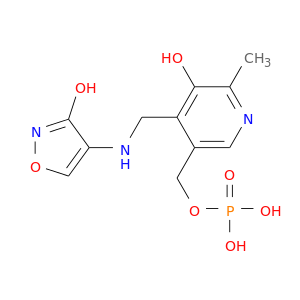 |
| DB03327 | growth factor, augmenter of liver regeneration | experimental | {1-[(3-Hydroxy-Methyl-5-Phosphonooxy-Methyl-Pyridin-4-Ylmethyl)-Amino]-Ethyl}-Phosphonic Acid |  | 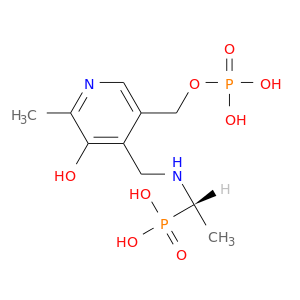 |
| DB03579 | growth factor, augmenter of liver regeneration | experimental | Pyridoxyl-N,O-Cycloserylamide-5-Monophosphate |  | 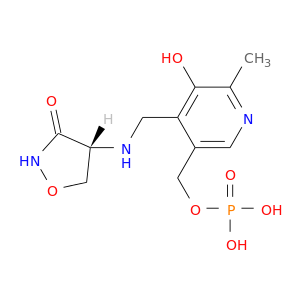 |
| DB03766 | growth factor, augmenter of liver regeneration | experimental | Propanoic Acid | 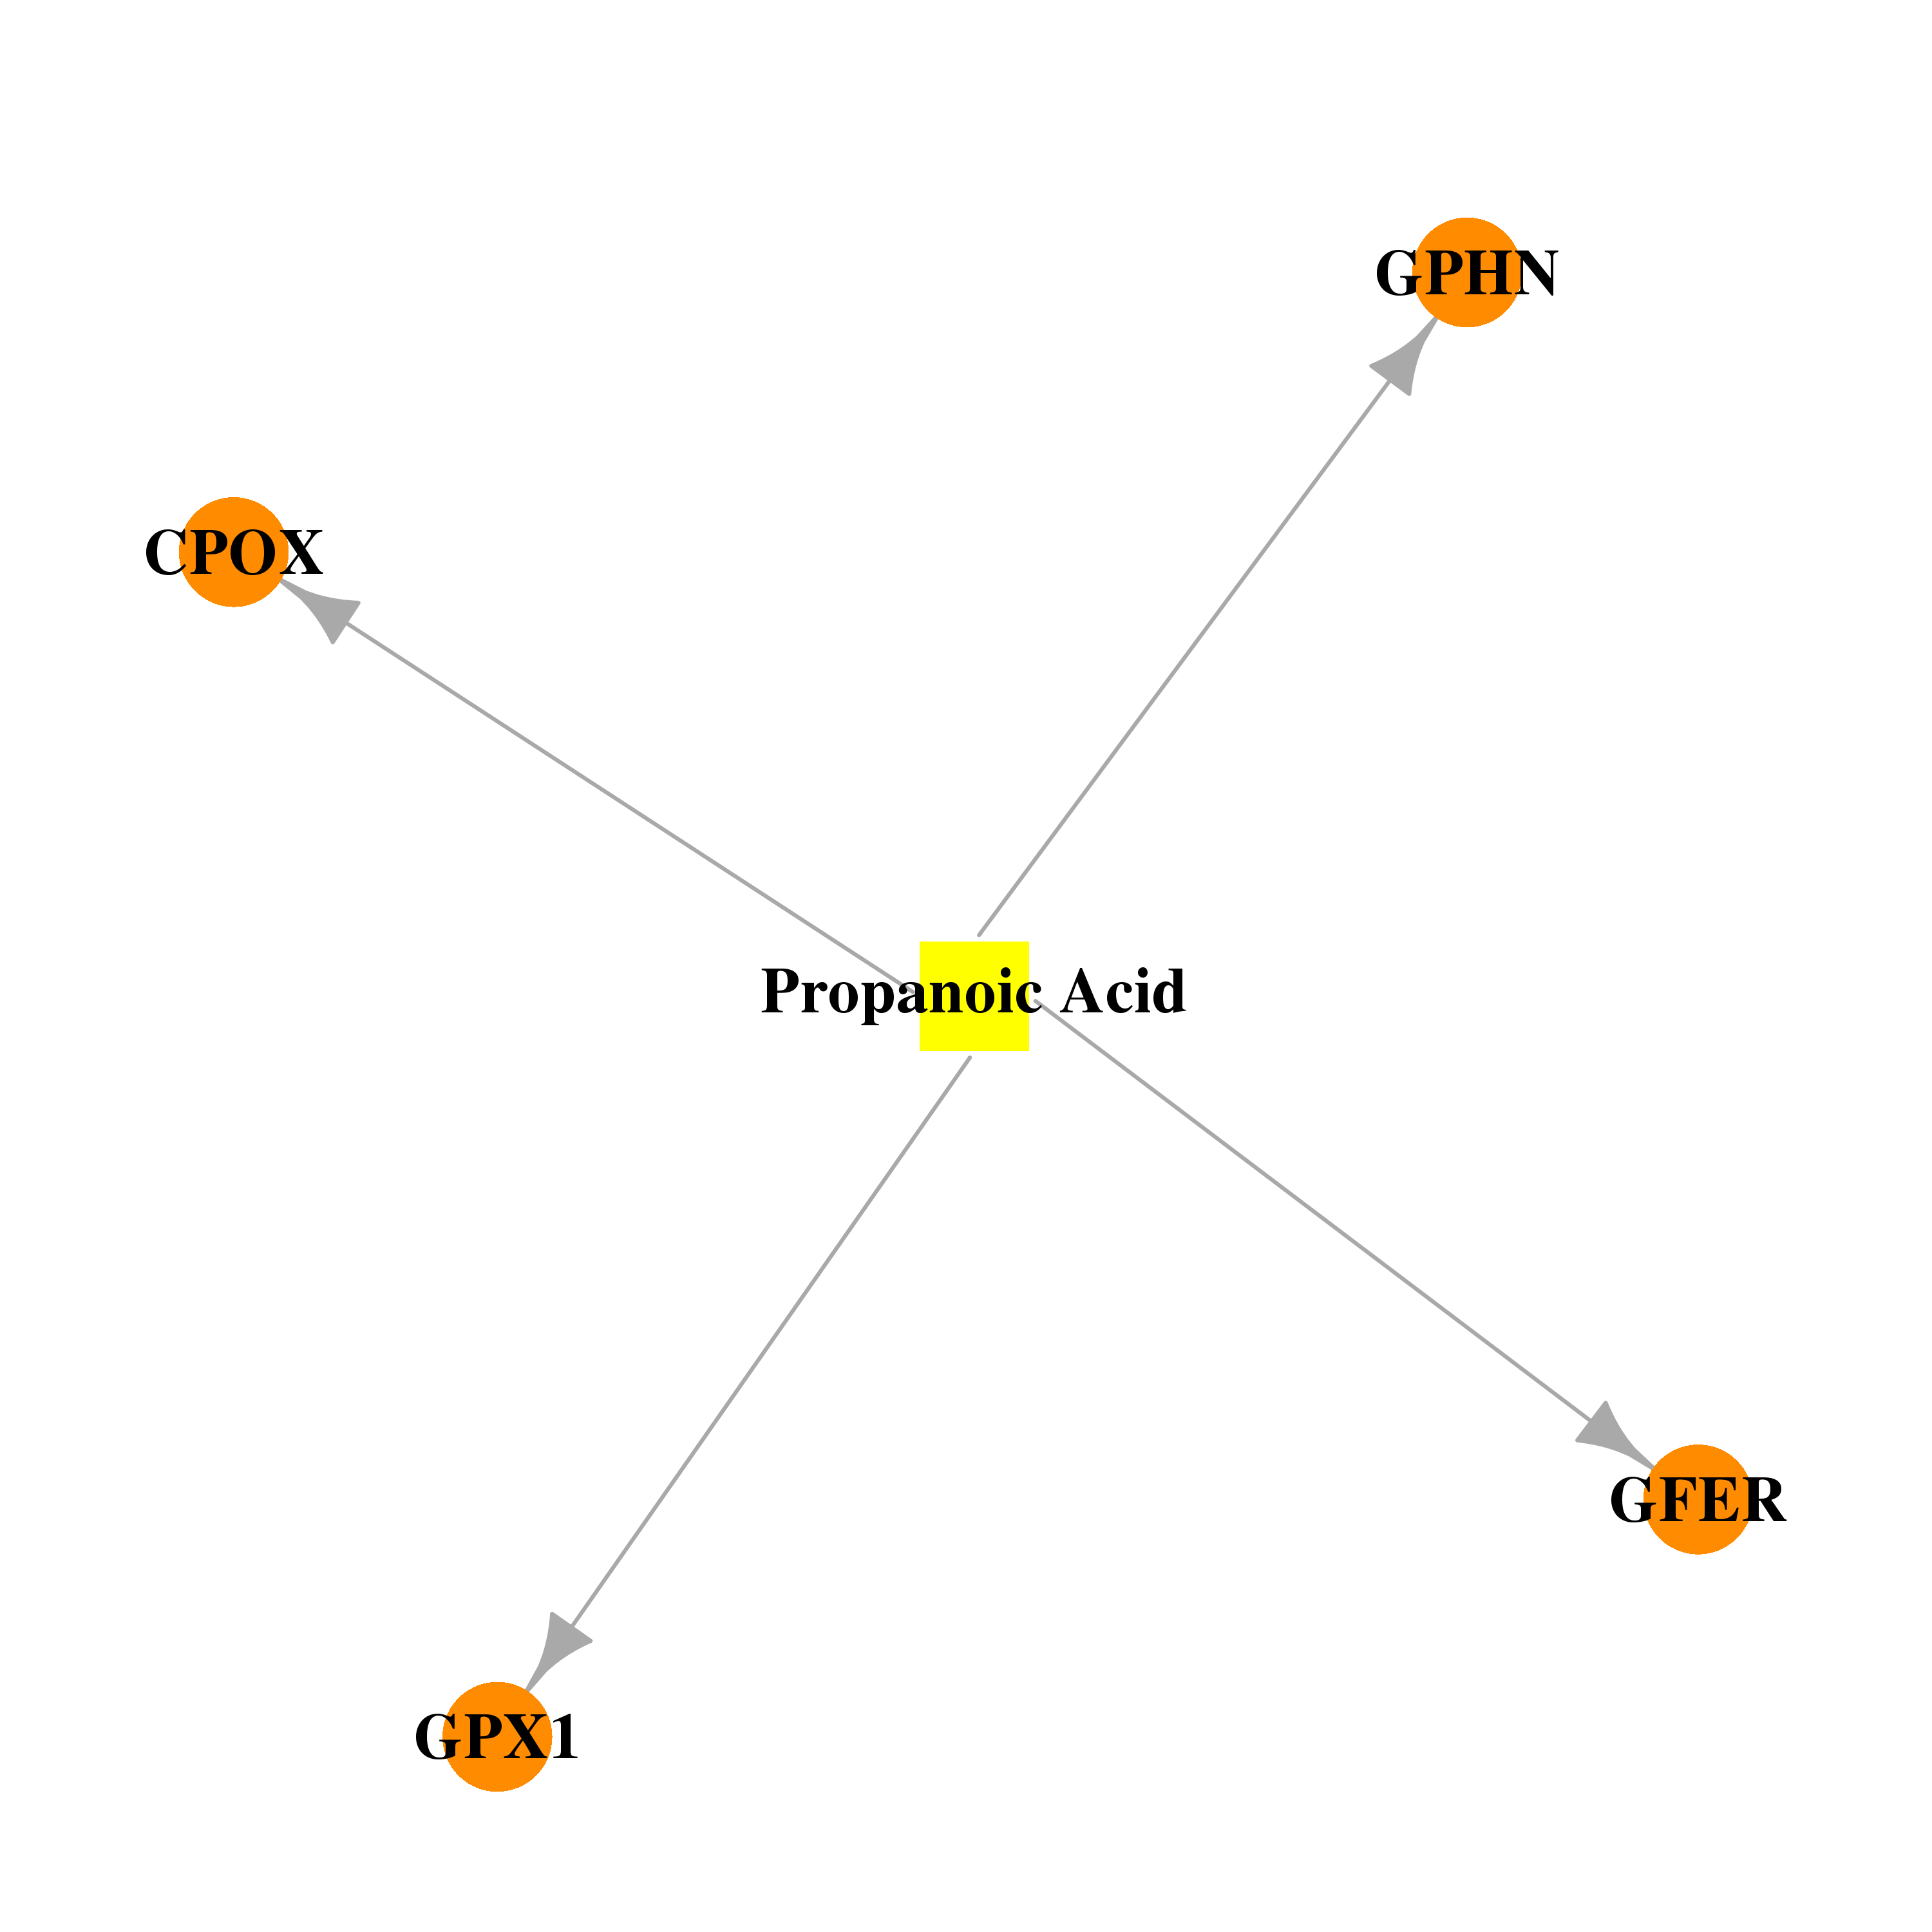 |  |
| DB03801 | growth factor, augmenter of liver regeneration | experimental | Lysine Nz-Carboxylic Acid |  | 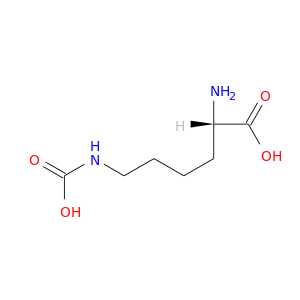 |
| DB04467 | growth factor, augmenter of liver regeneration | experimental | Pyridoxyl-Alanine-5-Phosphate | 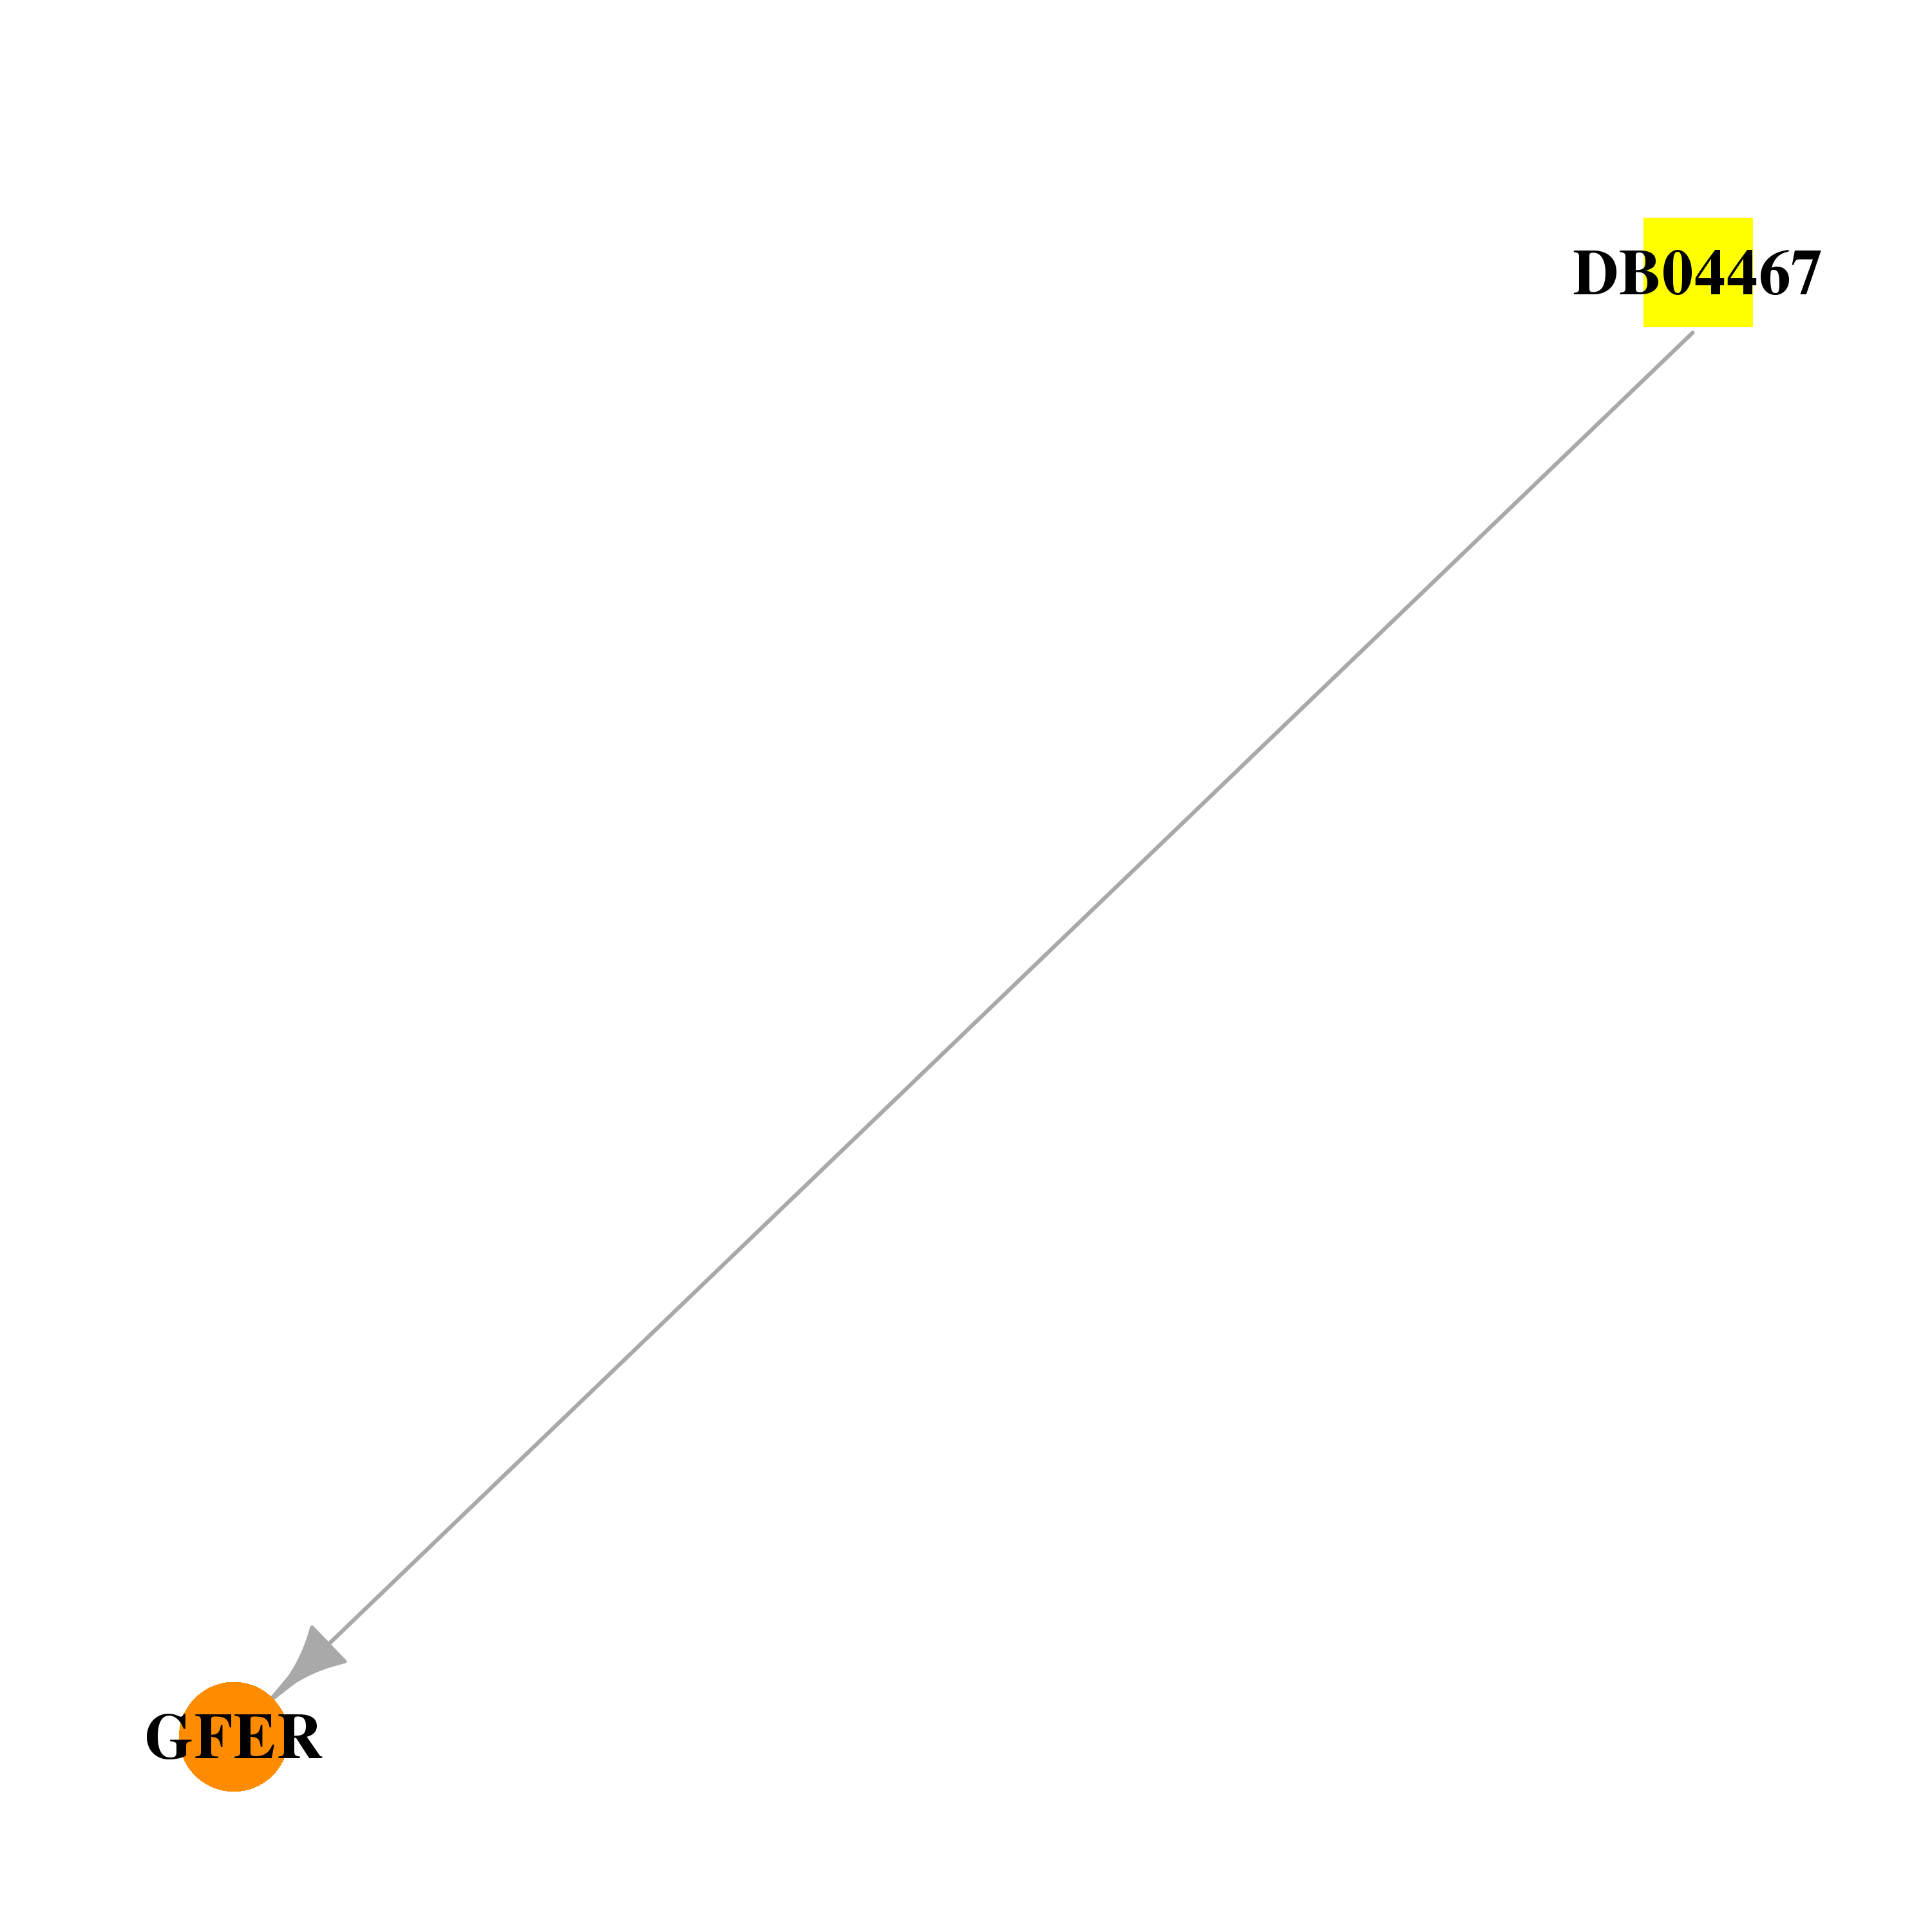 |  |
| Top |
| Cross referenced IDs for GFER |
| * We obtained these cross-references from Uniprot database. It covers 150 different DBs, 18 categories. http://www.uniprot.org/help/cross_references_section |
: Open all cross reference information
|
Copyright © 2016-Present - The Univsersity of Texas Health Science Center at Houston @ |