|
|||||||||||||||||||||||||||||||||||||||||||||||||||||||||||||||||||||||||||||||||||||||||||||||||||||||||||||||||||||||||||||||||||||||||||||||||||||||||||||||||||||||||||||||||||||||||||||||||||||||||||||||||||||||||||||||||||||||||||||||||||||||||||||||||||||||||||||||||||||||||||||||||||||||||||||||||||||||||||||||||||||||||||||
| |
| Phenotypic Information (metabolism pathway, cancer, disease, phenome) |
| |
| |
| Gene-Gene Network Information: Co-Expression Network, Interacting Genes & KEGG |
| |
|


| Gene Summary for GGT1 |
| Top |
| Phenotypic Information for GGT1(metabolism pathway, cancer, disease, phenome) |
| Cancer | CGAP: GGT1 |
| Familial Cancer Database: GGT1 | |
| * This gene is included in those cancer gene databases. |
|
|
|
|
|
|
| |||||||||||||||||||||||||||||||||||||||||||||||||||||||||||||||||||||||||||||||||||||||||||||||||||||||||||||||||||||||||||||||||||||||||||||||||||||||||||||||||||||||||||||||||||||||||||||||||||||||||||||||||||||||||||||||||||||||||||||||||||||||||||||||||||||||||||||||||||||||||||||||||||||||||||||||||||||||||||||||||||||||
Oncogene 1 | Significant driver gene in | ||||||||||||||||||||||||||||||||||||||||||||||||||||||||||||||||||||||||||||||||||||||||||||||||||||||||||||||||||||||||||||||||||||||||||||||||||||||||||||||||||||||||||||||||||||||||||||||||||||||||||||||||||||||||||||||||||||||||||||||||||||||||||||||||||||||||||||||||||||||||||||||||||||||||||||||||||||||||||||||||||||||||||||
| cf) number; DB name 1 Oncogene; http://nar.oxfordjournals.org/content/35/suppl_1/D721.long, 2 Tumor Suppressor gene; https://bioinfo.uth.edu/TSGene/, 3 Cancer Gene Census; http://www.nature.com/nrc/journal/v4/n3/abs/nrc1299.html, 4 CancerGenes; http://nar.oxfordjournals.org/content/35/suppl_1/D721.long, 5 Network of Cancer Gene; http://ncg.kcl.ac.uk/index.php, 1Therapeutic Vulnerabilities in Cancer; http://cbio.mskcc.org/cancergenomics/statius/ |
| KEGG_TAURINE_AND_HYPOTAURINE_METABOLISM KEGG_SELENOAMINO_ACID_METABOLISM KEGG_GLUTATHIONE_METABOLISM KEGG_ARACHIDONIC_ACID_METABOLISM | |
| OMIM | |
| Orphanet | |
| Disease | KEGG Disease: GGT1 |
| MedGen: GGT1 (Human Medical Genetics with Condition) | |
| ClinVar: GGT1 | |
| Phenotype | MGI: GGT1 (International Mouse Phenotyping Consortium) |
| PhenomicDB: GGT1 | |
| Mutations for GGT1 |
| * Under tables are showing count per each tissue to give us broad intuition about tissue specific mutation patterns.You can go to the detailed page for each mutation database's web site. |
| - Statistics for Tissue and Mutation type | Top |
 |
| - For Inter-chromosomal Variations |
| There's no inter-chromosomal structural variation. |
| - For Intra-chromosomal Variations |
| * Intra-chromosomal variantions includes 'intrachromosomal amplicon to amplicon', 'intrachromosomal amplicon to non-amplified dna', 'intrachromosomal deletion', 'intrachromosomal fold-back inversion', 'intrachromosomal inversion', 'intrachromosomal tandem duplication', 'Intrachromosomal unknown type', 'intrachromosomal with inverted orientation', 'intrachromosomal with non-inverted orientation'. |
 |
| Sample | Symbol_a | Chr_a | Start_a | End_a | Symbol_b | Chr_b | Start_b | End_b |
| pancreas | GGT1 | chr22 | 25008512 | 25008532 | GGT1 | chr22 | 25008935 | 25008955 |
| cf) Tissue number; Tissue name (1;Breast, 2;Central_nervous_system, 3;Haematopoietic_and_lymphoid_tissue, 4;Large_intestine, 5;Liver, 6;Lung, 7;Ovary, 8;Pancreas, 9;Prostate, 10;Skin, 11;Soft_tissue, 12;Upper_aerodigestive_tract) |
| * From mRNA Sanger sequences, Chitars2.0 arranged chimeric transcripts. This table shows GGT1 related fusion information. |
| ID | Head Gene | Tail Gene | Accession | Gene_a | qStart_a | qEnd_a | Chromosome_a | tStart_a | tEnd_a | Gene_a | qStart_a | qEnd_a | Chromosome_a | tStart_a | tEnd_a |
| AW182722 | GGT1 | 2 | 88 | 22 | 24981603 | 24981689 | CARS2 | 85 | 429 | 13 | 111353839 | 111358446 | |
| Top |
| Mutation type/ Tissue ID | brca | cns | cerv | endome | haematopo | kidn | Lintest | liver | lung | ns | ovary | pancre | prost | skin | stoma | thyro | urina | |||
| Total # sample | 1 | 1 | ||||||||||||||||||
| GAIN (# sample) | 1 | 1 | ||||||||||||||||||
| LOSS (# sample) |
| cf) Tissue ID; Tissue type (1; Breast, 2; Central_nervous_system, 3; Cervix, 4; Endometrium, 5; Haematopoietic_and_lymphoid_tissue, 6; Kidney, 7; Large_intestine, 8; Liver, 9; Lung, 10; NS, 11; Ovary, 12; Pancreas, 13; Prostate, 14; Skin, 15; Stomach, 16; Thyroid, 17; Urinary_tract) |
| Top |
|
 |
| Top |
| Stat. for Non-Synonymous SNVs (# total SNVs=49) | (# total SNVs=10) |
 |  |
(# total SNVs=9) | (# total SNVs=0) |
 |
| Top |
| * When you move the cursor on each content, you can see more deailed mutation information on the Tooltip. Those are primary_site,primary_histology,mutation(aa),pubmedID. |
| GRCh37 position | Mutation(aa) | Unique sampleID count |
| chr22:25023893-25023893 | p.S428N | 11 |
| chr22:25011062-25011062 | p.T117S | 10 |
| chr22:25010758-25010758 | p.D60D | 8 |
| chr22:25023869-25023869 | p.M421fs*75 | 7 |
| chr22:25024072-25024072 | p.C454F | 6 |
| chr22:25024076-25024076 | p.P455P | 6 |
| chr22:25023903-25023903 | p.N431N | 6 |
| chr22:25016296-25016296 | p.G128G | 5 |
| chr22:25023513-25023513 | p.G379R | 4 |
| chr22:25010828-25010828 | p.G84S | 4 |
| Top |
|
 |
| Point Mutation/ Tissue ID | 1 | 2 | 3 | 4 | 5 | 6 | 7 | 8 | 9 | 10 | 11 | 12 | 13 | 14 | 15 | 16 | 17 | 18 | 19 | 20 |
| # sample | 2 | 3 | 1 | 4 | 1 | 1 | 2 | 1 | 2 | 2 | 1 | 1 | 1 | 10 | 8 | 2 | 5 | |||
| # mutation | 2 | 2 | 1 | 2 | 1 | 1 | 2 | 1 | 2 | 2 | 1 | 1 | 1 | 10 | 8 | 2 | 6 | |||
| nonsynonymous SNV | 2 | 1 | 1 | 1 | 1 | 1 | 1 | 1 | 1 | 1 | 5 | 4 | 2 | 5 | ||||||
| synonymous SNV | 2 | 1 | 1 | 1 | 1 | 1 | 1 | 5 | 4 | 1 |
| cf) Tissue ID; Tissue type (1; BLCA[Bladder Urothelial Carcinoma], 2; BRCA[Breast invasive carcinoma], 3; CESC[Cervical squamous cell carcinoma and endocervical adenocarcinoma], 4; COAD[Colon adenocarcinoma], 5; GBM[Glioblastoma multiforme], 6; Glioma Low Grade, 7; HNSC[Head and Neck squamous cell carcinoma], 8; KICH[Kidney Chromophobe], 9; KIRC[Kidney renal clear cell carcinoma], 10; KIRP[Kidney renal papillary cell carcinoma], 11; LAML[Acute Myeloid Leukemia], 12; LUAD[Lung adenocarcinoma], 13; LUSC[Lung squamous cell carcinoma], 14; OV[Ovarian serous cystadenocarcinoma ], 15; PAAD[Pancreatic adenocarcinoma], 16; PRAD[Prostate adenocarcinoma], 17; SKCM[Skin Cutaneous Melanoma], 18:STAD[Stomach adenocarcinoma], 19:THCA[Thyroid carcinoma], 20:UCEC[Uterine Corpus Endometrial Carcinoma]) |
| Top |
| * We represented just top 10 SNVs. When you move the cursor on each content, you can see more deailed mutation information on the Tooltip. Those are primary_site, primary_histology, mutation(aa), pubmedID. |
| Genomic Position | Mutation(aa) | Unique sampleID count |
| chr22:25010828 | p.G84S,GGT1 | 3 |
| chr22:25023893 | p.D60D,GGT1 | 2 |
| chr22:25010758 | p.S428N,GGT1 | 2 |
| chr22:25010801 | p.V336V,GGT1 | 1 |
| chr22:25019101 | p.S451L,GGT1 | 1 |
| chr22:25023444 | p.T92T,GGT1 | 1 |
| chr22:25010806 | p.D337G,GGT1 | 1 |
| chr22:25023936 | p.S451S,GGT1 | 1 |
| chr22:25019109 | p.R107H,GGT1 | 1 |
| chr22:25023476 | p.A351T,GGT1 | 1 |
| * Copy number data were extracted from TCGA using R package TCGA-Assembler. The URLs of all public data files on TCGA DCC data server were gathered on Jan-05-2015. Function ProcessCNAData in TCGA-Assembler package was used to obtain gene-level copy number value which is calculated as the average copy number of the genomic region of a gene. |
 |
| cf) Tissue ID[Tissue type]: BLCA[Bladder Urothelial Carcinoma], BRCA[Breast invasive carcinoma], CESC[Cervical squamous cell carcinoma and endocervical adenocarcinoma], COAD[Colon adenocarcinoma], GBM[Glioblastoma multiforme], Glioma Low Grade, HNSC[Head and Neck squamous cell carcinoma], KICH[Kidney Chromophobe], KIRC[Kidney renal clear cell carcinoma], KIRP[Kidney renal papillary cell carcinoma], LAML[Acute Myeloid Leukemia], LUAD[Lung adenocarcinoma], LUSC[Lung squamous cell carcinoma], OV[Ovarian serous cystadenocarcinoma ], PAAD[Pancreatic adenocarcinoma], PRAD[Prostate adenocarcinoma], SKCM[Skin Cutaneous Melanoma], STAD[Stomach adenocarcinoma], THCA[Thyroid carcinoma], UCEC[Uterine Corpus Endometrial Carcinoma] |
| Top |
| Gene Expression for GGT1 |
| * CCLE gene expression data were extracted from CCLE_Expression_Entrez_2012-10-18.res: Gene-centric RMA-normalized mRNA expression data. |
 |
| * Normalized gene expression data of RNASeqV2 was extracted from TCGA using R package TCGA-Assembler. The URLs of all public data files on TCGA DCC data server were gathered at Jan-05-2015. Only eight cancer types have enough normal control samples for differential expression analysis. (t test, adjusted p<0.05 (using Benjamini-Hochberg FDR)) |
 |
| Top |
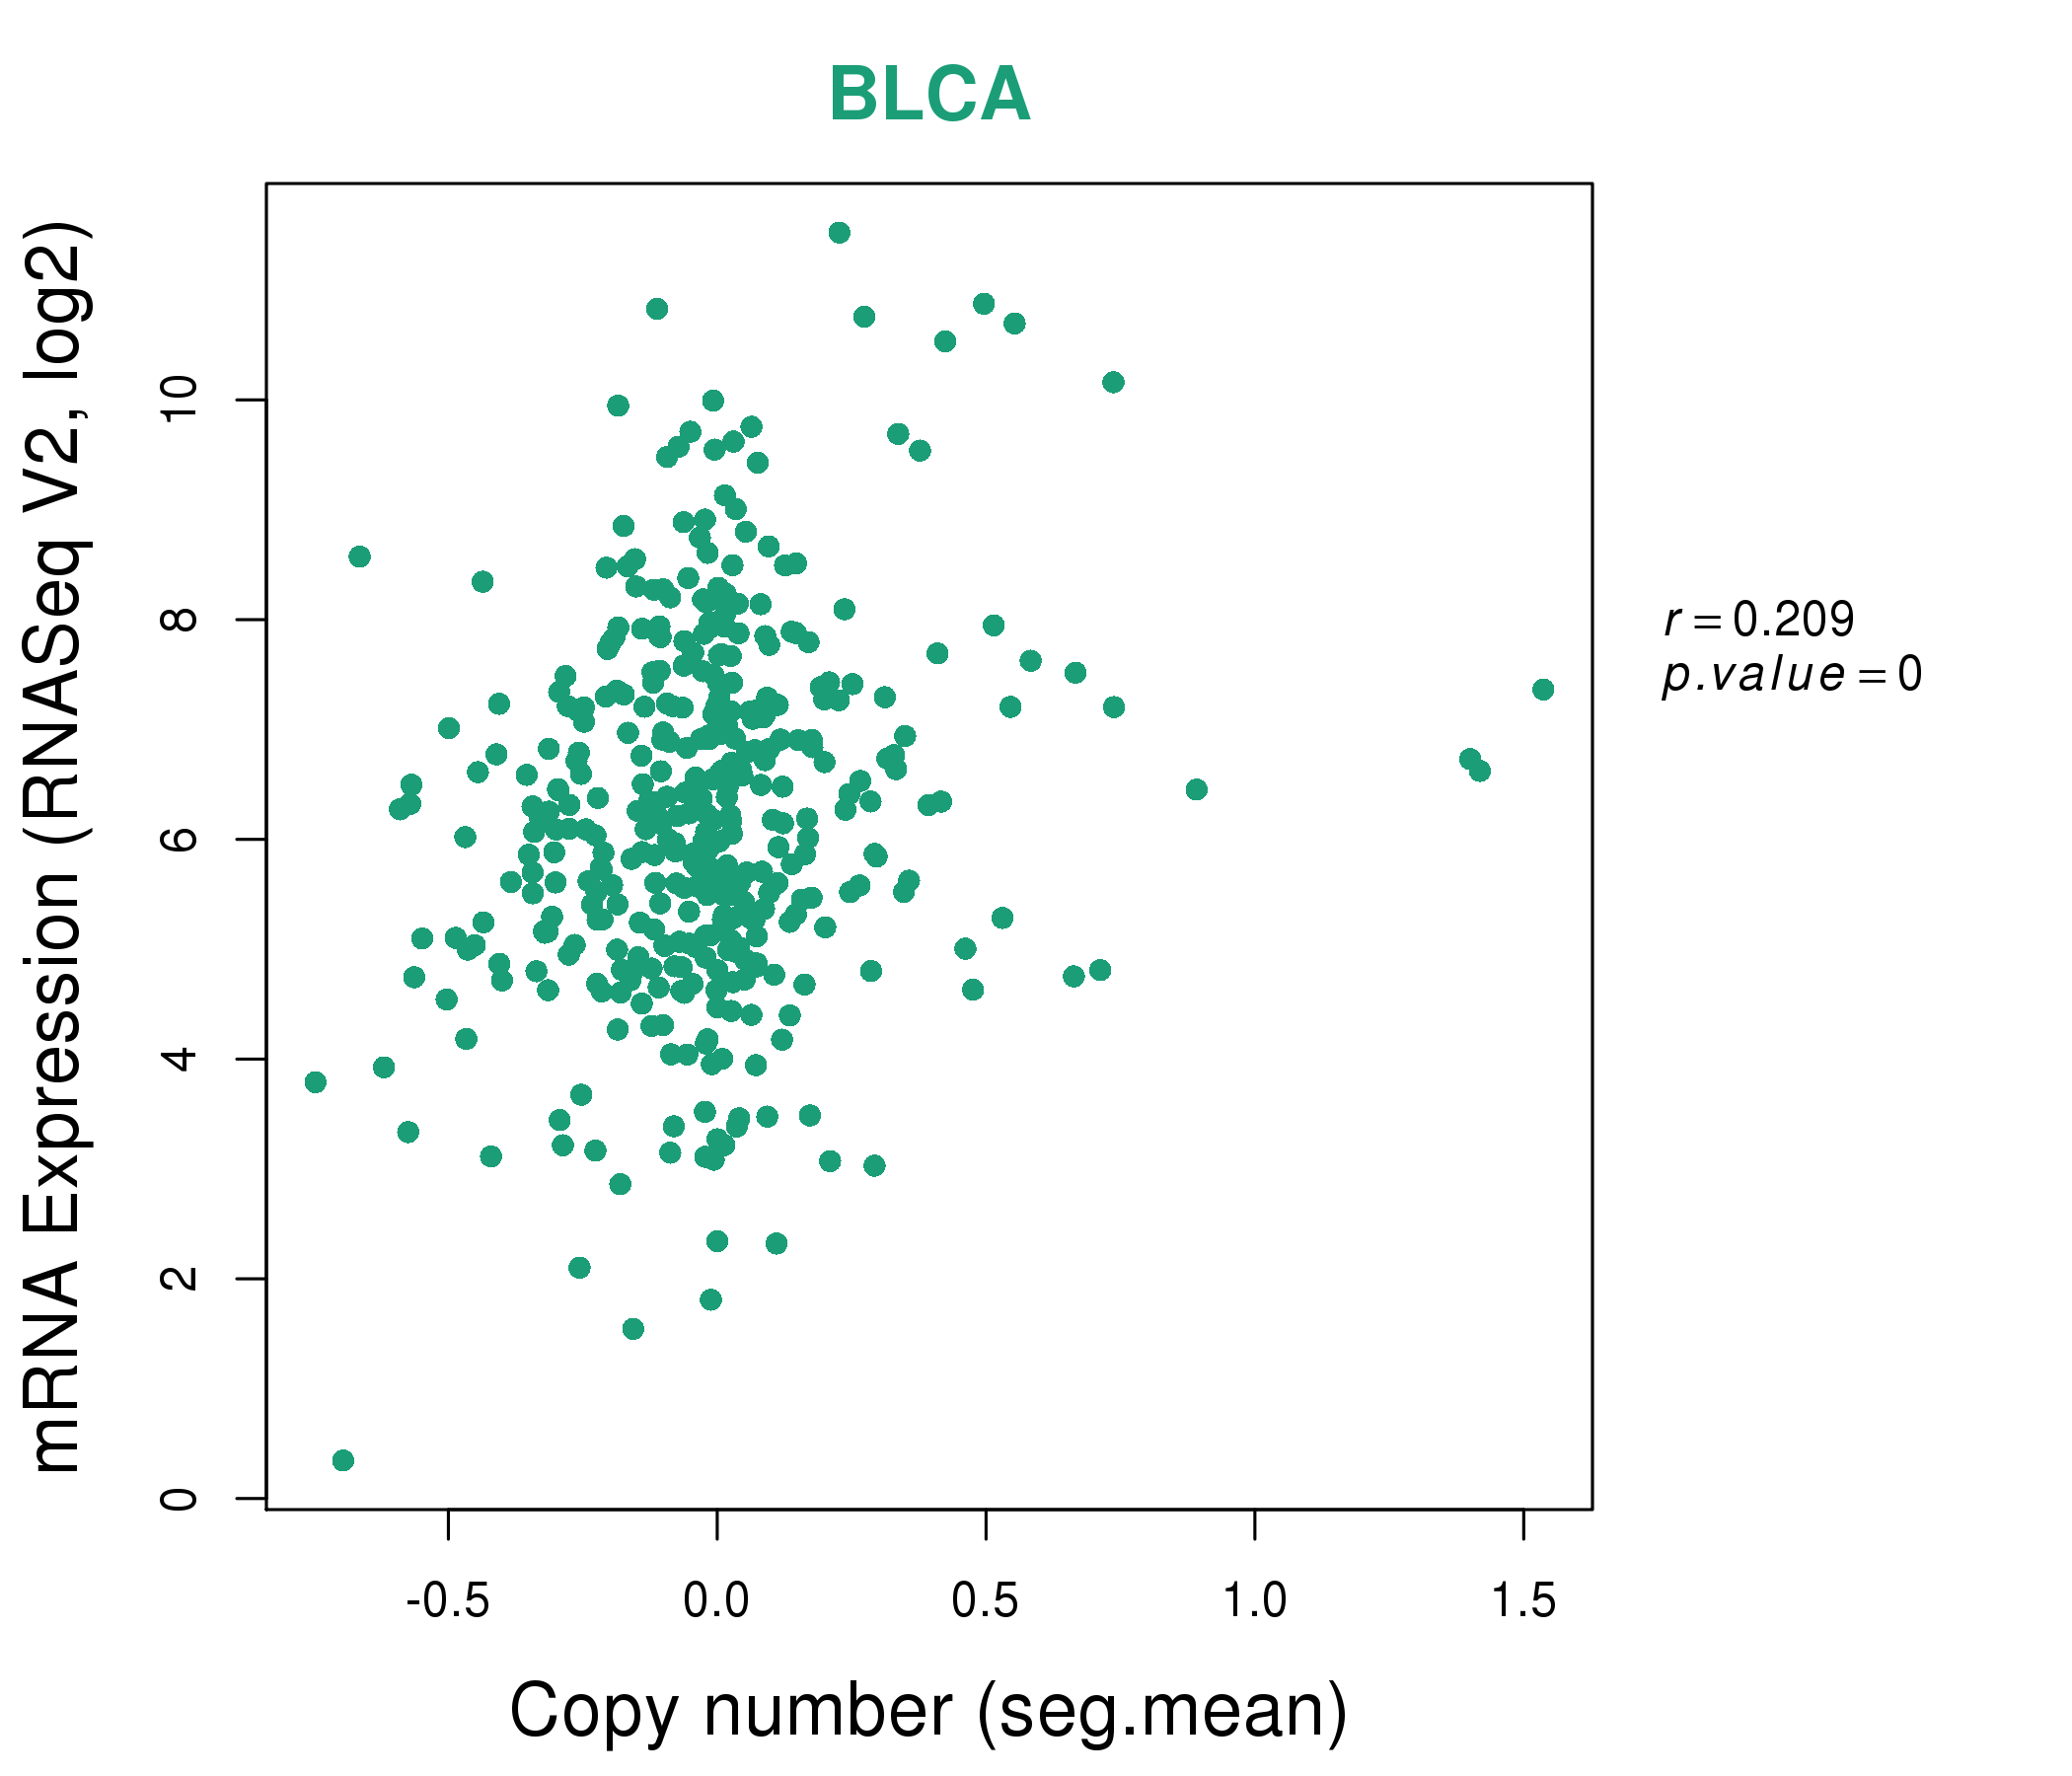
| * This plots show the correlation between CNV and gene expression. |
: Open all plots for all cancer types
 |
|
 |
|


| Top |
| Gene-Gene Network Information |
| * Co-Expression network figures were drawn using R package igraph. Only the top 20 genes with the highest correlations were shown. Red circle: input gene, orange circle: cell metabolism gene, sky circle: other gene |
: Open all plots for all cancer types
 |
| ||||
| ACSM1,AFMID,AKR1C2,AKR1D1,C15orf43,LRRC75B,CLPSL1, C6orf223,DBI,GGT1,GGT3P,GGTLC1,GGTLC2,HAAO, LOC644165,MUCL1,OXER1,SERHL2,SERHL,SPINK8,SULT1C3 | ACSL3,ADAM2,AFMID,ALOX15B,B3GAT1,C15orf43,DHCR7, DHRS2,FIBCD1,GGT1,GGTLC2,HIST1H3D,HMGCS2,MVK, NSUN2,PNLIPRP3,SERHL2,SERHL,SLC15A1,SPINK8,SRD5A1 | ||||
 |
| ||||
| ABCB9,ABCC2,ACOT11,AP1B1,BMP7,LRRC75B,CISD3, COMT,FGFR3,GGT1,GGT3P,GGTLC1,GGTLC2,ID1, PKLR,PLA2G4F,RAB11FIP4,SCARB1,SMAD6,STX3,ZNRF3 | ADIRF,CDH16,CLDN15,CYP3A7,FAM109A,GGT1,GGT3P, GGTLC1,GGTLC2,HEBP1,KDM8,KCP,NAALADL1,NAT8B, PKLR,SEC16B,SLC17A8,SLC34A2,TBX3,AGMO,XPNPEP2 |


| * Co-Expression network figures were drawn using R package igraph. Only the top 20 genes with the highest correlations were shown. Red circle: input gene, orange circle: cell metabolism gene, sky circle: other gene |
: Open all plots for all cancer types
| Top |
: Open all interacting genes' information including KEGG pathway for all interacting genes from DAVID
| Top |
| Pharmacological Information for GGT1 |
| DB Category | DB Name | DB's ID and Url link |
| * Gene Centered Interaction Network. |
 |
| * Drug Centered Interaction Network. |
| DrugBank ID | Target Name | Drug Groups | Generic Name | Drug Centered Network | Drug Structure |
| DB00143 | gamma-glutamyltransferase 1 | approved; nutraceutical | Glutathione |  |  |
| Top |
| Cross referenced IDs for GGT1 |
| * We obtained these cross-references from Uniprot database. It covers 150 different DBs, 18 categories. http://www.uniprot.org/help/cross_references_section |
: Open all cross reference information
|
Copyright © 2016-Present - The Univsersity of Texas Health Science Center at Houston @ |