|
||||||||||||||||||||||||||||||||||||||||||||||||||||||||||||||||||||||||||||||||||||||||||||||||||||||||||||||||||||||||||||||||||||||||||||||||||||||||||||||||||||||||||||||||||||||||||||||||||||||||||||||||||||||||||||||||||||||||||||||||||||||||||||||||||||||||||||||||||||||||||||||||||||||||||||||||||||||||||
| |
| Phenotypic Information (metabolism pathway, cancer, disease, phenome) |
| |
| |
| Gene-Gene Network Information: Co-Expression Network, Interacting Genes & KEGG |
| |
|


| Gene Summary for GGT7 |
| Basic gene info. | Gene symbol | GGT7 |
| Gene name | gamma-glutamyltransferase 7 | |
| Synonyms | D20S101|GGT4|GGTL3|GGTL5|dJ18C9.2 | |
| Cytomap | UCSC genome browser: 20q11.22 | |
| Genomic location | chr20 :33432522-33460661 | |
| Type of gene | protein-coding | |
| RefGenes | NM_178026.2, | |
| Ensembl id | ENSG00000131067 | |
| Description | GGT 7gamma-glutamyltransferase 4gamma-glutamyltransferase-like 3gamma-glutamyltransferase-like 5gamma-glutamyltranspeptidase 7gamma-glutamyltranspeptidase-like 3glutathione hydrolase 7 | |
| Modification date | 20141207 | |
| dbXrefs | MIM : 612342 | |
| HGNC : HGNC | ||
| Ensembl : ENSG00000131067 | ||
| HPRD : 07488 | ||
| Vega : OTTHUMG00000032314 | ||
| Protein | UniProt: go to UniProt's Cross Reference DB Table | |
| Expression | CleanEX: HS_GGT7 | |
| BioGPS: 2686 | ||
| Gene Expression Atlas: ENSG00000131067 | ||
| The Human Protein Atlas: ENSG00000131067 | ||
| Pathway | NCI Pathway Interaction Database: GGT7 | |
| KEGG: GGT7 | ||
| REACTOME: GGT7 | ||
| ConsensusPathDB | ||
| Pathway Commons: GGT7 | ||
| Metabolism | MetaCyc: GGT7 | |
| HUMANCyc: GGT7 | ||
| Regulation | Ensembl's Regulation: ENSG00000131067 | |
| miRBase: chr20 :33,432,522-33,460,661 | ||
| TargetScan: NM_178026 | ||
| cisRED: ENSG00000131067 | ||
| Context | iHOP: GGT7 | |
| cancer metabolism search in PubMed: GGT7 | ||
| UCL Cancer Institute: GGT7 | ||
| Assigned class in ccmGDB | C | |
| Top |
| Phenotypic Information for GGT7(metabolism pathway, cancer, disease, phenome) |
| Cancer | CGAP: GGT7 |
| Familial Cancer Database: GGT7 | |
| * This gene is included in those cancer gene databases. |
|
|
|
|
|
|
| ||||||||||||||||||||||||||||||||||||||||||||||||||||||||||||||||||||||||||||||||||||||||||||||||||||||||||||||||||||||||||||||||||||||||||||||||||||||||||||||||||||||||||||||||||||||||||||||||||||||||||||||||||||||||||||||||||||||||||||||||||||||||||||||||||||||||||||||||||||||||||||||||||||||||||||||||||||
Oncogene 1 | Significant driver gene in | |||||||||||||||||||||||||||||||||||||||||||||||||||||||||||||||||||||||||||||||||||||||||||||||||||||||||||||||||||||||||||||||||||||||||||||||||||||||||||||||||||||||||||||||||||||||||||||||||||||||||||||||||||||||||||||||||||||||||||||||||||||||||||||||||||||||||||||||||||||||||||||||||||||||||||||||||||||||||
| cf) number; DB name 1 Oncogene; http://nar.oxfordjournals.org/content/35/suppl_1/D721.long, 2 Tumor Suppressor gene; https://bioinfo.uth.edu/TSGene/, 3 Cancer Gene Census; http://www.nature.com/nrc/journal/v4/n3/abs/nrc1299.html, 4 CancerGenes; http://nar.oxfordjournals.org/content/35/suppl_1/D721.long, 5 Network of Cancer Gene; http://ncg.kcl.ac.uk/index.php, 1Therapeutic Vulnerabilities in Cancer; http://cbio.mskcc.org/cancergenomics/statius/ |
| KEGG_TAURINE_AND_HYPOTAURINE_METABOLISM KEGG_SELENOAMINO_ACID_METABOLISM KEGG_GLUTATHIONE_METABOLISM KEGG_ARACHIDONIC_ACID_METABOLISM | |
| OMIM | |
| Orphanet | |
| Disease | KEGG Disease: GGT7 |
| MedGen: GGT7 (Human Medical Genetics with Condition) | |
| ClinVar: GGT7 | |
| Phenotype | MGI: GGT7 (International Mouse Phenotyping Consortium) |
| PhenomicDB: GGT7 | |
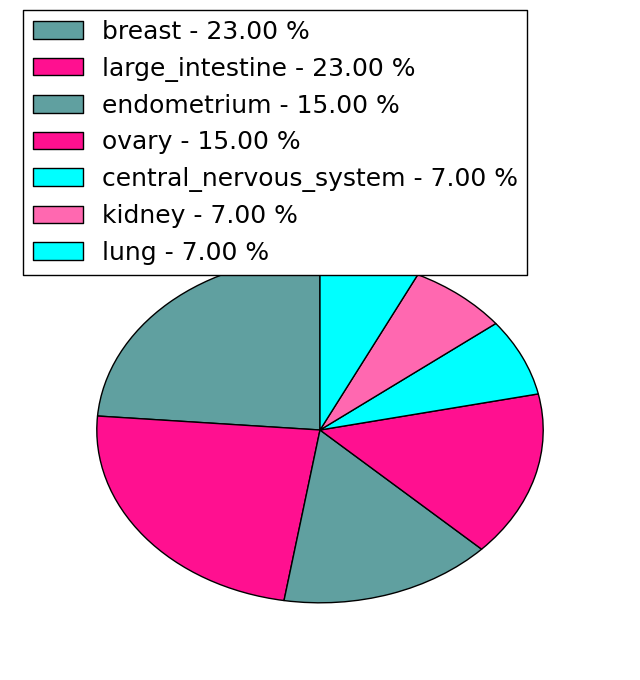
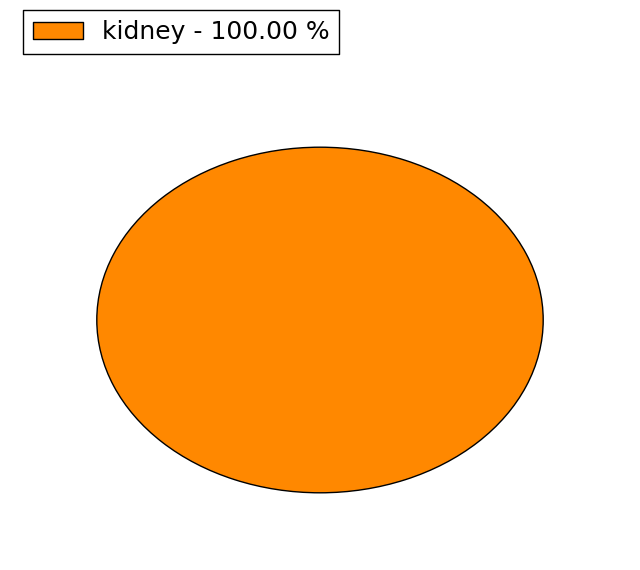
| Mutations for GGT7 |
| * Under tables are showing count per each tissue to give us broad intuition about tissue specific mutation patterns.You can go to the detailed page for each mutation database's web site. |
| - Statistics for Tissue and Mutation type | Top |
 |
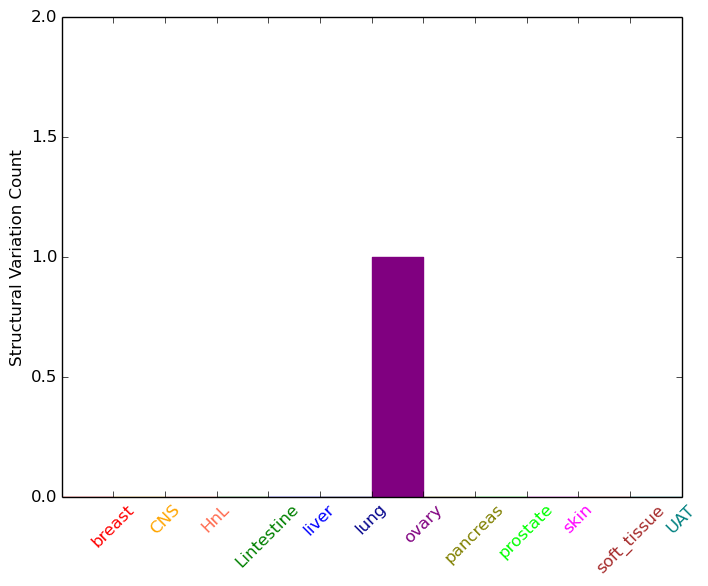
| - For Inter-chromosomal Variations |
| * Inter-chromosomal variantions includes 'interchromosomal amplicon to amplicon', 'interchromosomal amplicon to non-amplified dna', 'interchromosomal insertion', 'Interchromosomal unknown type'. |
 |
| - For Intra-chromosomal Variations |
| * Intra-chromosomal variantions includes 'intrachromosomal amplicon to amplicon', 'intrachromosomal amplicon to non-amplified dna', 'intrachromosomal deletion', 'intrachromosomal fold-back inversion', 'intrachromosomal inversion', 'intrachromosomal tandem duplication', 'Intrachromosomal unknown type', 'intrachromosomal with inverted orientation', 'intrachromosomal with non-inverted orientation'. |
 |
| Sample | Symbol_a | Chr_a | Start_a | End_a | Symbol_b | Chr_b | Start_b | End_b |
| ovary | GGT7 | chr20 | 33456102 | 33456122 | ZNF341 | chr20 | 32371859 | 32371879 |
| cf) Tissue number; Tissue name (1;Breast, 2;Central_nervous_system, 3;Haematopoietic_and_lymphoid_tissue, 4;Large_intestine, 5;Liver, 6;Lung, 7;Ovary, 8;Pancreas, 9;Prostate, 10;Skin, 11;Soft_tissue, 12;Upper_aerodigestive_tract) |
| * From mRNA Sanger sequences, Chitars2.0 arranged chimeric transcripts. This table shows GGT7 related fusion information. |
| ID | Head Gene | Tail Gene | Accession | Gene_a | qStart_a | qEnd_a | Chromosome_a | tStart_a | tEnd_a | Gene_a | qStart_a | qEnd_a | Chromosome_a | tStart_a | tEnd_a |
| H19810 | GGT7 | 1 | 182 | 20 | 33433152 | 33437803 | CREBBP | 183 | 441 | 16 | 3776978 | 3777235 | |
| BI043619 | GGT7 | 27 | 285 | 20 | 33444053 | 33444310 | PIGC | 278 | 394 | 1 | 172411581 | 172411697 | |
| BE501149 | GGT7 | 1 | 376 | 20 | 33432967 | 33437811 | SPEG | 372 | 484 | 2 | 220344398 | 220344510 | |
| Top |
| Mutation type/ Tissue ID | brca | cns | cerv | endome | haematopo | kidn | Lintest | liver | lung | ns | ovary | pancre | prost | skin | stoma | thyro | urina | |||
| Total # sample | 1 | |||||||||||||||||||
| GAIN (# sample) | 1 | |||||||||||||||||||
| LOSS (# sample) |
| cf) Tissue ID; Tissue type (1; Breast, 2; Central_nervous_system, 3; Cervix, 4; Endometrium, 5; Haematopoietic_and_lymphoid_tissue, 6; Kidney, 7; Large_intestine, 8; Liver, 9; Lung, 10; NS, 11; Ovary, 12; Pancreas, 13; Prostate, 14; Skin, 15; Stomach, 16; Thyroid, 17; Urinary_tract) |
| Top |
|
 |
| Top |
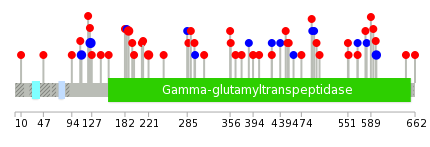
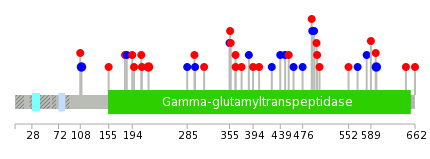
| Stat. for Non-Synonymous SNVs (# total SNVs=25) | (# total SNVs=13) |
 |  |
(# total SNVs=1) | (# total SNVs=0) |
 |
| Top |
| * When you move the cursor on each content, you can see more deailed mutation information on the Tooltip. Those are primary_site,primary_histology,mutation(aa),pubmedID. |
| GRCh37 position | Mutation(aa) | Unique sampleID count |
| chr20:33451148-33451148 | p.L125L | 3 |
| chr20:33437795-33437795 | p.P598P | 2 |
| chr20:33449360-33449360 | p.G188V | 2 |
| chr20:33451191-33451191 | p.I110I | 2 |
| chr20:33449261-33449261 | p.S221F | 2 |
| chr20:33450711-33450711 | p.E155* | 2 |
| chr20:33433205-33433205 | p.R639* | 2 |
| chr20:33442378-33442378 | p.P425P | 1 |
| chr20:33451140-33451140 | p.M127I | 1 |
| chr20:33447370-33447370 | p.R297H | 1 |
| Top |
|
 |
| Point Mutation/ Tissue ID | 1 | 2 | 3 | 4 | 5 | 6 | 7 | 8 | 9 | 10 | 11 | 12 | 13 | 14 | 15 | 16 | 17 | 18 | 19 | 20 |
| # sample | 2 | 6 | 3 | 4 | 3 | 3 | 2 | 9 | 5 | 3 | ||||||||||
| # mutation | 3 | 6 | 3 | 4 | 3 | 3 | 2 | 11 | 5 | 4 | ||||||||||
| nonsynonymous SNV | 3 | 4 | 3 | 3 | 2 | 6 | 4 | 2 | ||||||||||||
| synonymous SNV | 2 | 3 | 1 | 1 | 2 | 5 | 1 | 2 |
| cf) Tissue ID; Tissue type (1; BLCA[Bladder Urothelial Carcinoma], 2; BRCA[Breast invasive carcinoma], 3; CESC[Cervical squamous cell carcinoma and endocervical adenocarcinoma], 4; COAD[Colon adenocarcinoma], 5; GBM[Glioblastoma multiforme], 6; Glioma Low Grade, 7; HNSC[Head and Neck squamous cell carcinoma], 8; KICH[Kidney Chromophobe], 9; KIRC[Kidney renal clear cell carcinoma], 10; KIRP[Kidney renal papillary cell carcinoma], 11; LAML[Acute Myeloid Leukemia], 12; LUAD[Lung adenocarcinoma], 13; LUSC[Lung squamous cell carcinoma], 14; OV[Ovarian serous cystadenocarcinoma ], 15; PAAD[Pancreatic adenocarcinoma], 16; PRAD[Prostate adenocarcinoma], 17; SKCM[Skin Cutaneous Melanoma], 18:STAD[Stomach adenocarcinoma], 19:THCA[Thyroid carcinoma], 20:UCEC[Uterine Corpus Endometrial Carcinoma]) |
| Top |
| * We represented just top 10 SNVs. When you move the cursor on each content, you can see more deailed mutation information on the Tooltip. Those are primary_site, primary_histology, mutation(aa), pubmedID. |
| Genomic Position | Mutation(aa) | Unique sampleID count |
| chr20:33444618 | p.V365M | 2 |
| chr20:33451191 | p.I110I | 2 |
| chr20:33449261 | p.S221F | 2 |
| chr20:33437795 | p.P598P | 2 |
| chr20:33449333 | p.D589N | 1 |
| chr20:33437798 | p.A404V | 1 |
| chr20:33440233 | p.D194V | 1 |
| chr20:33444642 | p.T582T | 1 |
| chr20:33449342 | p.N394T | 1 |
| chr20:33437824 | p.G185G | 1 |
| * Copy number data were extracted from TCGA using R package TCGA-Assembler. The URLs of all public data files on TCGA DCC data server were gathered on Jan-05-2015. Function ProcessCNAData in TCGA-Assembler package was used to obtain gene-level copy number value which is calculated as the average copy number of the genomic region of a gene. |
 |
| cf) Tissue ID[Tissue type]: BLCA[Bladder Urothelial Carcinoma], BRCA[Breast invasive carcinoma], CESC[Cervical squamous cell carcinoma and endocervical adenocarcinoma], COAD[Colon adenocarcinoma], GBM[Glioblastoma multiforme], Glioma Low Grade, HNSC[Head and Neck squamous cell carcinoma], KICH[Kidney Chromophobe], KIRC[Kidney renal clear cell carcinoma], KIRP[Kidney renal papillary cell carcinoma], LAML[Acute Myeloid Leukemia], LUAD[Lung adenocarcinoma], LUSC[Lung squamous cell carcinoma], OV[Ovarian serous cystadenocarcinoma ], PAAD[Pancreatic adenocarcinoma], PRAD[Prostate adenocarcinoma], SKCM[Skin Cutaneous Melanoma], STAD[Stomach adenocarcinoma], THCA[Thyroid carcinoma], UCEC[Uterine Corpus Endometrial Carcinoma] |
| Top |
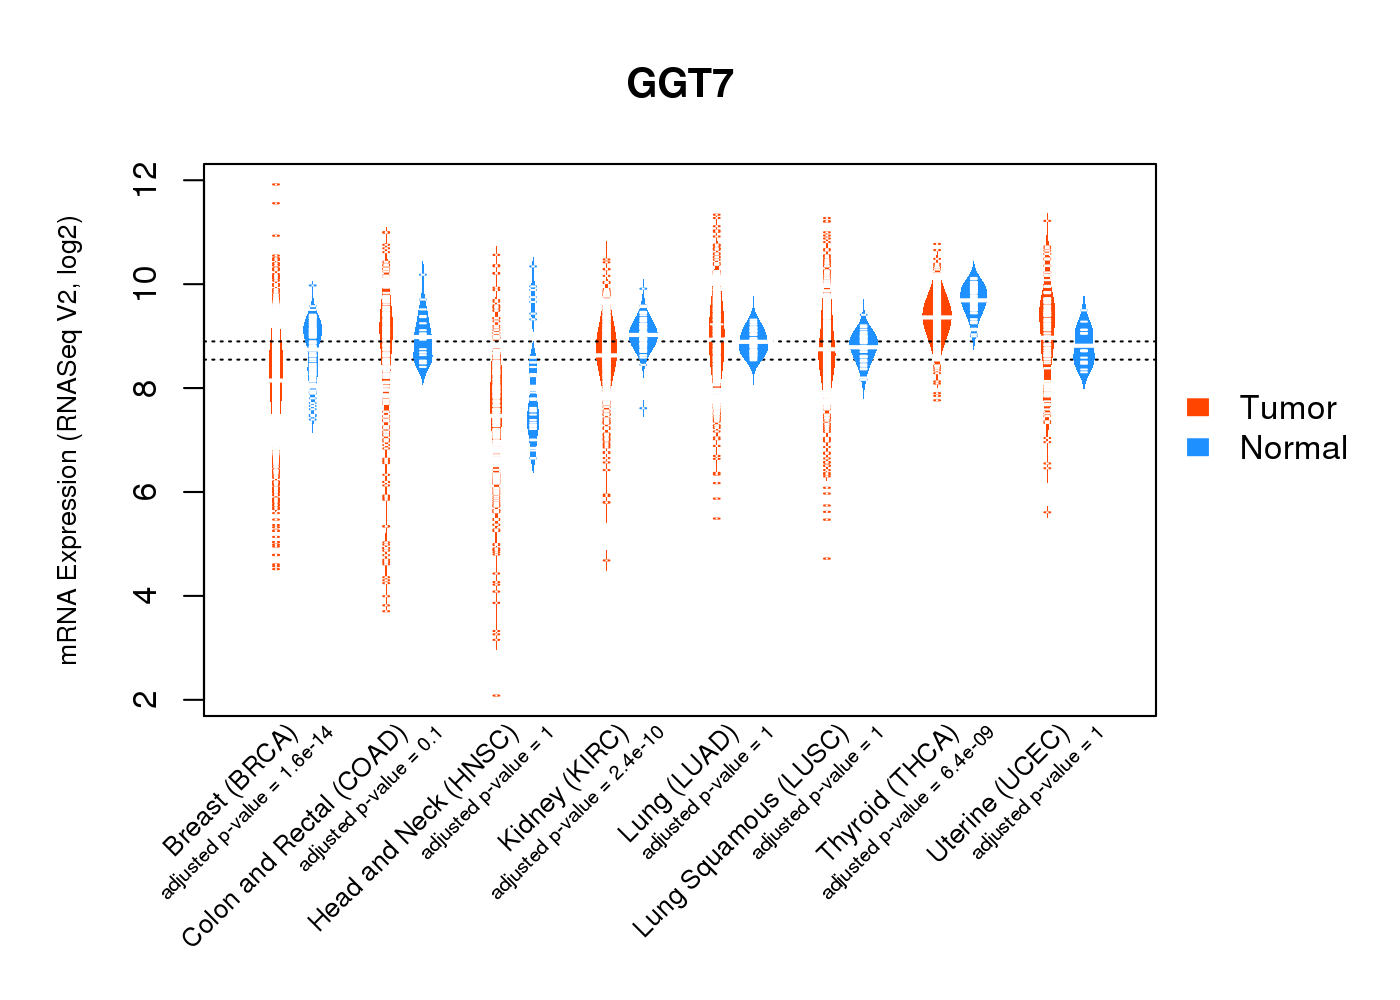
| Gene Expression for GGT7 |
| * CCLE gene expression data were extracted from CCLE_Expression_Entrez_2012-10-18.res: Gene-centric RMA-normalized mRNA expression data. |
 |
| * Normalized gene expression data of RNASeqV2 was extracted from TCGA using R package TCGA-Assembler. The URLs of all public data files on TCGA DCC data server were gathered at Jan-05-2015. Only eight cancer types have enough normal control samples for differential expression analysis. (t test, adjusted p<0.05 (using Benjamini-Hochberg FDR)) |
 |
| Top |
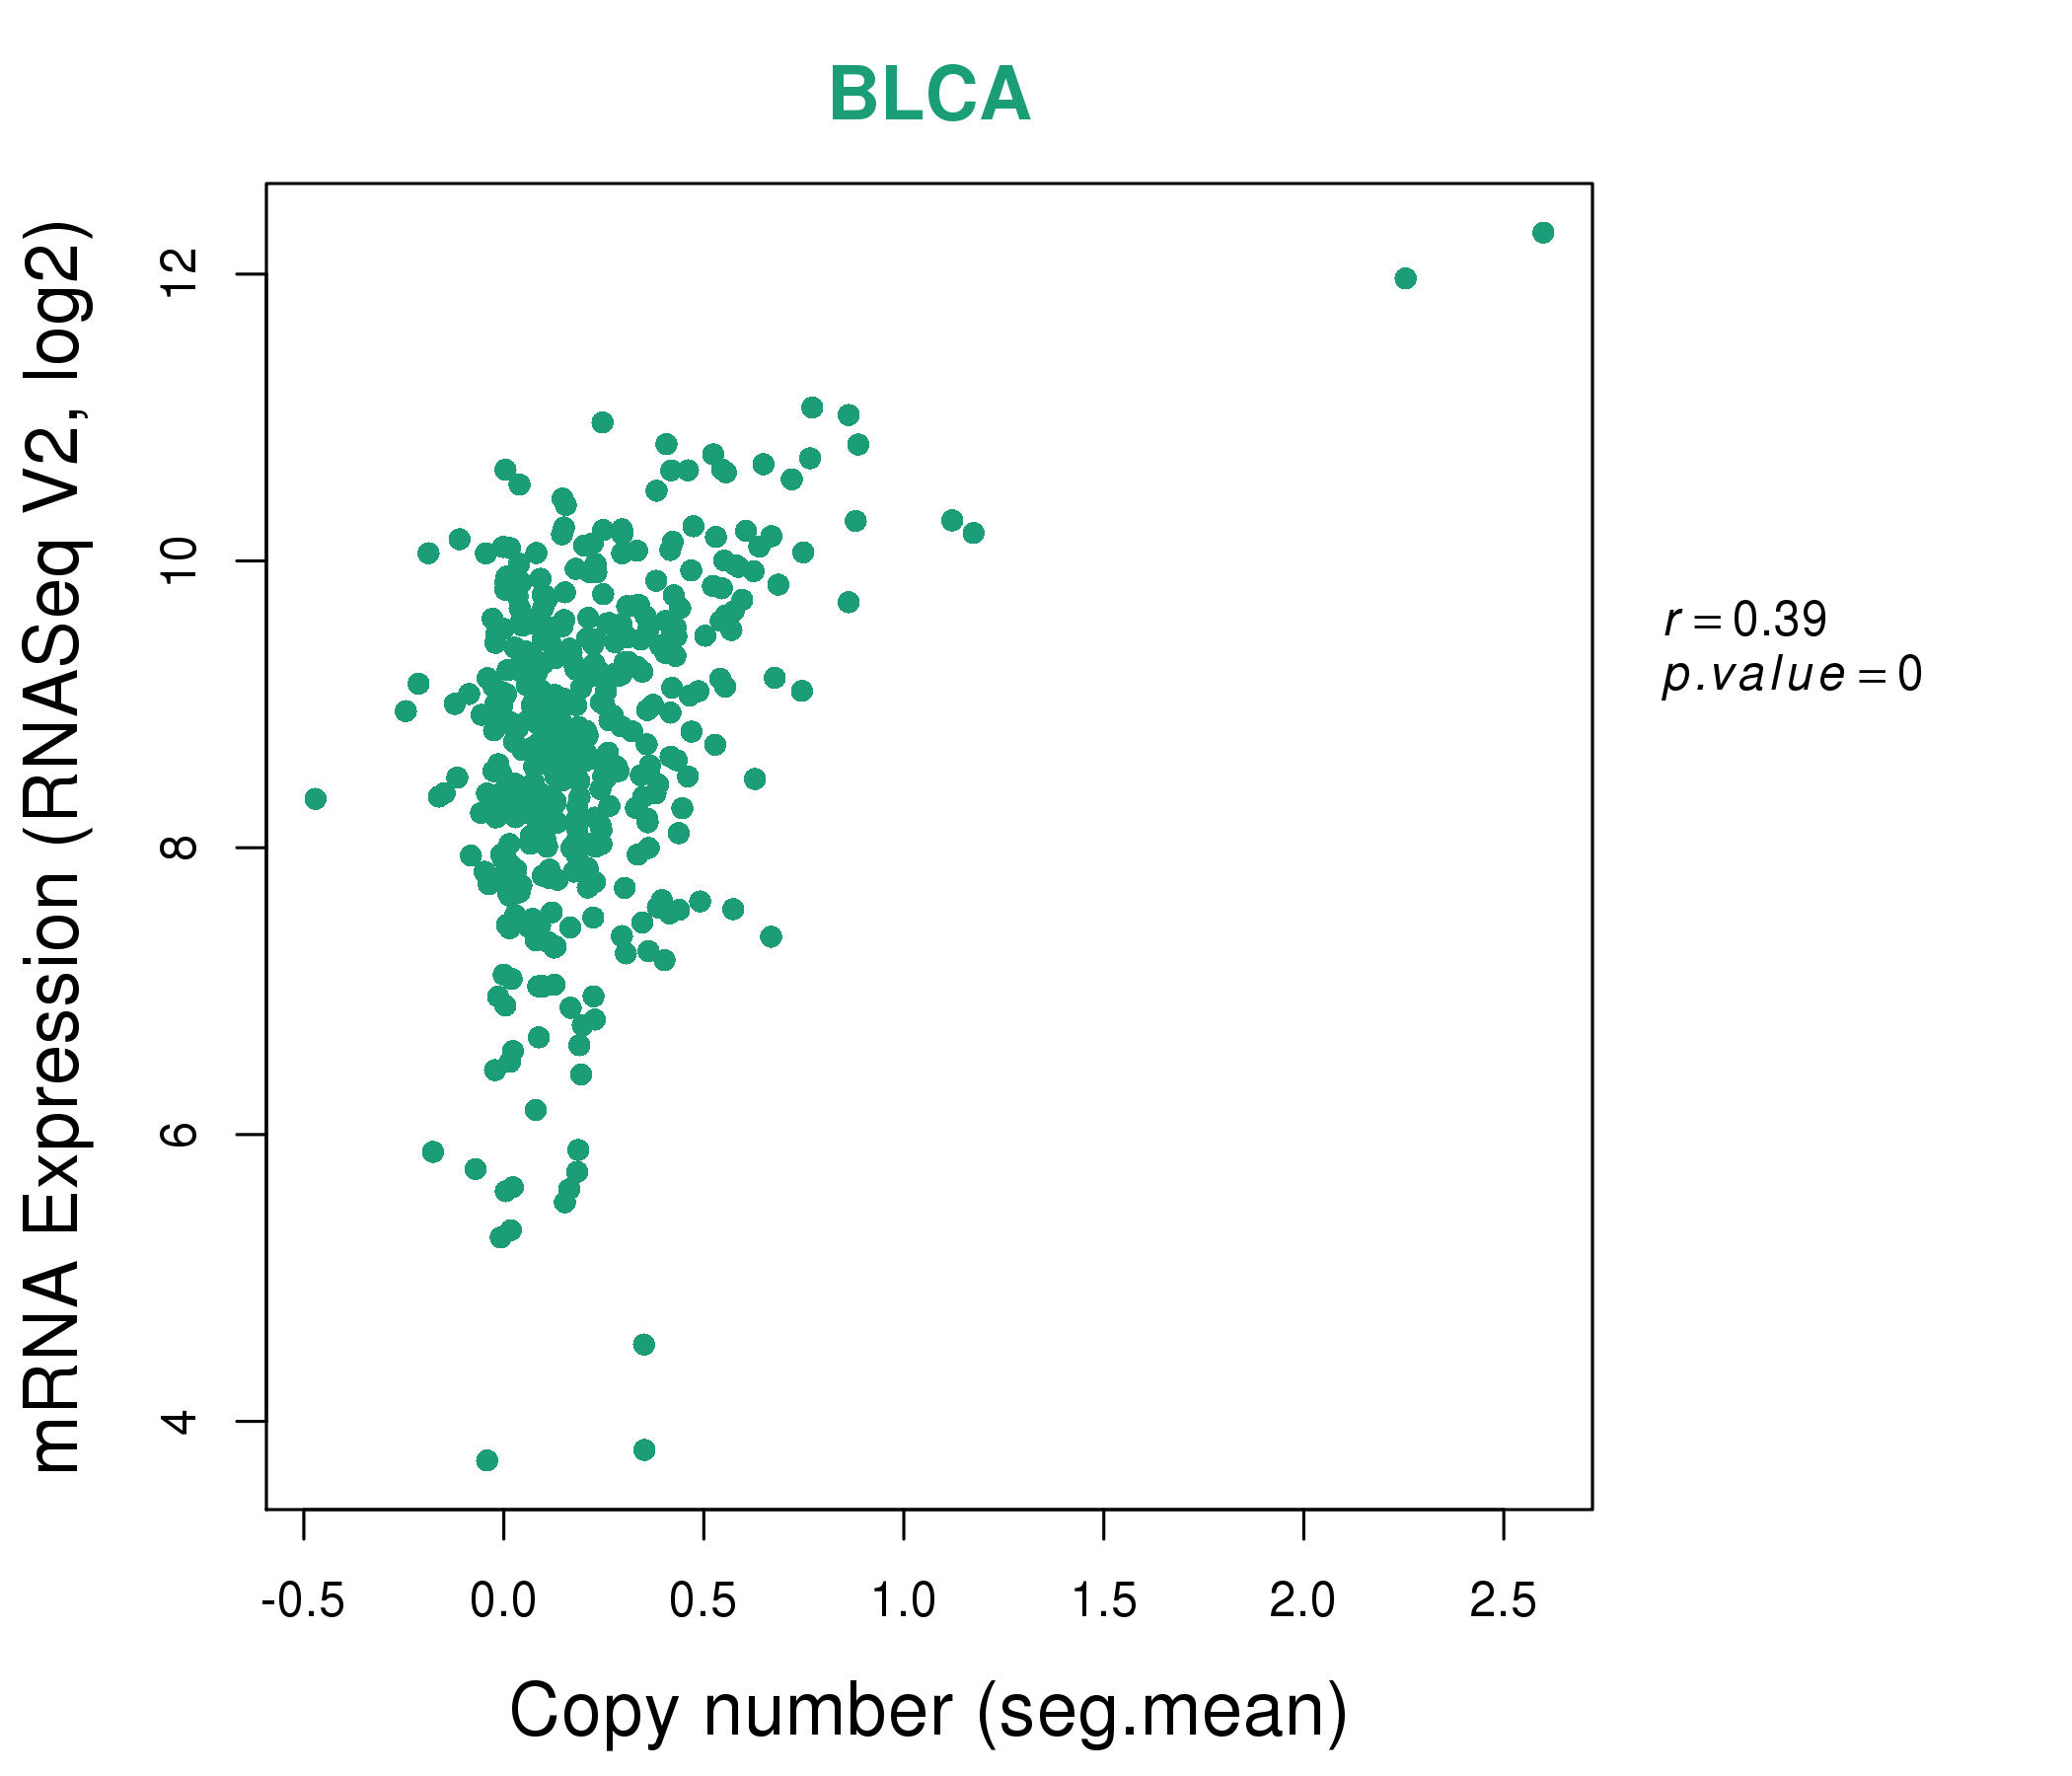
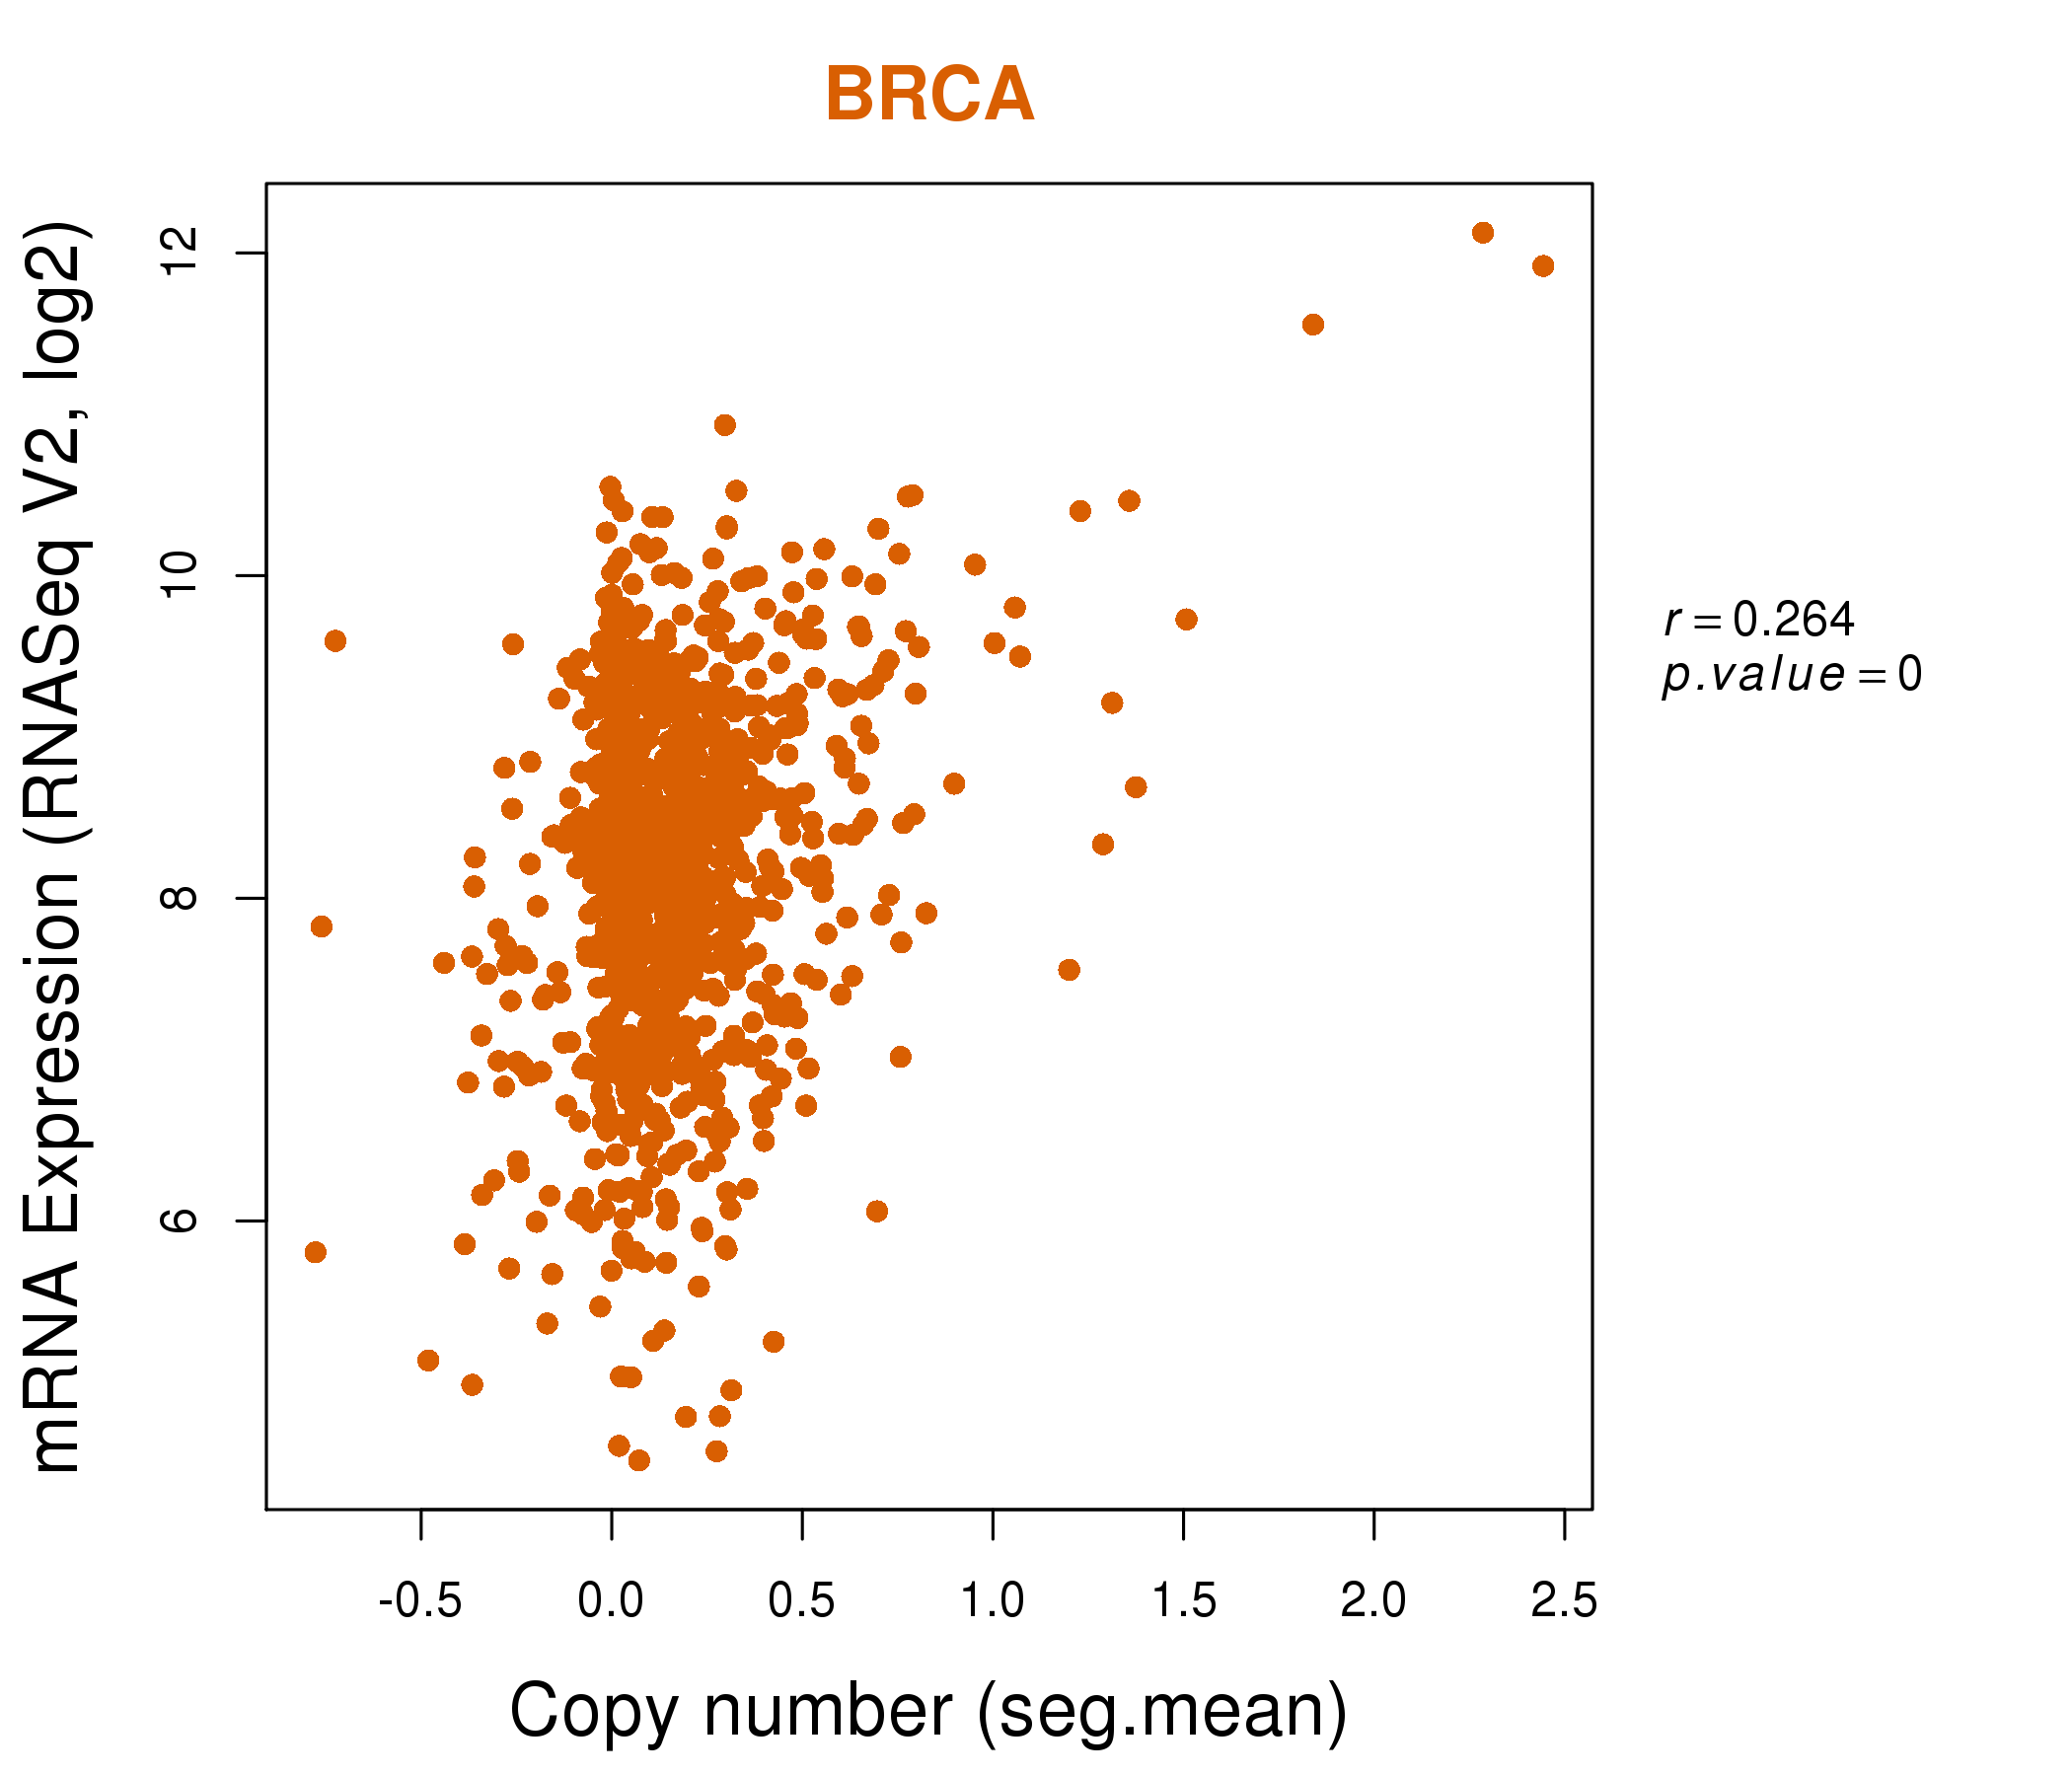
| * This plots show the correlation between CNV and gene expression. |
: Open all plots for all cancer types
 |
|
 |
|

| Top |
| Gene-Gene Network Information |
| * Co-Expression network figures were drawn using R package igraph. Only the top 20 genes with the highest correlations were shown. Red circle: input gene, orange circle: cell metabolism gene, sky circle: other gene |
: Open all plots for all cancer types
 |
|
| CEP250,DYNLRB1,EDEM2,EEF1A2,EIF6,ERGIC3,GGT7, GSS,MAP1LC3A,MMP24,MYH7B,NEURL4,NPEPL1,PIGU, RBMY1E,ROMO1,SCAND1,SSTR1,TRPC4AP,U | CADM4,CNTROB,DDR1,DGCR2,DNAL4,DVL2,ELMO3, EPS8L2,FBXO44,FZR1,GGT7,PHLDB3,PRKCZ,SFI1, SGSM2,SH2D3A,SH3GLB2,SLC4A3,SSH3,SYTL1,ZNF324 |
 |
|
| ASXL1,ATP9A,AAR2,RTFDC1,CHMP4B,DDX27,DIDO1, ERGIC3,GGT7,GPR56,LOC647979,NCOA6,PCIF1,PCMTD2, POFUT1,PRPF6,RNF43,SNHG11,TM9SF4,TRPC4AP,ZSWIM3 | ARHGAP36,ATP2C2,ERICH5,CLDN8,CPA6,FRZB,GGT7, GP2,HEPACAM2,HPCA,IL1R2,KIAA1324,LOC100130872,NRAP, RIMS4,RXFP4,SCGB2A1,STARD10,TMEM38A,WNK4,ZNF774 |

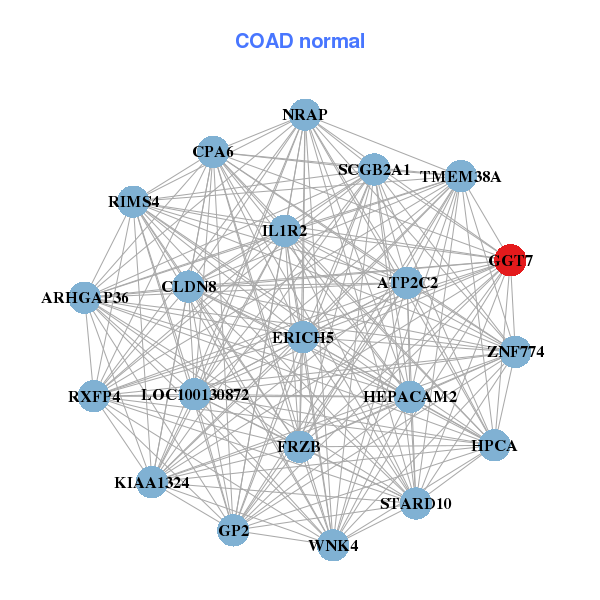
| * Co-Expression network figures were drawn using R package igraph. Only the top 20 genes with the highest correlations were shown. Red circle: input gene, orange circle: cell metabolism gene, sky circle: other gene |
: Open all plots for all cancer types
| Top |
: Open all interacting genes' information including KEGG pathway for all interacting genes from DAVID
| Top |
| Pharmacological Information for GGT7 |
| There's no related Drug. |
| Top |
| Cross referenced IDs for GGT7 |
| * We obtained these cross-references from Uniprot database. It covers 150 different DBs, 18 categories. http://www.uniprot.org/help/cross_references_section |
: Open all cross reference information
|
Copyright © 2016-Present - The Univsersity of Texas Health Science Center at Houston @ |