|
|||||||||||||||||||||||||||||||||||||||||||||||||||||||||||||||||||||||||||||||||||||||||||||||||||||||||||||||||||||||||||||||||||||||||||||||||||||||||||||||||||||||||||||||||||||||||||||||||||||||||||||||||||||||||||||||||||||||||||||||||||||||||||||||||||||||||||||||||||||||||||||||||||||||||||||||||||||||||||||||||||||||||||||||||||
| |
| Phenotypic Information (metabolism pathway, cancer, disease, phenome) |
| |
| |
| Gene-Gene Network Information: Co-Expression Network, Interacting Genes & KEGG |
| |
|


| Gene Summary for GGT5 |
| Basic gene info. | Gene symbol | GGT5 |
| Gene name | gamma-glutamyltransferase 5 | |
| Synonyms | GGL|GGT 5|GGT-REL|GGTLA1 | |
| Cytomap | UCSC genome browser: 22q11.23 | |
| Genomic location | chr22 :24615621-24641110 | |
| Type of gene | protein-coding | |
| RefGenes | NM_001099781.2, NM_001099782.2,NM_001302464.1,NM_001302465.1,NM_004121.3, | |
| Ensembl id | ENSG00000099998 | |
| Description | gamma-glutamyl cleaving enzymegamma-glutamyl transpeptidase-related enzymegamma-glutamyl transpeptidase-related proteingamma-glutamyltransferase-like activity 1gamma-glutamyltranspeptidase 5glutathione hydrolase 5leukotriene-C4 hydrolase | |
| Modification date | 20141215 | |
| dbXrefs | MIM : 137168 | |
| HGNC : HGNC | ||
| Ensembl : ENSG00000099998 | ||
| HPRD : 00666 | ||
| Vega : OTTHUMG00000150796 | ||
| Protein | UniProt: go to UniProt's Cross Reference DB Table | |
| Expression | CleanEX: HS_GGT5 | |
| BioGPS: 2687 | ||
| Gene Expression Atlas: ENSG00000099998 | ||
| The Human Protein Atlas: ENSG00000099998 | ||
| Pathway | NCI Pathway Interaction Database: GGT5 | |
| KEGG: GGT5 | ||
| REACTOME: GGT5 | ||
| ConsensusPathDB | ||
| Pathway Commons: GGT5 | ||
| Metabolism | MetaCyc: GGT5 | |
| HUMANCyc: GGT5 | ||
| Regulation | Ensembl's Regulation: ENSG00000099998 | |
| miRBase: chr22 :24,615,621-24,641,110 | ||
| TargetScan: NM_001099781 | ||
| cisRED: ENSG00000099998 | ||
| Context | iHOP: GGT5 | |
| cancer metabolism search in PubMed: GGT5 | ||
| UCL Cancer Institute: GGT5 | ||
| Assigned class in ccmGDB | C | |
| Top |
| Phenotypic Information for GGT5(metabolism pathway, cancer, disease, phenome) |
| Cancer | CGAP: GGT5 |
| Familial Cancer Database: GGT5 | |
| * This gene is included in those cancer gene databases. |
|
|
|
|
|
|
| |||||||||||||||||||||||||||||||||||||||||||||||||||||||||||||||||||||||||||||||||||||||||||||||||||||||||||||||||||||||||||||||||||||||||||||||||||||||||||||||||||||||||||||||||||||||||||||||||||||||||||||||||||||||||||||||||||||||||||||||||||||||||||||||||||||||||||||||||||||||||||||||||||||||||||||||||||||||||||||||||||||||||||||
Oncogene 1 | Significant driver gene in | ||||||||||||||||||||||||||||||||||||||||||||||||||||||||||||||||||||||||||||||||||||||||||||||||||||||||||||||||||||||||||||||||||||||||||||||||||||||||||||||||||||||||||||||||||||||||||||||||||||||||||||||||||||||||||||||||||||||||||||||||||||||||||||||||||||||||||||||||||||||||||||||||||||||||||||||||||||||||||||||||||||||||||||||||||
| cf) number; DB name 1 Oncogene; http://nar.oxfordjournals.org/content/35/suppl_1/D721.long, 2 Tumor Suppressor gene; https://bioinfo.uth.edu/TSGene/, 3 Cancer Gene Census; http://www.nature.com/nrc/journal/v4/n3/abs/nrc1299.html, 4 CancerGenes; http://nar.oxfordjournals.org/content/35/suppl_1/D721.long, 5 Network of Cancer Gene; http://ncg.kcl.ac.uk/index.php, 1Therapeutic Vulnerabilities in Cancer; http://cbio.mskcc.org/cancergenomics/statius/ |
| KEGG_TAURINE_AND_HYPOTAURINE_METABOLISM KEGG_SELENOAMINO_ACID_METABOLISM KEGG_GLUTATHIONE_METABOLISM KEGG_ARACHIDONIC_ACID_METABOLISM | |
| OMIM | |
| Orphanet | |
| Disease | KEGG Disease: GGT5 |
| MedGen: GGT5 (Human Medical Genetics with Condition) | |
| ClinVar: GGT5 | |
| Phenotype | MGI: GGT5 (International Mouse Phenotyping Consortium) |
| PhenomicDB: GGT5 | |
| Mutations for GGT5 |
| * Under tables are showing count per each tissue to give us broad intuition about tissue specific mutation patterns.You can go to the detailed page for each mutation database's web site. |
| There's no structural variation information in COSMIC data for this gene. |
| * From mRNA Sanger sequences, Chitars2.0 arranged chimeric transcripts. This table shows GGT5 related fusion information. |
| ID | Head Gene | Tail Gene | Accession | Gene_a | qStart_a | qEnd_a | Chromosome_a | tStart_a | tEnd_a | Gene_a | qStart_a | qEnd_a | Chromosome_a | tStart_a | tEnd_a |
| Top |
| Mutation type/ Tissue ID | brca | cns | cerv | endome | haematopo | kidn | Lintest | liver | lung | ns | ovary | pancre | prost | skin | stoma | thyro | urina | |||
| Total # sample | 1 | |||||||||||||||||||
| GAIN (# sample) | 1 | |||||||||||||||||||
| LOSS (# sample) |
| cf) Tissue ID; Tissue type (1; Breast, 2; Central_nervous_system, 3; Cervix, 4; Endometrium, 5; Haematopoietic_and_lymphoid_tissue, 6; Kidney, 7; Large_intestine, 8; Liver, 9; Lung, 10; NS, 11; Ovary, 12; Pancreas, 13; Prostate, 14; Skin, 15; Stomach, 16; Thyroid, 17; Urinary_tract) |
| Top |
|
 |
| Top |
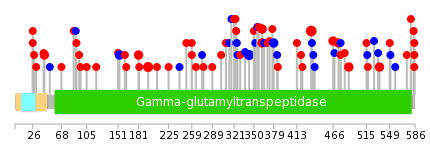
| Stat. for Non-Synonymous SNVs (# total SNVs=49) | (# total SNVs=20) |
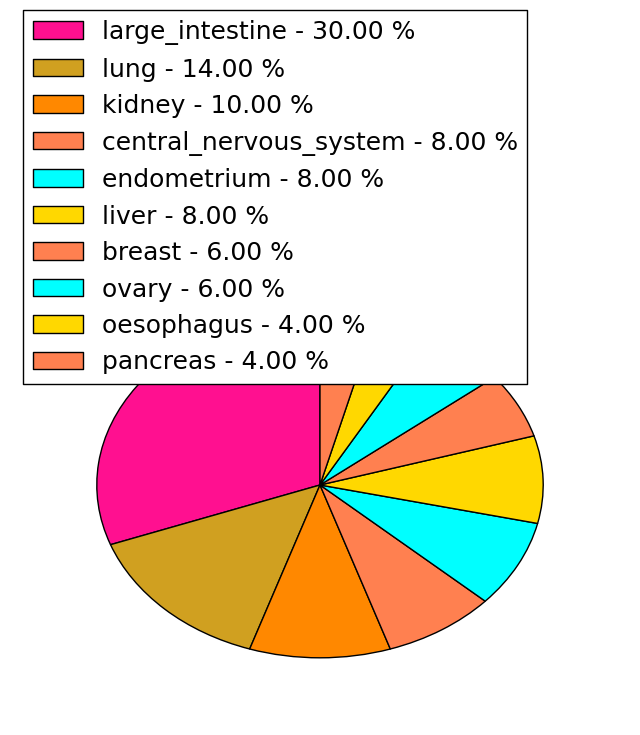 | 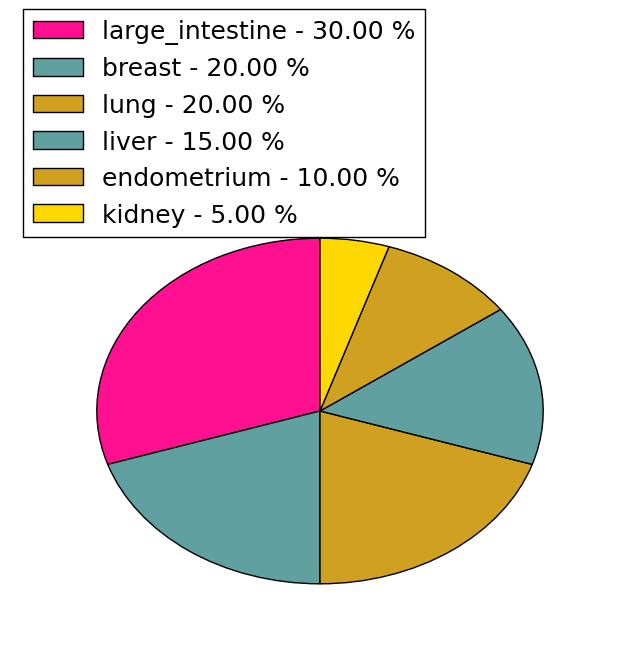 |
(# total SNVs=3) | (# total SNVs=1) |
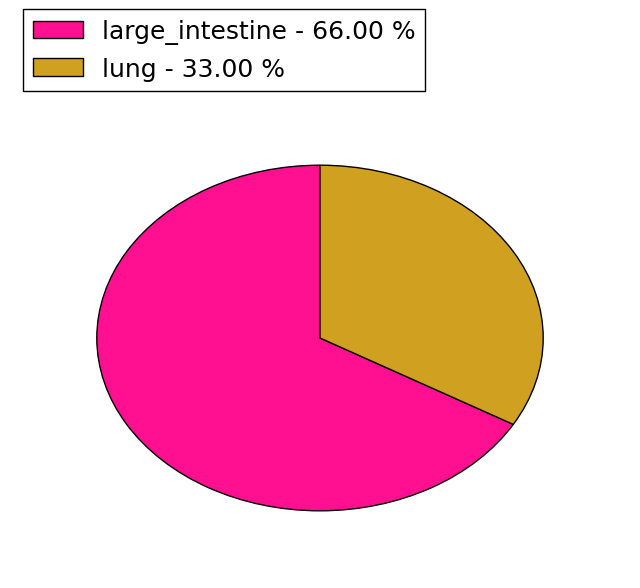 |  |
| Top |
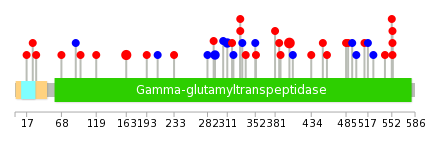
| * When you move the cursor on each content, you can see more deailed mutation information on the Tooltip. Those are primary_site,primary_histology,mutation(aa),pubmedID. |
| GRCh37 position | Mutation(aa) | Unique sampleID count |
| chr22:24621549-24621549 | p.R434Q | 4 |
| chr22:24622608-24622608 | p.P343P | 3 |
| chr22:24628803-24628803 | p.A195V | 3 |
| chr22:24621319-24621319 | p.R466H | 2 |
| chr22:24640618-24640618 | p.A26T | 2 |
| chr22:24622188-24622188 | p.R362H | 2 |
| chr22:24628845-24628845 | p.S181I | 2 |
| chr22:24622189-24622189 | p.R362C | 2 |
| chr22:24615946-24615946 | p.G585S | 2 |
| chr22:24621251-24621251 | p.G489R | 2 |
| Top |
|
 |
| Point Mutation/ Tissue ID | 1 | 2 | 3 | 4 | 5 | 6 | 7 | 8 | 9 | 10 | 11 | 12 | 13 | 14 | 15 | 16 | 17 | 18 | 19 | 20 |
| # sample | 14 | 1 | 3 | 2 | 2 | 3 | 2 | 2 | 10 | 3 | 5 | |||||||||
| # mutation | 12 | 1 | 3 | 2 | 2 | 4 | 2 | 2 | 8 | 3 | 5 | |||||||||
| nonsynonymous SNV | 10 | 1 | 2 | 2 | 2 | 2 | 2 | 1 | 4 | 3 | ||||||||||
| synonymous SNV | 2 | 1 | 2 | 1 | 4 | 3 | 2 |
| cf) Tissue ID; Tissue type (1; BLCA[Bladder Urothelial Carcinoma], 2; BRCA[Breast invasive carcinoma], 3; CESC[Cervical squamous cell carcinoma and endocervical adenocarcinoma], 4; COAD[Colon adenocarcinoma], 5; GBM[Glioblastoma multiforme], 6; Glioma Low Grade, 7; HNSC[Head and Neck squamous cell carcinoma], 8; KICH[Kidney Chromophobe], 9; KIRC[Kidney renal clear cell carcinoma], 10; KIRP[Kidney renal papillary cell carcinoma], 11; LAML[Acute Myeloid Leukemia], 12; LUAD[Lung adenocarcinoma], 13; LUSC[Lung squamous cell carcinoma], 14; OV[Ovarian serous cystadenocarcinoma ], 15; PAAD[Pancreatic adenocarcinoma], 16; PRAD[Prostate adenocarcinoma], 17; SKCM[Skin Cutaneous Melanoma], 18:STAD[Stomach adenocarcinoma], 19:THCA[Thyroid carcinoma], 20:UCEC[Uterine Corpus Endometrial Carcinoma]) |
| Top |
| * We represented just top 10 SNVs. When you move the cursor on each content, you can see more deailed mutation information on the Tooltip. Those are primary_site, primary_histology, mutation(aa), pubmedID. |
| Genomic Position | Mutation(aa) | Unique sampleID count |
| chr22:24621549 | p.R402Q,GGT5 | 4 |
| chr22:24628803 | p.A163V,GGT5 | 3 |
| chr22:24615946 | p.T293T,GGT5 | 2 |
| chr22:24622608 | p.G553S,GGT5 | 2 |
| chr22:24622662 | p.P311P,GGT5 | 2 |
| chr22:24622670 | p.R434H,GGT5 | 1 |
| chr22:24640618 | p.S407S,GGT5 | 1 |
| chr22:24621019 | p.V291I,GGT5 | 1 |
| chr22:24622121 | p.G282G,GGT5 | 1 |
| chr22:24622695 | p.G389S,GGT5 | 1 |
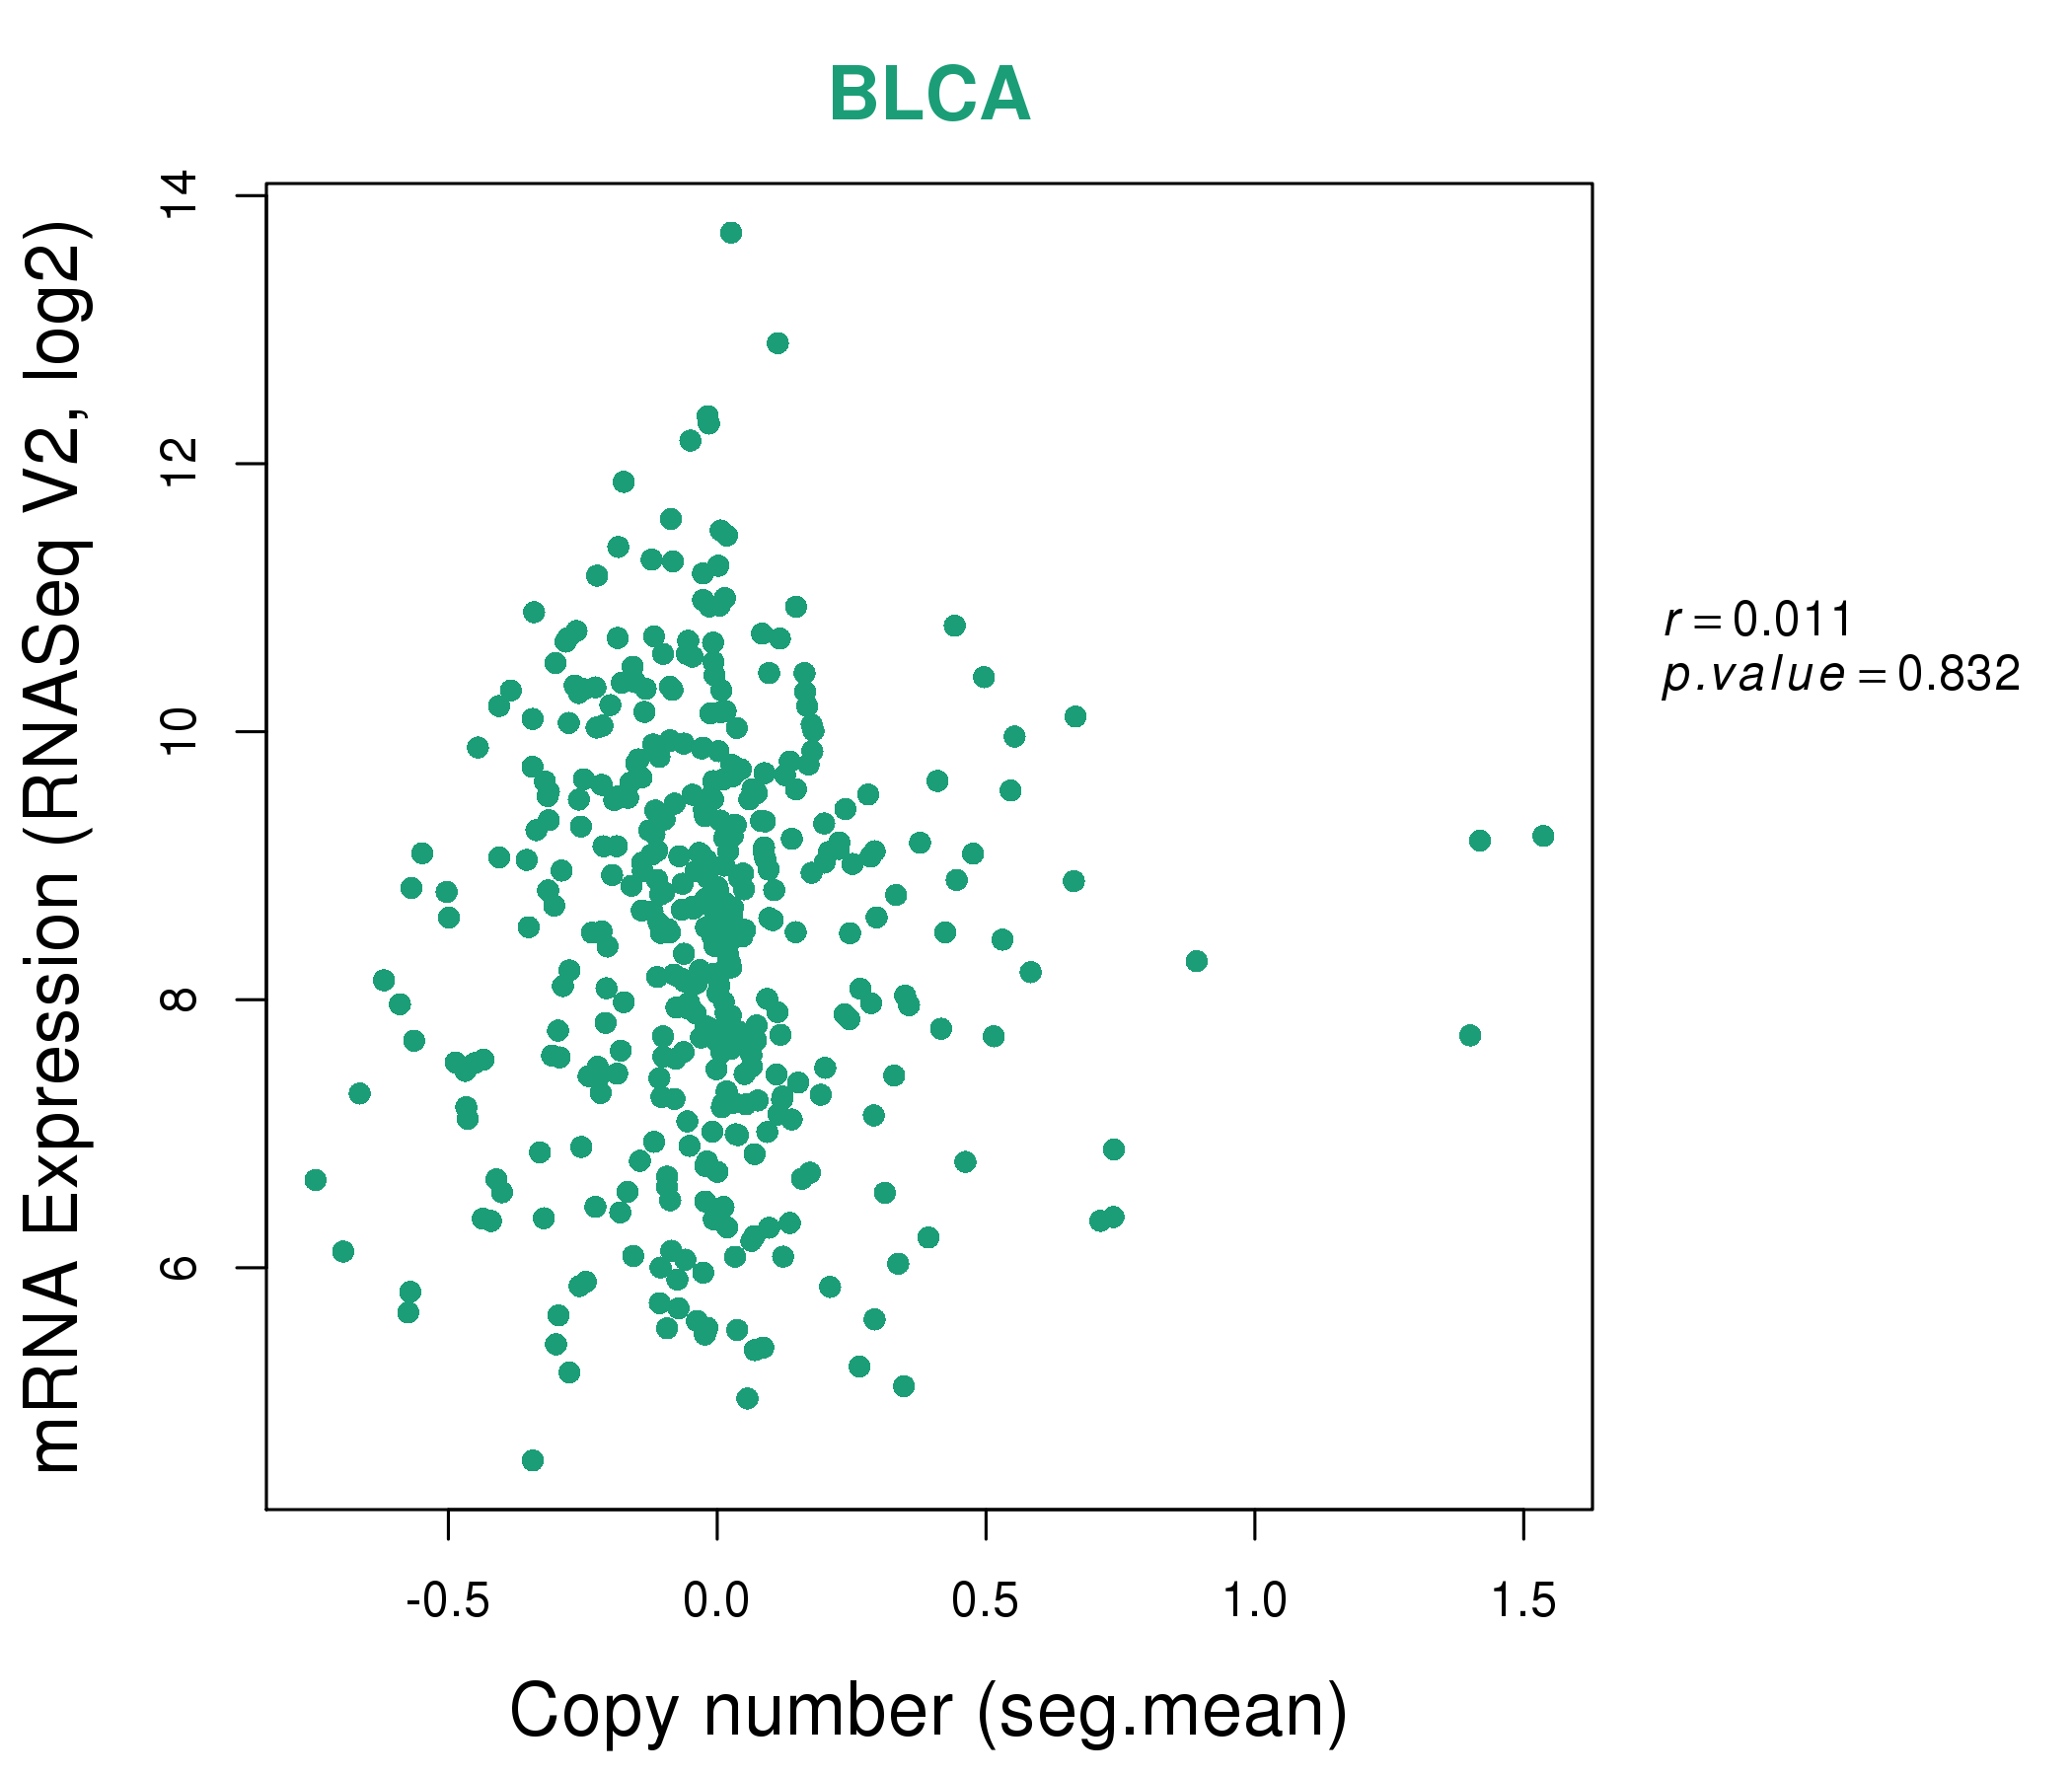
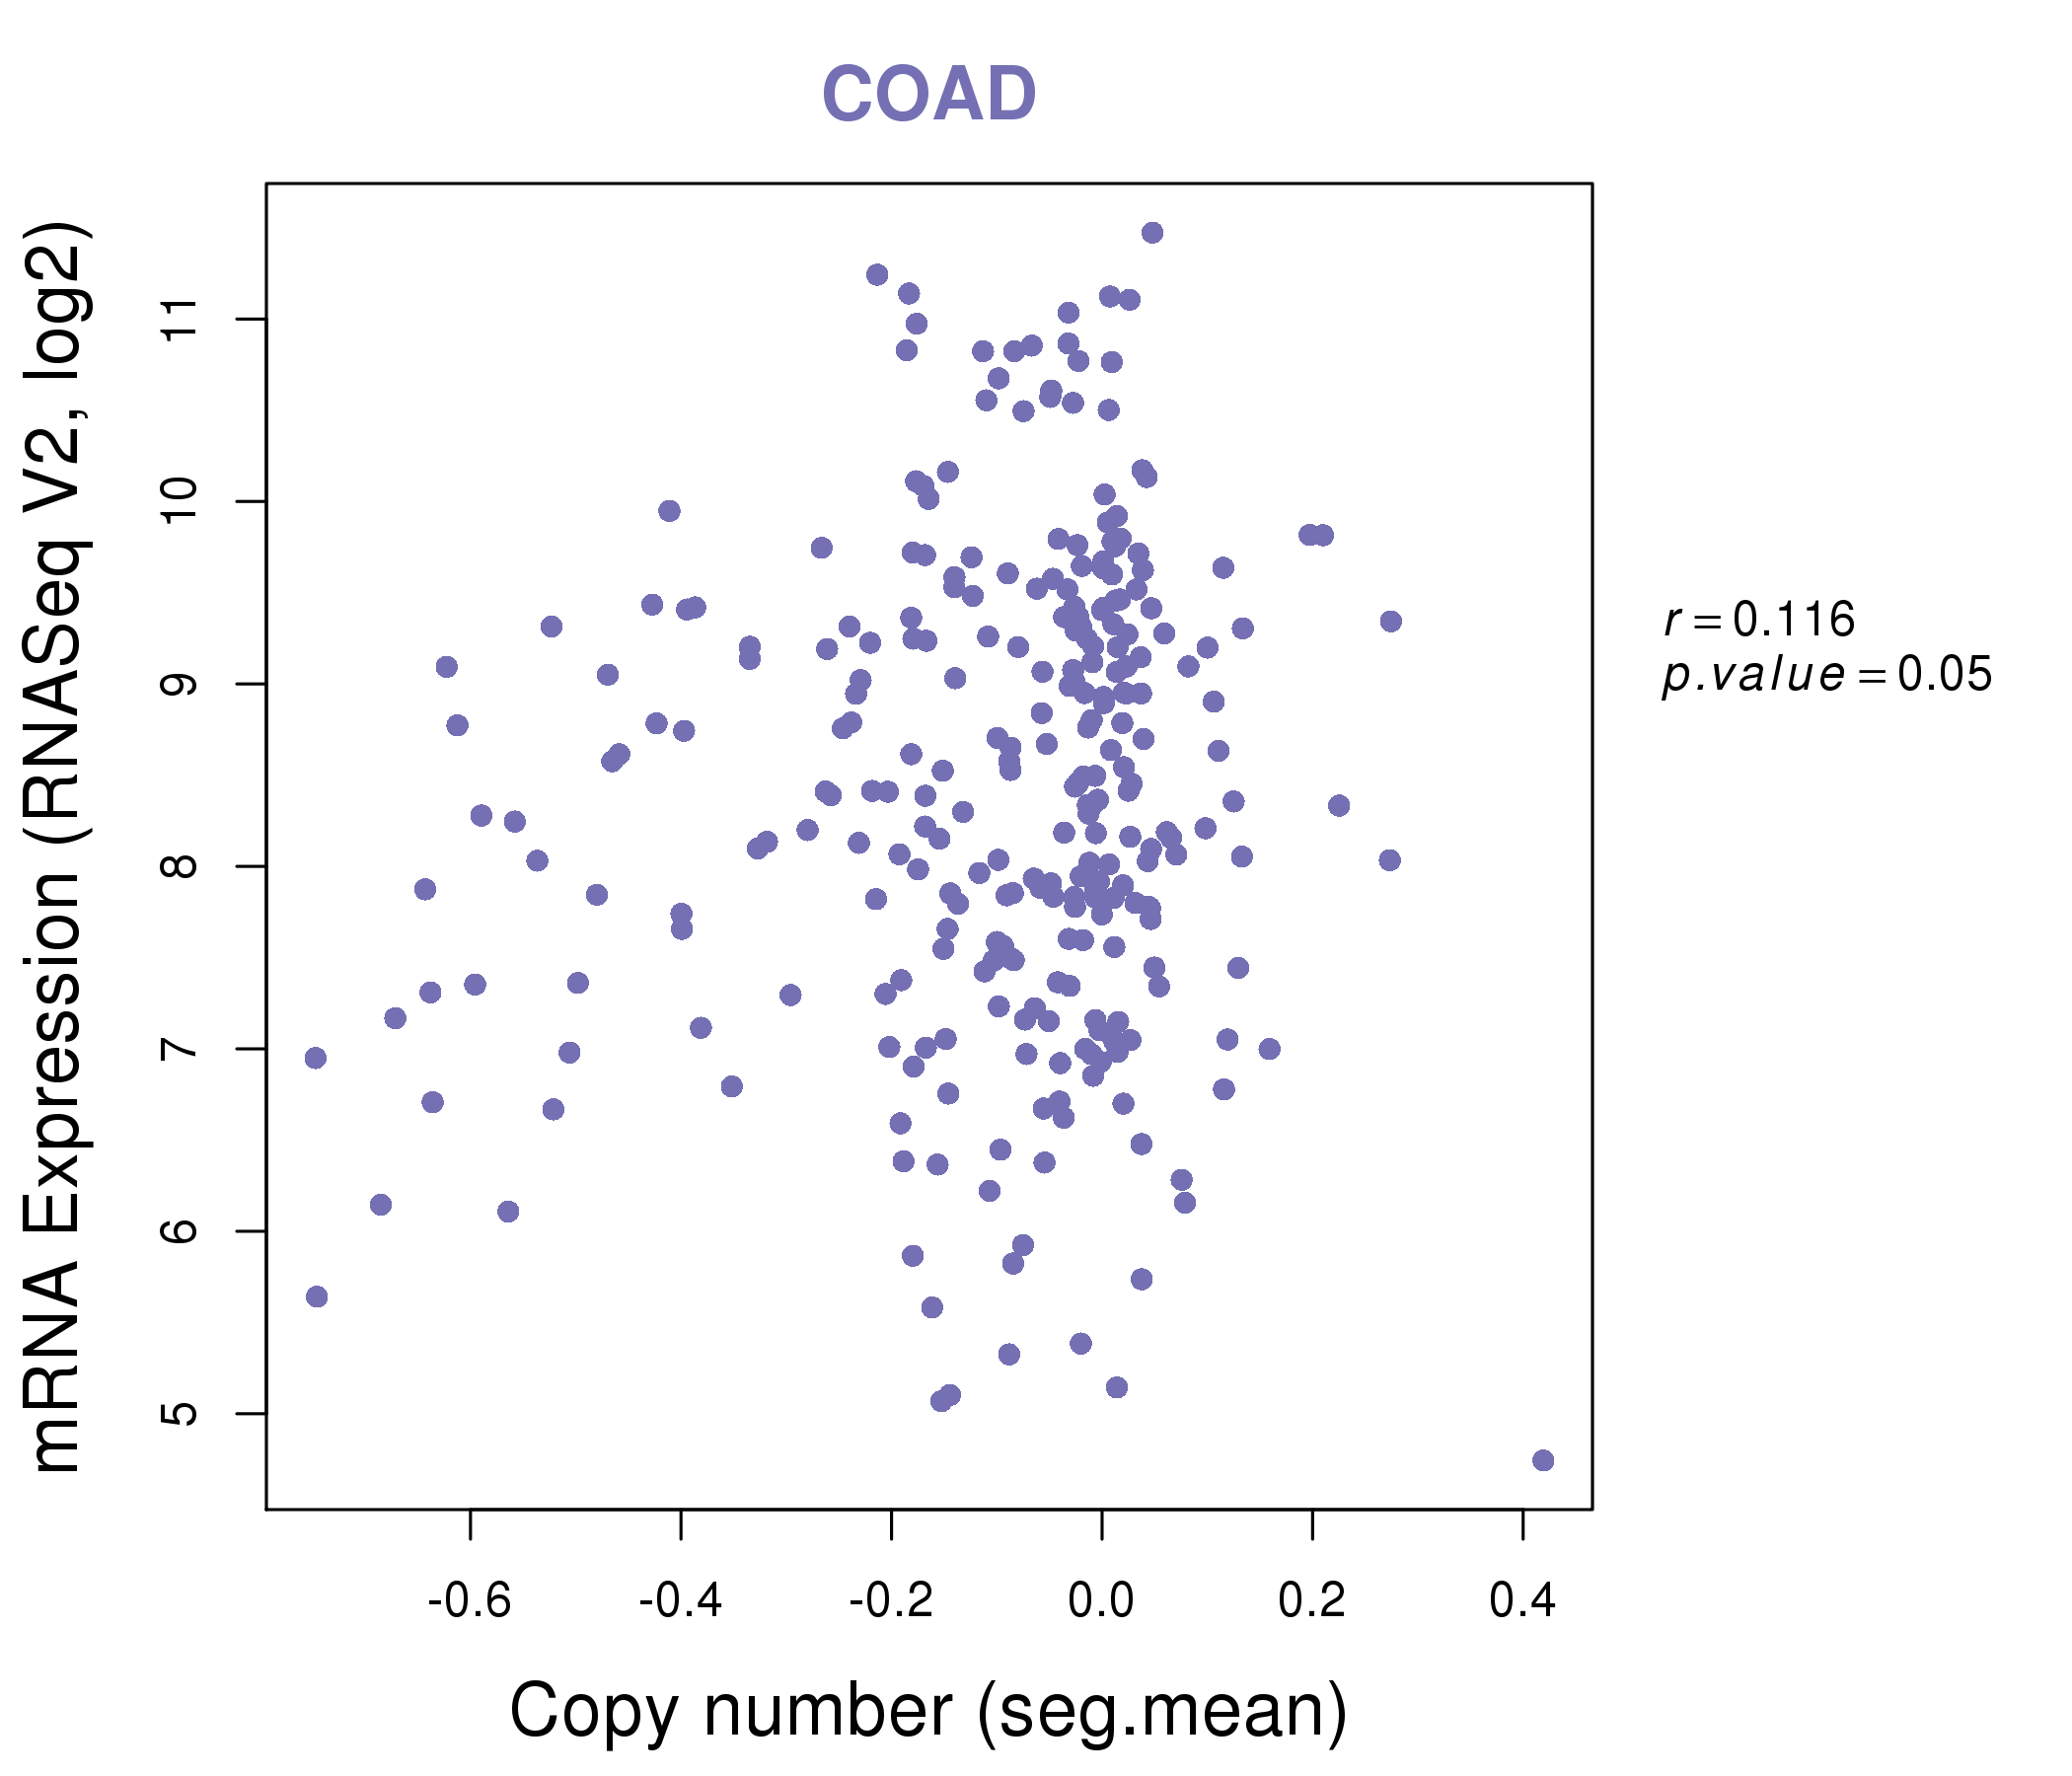
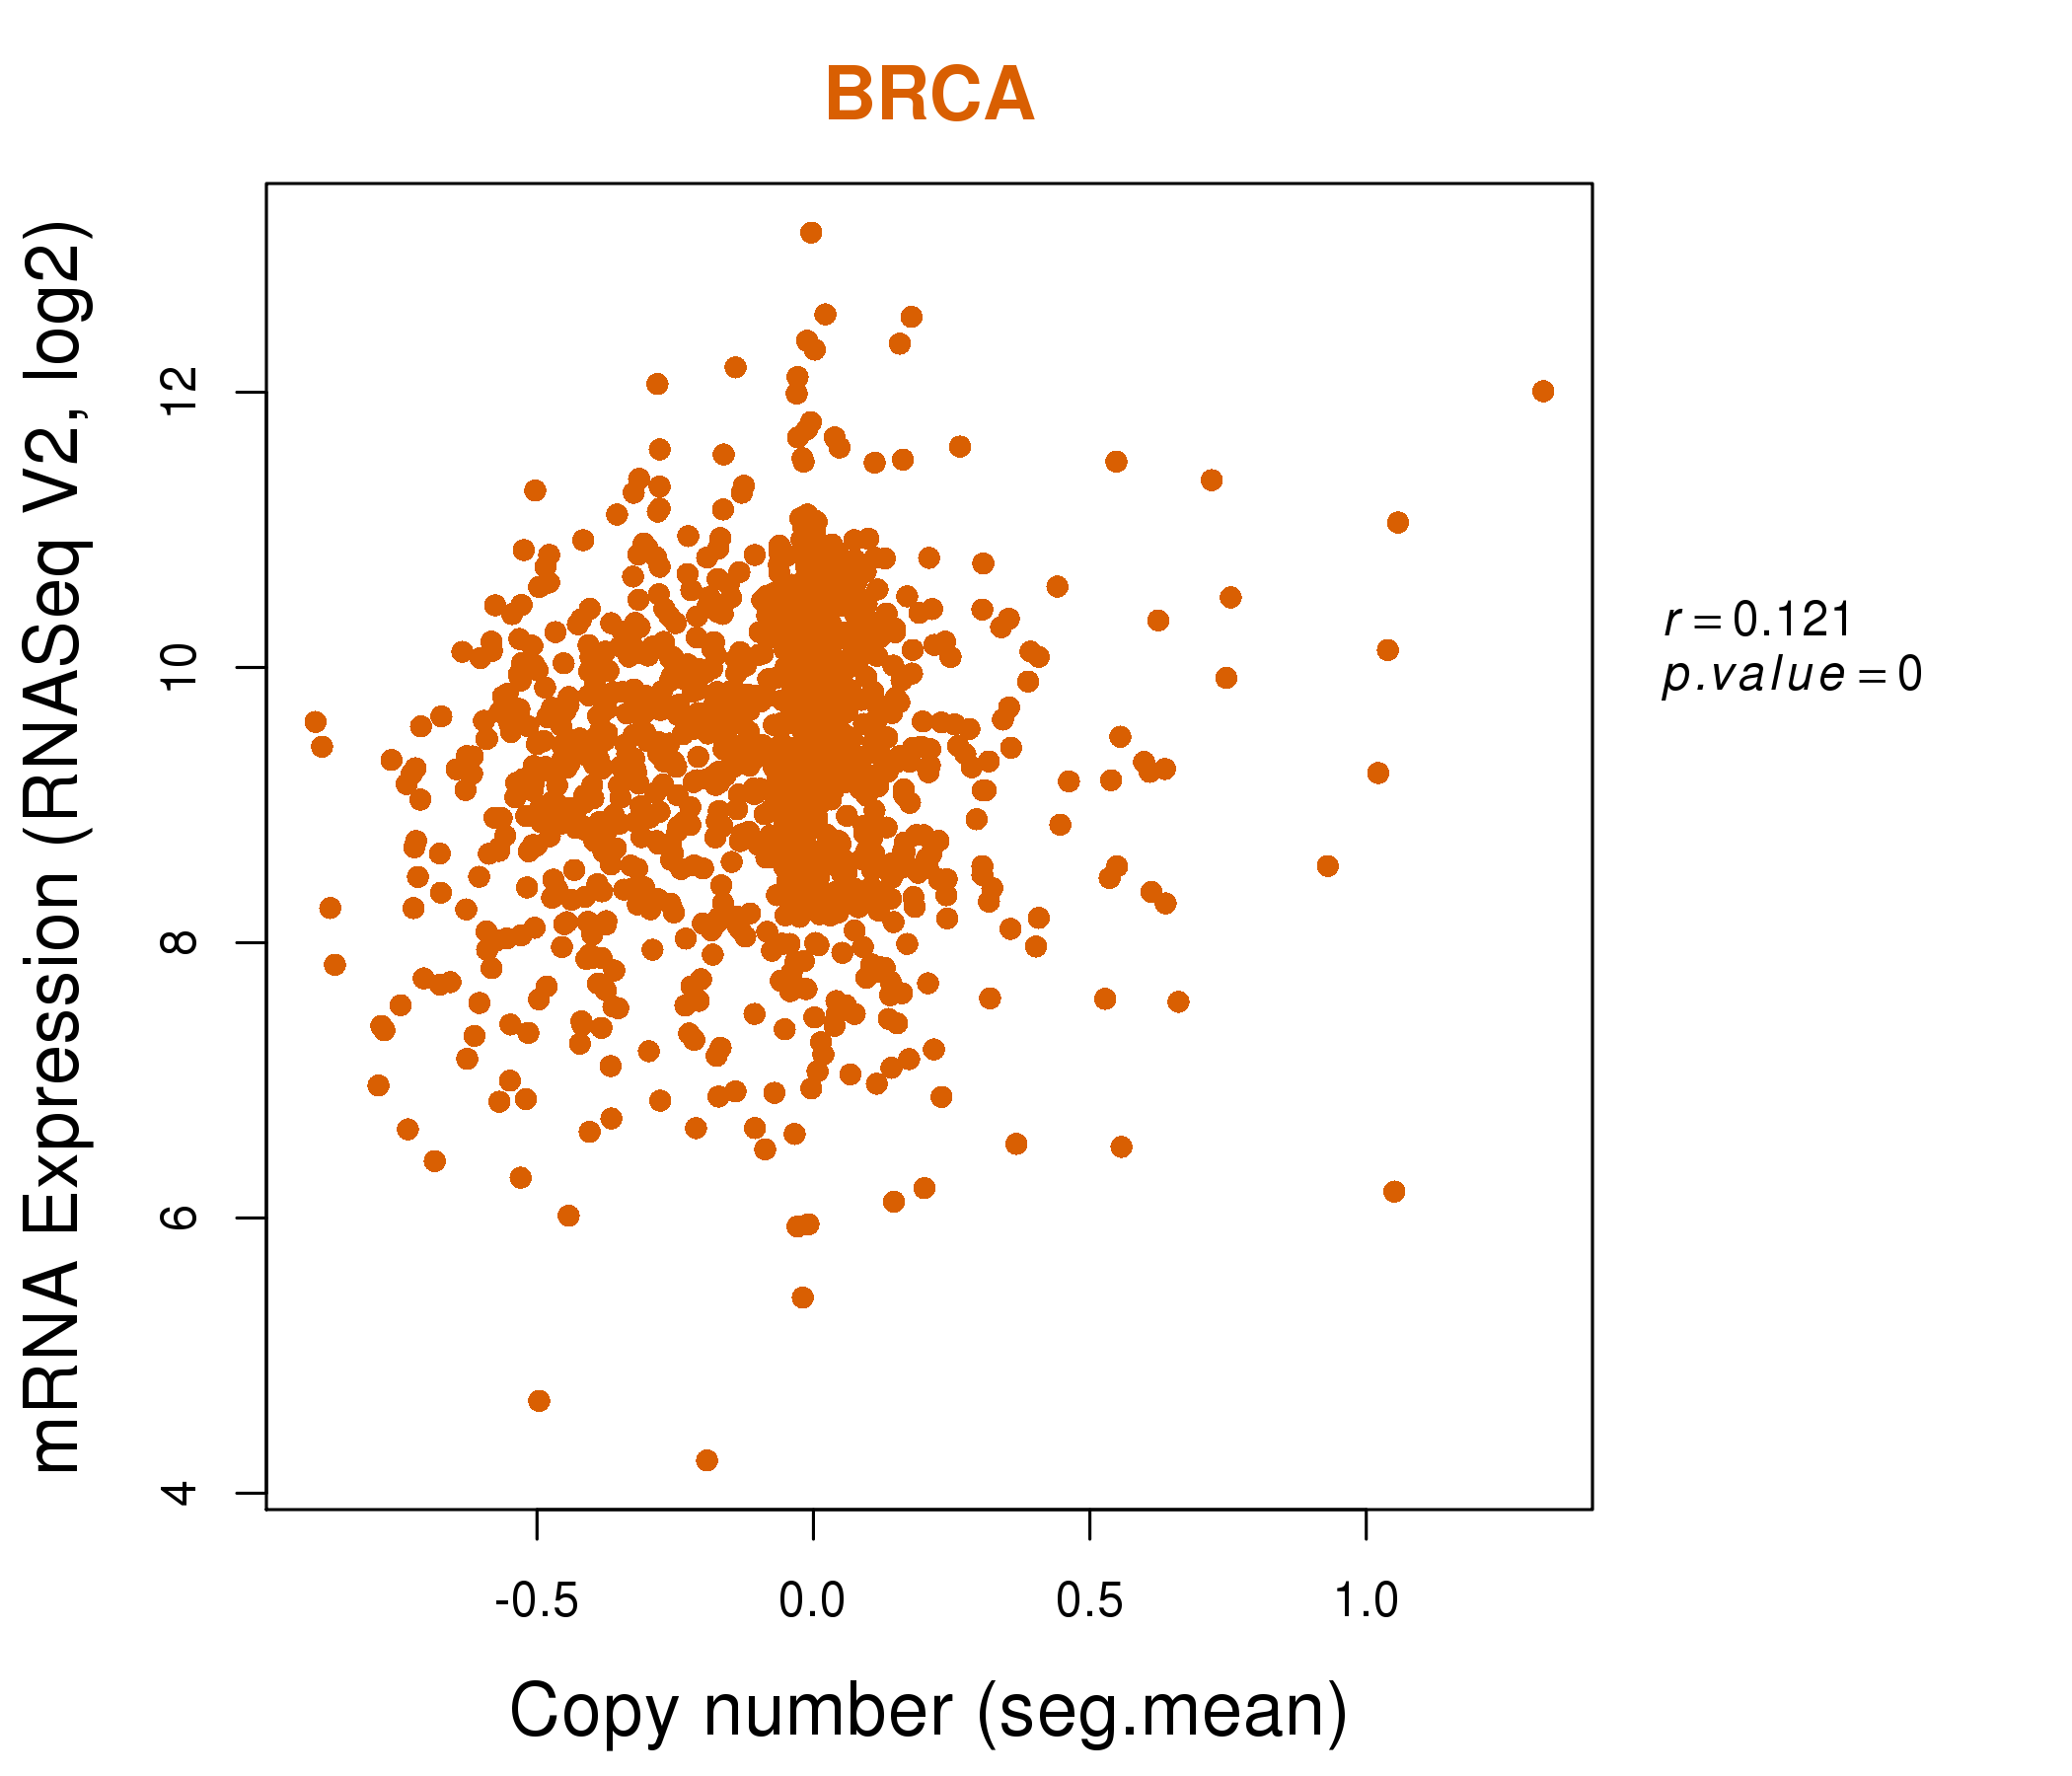
| * Copy number data were extracted from TCGA using R package TCGA-Assembler. The URLs of all public data files on TCGA DCC data server were gathered on Jan-05-2015. Function ProcessCNAData in TCGA-Assembler package was used to obtain gene-level copy number value which is calculated as the average copy number of the genomic region of a gene. |
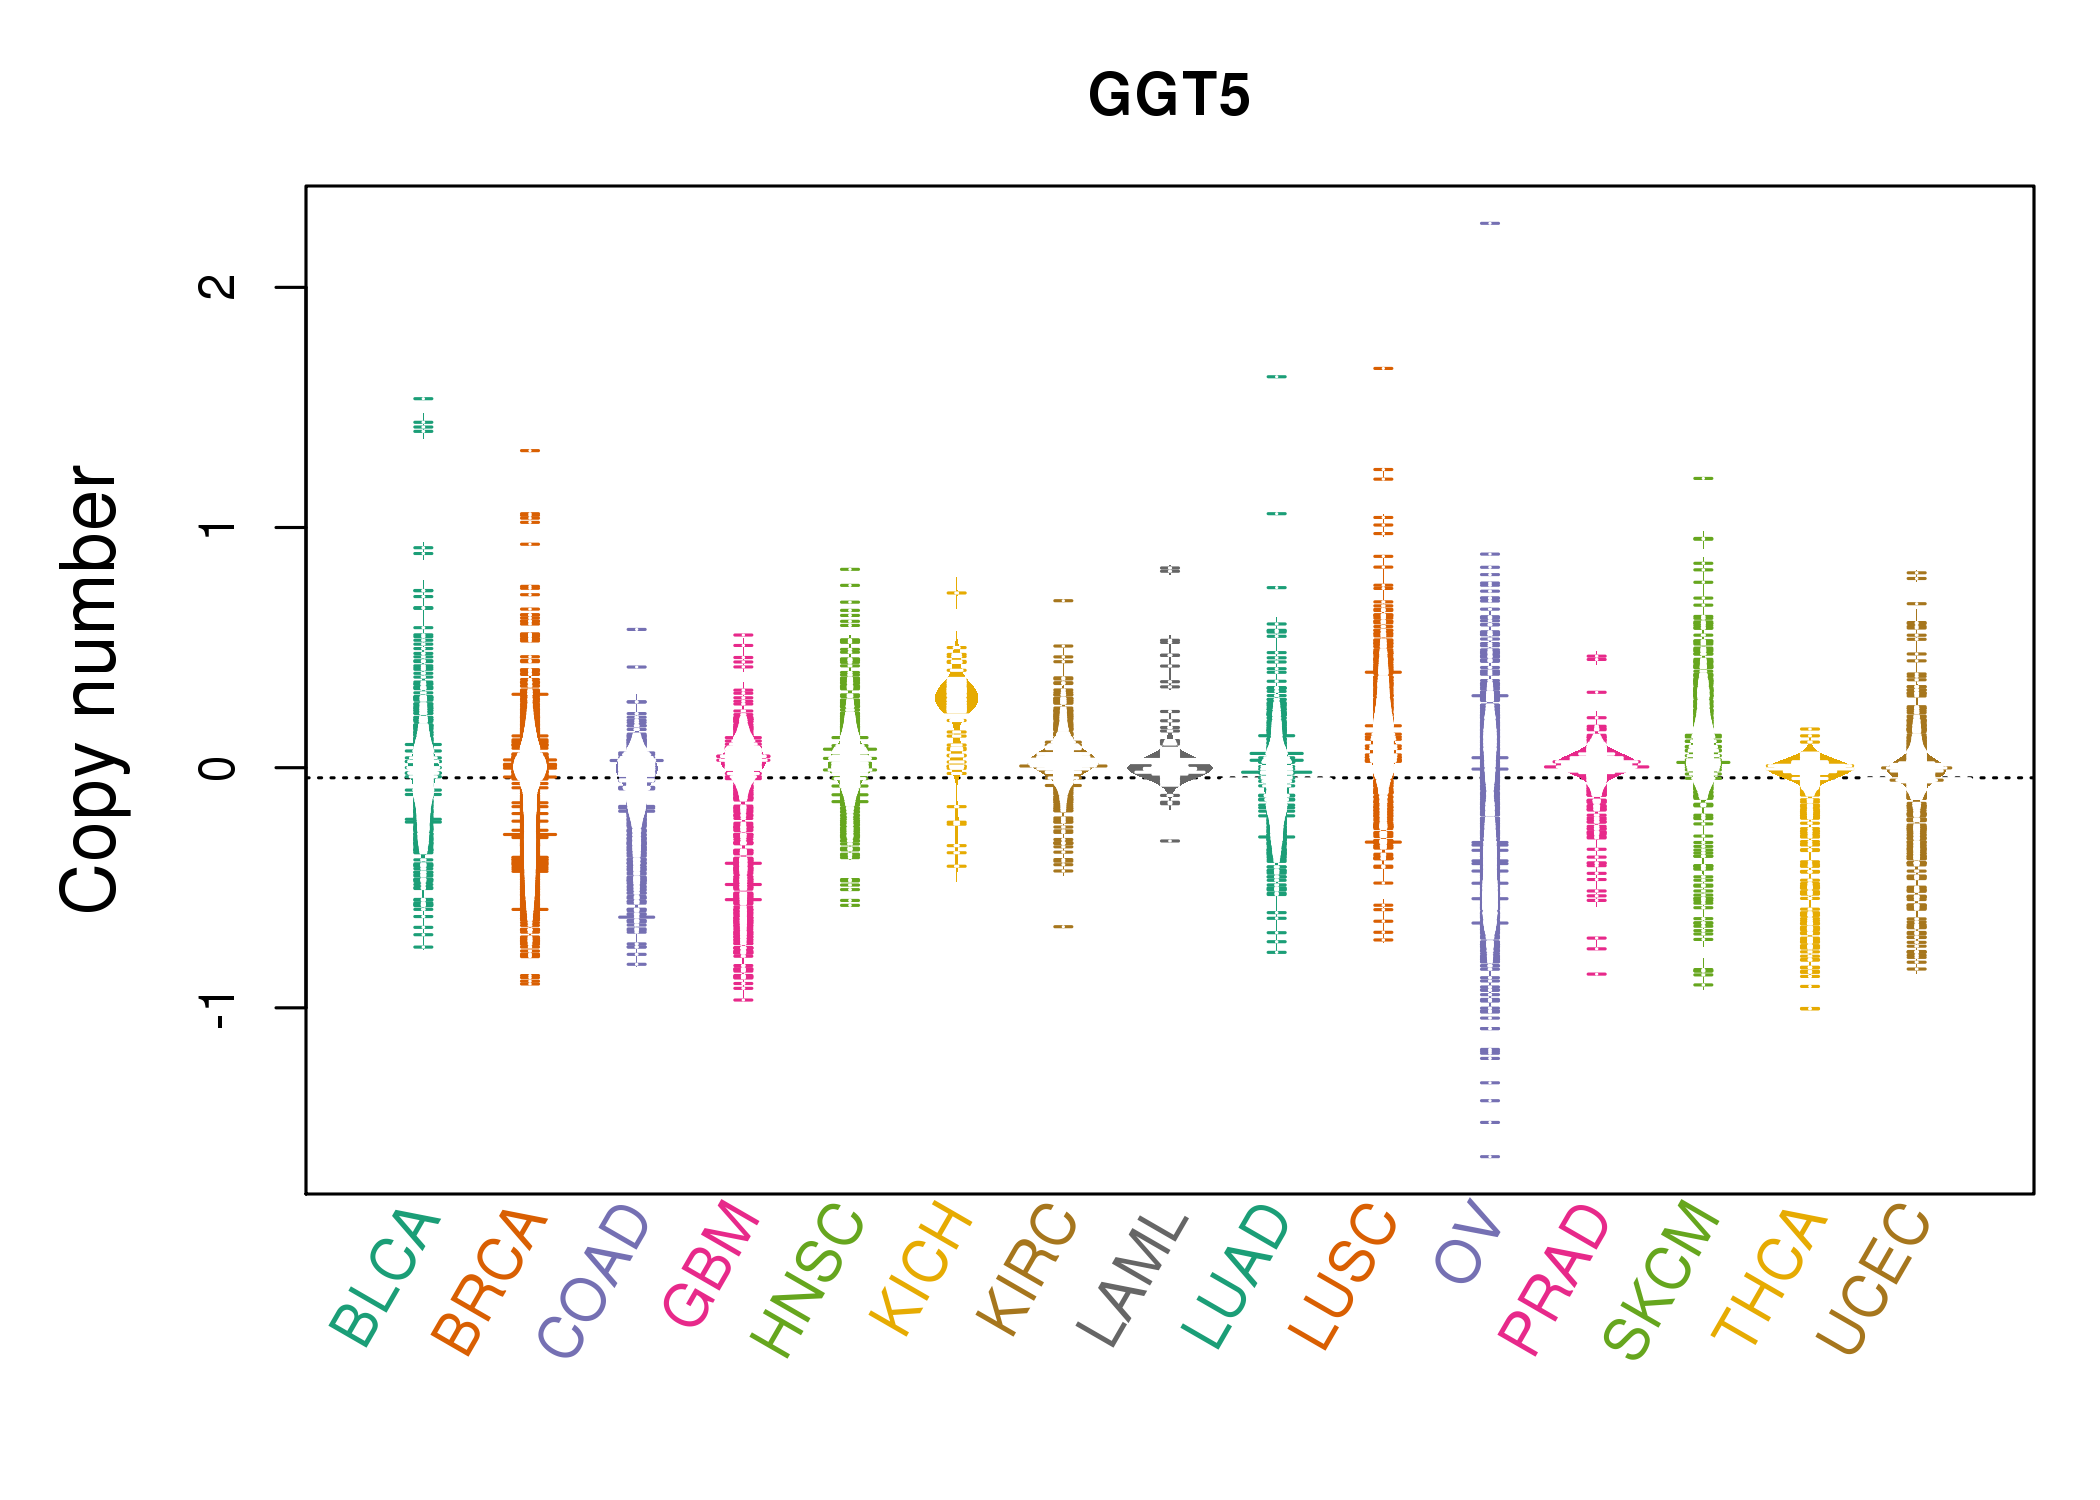 |
| cf) Tissue ID[Tissue type]: BLCA[Bladder Urothelial Carcinoma], BRCA[Breast invasive carcinoma], CESC[Cervical squamous cell carcinoma and endocervical adenocarcinoma], COAD[Colon adenocarcinoma], GBM[Glioblastoma multiforme], Glioma Low Grade, HNSC[Head and Neck squamous cell carcinoma], KICH[Kidney Chromophobe], KIRC[Kidney renal clear cell carcinoma], KIRP[Kidney renal papillary cell carcinoma], LAML[Acute Myeloid Leukemia], LUAD[Lung adenocarcinoma], LUSC[Lung squamous cell carcinoma], OV[Ovarian serous cystadenocarcinoma ], PAAD[Pancreatic adenocarcinoma], PRAD[Prostate adenocarcinoma], SKCM[Skin Cutaneous Melanoma], STAD[Stomach adenocarcinoma], THCA[Thyroid carcinoma], UCEC[Uterine Corpus Endometrial Carcinoma] |
| Top |
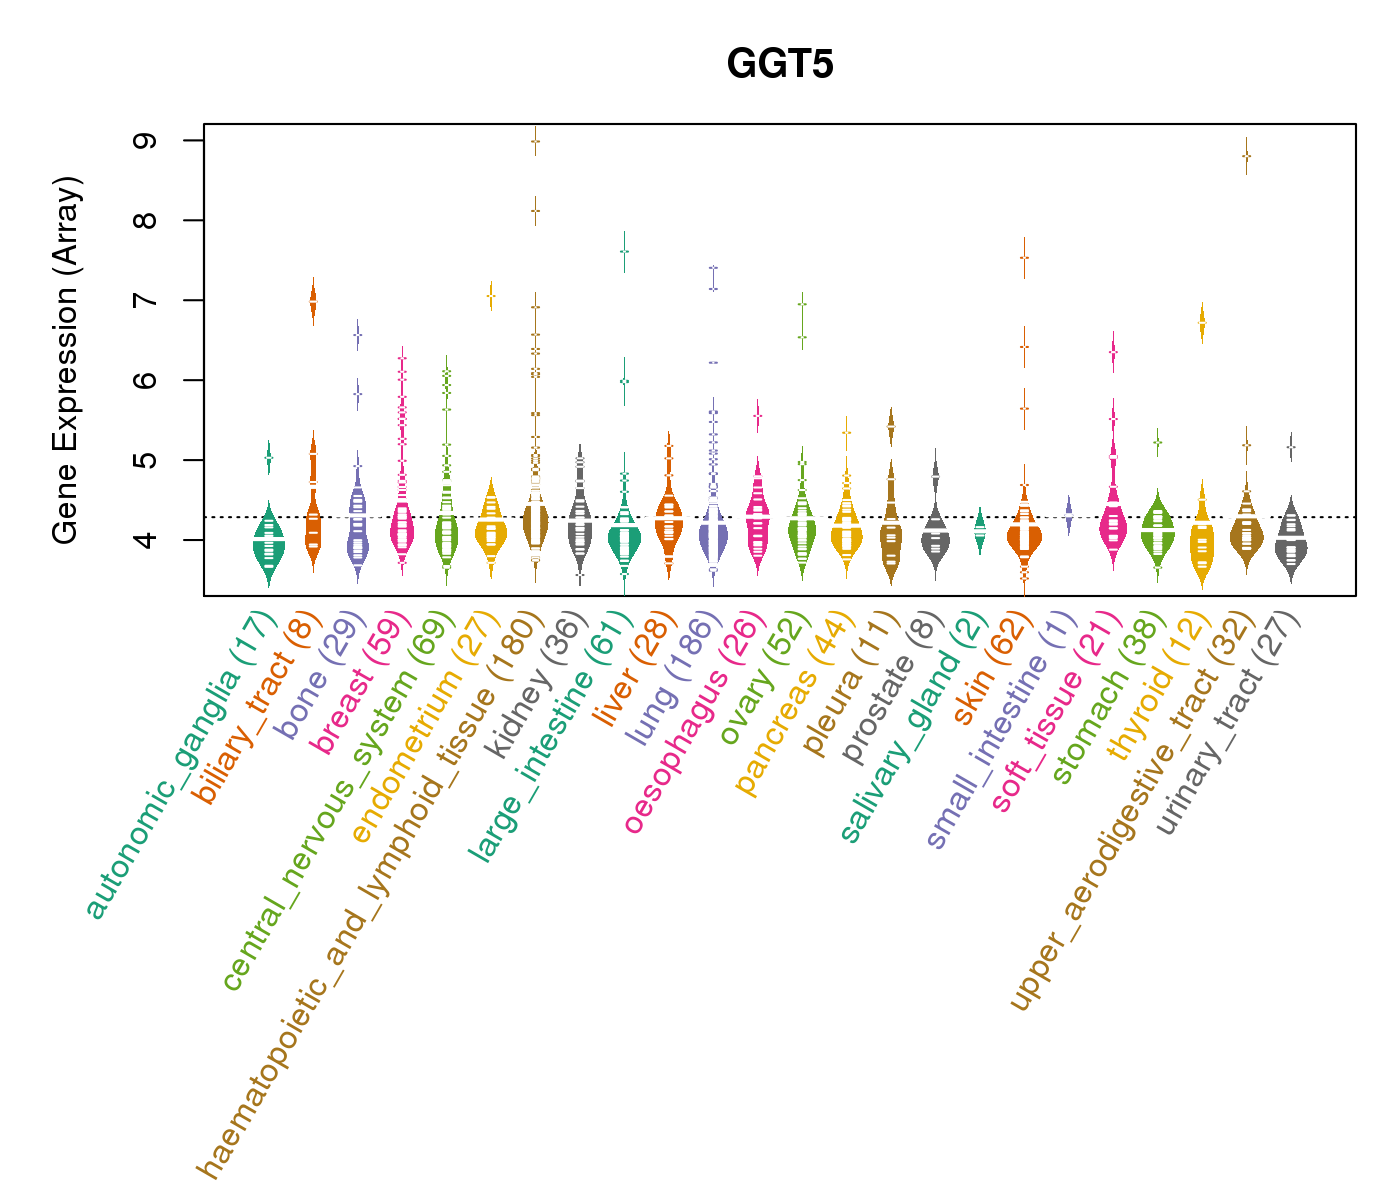
| Gene Expression for GGT5 |
| * CCLE gene expression data were extracted from CCLE_Expression_Entrez_2012-10-18.res: Gene-centric RMA-normalized mRNA expression data. |
 |
| * Normalized gene expression data of RNASeqV2 was extracted from TCGA using R package TCGA-Assembler. The URLs of all public data files on TCGA DCC data server were gathered at Jan-05-2015. Only eight cancer types have enough normal control samples for differential expression analysis. (t test, adjusted p<0.05 (using Benjamini-Hochberg FDR)) |
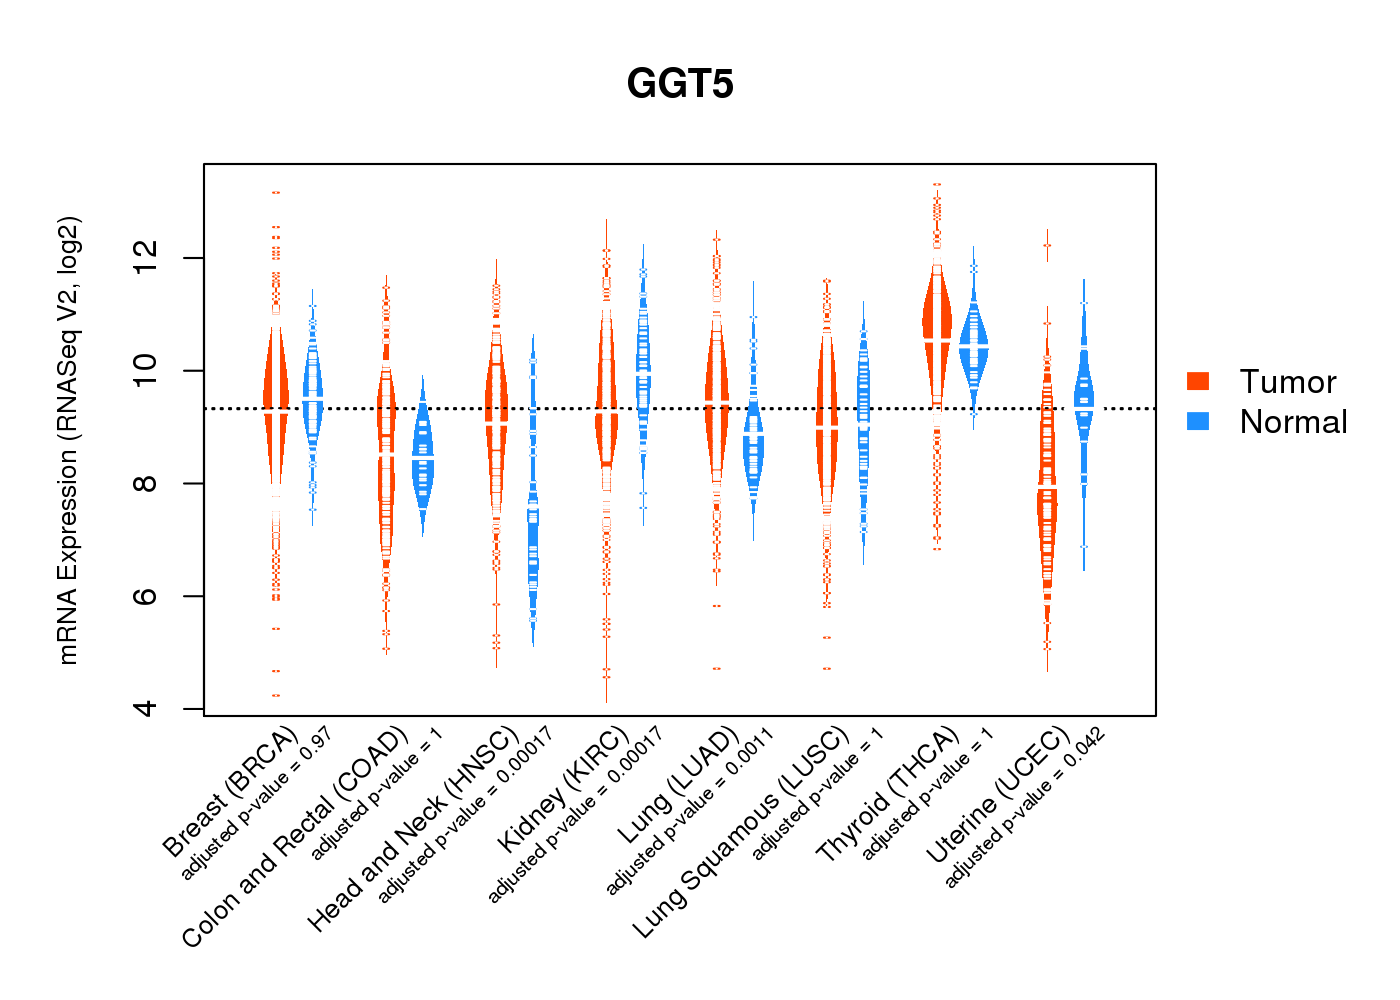 |
| Top |
| * This plots show the correlation between CNV and gene expression. |
: Open all plots for all cancer types
 |
|
 |
|

| Top |
| Gene-Gene Network Information |
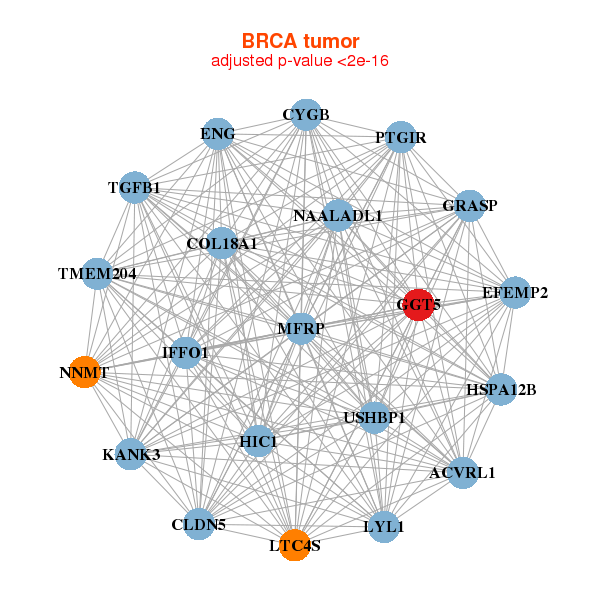
| * Co-Expression network figures were drawn using R package igraph. Only the top 20 genes with the highest correlations were shown. Red circle: input gene, orange circle: cell metabolism gene, sky circle: other gene |
: Open all plots for all cancer types
 |
| ||||
| ACVRL1,CLDN5,COL18A1,CYGB,EFEMP2,ENG,GGT5, GRASP,HIC1,HSPA12B,IFFO1,KANK3,LTC4S,LYL1, MFRP,NAALADL1,NNMT,PTGIR,TGFB1,TMEM204,USHBP1 | AIP,ARHGDIA,ARPC1B,EFHD2,GGT5,GIMAP1,HAUS7, HDAC7,KCTD17,LYL1,MAP3K11,MVP,PLOD3,PPP1R12C, RNH1,RPS6KA4,SHKBP1,SIPA1,SLC39A13,TNIP2,ZNF668 | ||||
 |
| ||||
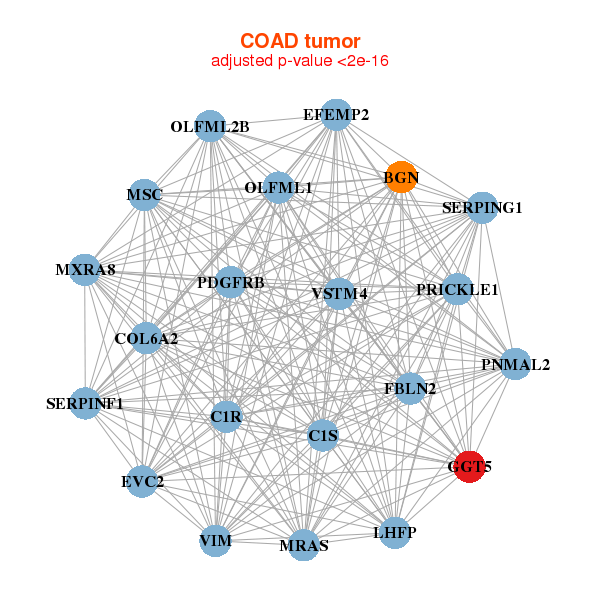
| BGN,VSTM4,C1R,C1S,COL6A2,EFEMP2,EVC2, FBLN2,GGT5,LHFP,MRAS,MSC,MXRA8,OLFML1, OLFML2B,PDGFRB,PNMAL2,PRICKLE1,SERPINF1,SERPING1,VIM | ADAM22,ALOX5,BARX1,BMPER,BMX,CCDC129,ENG, GANAB,GGT5,IL1R1,LRRC32,MKL2,OVCH1,PLVAP, PTK7,S1PR2,SCARA5,TAS1R3,TBX2,UTRN,ZNF732 |
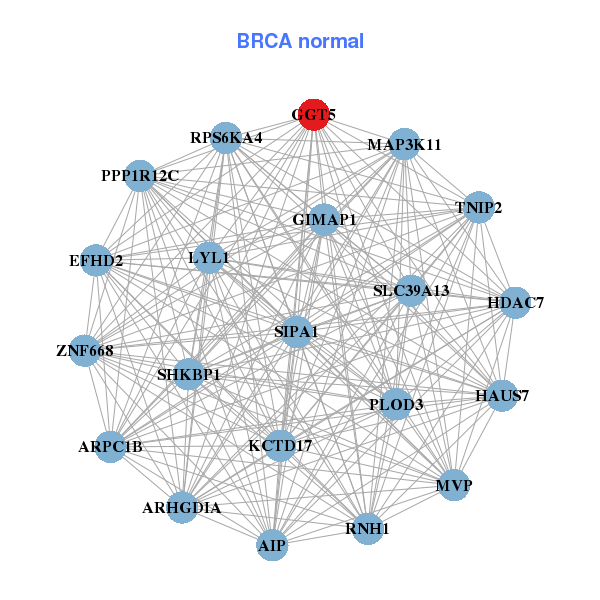
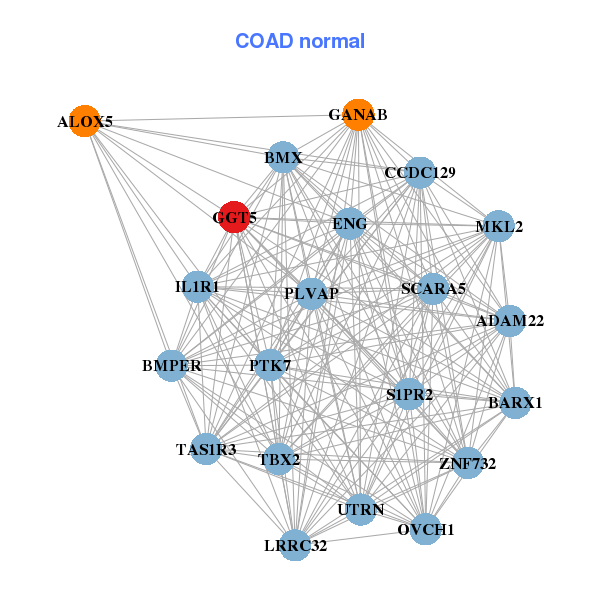
| * Co-Expression network figures were drawn using R package igraph. Only the top 20 genes with the highest correlations were shown. Red circle: input gene, orange circle: cell metabolism gene, sky circle: other gene |
: Open all plots for all cancer types
| Top |
: Open all interacting genes' information including KEGG pathway for all interacting genes from DAVID
| Top |
| Pharmacological Information for GGT5 |
| DB Category | DB Name | DB's ID and Url link |
| * Gene Centered Interaction Network. |
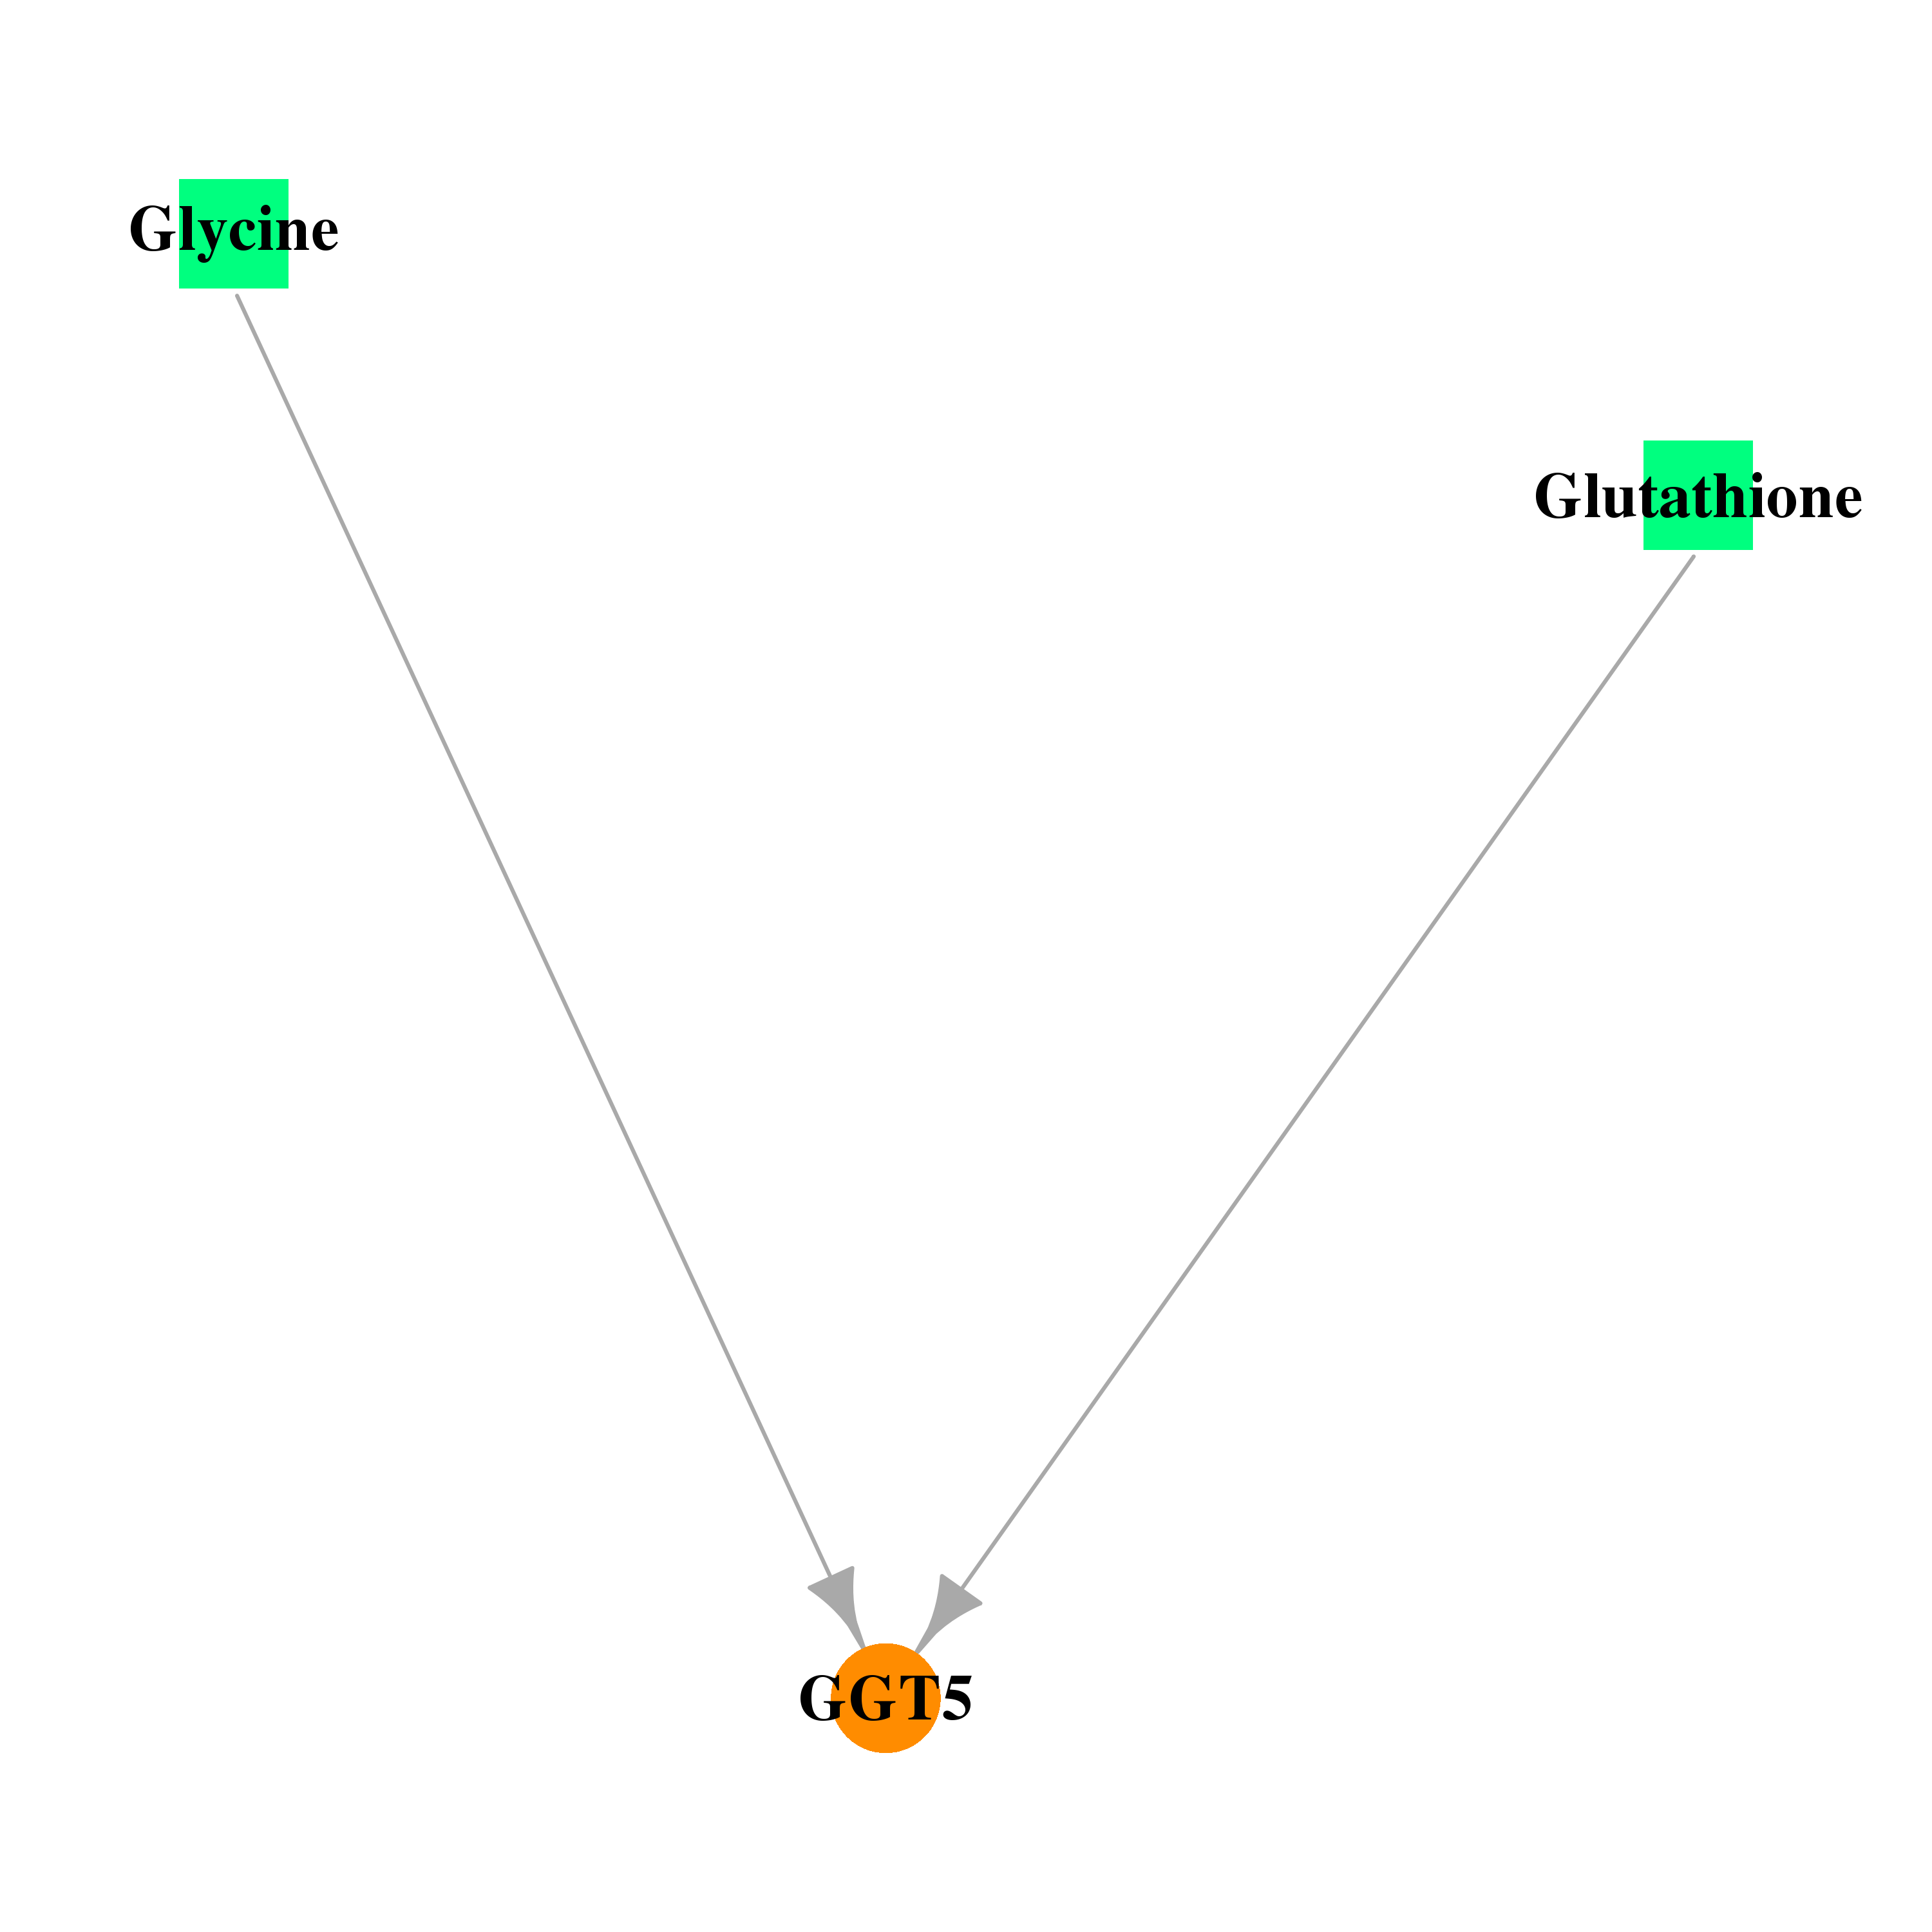 |
| * Drug Centered Interaction Network. |
| DrugBank ID | Target Name | Drug Groups | Generic Name | Drug Centered Network | Drug Structure |
| DB00143 | gamma-glutamyltransferase 5 | approved; nutraceutical | Glutathione |  |  |
| DB00145 | gamma-glutamyltransferase 5 | approved; nutraceutical | Glycine |  |  |
| Top |
| Cross referenced IDs for GGT5 |
| * We obtained these cross-references from Uniprot database. It covers 150 different DBs, 18 categories. http://www.uniprot.org/help/cross_references_section |
: Open all cross reference information
|
Copyright © 2016-Present - The Univsersity of Texas Health Science Center at Houston @ |