|
|||||||||||||||||||||||||||||||||||||||||||||||||||||||||||||||||||||||||||||||||||||||||||||||||||||||||||||||||||||||||||||||||||||||||||||||||||||||||||||||||||||||||||||||||||||||||||||||||||||||||||||||||||||||||||||||||||||||||||||||||||||||||||||||||||||||||||||||||||||||||||||||||||||||||||||||||||||||||||||||||||||||||||||
| |
| Phenotypic Information (metabolism pathway, cancer, disease, phenome) |
| |
| |
| Gene-Gene Network Information: Co-Expression Network, Interacting Genes & KEGG |
| |
|


| Gene Summary for GIP |
| Basic gene info. | Gene symbol | GIP |
| Gene name | gastric inhibitory polypeptide | |
| Synonyms | - | |
| Cytomap | UCSC genome browser: 17q21.3-q22 | |
| Genomic location | chr17 :47035917-47045955 | |
| Type of gene | protein-coding | |
| RefGenes | NM_004123.2, | |
| Ensembl id | ENSG00000159224 | |
| Description | glucose-dependent insulinotropic polypeptideincretin hormone | |
| Modification date | 20141207 | |
| dbXrefs | MIM : 137240 | |
| HGNC : HGNC | ||
| Ensembl : ENSG00000159224 | ||
| HPRD : 15925 | ||
| Vega : OTTHUMG00000161171 | ||
| Protein | UniProt: go to UniProt's Cross Reference DB Table | |
| Expression | CleanEX: HS_GIP | |
| BioGPS: 2695 | ||
| Gene Expression Atlas: ENSG00000159224 | ||
| The Human Protein Atlas: ENSG00000159224 | ||
| Pathway | NCI Pathway Interaction Database: GIP | |
| KEGG: GIP | ||
| REACTOME: GIP | ||
| ConsensusPathDB | ||
| Pathway Commons: GIP | ||
| Metabolism | MetaCyc: GIP | |
| HUMANCyc: GIP | ||
| Regulation | Ensembl's Regulation: ENSG00000159224 | |
| miRBase: chr17 :47,035,917-47,045,955 | ||
| TargetScan: NM_004123 | ||
| cisRED: ENSG00000159224 | ||
| Context | iHOP: GIP | |
| cancer metabolism search in PubMed: GIP | ||
| UCL Cancer Institute: GIP | ||
| Assigned class in ccmGDB | C | |
| Top |
| Phenotypic Information for GIP(metabolism pathway, cancer, disease, phenome) |
| Cancer | CGAP: GIP |
| Familial Cancer Database: GIP | |
| * This gene is included in those cancer gene databases. |
|
|
|
|
|
| . | |||||||||||||||||||||||||||||||||||||||||||||||||||||||||||||||||||||||||||||||||||||||||||||||||||||||||||||||||||||||||||||||||||||||||||||||||||||||||||||||||||||||||||||||||||||||||||||||||||||||||||||||||||||||||||||||||||||||||||||||||||||||||||||||||||||||||||||||||||||||||||||||||||||||||||||||||||||||||||||||||||||||
Oncogene 1 | Significant driver gene in | ||||||||||||||||||||||||||||||||||||||||||||||||||||||||||||||||||||||||||||||||||||||||||||||||||||||||||||||||||||||||||||||||||||||||||||||||||||||||||||||||||||||||||||||||||||||||||||||||||||||||||||||||||||||||||||||||||||||||||||||||||||||||||||||||||||||||||||||||||||||||||||||||||||||||||||||||||||||||||||||||||||||||||||
| cf) number; DB name 1 Oncogene; http://nar.oxfordjournals.org/content/35/suppl_1/D721.long, 2 Tumor Suppressor gene; https://bioinfo.uth.edu/TSGene/, 3 Cancer Gene Census; http://www.nature.com/nrc/journal/v4/n3/abs/nrc1299.html, 4 CancerGenes; http://nar.oxfordjournals.org/content/35/suppl_1/D721.long, 5 Network of Cancer Gene; http://ncg.kcl.ac.uk/index.php, 1Therapeutic Vulnerabilities in Cancer; http://cbio.mskcc.org/cancergenomics/statius/ |
| REACTOME_INTEGRATION_OF_ENERGY_METABOLISM | |
| OMIM | |
| Orphanet | |
| Disease | KEGG Disease: GIP |
| MedGen: GIP (Human Medical Genetics with Condition) | |
| ClinVar: GIP | |
| Phenotype | MGI: GIP (International Mouse Phenotyping Consortium) |
| PhenomicDB: GIP | |
| Mutations for GIP |
| * Under tables are showing count per each tissue to give us broad intuition about tissue specific mutation patterns.You can go to the detailed page for each mutation database's web site. |
| There's no structural variation information in COSMIC data for this gene. |
| * From mRNA Sanger sequences, Chitars2.0 arranged chimeric transcripts. This table shows GIP related fusion information. |
| ID | Head Gene | Tail Gene | Accession | Gene_a | qStart_a | qEnd_a | Chromosome_a | tStart_a | tEnd_a | Gene_a | qStart_a | qEnd_a | Chromosome_a | tStart_a | tEnd_a |
| Top |
| Mutation type/ Tissue ID | brca | cns | cerv | endome | haematopo | kidn | Lintest | liver | lung | ns | ovary | pancre | prost | skin | stoma | thyro | urina | |||
| Total # sample | 2 | |||||||||||||||||||
| GAIN (# sample) | 2 | |||||||||||||||||||
| LOSS (# sample) |
| cf) Tissue ID; Tissue type (1; Breast, 2; Central_nervous_system, 3; Cervix, 4; Endometrium, 5; Haematopoietic_and_lymphoid_tissue, 6; Kidney, 7; Large_intestine, 8; Liver, 9; Lung, 10; NS, 11; Ovary, 12; Pancreas, 13; Prostate, 14; Skin, 15; Stomach, 16; Thyroid, 17; Urinary_tract) |
| Top |
|
 |
| Top |
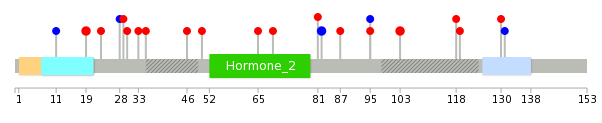
| Stat. for Non-Synonymous SNVs (# total SNVs=11) | (# total SNVs=3) |
 |  |
(# total SNVs=0) | (# total SNVs=0) |
| Top |
| * When you move the cursor on each content, you can see more deailed mutation information on the Tooltip. Those are primary_site,primary_histology,mutation(aa),pubmedID. |
| GRCh37 position | Mutation(aa) | Unique sampleID count |
| chr17:47041683-47041683 | p.G82G | 2 |
| chr17:47044539-47044539 | p.G19E | 2 |
| chr17:47039132-47039132 | p.S103G | 2 |
| chr17:47044509-47044509 | p.S29I | 1 |
| chr17:47044511-47044511 | p.F28F | 1 |
| chr17:47041686-47041686 | p.K81N | 1 |
| chr17:47044526-47044526 | p.K23N | 1 |
| chr17:47041724-47041724 | p.H69Y | 1 |
| chr17:47038307-47038307 | p.D131D | 1 |
| chr17:47041735-47041735 | p.M65T | 1 |
| Top |
|
 |
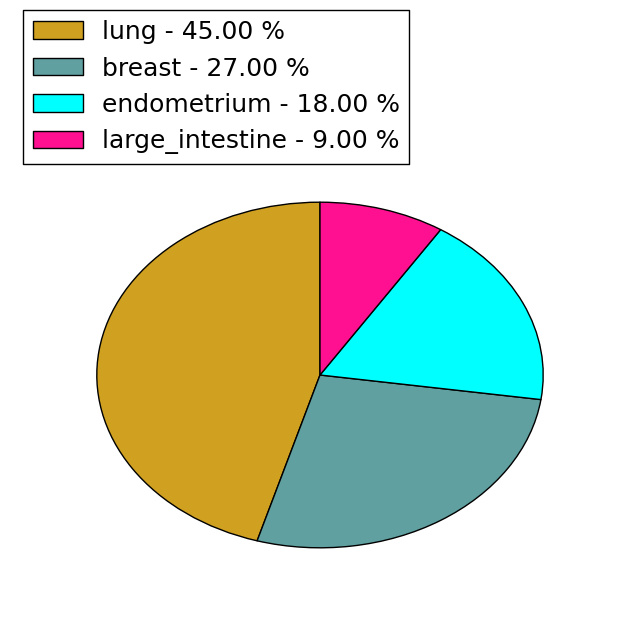
| Point Mutation/ Tissue ID | 1 | 2 | 3 | 4 | 5 | 6 | 7 | 8 | 9 | 10 | 11 | 12 | 13 | 14 | 15 | 16 | 17 | 18 | 19 | 20 |
| # sample | 2 | 4 | 1 | 3 | 2 | 1 | 3 | |||||||||||||
| # mutation | 2 | 4 | 1 | 3 | 2 | 1 | 3 | |||||||||||||
| nonsynonymous SNV | 2 | 3 | 1 | 2 | 1 | 2 | ||||||||||||||
| synonymous SNV | 1 | 1 | 2 | 1 |
| cf) Tissue ID; Tissue type (1; BLCA[Bladder Urothelial Carcinoma], 2; BRCA[Breast invasive carcinoma], 3; CESC[Cervical squamous cell carcinoma and endocervical adenocarcinoma], 4; COAD[Colon adenocarcinoma], 5; GBM[Glioblastoma multiforme], 6; Glioma Low Grade, 7; HNSC[Head and Neck squamous cell carcinoma], 8; KICH[Kidney Chromophobe], 9; KIRC[Kidney renal clear cell carcinoma], 10; KIRP[Kidney renal papillary cell carcinoma], 11; LAML[Acute Myeloid Leukemia], 12; LUAD[Lung adenocarcinoma], 13; LUSC[Lung squamous cell carcinoma], 14; OV[Ovarian serous cystadenocarcinoma ], 15; PAAD[Pancreatic adenocarcinoma], 16; PRAD[Prostate adenocarcinoma], 17; SKCM[Skin Cutaneous Melanoma], 18:STAD[Stomach adenocarcinoma], 19:THCA[Thyroid carcinoma], 20:UCEC[Uterine Corpus Endometrial Carcinoma]) |
| Top |
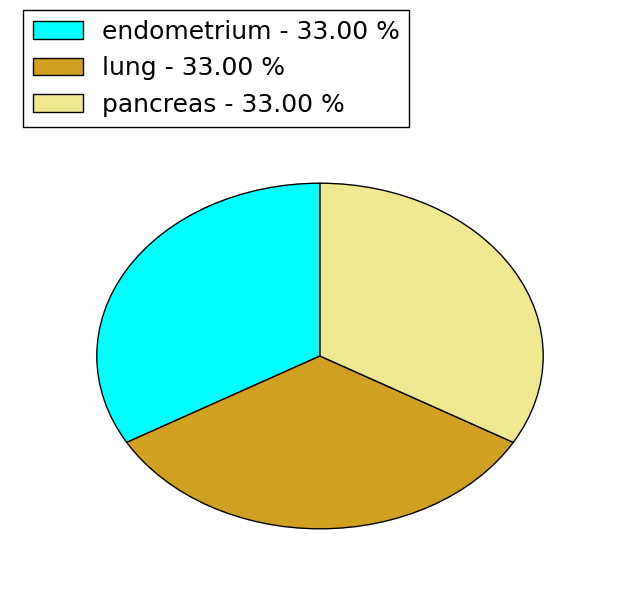
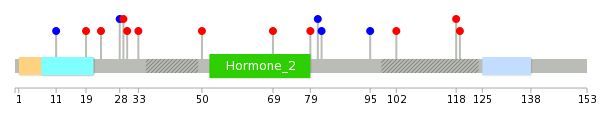
| * We represented just top 10 SNVs. When you move the cursor on each content, you can see more deailed mutation information on the Tooltip. Those are primary_site, primary_histology, mutation(aa), pubmedID. |
| Genomic Position | Mutation(aa) | Unique sampleID count |
| chr17:47041781 | p.S33F | 1 |
| chr17:47041831 | p.A30T | 1 |
| chr17:47041841 | p.S29I | 1 |
| chr17:47038345 | p.F28F | 1 |
| chr17:47044509 | p.K23N | 1 |
| chr17:47038347 | p.G19E | 1 |
| chr17:47044511 | p.L11L | 1 |
| chr17:47039134 | p.P119A | 1 |
| chr17:47044526 | p.S118F | 1 |
| chr17:47039154 | p.A102V | 1 |
| * Copy number data were extracted from TCGA using R package TCGA-Assembler. The URLs of all public data files on TCGA DCC data server were gathered on Jan-05-2015. Function ProcessCNAData in TCGA-Assembler package was used to obtain gene-level copy number value which is calculated as the average copy number of the genomic region of a gene. |
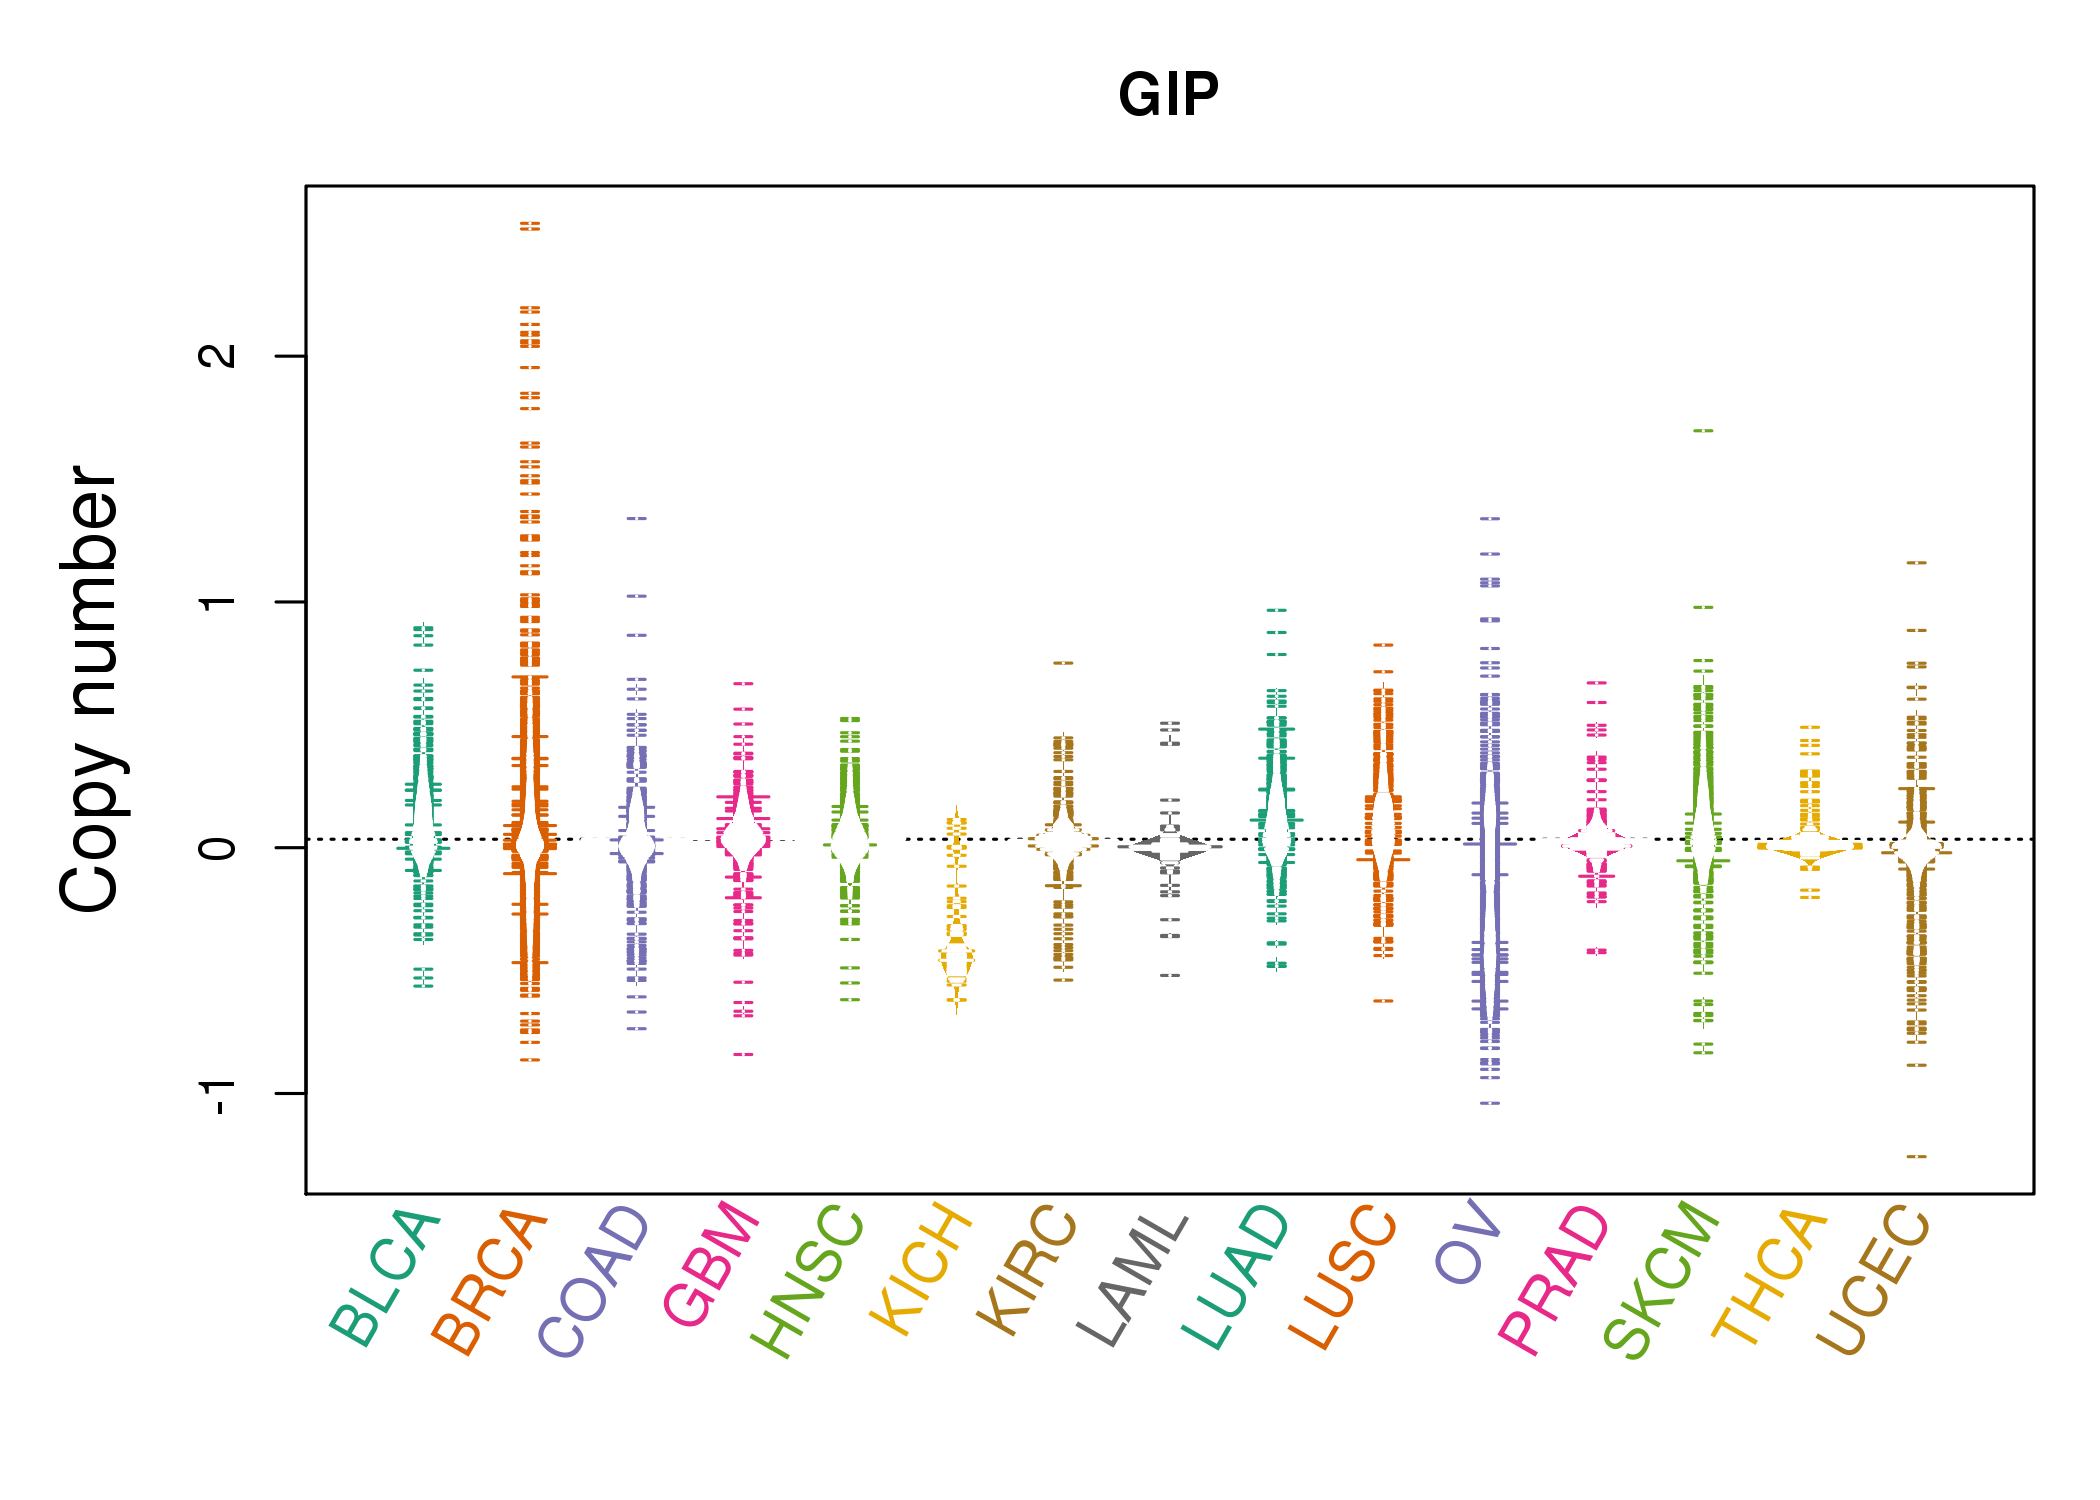 |
| cf) Tissue ID[Tissue type]: BLCA[Bladder Urothelial Carcinoma], BRCA[Breast invasive carcinoma], CESC[Cervical squamous cell carcinoma and endocervical adenocarcinoma], COAD[Colon adenocarcinoma], GBM[Glioblastoma multiforme], Glioma Low Grade, HNSC[Head and Neck squamous cell carcinoma], KICH[Kidney Chromophobe], KIRC[Kidney renal clear cell carcinoma], KIRP[Kidney renal papillary cell carcinoma], LAML[Acute Myeloid Leukemia], LUAD[Lung adenocarcinoma], LUSC[Lung squamous cell carcinoma], OV[Ovarian serous cystadenocarcinoma ], PAAD[Pancreatic adenocarcinoma], PRAD[Prostate adenocarcinoma], SKCM[Skin Cutaneous Melanoma], STAD[Stomach adenocarcinoma], THCA[Thyroid carcinoma], UCEC[Uterine Corpus Endometrial Carcinoma] |
| Top |
| Gene Expression for GIP |
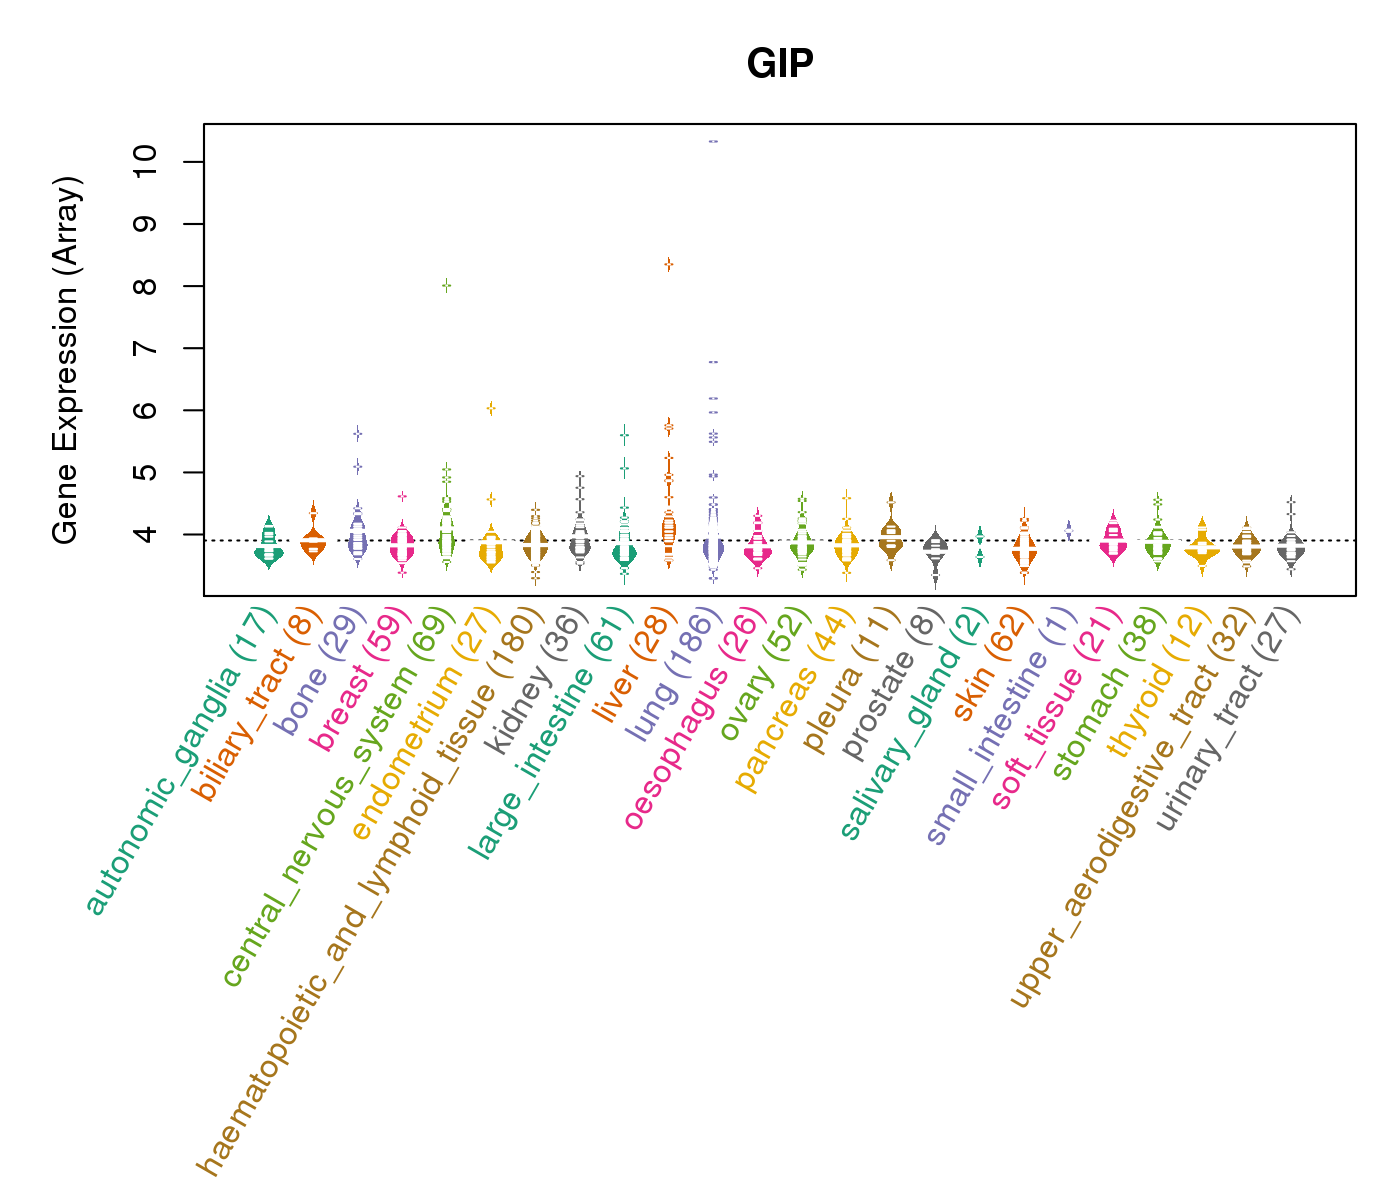
| * CCLE gene expression data were extracted from CCLE_Expression_Entrez_2012-10-18.res: Gene-centric RMA-normalized mRNA expression data. |
 |
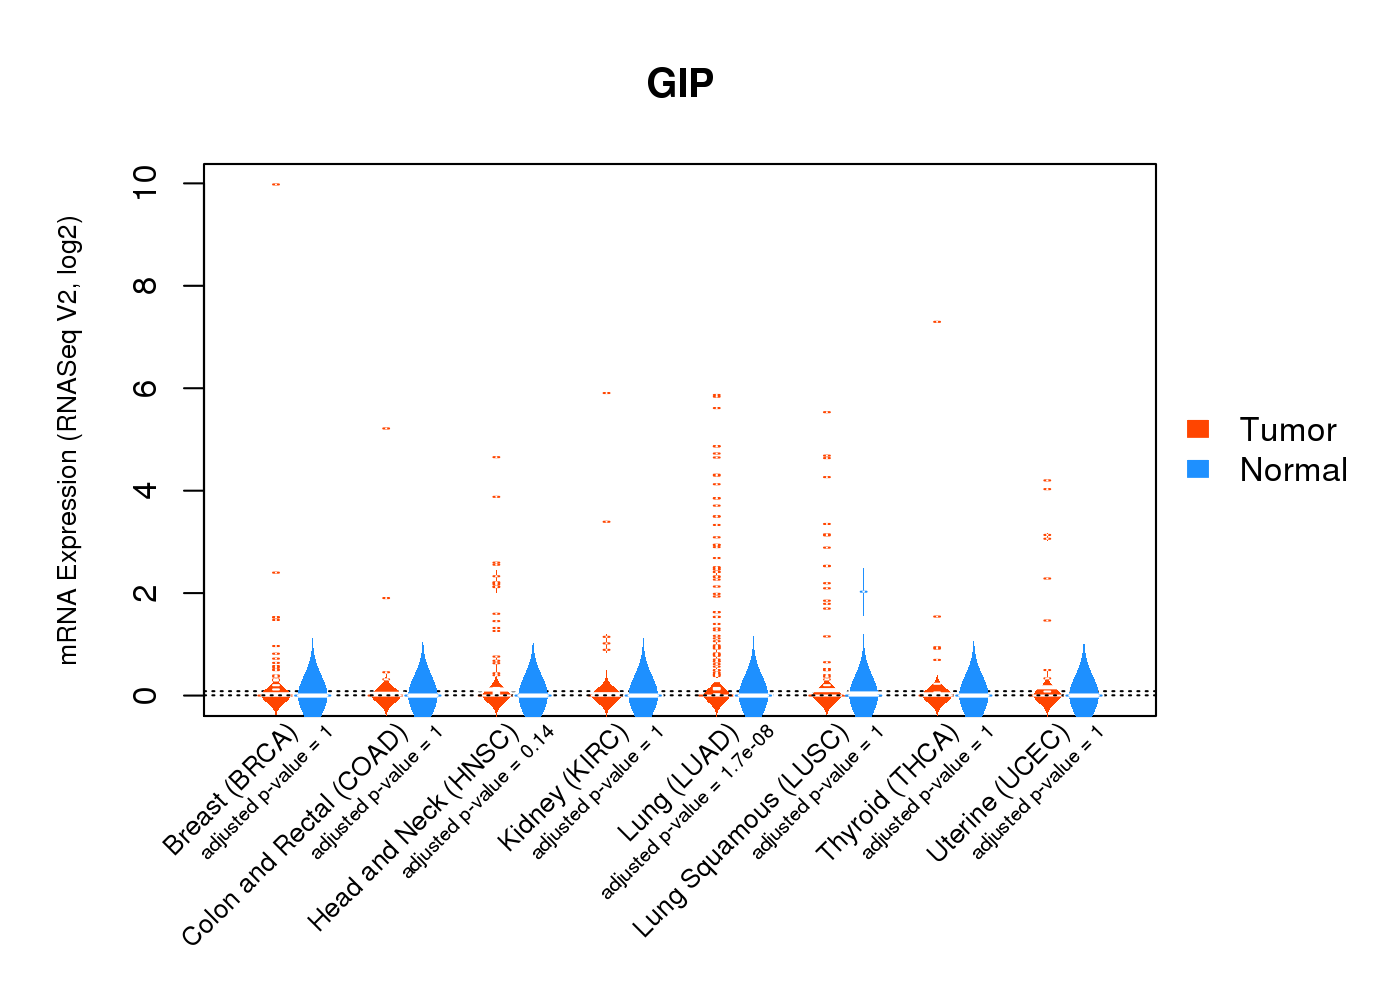
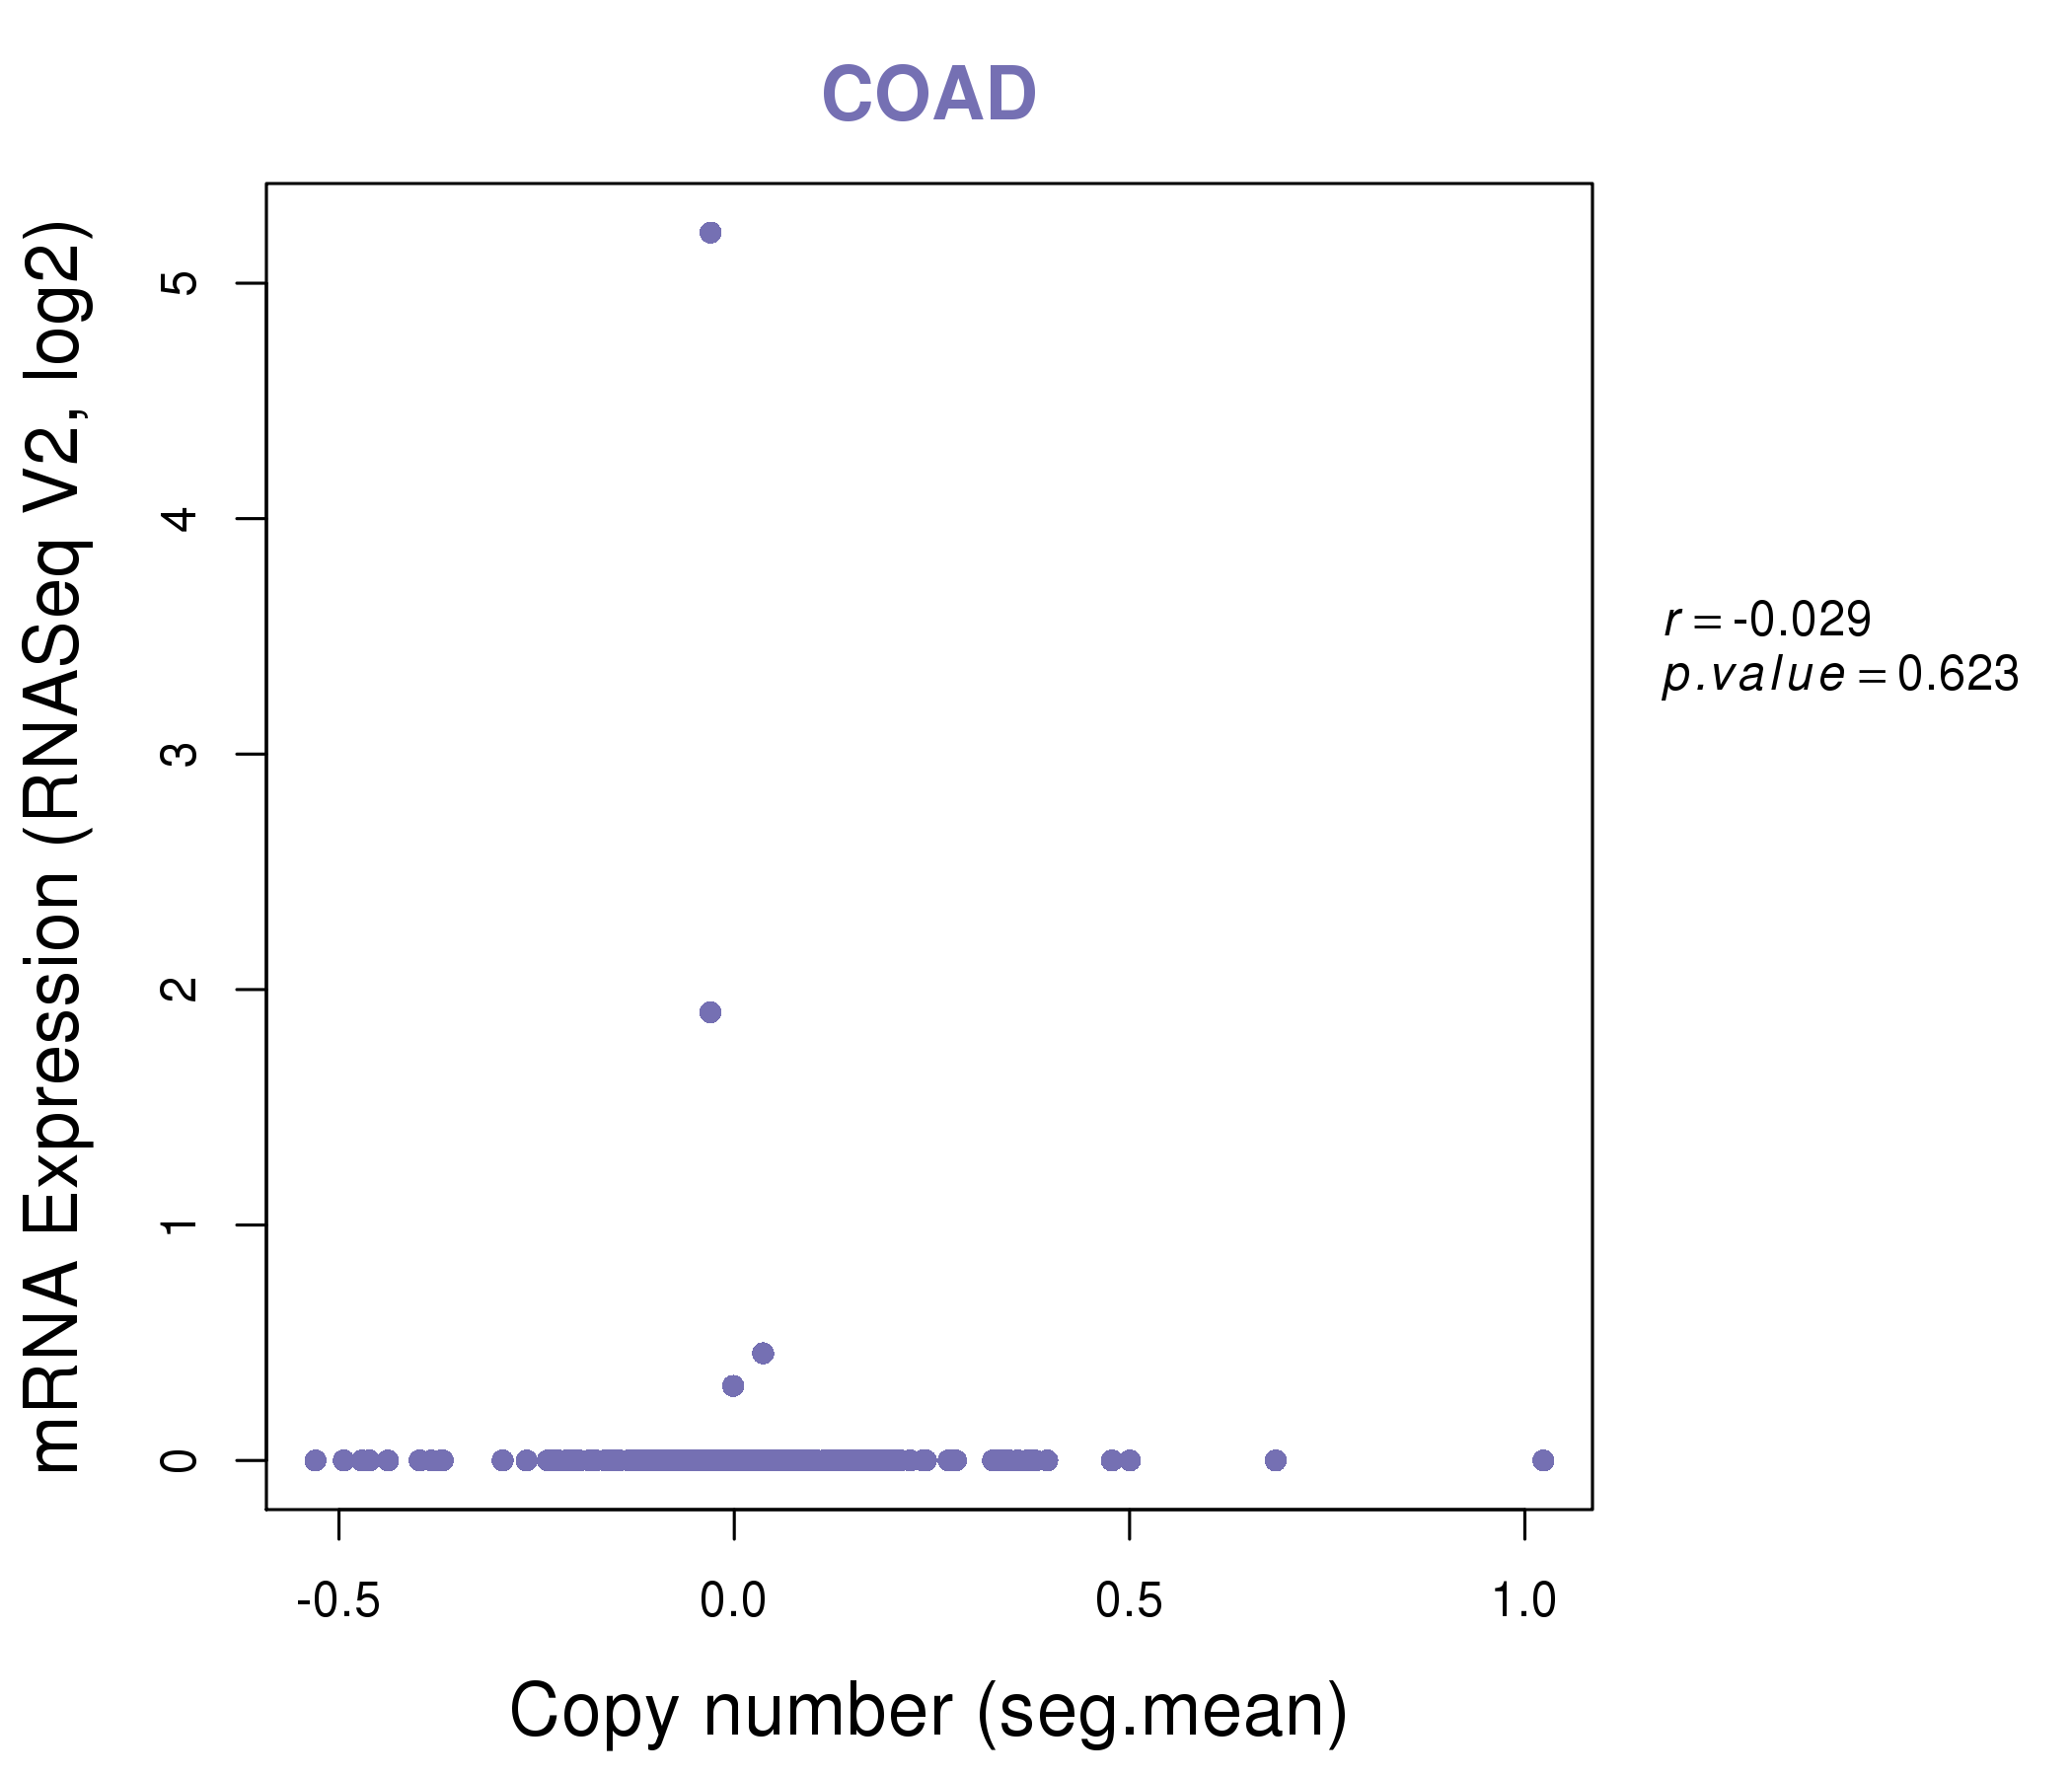
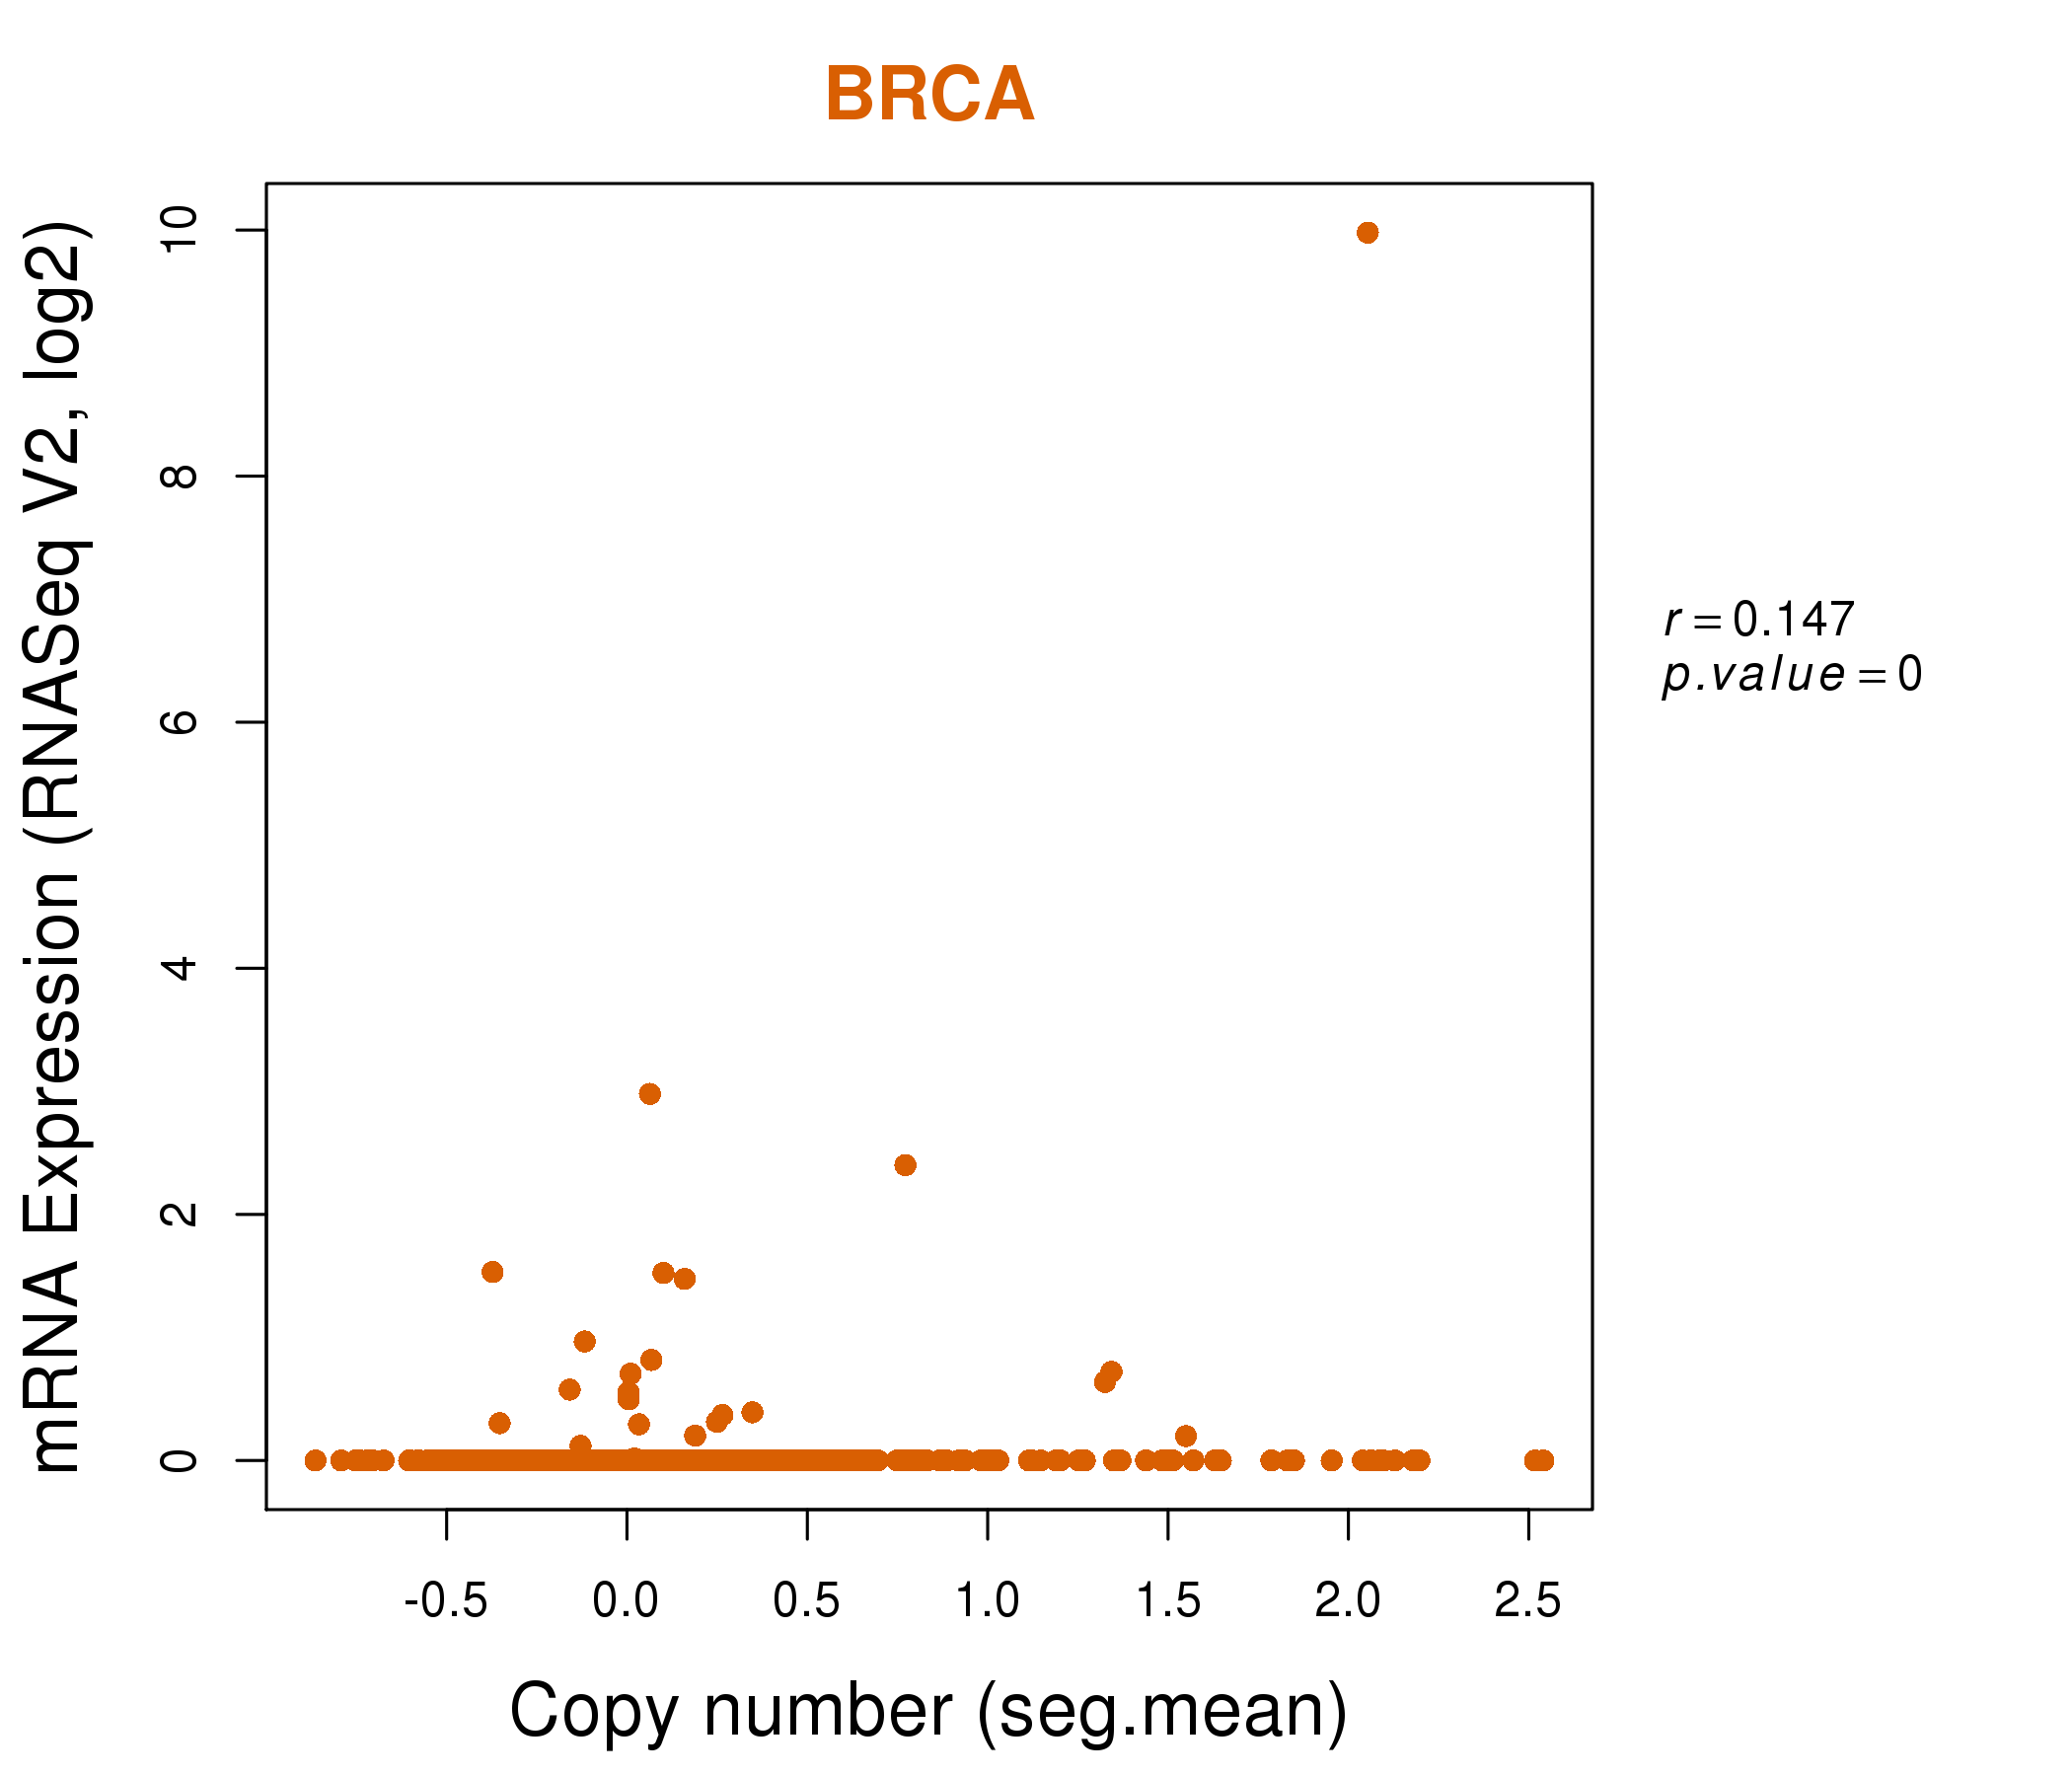
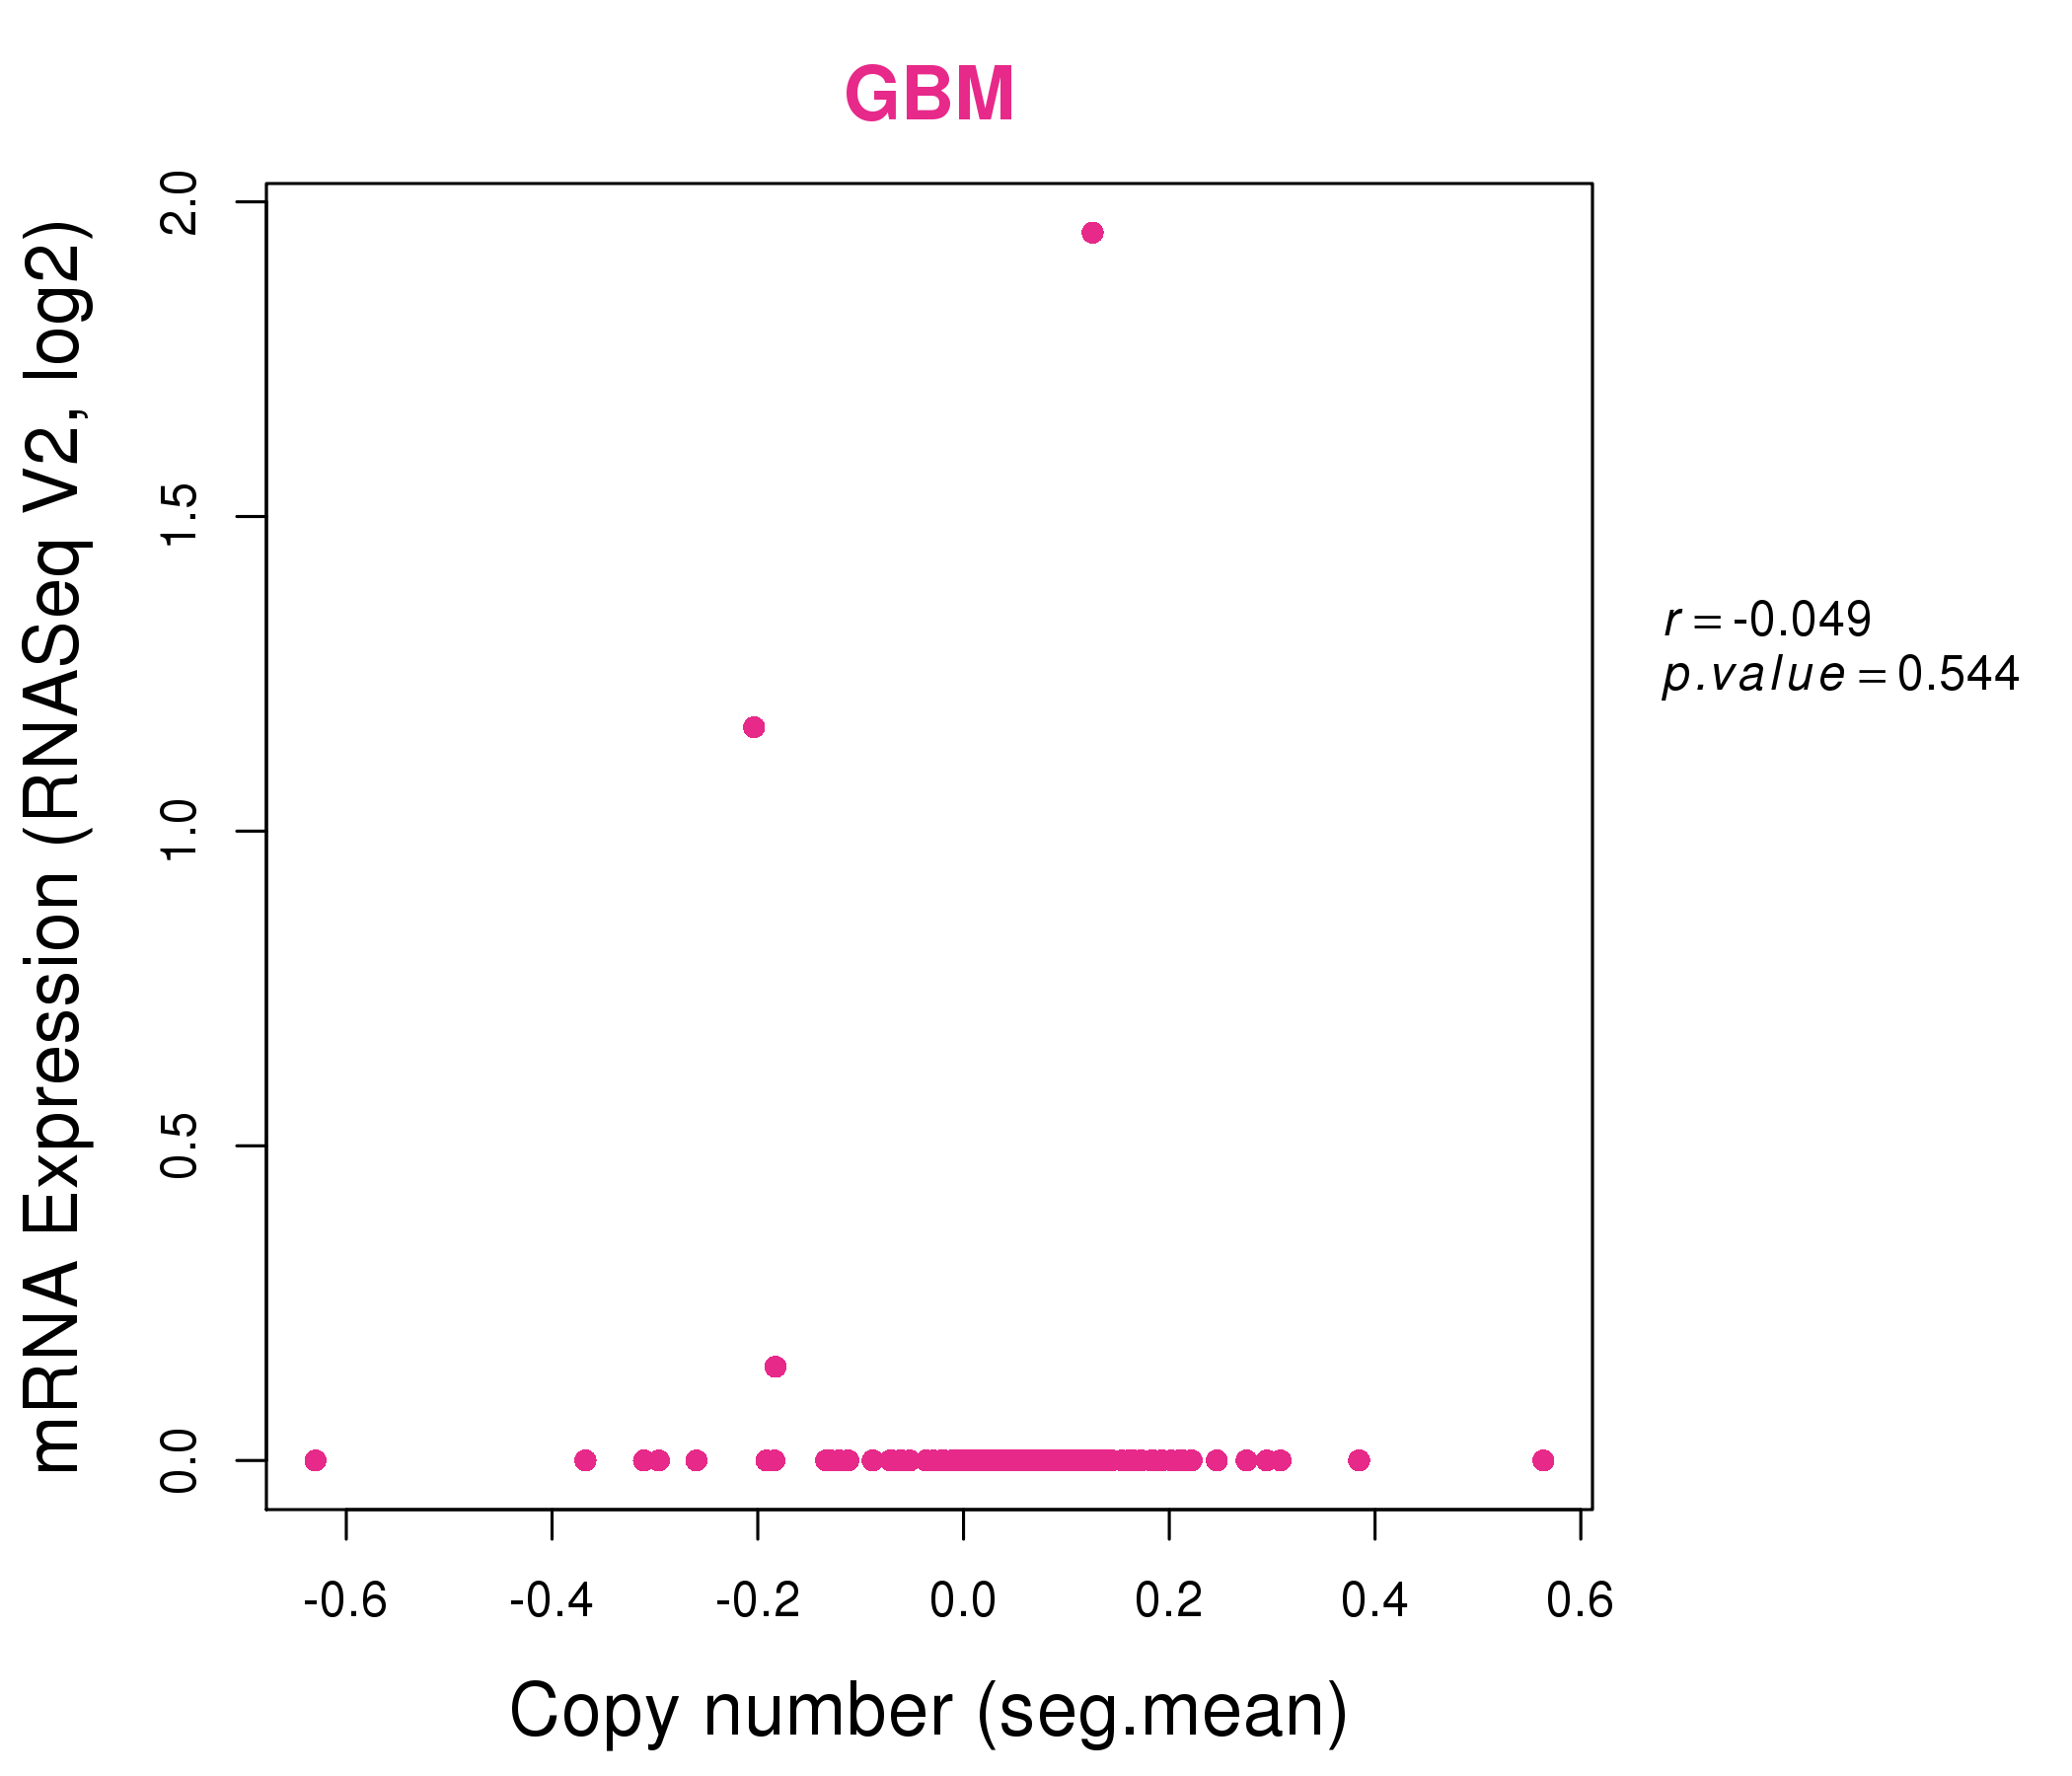
| * Normalized gene expression data of RNASeqV2 was extracted from TCGA using R package TCGA-Assembler. The URLs of all public data files on TCGA DCC data server were gathered at Jan-05-2015. Only eight cancer types have enough normal control samples for differential expression analysis. (t test, adjusted p<0.05 (using Benjamini-Hochberg FDR)) |
 |
| Top |
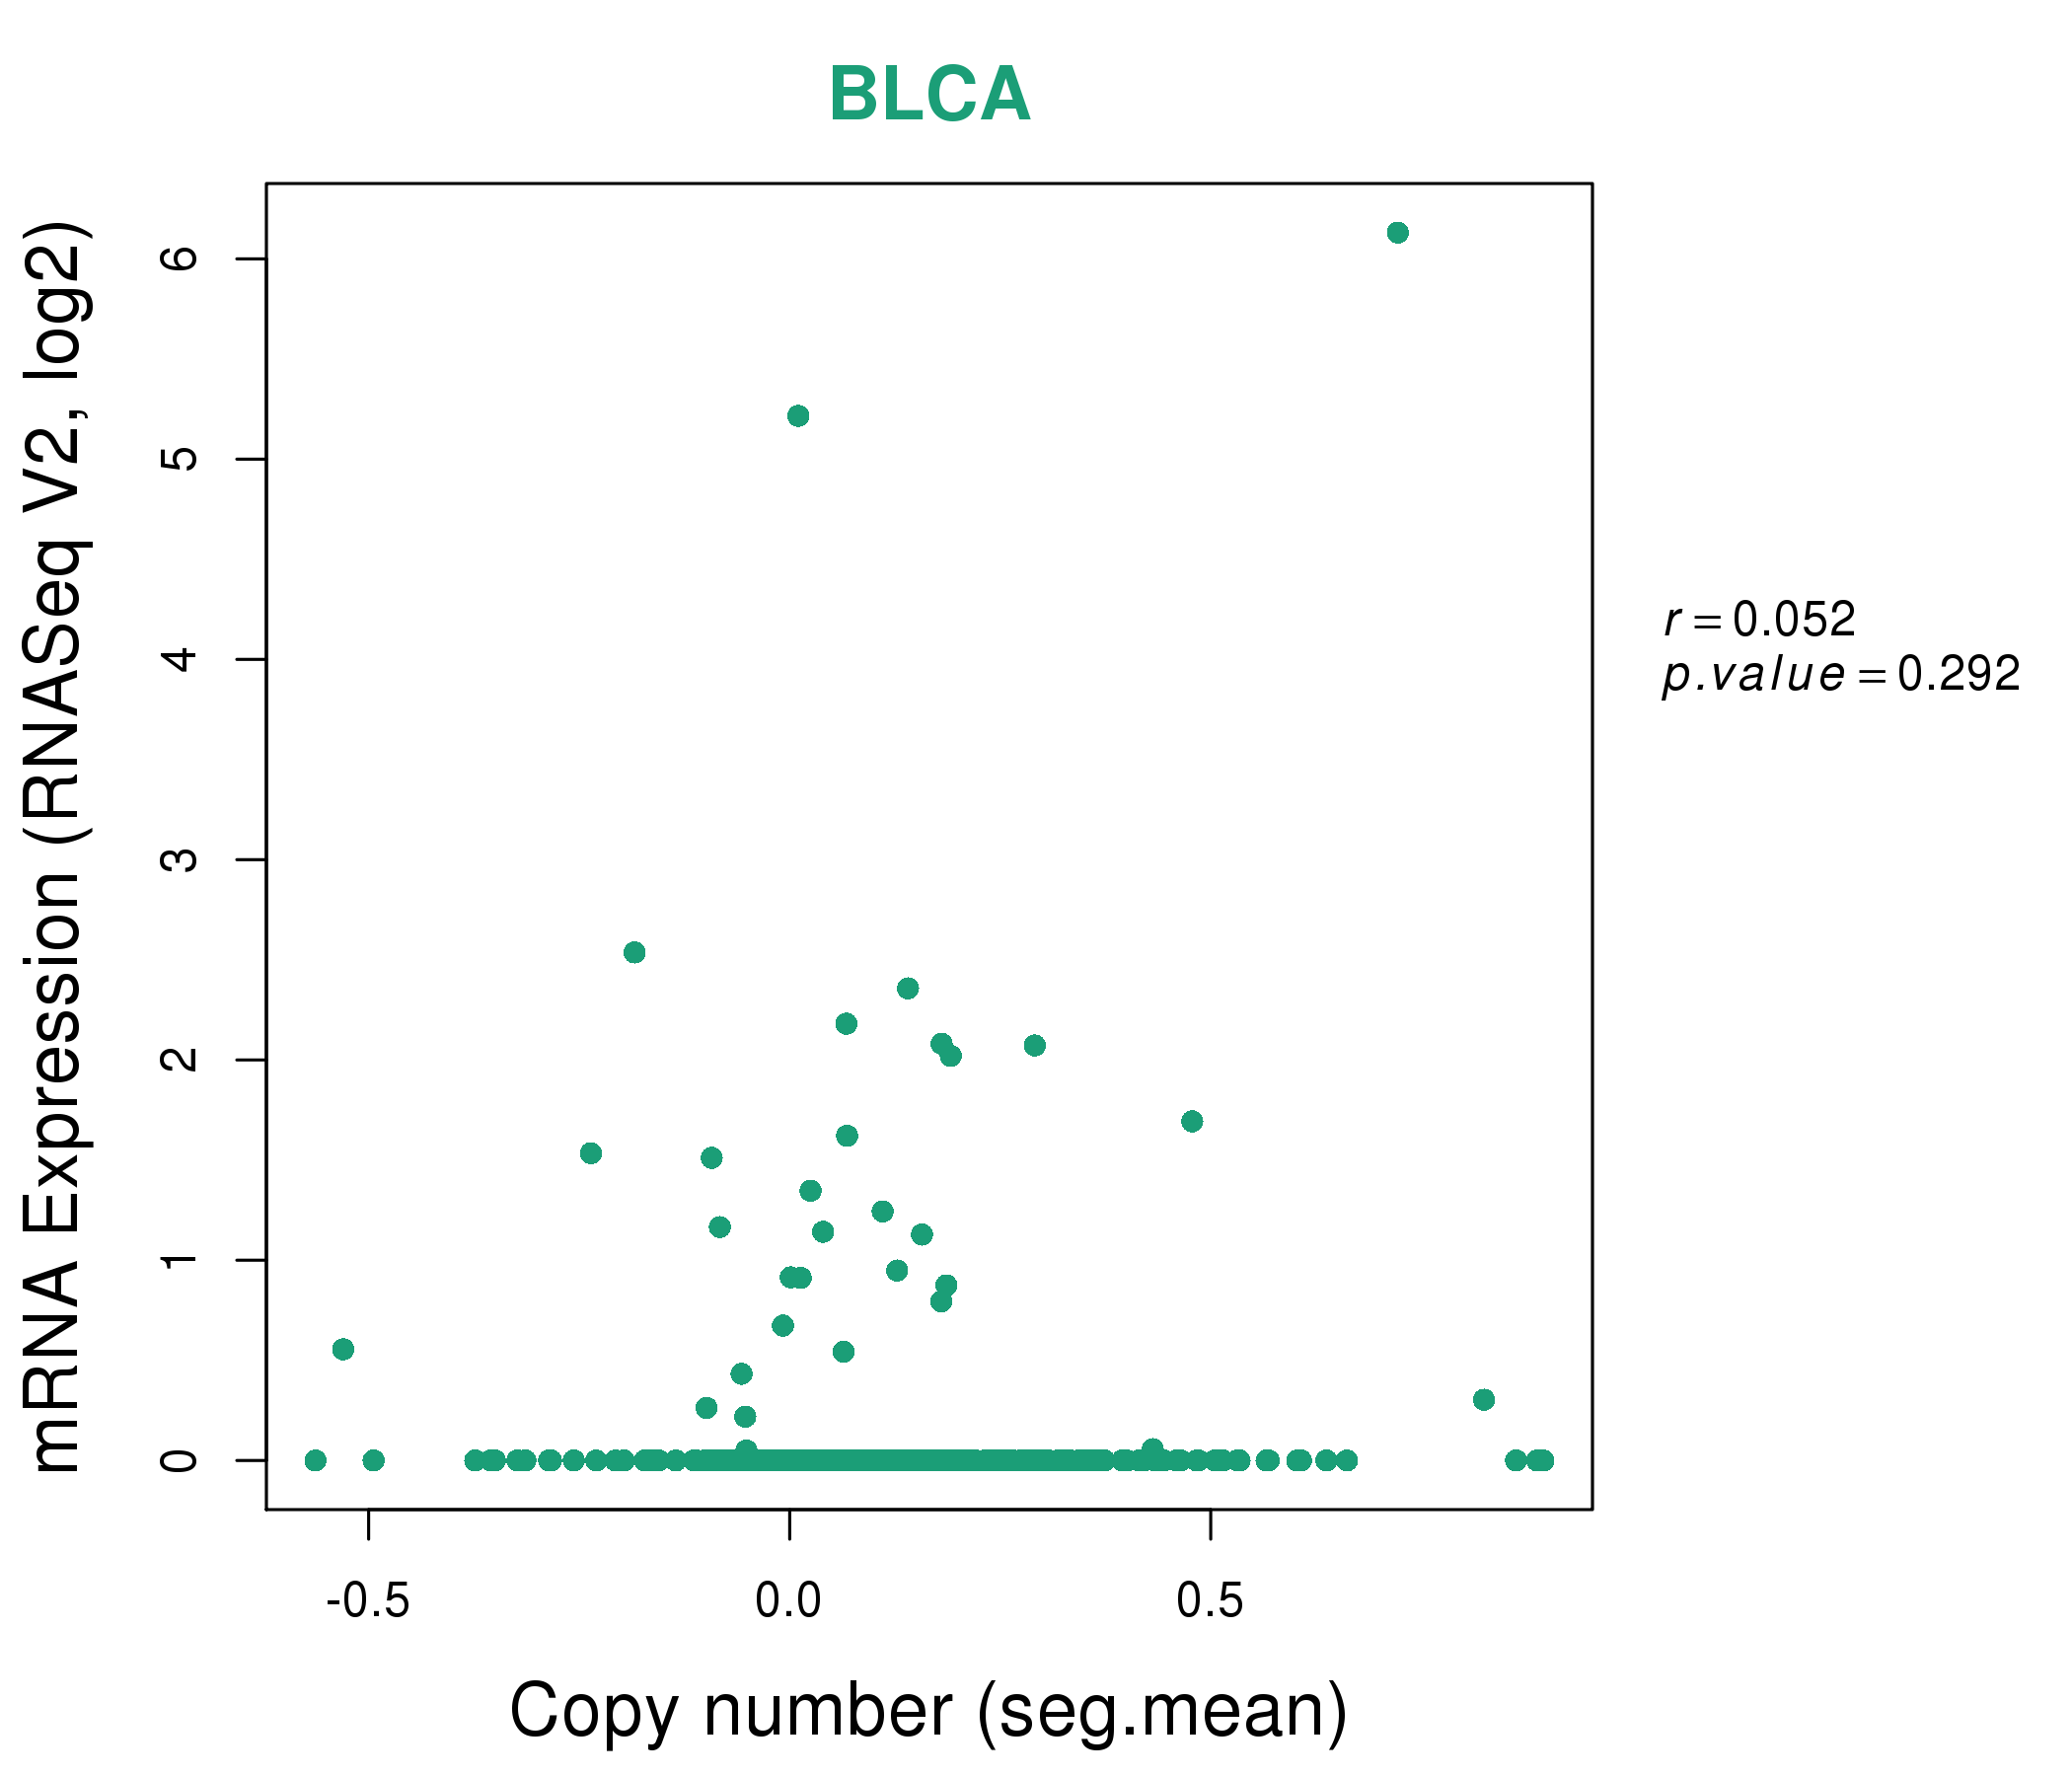
| * This plots show the correlation between CNV and gene expression. |
: Open all plots for all cancer types
 |
|
 |
|
| Top |
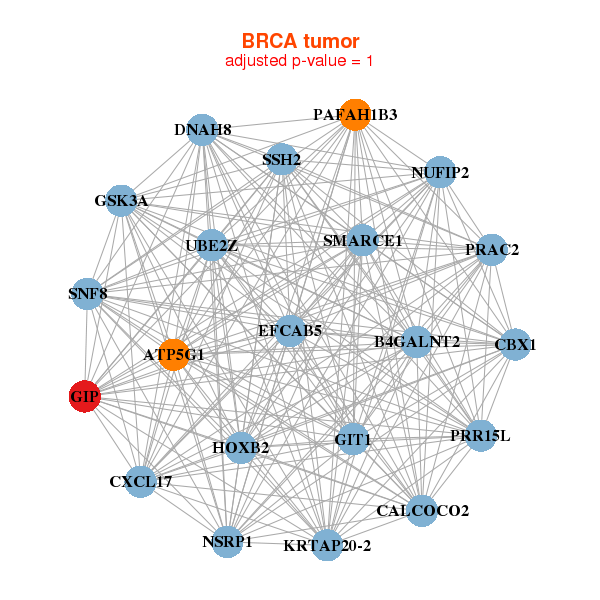
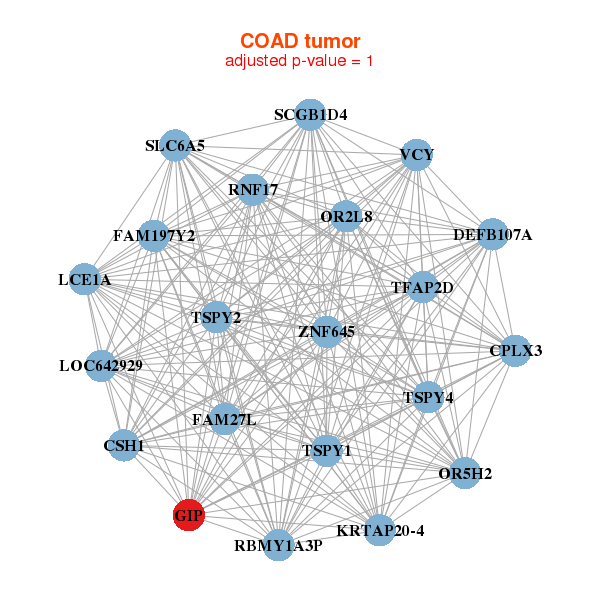
| Gene-Gene Network Information |
| * Co-Expression network figures were drawn using R package igraph. Only the top 20 genes with the highest correlations were shown. Red circle: input gene, orange circle: cell metabolism gene, sky circle: other gene |
: Open all plots for all cancer types
 |
| ||||
| ATP5G1,B4GALNT2,PRAC2,CALCOCO2,CBX1,NSRP1,CXCL17, DNAH8,EFCAB5,GIP,GIT1,GSK3A,HOXB2,KRTAP20-2, NUFIP2,PAFAH1B3,PRR15L,SMARCE1,SNF8,SSH2,UBE2Z | ACTL6B,CARTPT,CPLX2,EPYC,AMER3,FLJ36000,GIP, HMP19,IBSP,IFNA14,LCE2D,LOC650293,LOC729121,LOC732275, NEU2,OR8B2,OR8H3,PCSK1,SEZ6,SYT4,TRIM48 | ||||
 |
| ||||
| CPLX3,CSH1,DEFB107A,FAM197Y2,FAM27L,GIP,KRTAP20-4, LCE1A,LOC642929,OR2L8,OR5H2,RBMY1A3P,RNF17,SCGB1D4, SLC6A5,TFAP2D,TSPY1,TSPY2,TSPY4,VCY,ZNF645 | NA,NA,NA,NA,NA,NA,NA, NA,NA,NA,NA,NA,NA,NA, NA,NA,NA,NA,NA,NA,NA |
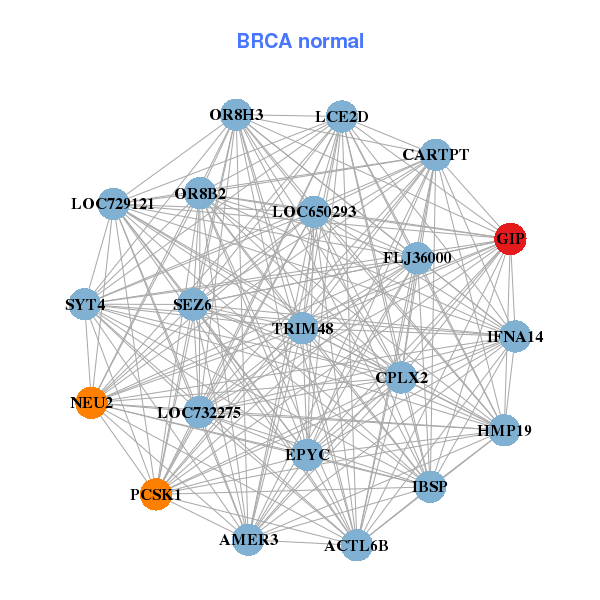
| * Co-Expression network figures were drawn using R package igraph. Only the top 20 genes with the highest correlations were shown. Red circle: input gene, orange circle: cell metabolism gene, sky circle: other gene |
: Open all plots for all cancer types
| Top |
: Open all interacting genes' information including KEGG pathway for all interacting genes from DAVID
| Top |
| Pharmacological Information for GIP |
| DB Category | DB Name | DB's ID and Url link |
| * Gene Centered Interaction Network. |
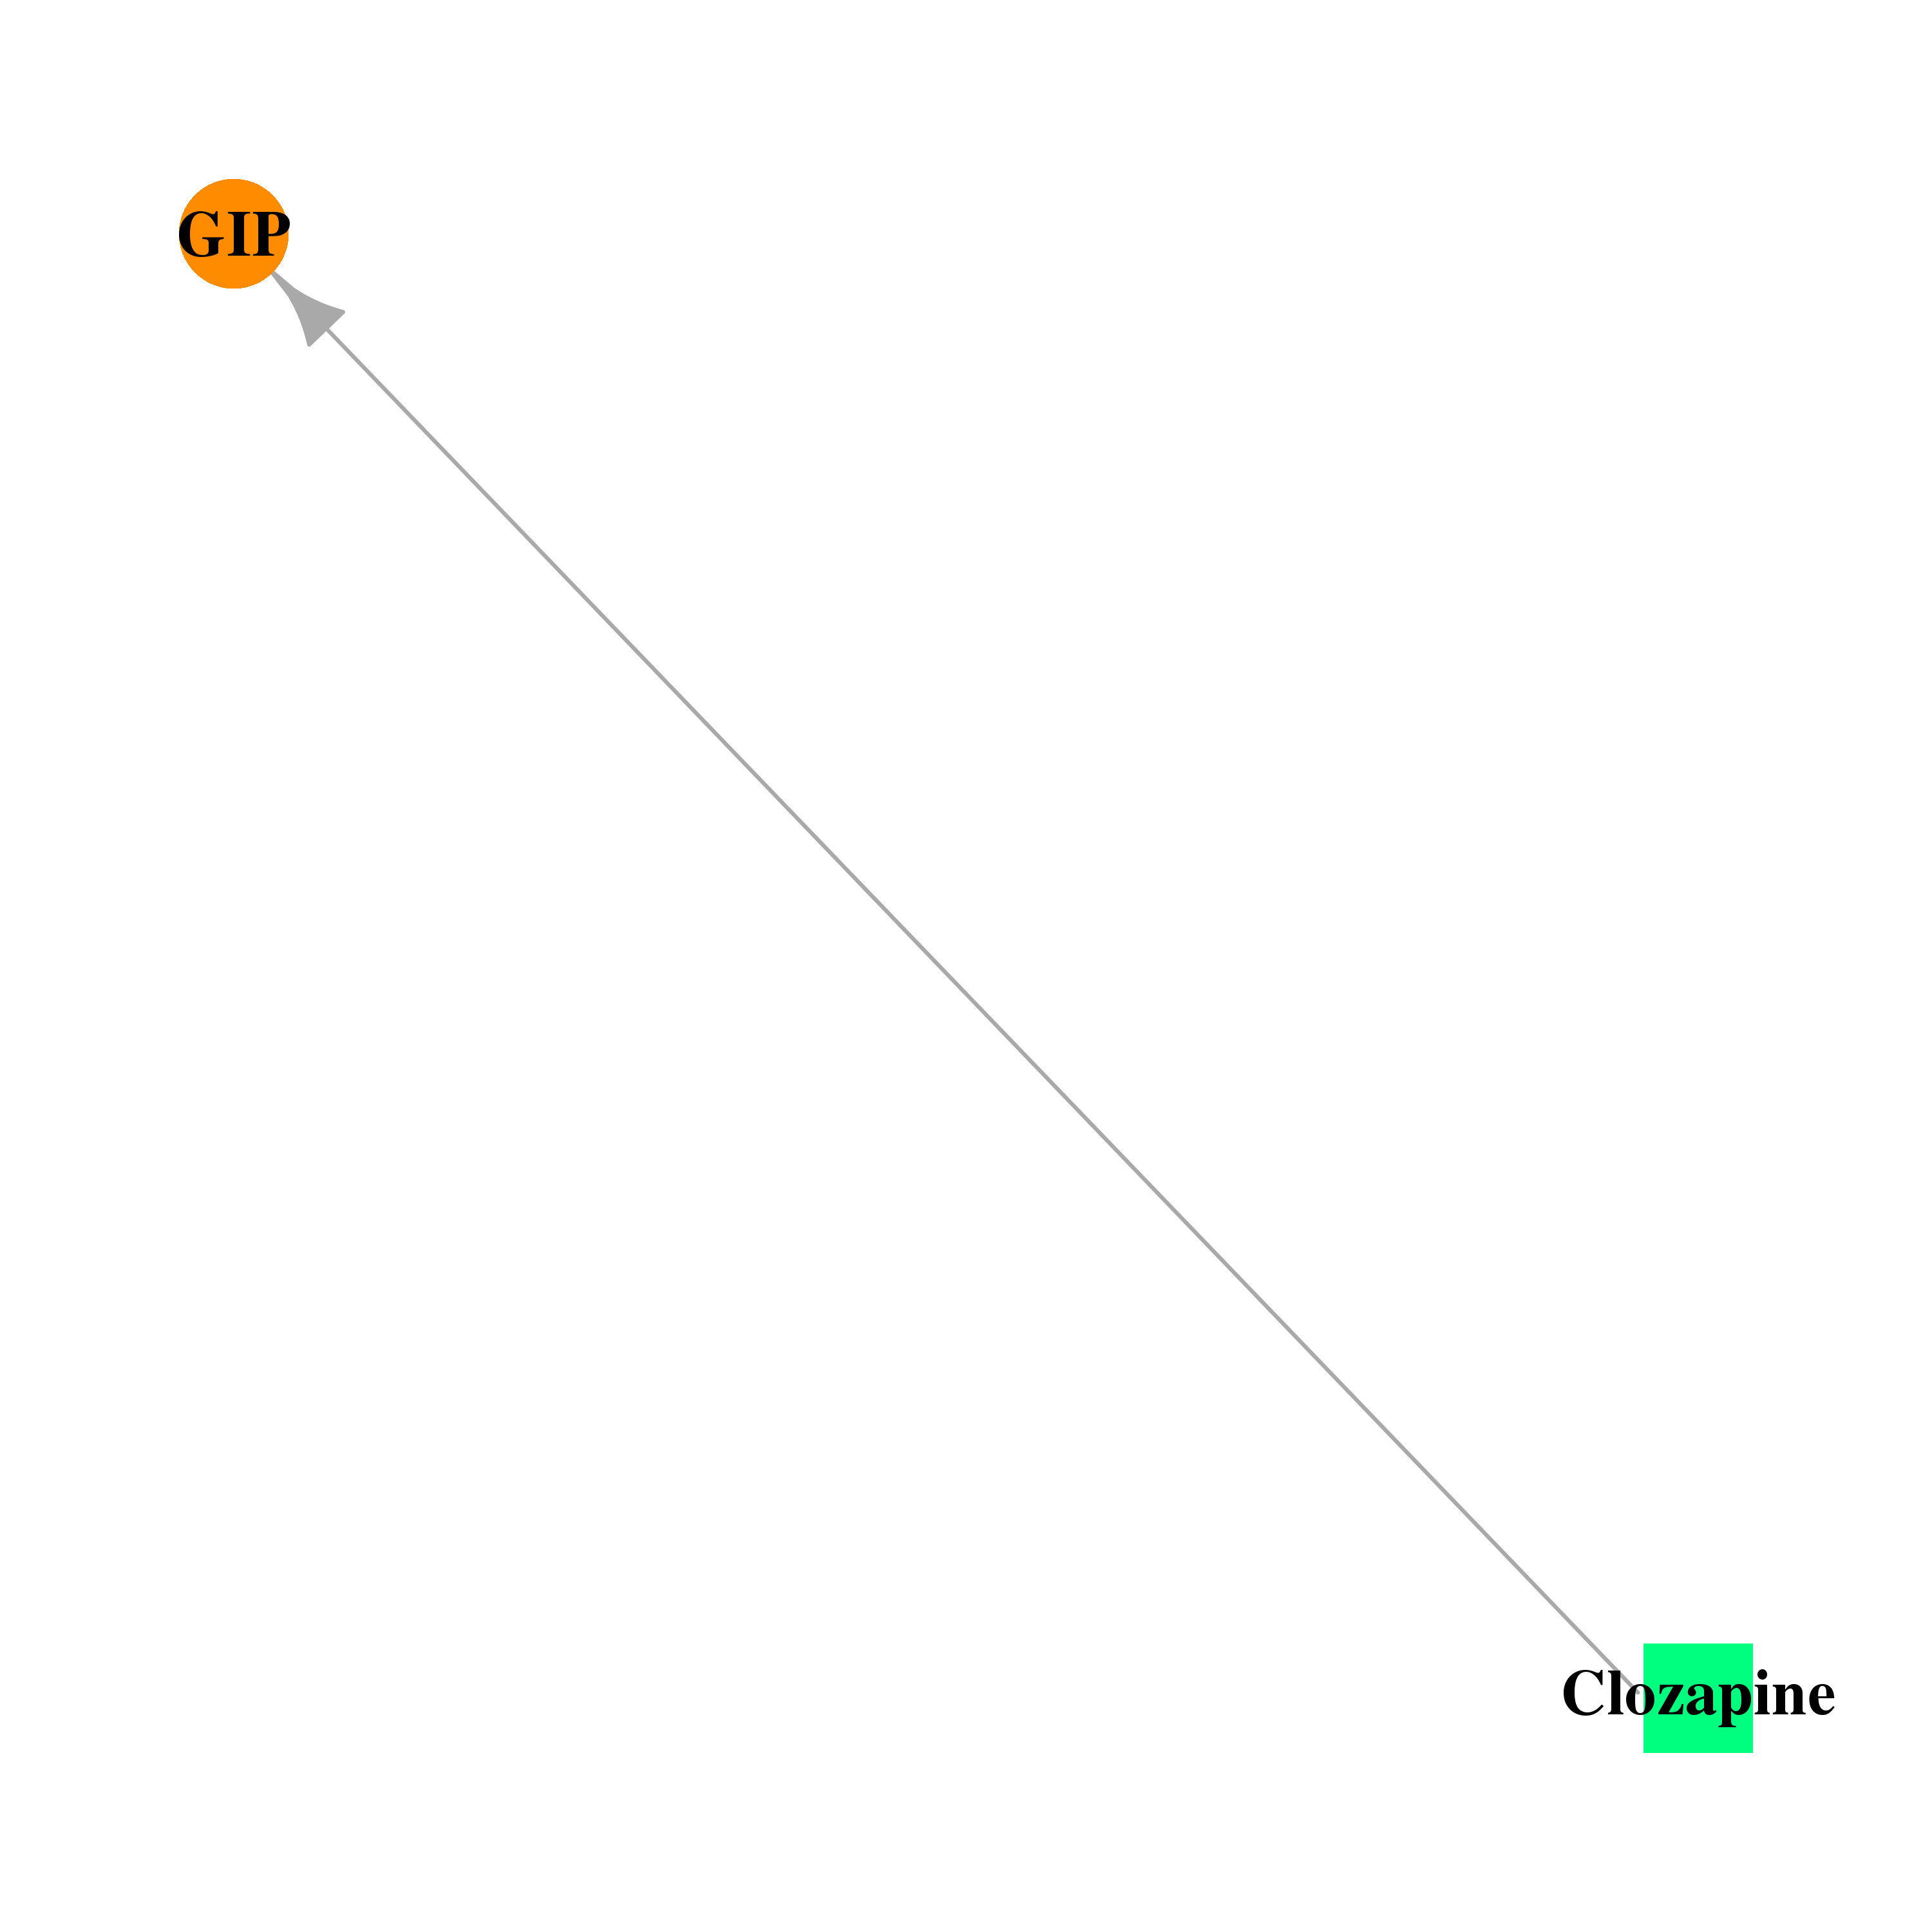 |
| * Drug Centered Interaction Network. |
| DrugBank ID | Target Name | Drug Groups | Generic Name | Drug Centered Network | Drug Structure |
| DB00363 | gastric inhibitory polypeptide | approved | Clozapine | 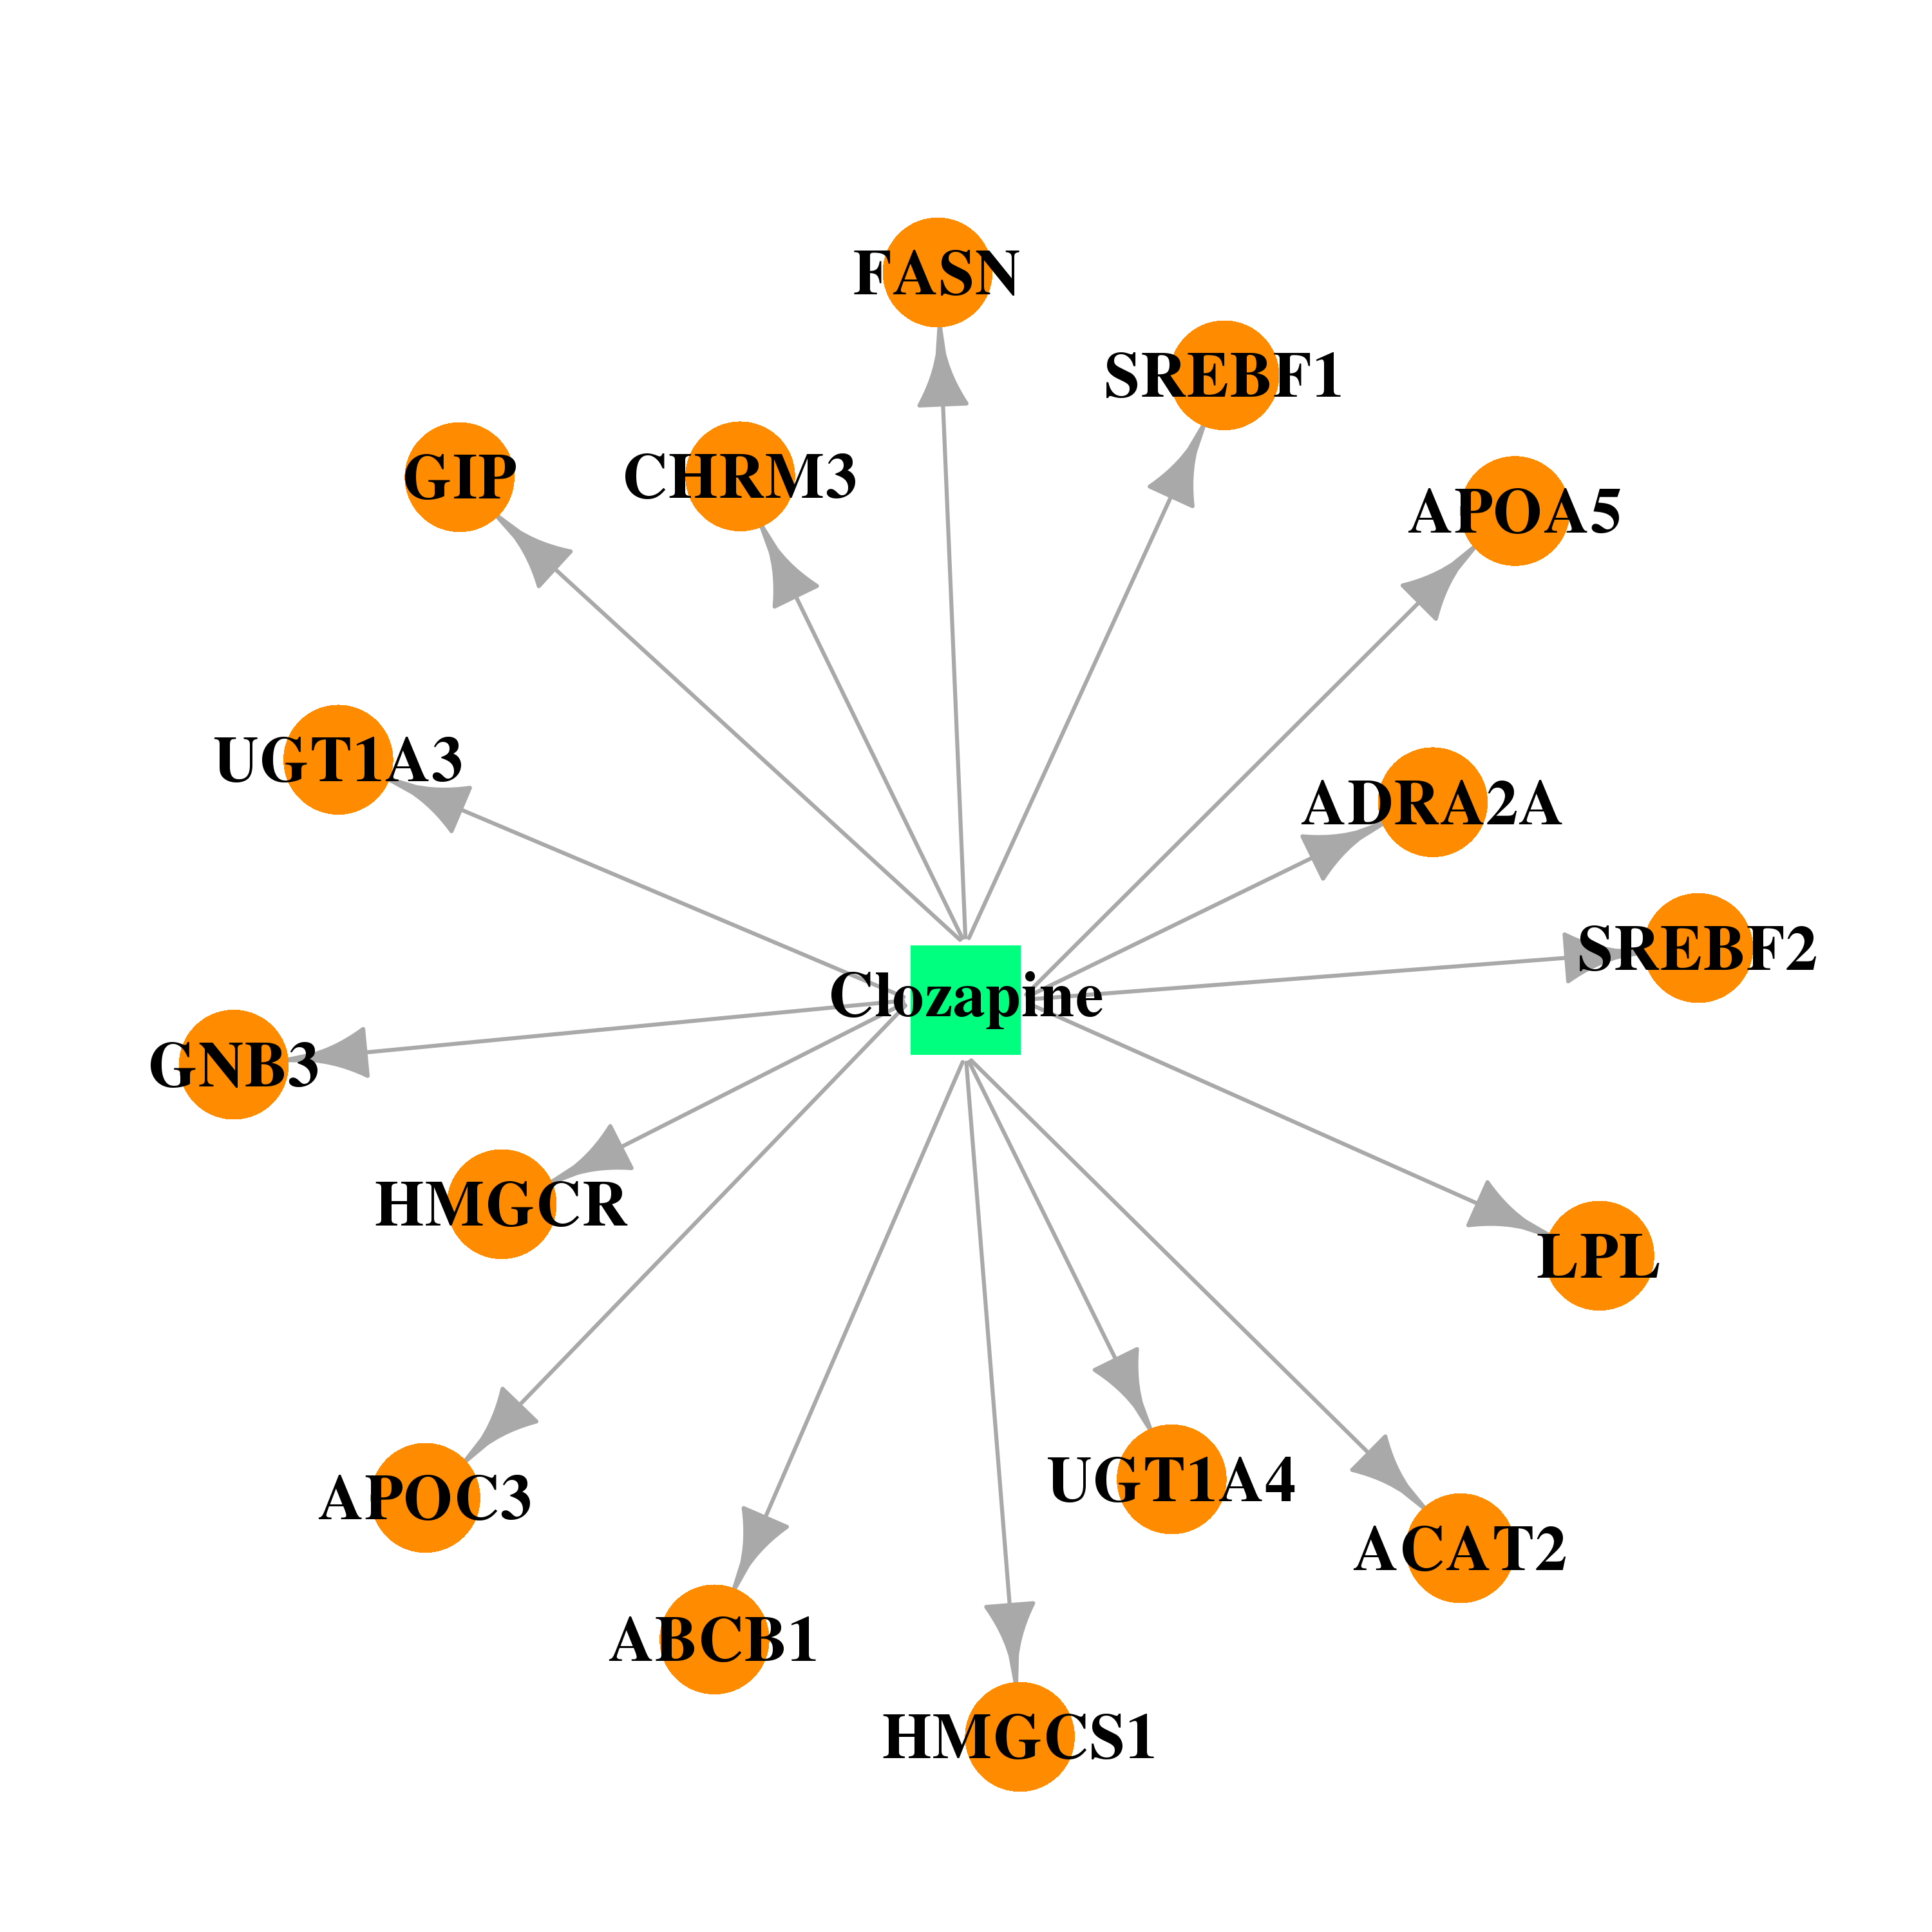 | 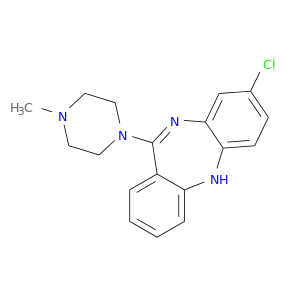 |
| Top |
| Cross referenced IDs for GIP |
| * We obtained these cross-references from Uniprot database. It covers 150 different DBs, 18 categories. http://www.uniprot.org/help/cross_references_section |
: Open all cross reference information
|
Copyright © 2016-Present - The Univsersity of Texas Health Science Center at Houston @ |