|
|||||||||||||||||||||||||||||||||||||||||||||||||||||||||||||||||||||||||||||||||||||||||||||||||||||||||||||||||||||||||||||||||||||||||||||||||||||||||||||||||||||||||||||||||||||||||||||||||||||||||||||||||||||||||||||||||||||||||||||||||||||||||||||||||||||||||||||||||||||||||||||||||||||||||||||||||||||||||||||||||||||||||||||||||||
| |
| Phenotypic Information (metabolism pathway, cancer, disease, phenome) |
| |
| |
| Gene-Gene Network Information: Co-Expression Network, Interacting Genes & KEGG |
| |
|


| Gene Summary for TPK1 |
| Top |
| Phenotypic Information for TPK1(metabolism pathway, cancer, disease, phenome) |
| Cancer | CGAP: TPK1 |
| Familial Cancer Database: TPK1 | |
| * This gene is included in those cancer gene databases. |
|
|
|
|
|
| . | |||||||||||||||||||||||||||||||||||||||||||||||||||||||||||||||||||||||||||||||||||||||||||||||||||||||||||||||||||||||||||||||||||||||||||||||||||||||||||||||||||||||||||||||||||||||||||||||||||||||||||||||||||||||||||||||||||||||||||||||||||||||||||||||||||||||||||||||||||||||||||||||||||||||||||||||||||||||||||||||||||||||||||||
Oncogene 1 | Significant driver gene in | ||||||||||||||||||||||||||||||||||||||||||||||||||||||||||||||||||||||||||||||||||||||||||||||||||||||||||||||||||||||||||||||||||||||||||||||||||||||||||||||||||||||||||||||||||||||||||||||||||||||||||||||||||||||||||||||||||||||||||||||||||||||||||||||||||||||||||||||||||||||||||||||||||||||||||||||||||||||||||||||||||||||||||||||||||
| cf) number; DB name 1 Oncogene; http://nar.oxfordjournals.org/content/35/suppl_1/D721.long, 2 Tumor Suppressor gene; https://bioinfo.uth.edu/TSGene/, 3 Cancer Gene Census; http://www.nature.com/nrc/journal/v4/n3/abs/nrc1299.html, 4 CancerGenes; http://nar.oxfordjournals.org/content/35/suppl_1/D721.long, 5 Network of Cancer Gene; http://ncg.kcl.ac.uk/index.php, 1Therapeutic Vulnerabilities in Cancer; http://cbio.mskcc.org/cancergenomics/statius/ |
| REACTOME_METABOLISM_OF_VITAMINS_AND_COFACTORS | |
| OMIM | |
| Orphanet | |
| Disease | KEGG Disease: TPK1 |
| MedGen: TPK1 (Human Medical Genetics with Condition) | |
| ClinVar: TPK1 | |
| Phenotype | MGI: TPK1 (International Mouse Phenotyping Consortium) |
| PhenomicDB: TPK1 | |
| Mutations for TPK1 |
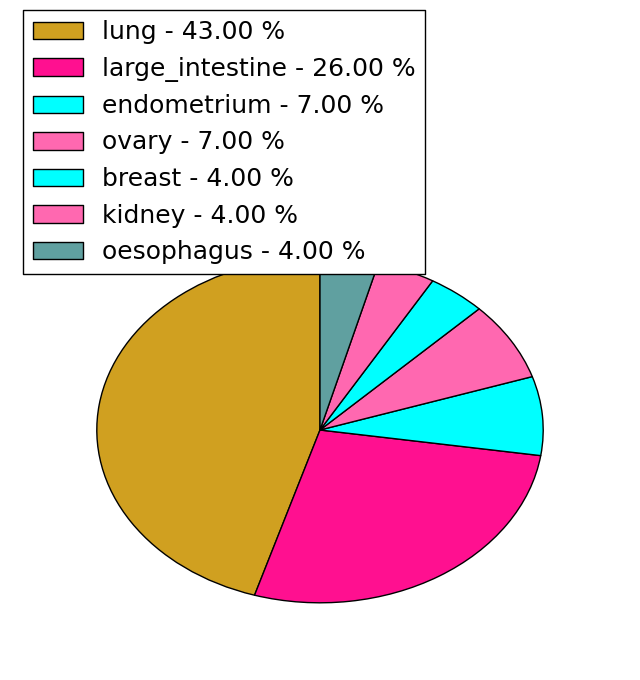
| * Under tables are showing count per each tissue to give us broad intuition about tissue specific mutation patterns.You can go to the detailed page for each mutation database's web site. |
| - Statistics for Tissue and Mutation type | Top |
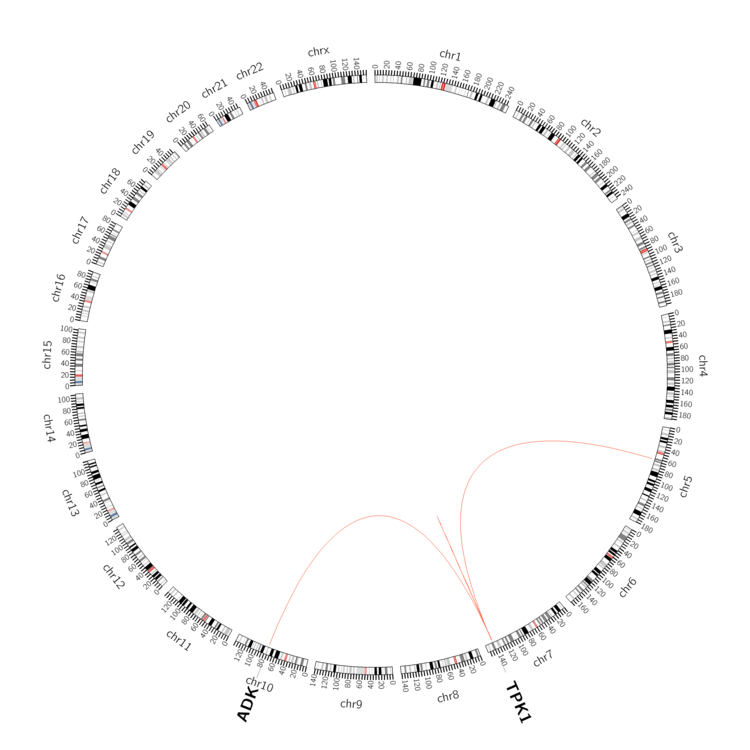 |
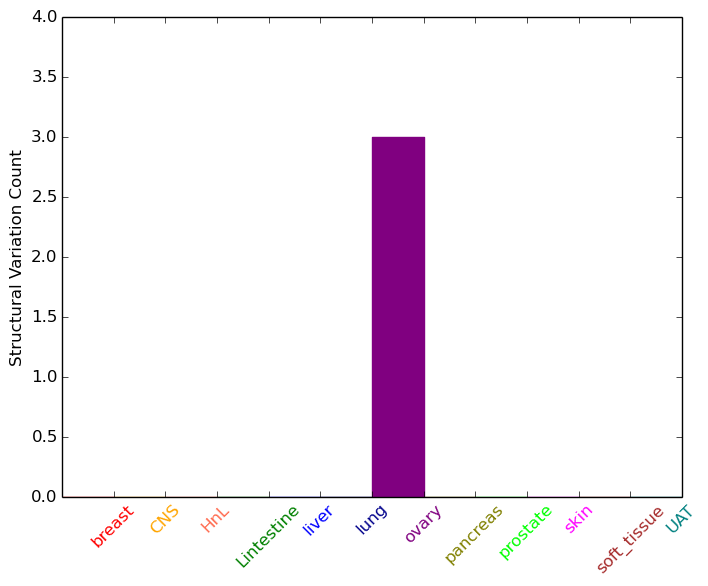
| - For Inter-chromosomal Variations |
| * Inter-chromosomal variantions includes 'interchromosomal amplicon to amplicon', 'interchromosomal amplicon to non-amplified dna', 'interchromosomal insertion', 'Interchromosomal unknown type'. |
 |
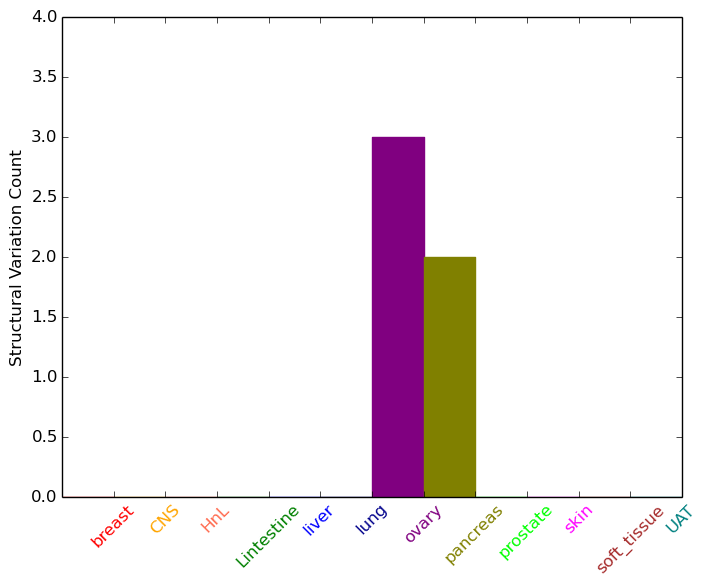
| - For Intra-chromosomal Variations |
| * Intra-chromosomal variantions includes 'intrachromosomal amplicon to amplicon', 'intrachromosomal amplicon to non-amplified dna', 'intrachromosomal deletion', 'intrachromosomal fold-back inversion', 'intrachromosomal inversion', 'intrachromosomal tandem duplication', 'Intrachromosomal unknown type', 'intrachromosomal with inverted orientation', 'intrachromosomal with non-inverted orientation'. |
 |
| Sample | Symbol_a | Chr_a | Start_a | End_a | Symbol_b | Chr_b | Start_b | End_b |
| ovary | TPK1 | chr7 | 144164181 | 144164201 | TPK1 | chr7 | 144226274 | 144226294 |
| ovary | TPK1 | chr7 | 144474466 | 144474486 | chr23 | 137691123 | 137691143 | |
| ovary | TPK1 | chr7 | 144477427 | 144477447 | ADK | chr10 | 76250714 | 76250734 |
| ovary | TPK1 | chr7 | 144483786 | 144483806 | chr7 | 144549781 | 144549801 | |
| pancreas | TPK1 | chr7 | 144491885 | 144491905 | TPK1 | chr7 | 144493829 | 144493849 |
| pancreas | TPK1 | chr7 | 144497186 | 144497206 | TPK1 | chr7 | 144499920 | 144499940 |
| cf) Tissue number; Tissue name (1;Breast, 2;Central_nervous_system, 3;Haematopoietic_and_lymphoid_tissue, 4;Large_intestine, 5;Liver, 6;Lung, 7;Ovary, 8;Pancreas, 9;Prostate, 10;Skin, 11;Soft_tissue, 12;Upper_aerodigestive_tract) |
| * From mRNA Sanger sequences, Chitars2.0 arranged chimeric transcripts. This table shows TPK1 related fusion information. |
| ID | Head Gene | Tail Gene | Accession | Gene_a | qStart_a | qEnd_a | Chromosome_a | tStart_a | tEnd_a | Gene_a | qStart_a | qEnd_a | Chromosome_a | tStart_a | tEnd_a |
| BM459600 | TPK1 | 5 | 112 | 7 | 144343977 | 144344086 | CYCS | 104 | 193 | 7 | 25162453 | 25162542 | |
| EC547646 | ZCCHC17 | 18 | 76 | 1 | 31819530 | 31819588 | TPK1 | 77 | 108 | 7 | 144271457 | 144271962 | |
| Top |
| Mutation type/ Tissue ID | brca | cns | cerv | endome | haematopo | kidn | Lintest | liver | lung | ns | ovary | pancre | prost | skin | stoma | thyro | urina | |||
| Total # sample | 1 | 1 | 1 | 2 | 2 | 4 | ||||||||||||||
| GAIN (# sample) | 1 | 1 | 2 | 2 | 4 | |||||||||||||||
| LOSS (# sample) | 1 |
| cf) Tissue ID; Tissue type (1; Breast, 2; Central_nervous_system, 3; Cervix, 4; Endometrium, 5; Haematopoietic_and_lymphoid_tissue, 6; Kidney, 7; Large_intestine, 8; Liver, 9; Lung, 10; NS, 11; Ovary, 12; Pancreas, 13; Prostate, 14; Skin, 15; Stomach, 16; Thyroid, 17; Urinary_tract) |
| Top |
|
 |
| Top |
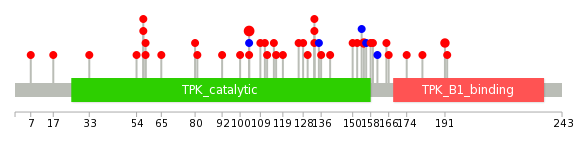
| Stat. for Non-Synonymous SNVs (# total SNVs=41) | (# total SNVs=4) |
 |  |
(# total SNVs=0) | (# total SNVs=0) |
| Top |
| * When you move the cursor on each content, you can see more deailed mutation information on the Tooltip. Those are primary_site,primary_histology,mutation(aa),pubmedID. |
| GRCh37 position | Mutation(aa) | Unique sampleID count |
| chr7:144320303-144320303 | p.C104R | 4 |
| chr7:144288554-144288554 | p.I155V | 2 |
| chr7:144150652-144150652 | p.A240T | 2 |
| chr7:144380014-144380014 | p.G58E | 2 |
| chr7:144288563-144288563 | p.P152T | 2 |
| chr7:144380018-144380018 | p.E57K | 2 |
| chr7:144380045-144380045 | p.G48C | 2 |
| chr7:144288597-144288597 | p.N140K | 1 |
| chr7:144320302-144320302 | p.C104Y | 1 |
| chr7:144150726-144150726 | p.V215A | 1 |
| Top |
|
 |
| Point Mutation/ Tissue ID | 1 | 2 | 3 | 4 | 5 | 6 | 7 | 8 | 9 | 10 | 11 | 12 | 13 | 14 | 15 | 16 | 17 | 18 | 19 | 20 |
| # sample | 1 | 1 | 9 | 3 | 1 | 1 | 6 | 5 | 2 | 11 | 4 | 3 | ||||||||
| # mutation | 1 | 1 | 8 | 3 | 1 | 1 | 6 | 5 | 2 | 11 | 4 | 3 | ||||||||
| nonsynonymous SNV | 1 | 1 | 7 | 3 | 1 | 1 | 6 | 5 | 2 | 8 | 4 | 3 | ||||||||
| synonymous SNV | 1 | 3 |
| cf) Tissue ID; Tissue type (1; BLCA[Bladder Urothelial Carcinoma], 2; BRCA[Breast invasive carcinoma], 3; CESC[Cervical squamous cell carcinoma and endocervical adenocarcinoma], 4; COAD[Colon adenocarcinoma], 5; GBM[Glioblastoma multiforme], 6; Glioma Low Grade, 7; HNSC[Head and Neck squamous cell carcinoma], 8; KICH[Kidney Chromophobe], 9; KIRC[Kidney renal clear cell carcinoma], 10; KIRP[Kidney renal papillary cell carcinoma], 11; LAML[Acute Myeloid Leukemia], 12; LUAD[Lung adenocarcinoma], 13; LUSC[Lung squamous cell carcinoma], 14; OV[Ovarian serous cystadenocarcinoma ], 15; PAAD[Pancreatic adenocarcinoma], 16; PRAD[Prostate adenocarcinoma], 17; SKCM[Skin Cutaneous Melanoma], 18:STAD[Stomach adenocarcinoma], 19:THCA[Thyroid carcinoma], 20:UCEC[Uterine Corpus Endometrial Carcinoma]) |
| Top |
| * We represented just top 10 SNVs. When you move the cursor on each content, you can see more deailed mutation information on the Tooltip. Those are primary_site, primary_histology, mutation(aa), pubmedID. |
| Genomic Position | Mutation(aa) | Unique sampleID count |
| chr7:144320303 | p.C104R,TPK1 | 4 |
| chr7:144380018 | p.G58V,TPK1 | 2 |
| chr7:144288554 | p.D133N | 2 |
| chr7:144288620 | p.E57K,TPK1 | 2 |
| chr7:144150652 | p.A191T,TPK1 | 2 |
| chr7:144380014 | p.I155V | 2 |
| chr7:144320281 | p.V166A,TPK1 | 1 |
| chr7:144150751 | p.P150S | 1 |
| chr7:144288542 | p.D158N,TPK1 | 1 |
| chr7:144320288 | p.N154N,TPK1 | 1 |
| * Copy number data were extracted from TCGA using R package TCGA-Assembler. The URLs of all public data files on TCGA DCC data server were gathered on Jan-05-2015. Function ProcessCNAData in TCGA-Assembler package was used to obtain gene-level copy number value which is calculated as the average copy number of the genomic region of a gene. |
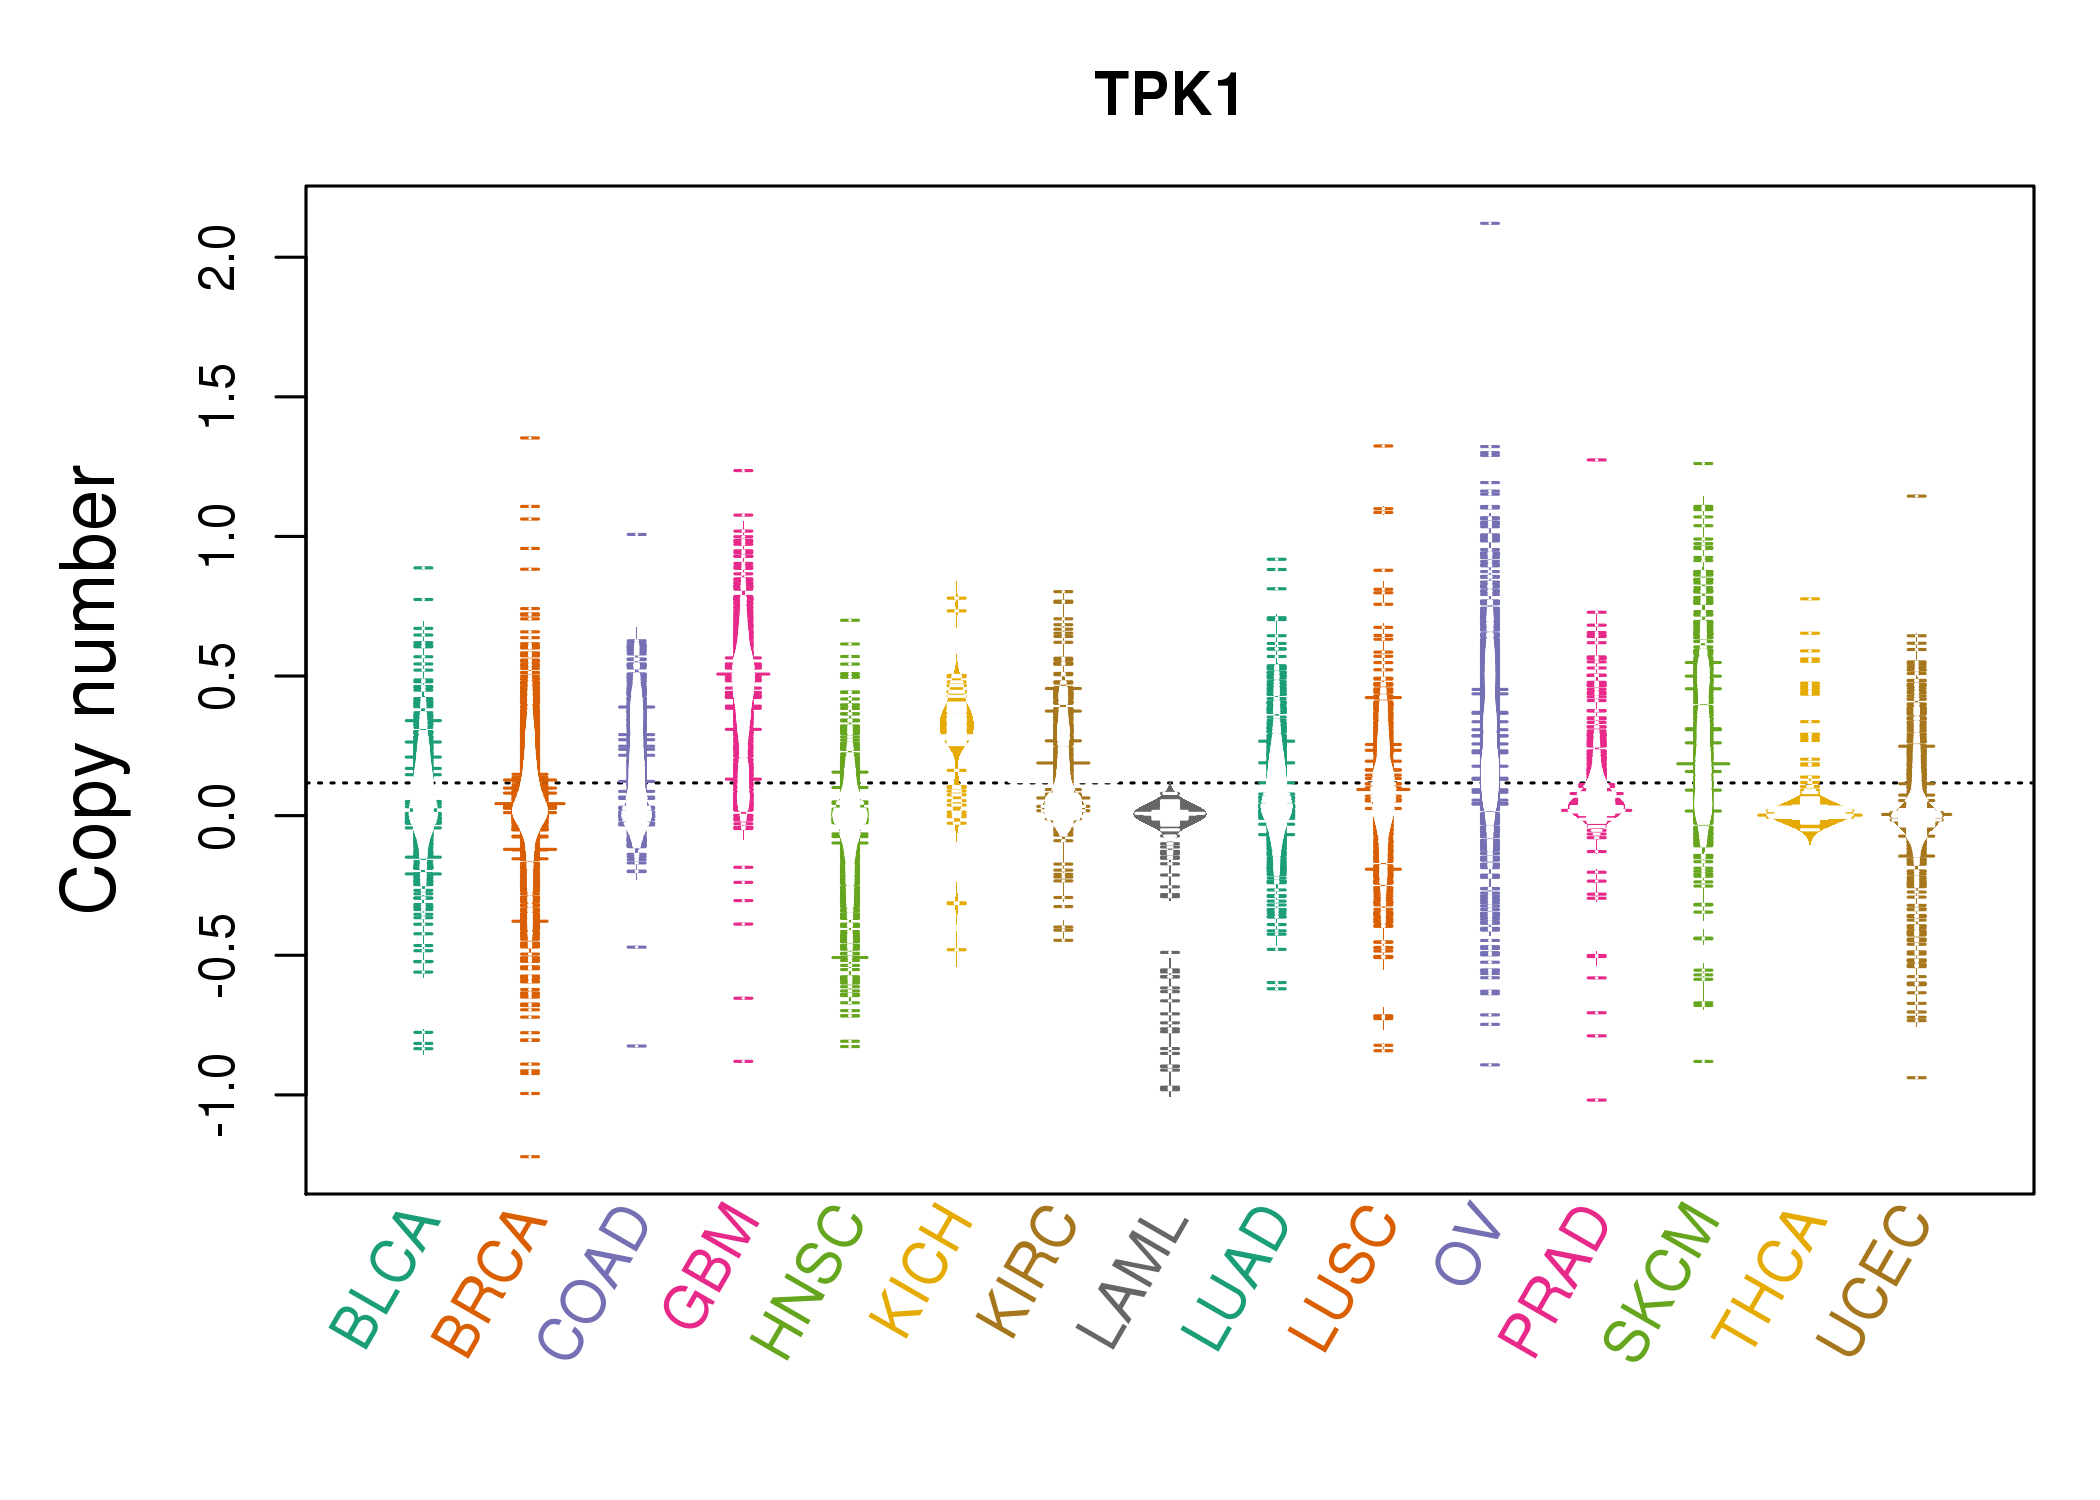 |
| cf) Tissue ID[Tissue type]: BLCA[Bladder Urothelial Carcinoma], BRCA[Breast invasive carcinoma], CESC[Cervical squamous cell carcinoma and endocervical adenocarcinoma], COAD[Colon adenocarcinoma], GBM[Glioblastoma multiforme], Glioma Low Grade, HNSC[Head and Neck squamous cell carcinoma], KICH[Kidney Chromophobe], KIRC[Kidney renal clear cell carcinoma], KIRP[Kidney renal papillary cell carcinoma], LAML[Acute Myeloid Leukemia], LUAD[Lung adenocarcinoma], LUSC[Lung squamous cell carcinoma], OV[Ovarian serous cystadenocarcinoma ], PAAD[Pancreatic adenocarcinoma], PRAD[Prostate adenocarcinoma], SKCM[Skin Cutaneous Melanoma], STAD[Stomach adenocarcinoma], THCA[Thyroid carcinoma], UCEC[Uterine Corpus Endometrial Carcinoma] |
| Top |
| Gene Expression for TPK1 |
| * CCLE gene expression data were extracted from CCLE_Expression_Entrez_2012-10-18.res: Gene-centric RMA-normalized mRNA expression data. |
 |
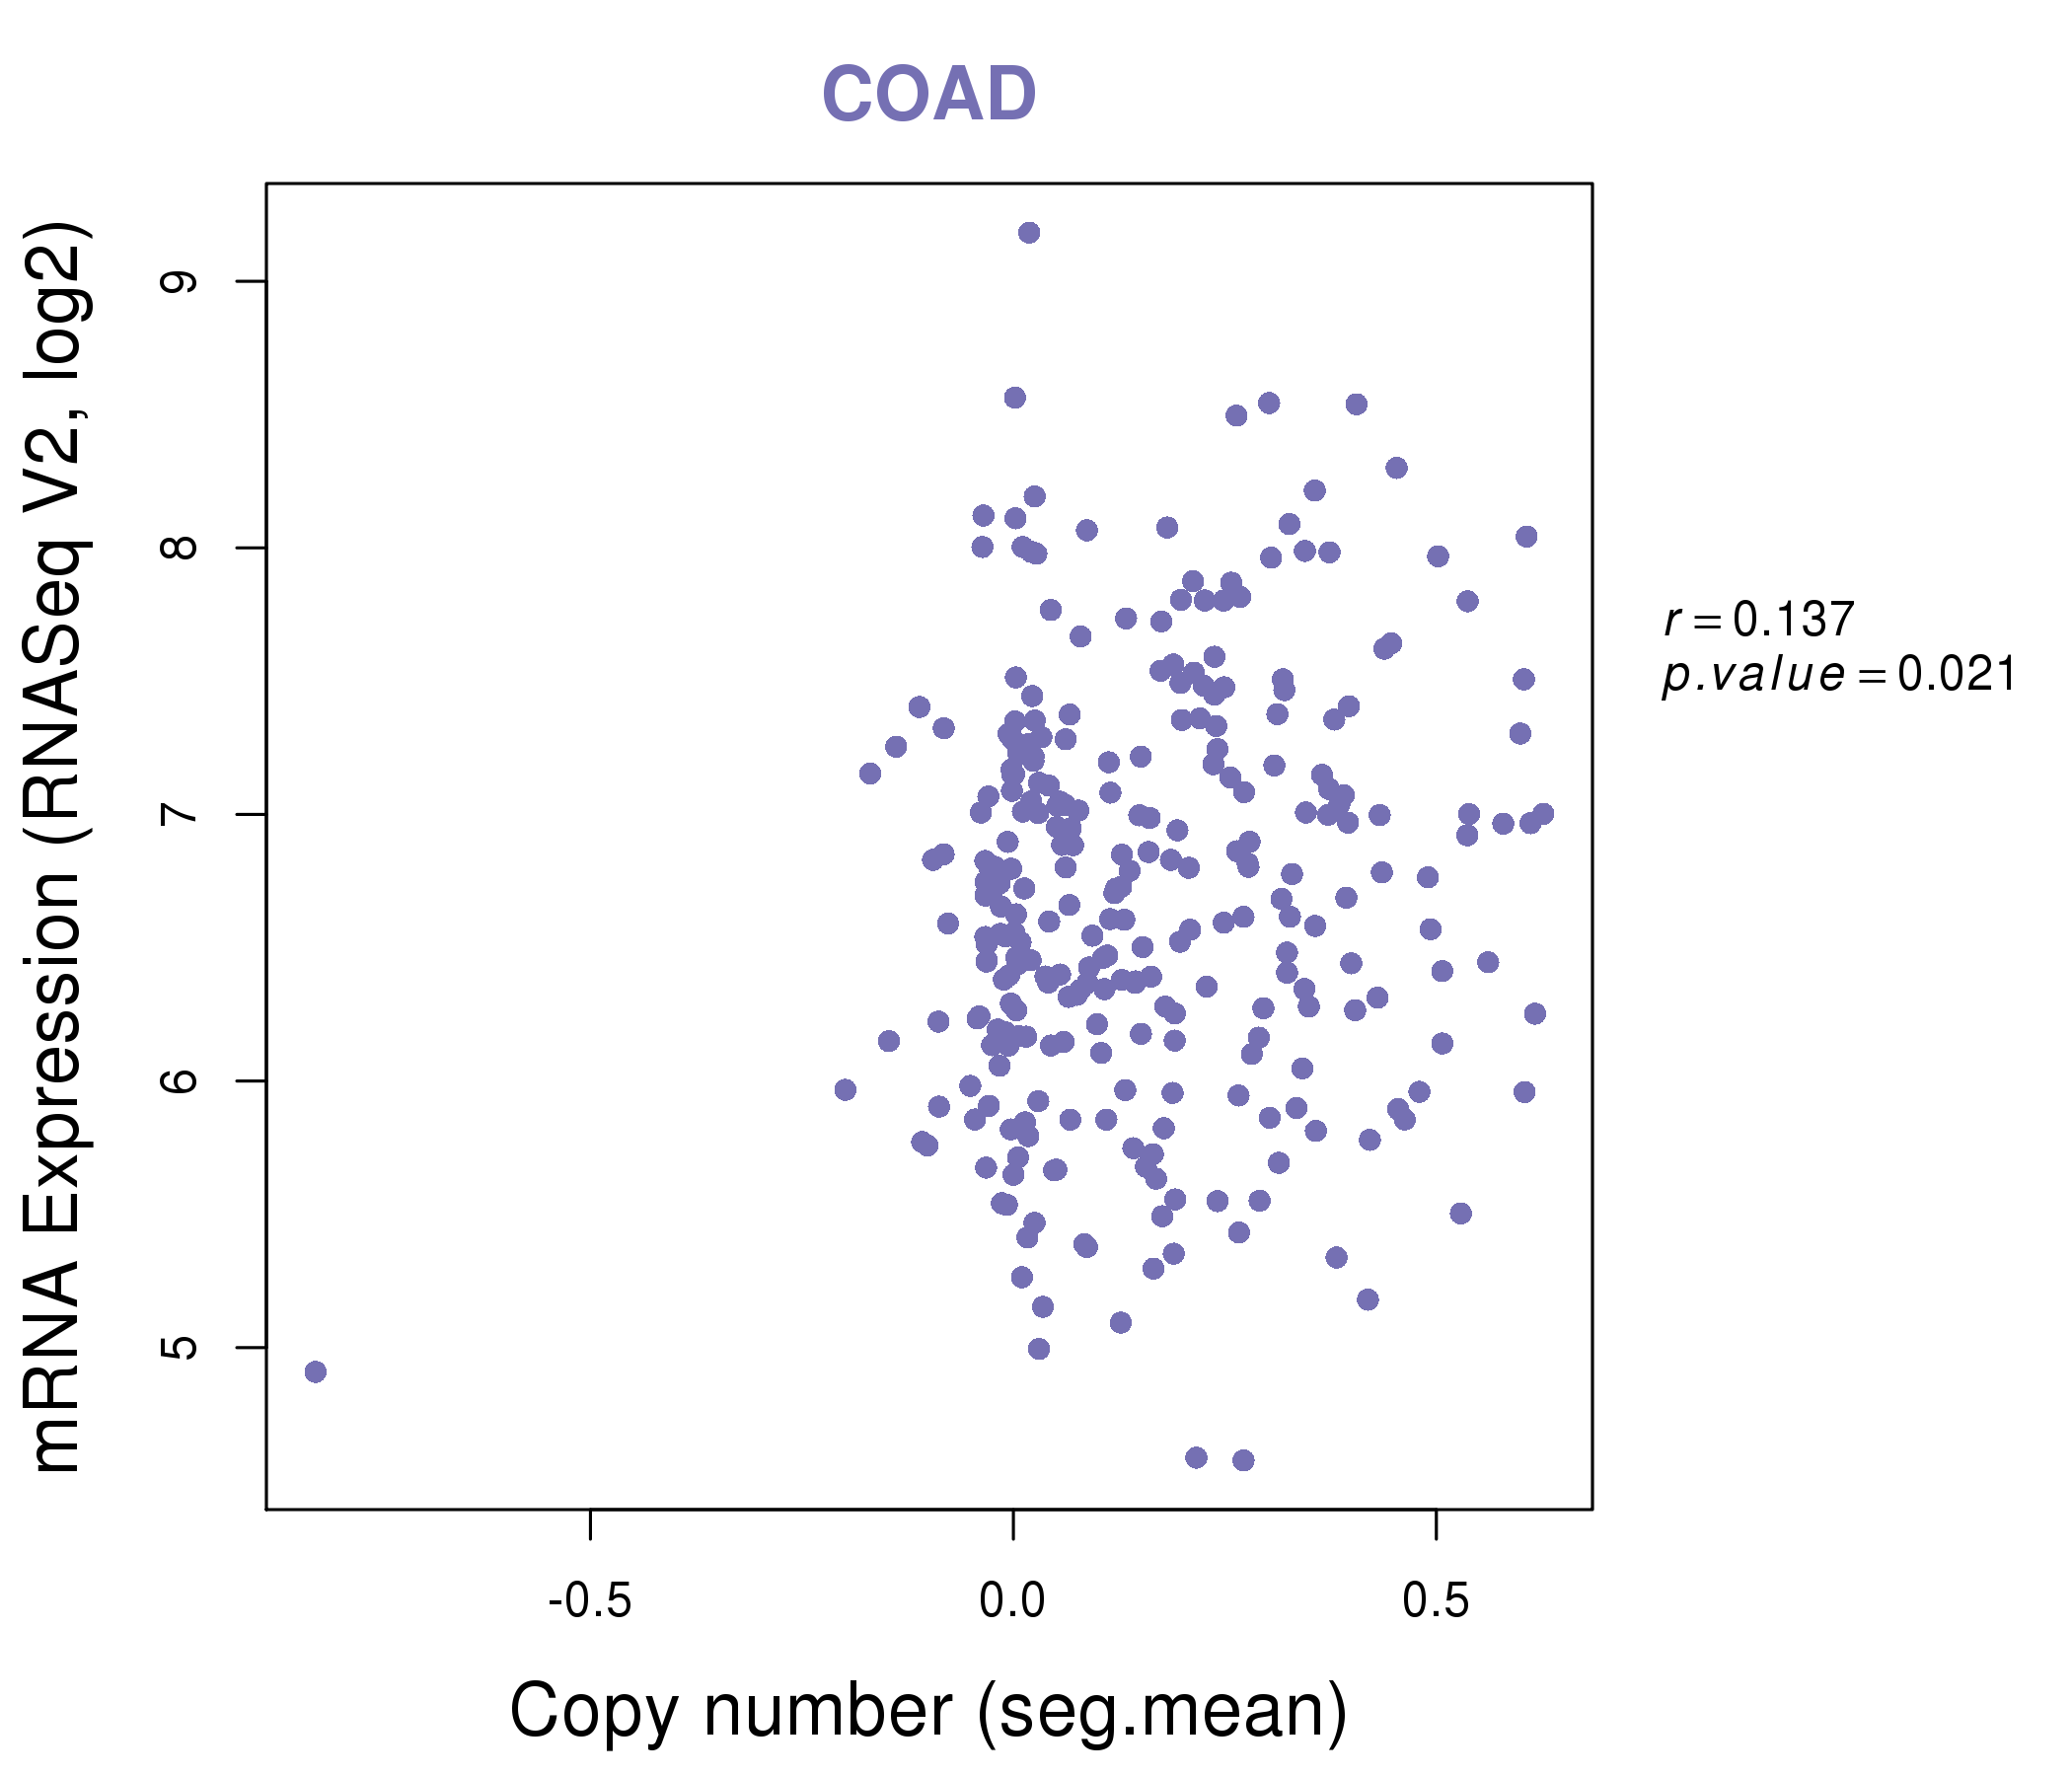
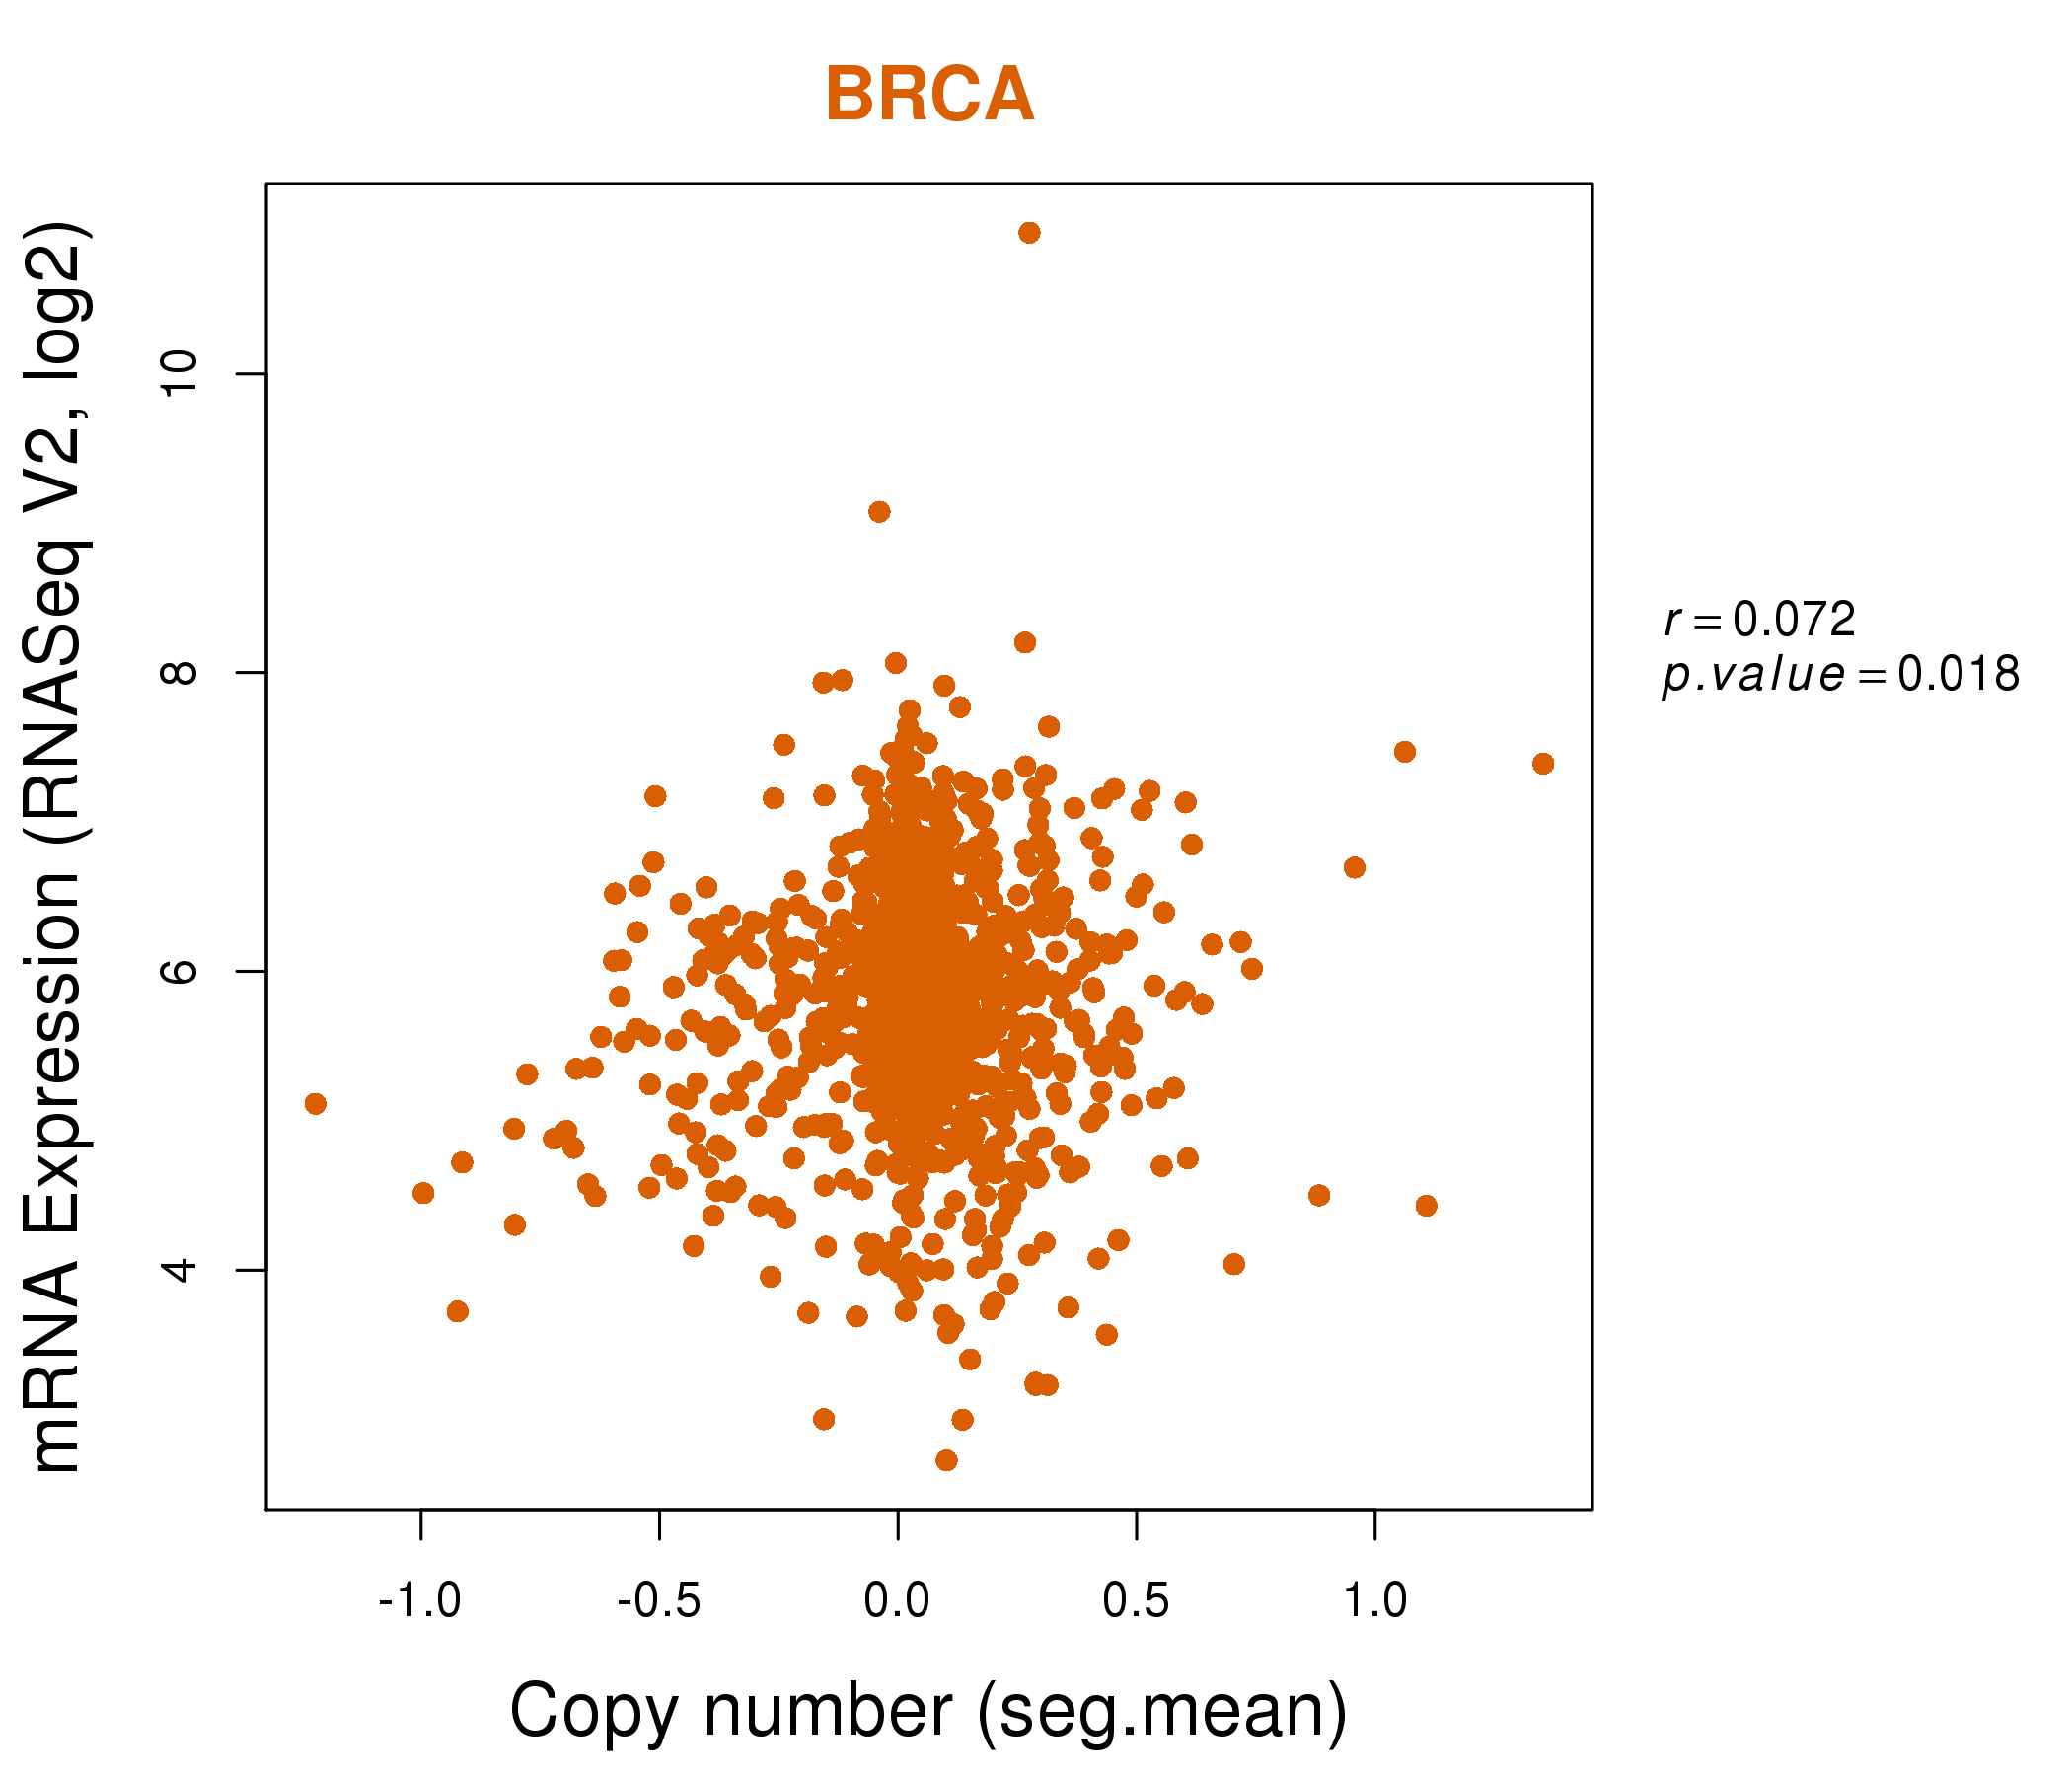
| * Normalized gene expression data of RNASeqV2 was extracted from TCGA using R package TCGA-Assembler. The URLs of all public data files on TCGA DCC data server were gathered at Jan-05-2015. Only eight cancer types have enough normal control samples for differential expression analysis. (t test, adjusted p<0.05 (using Benjamini-Hochberg FDR)) |
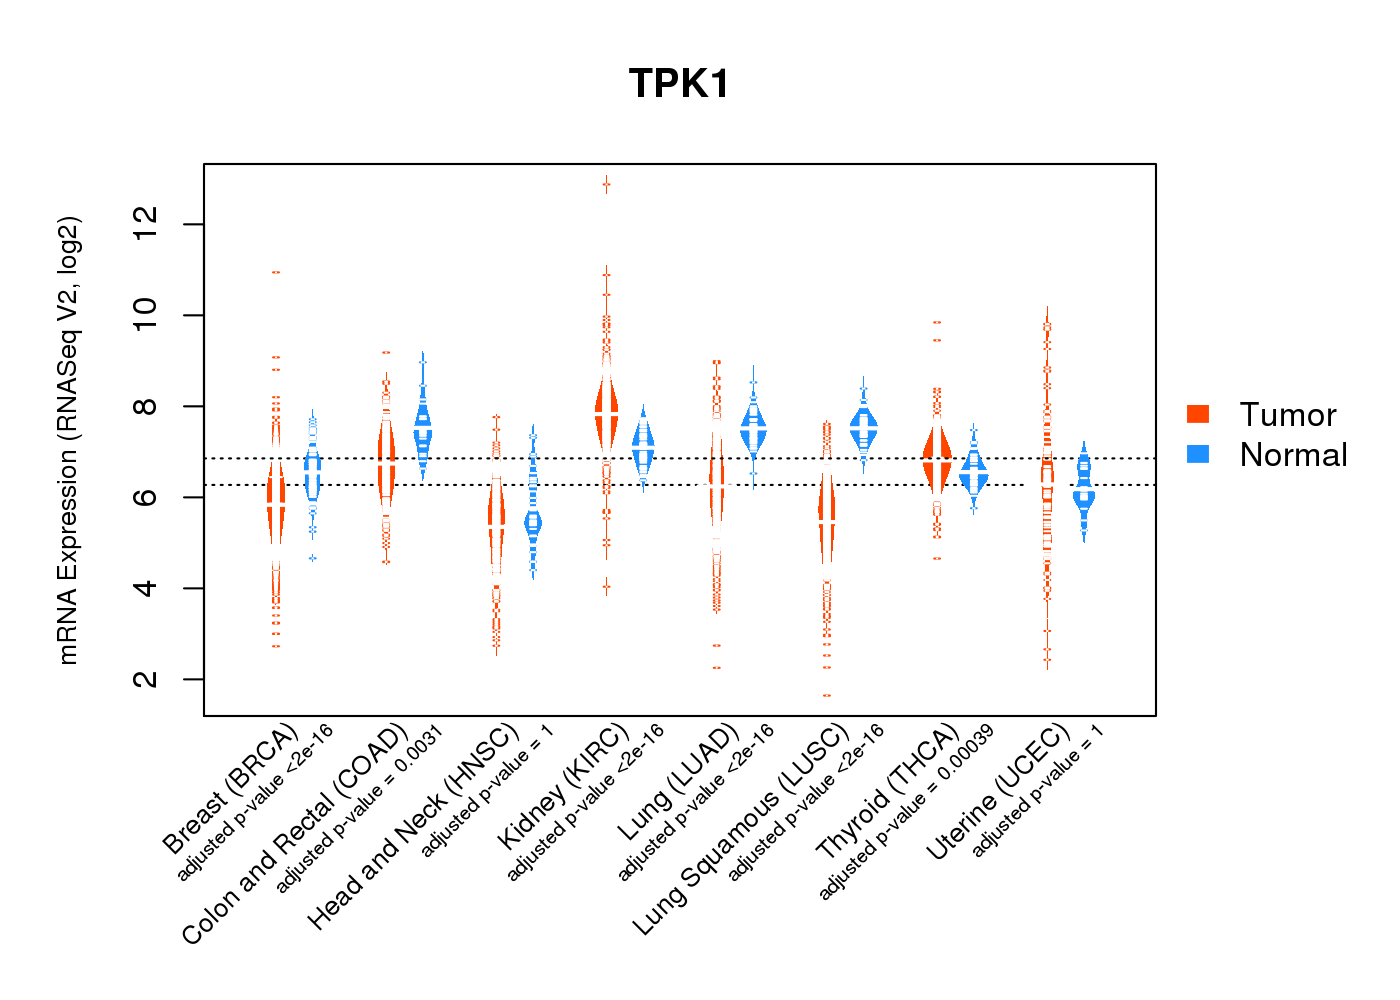 |
| Top |
| * This plots show the correlation between CNV and gene expression. |
: Open all plots for all cancer types
 |
|
 |
|

| Top |
| Gene-Gene Network Information |
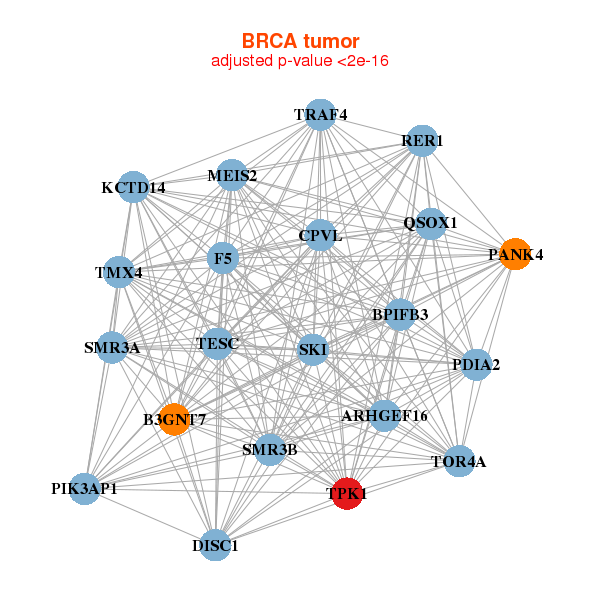
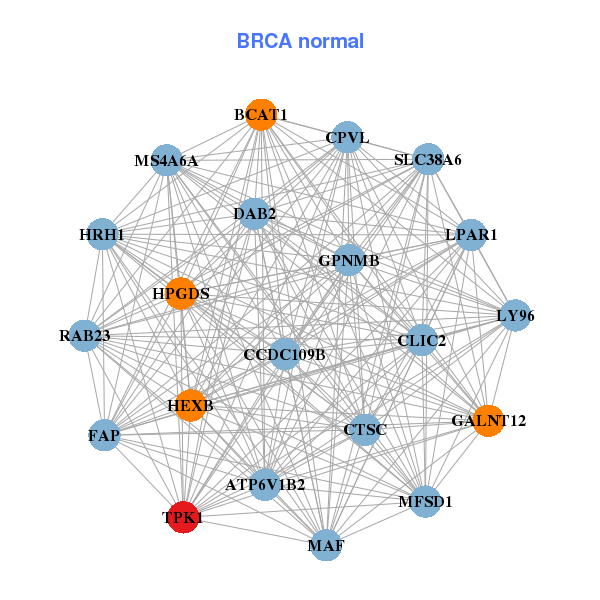
| * Co-Expression network figures were drawn using R package igraph. Only the top 20 genes with the highest correlations were shown. Red circle: input gene, orange circle: cell metabolism gene, sky circle: other gene |
: Open all plots for all cancer types
 |
| ||||
| ARHGEF16,B3GNT7,BPIFB3,TOR4A,CPVL,DISC1,F5, KCTD14,MEIS2,PANK4,PDIA2,PIK3AP1,QSOX1,RER1, SKI,SMR3A,SMR3B,TESC,TMX4,TPK1,TRAF4 | ATP6V1B2,BCAT1,CCDC109B,CLIC2,CPVL,CTSC,DAB2, FAP,GALNT12,GPNMB,HEXB,HPGDS,HRH1,LPAR1, LY96,MAF,MFSD1,MS4A6A,RAB23,SLC38A6,TPK1 | ||||
 |
| ||||
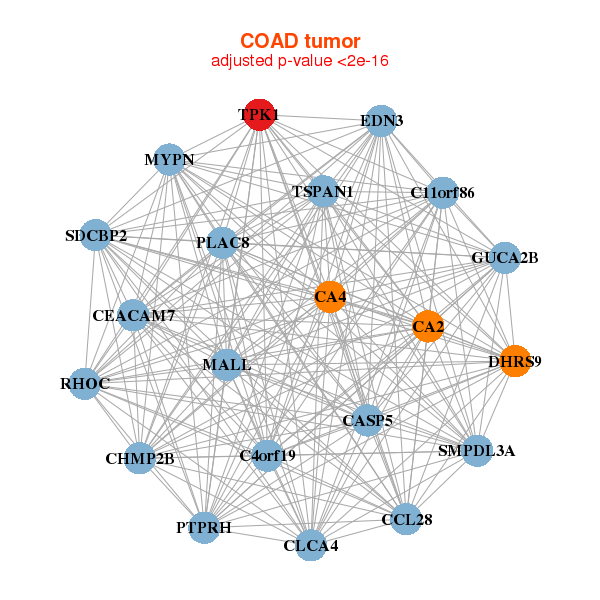
| C11orf86,C4orf19,CA2,CA4,CASP5,CCL28,CEACAM7, CHMP2B,CLCA4,DHRS9,EDN3,GUCA2B,MALL,MYPN, PLAC8,PTPRH,RHOC,SDCBP2,SMPDL3A,TPK1,TSPAN1 | ASS1,C4BPB,CD164L2,CLEC6A,CXCL1,DUOXA2,GRAMD2, GRHL3,LCN2,LYPD5,MMP1,NOS2,PI3,PLA2G2A, RTEL1,SLC6A14,TNFRSF6B,TNFSF12-TNFSF13,TPK1,TRIM40,TSPO2 |

| * Co-Expression network figures were drawn using R package igraph. Only the top 20 genes with the highest correlations were shown. Red circle: input gene, orange circle: cell metabolism gene, sky circle: other gene |
: Open all plots for all cancer types
| Top |
: Open all interacting genes' information including KEGG pathway for all interacting genes from DAVID
| Top |
| Pharmacological Information for TPK1 |
| DB Category | DB Name | DB's ID and Url link |
| * Gene Centered Interaction Network. |
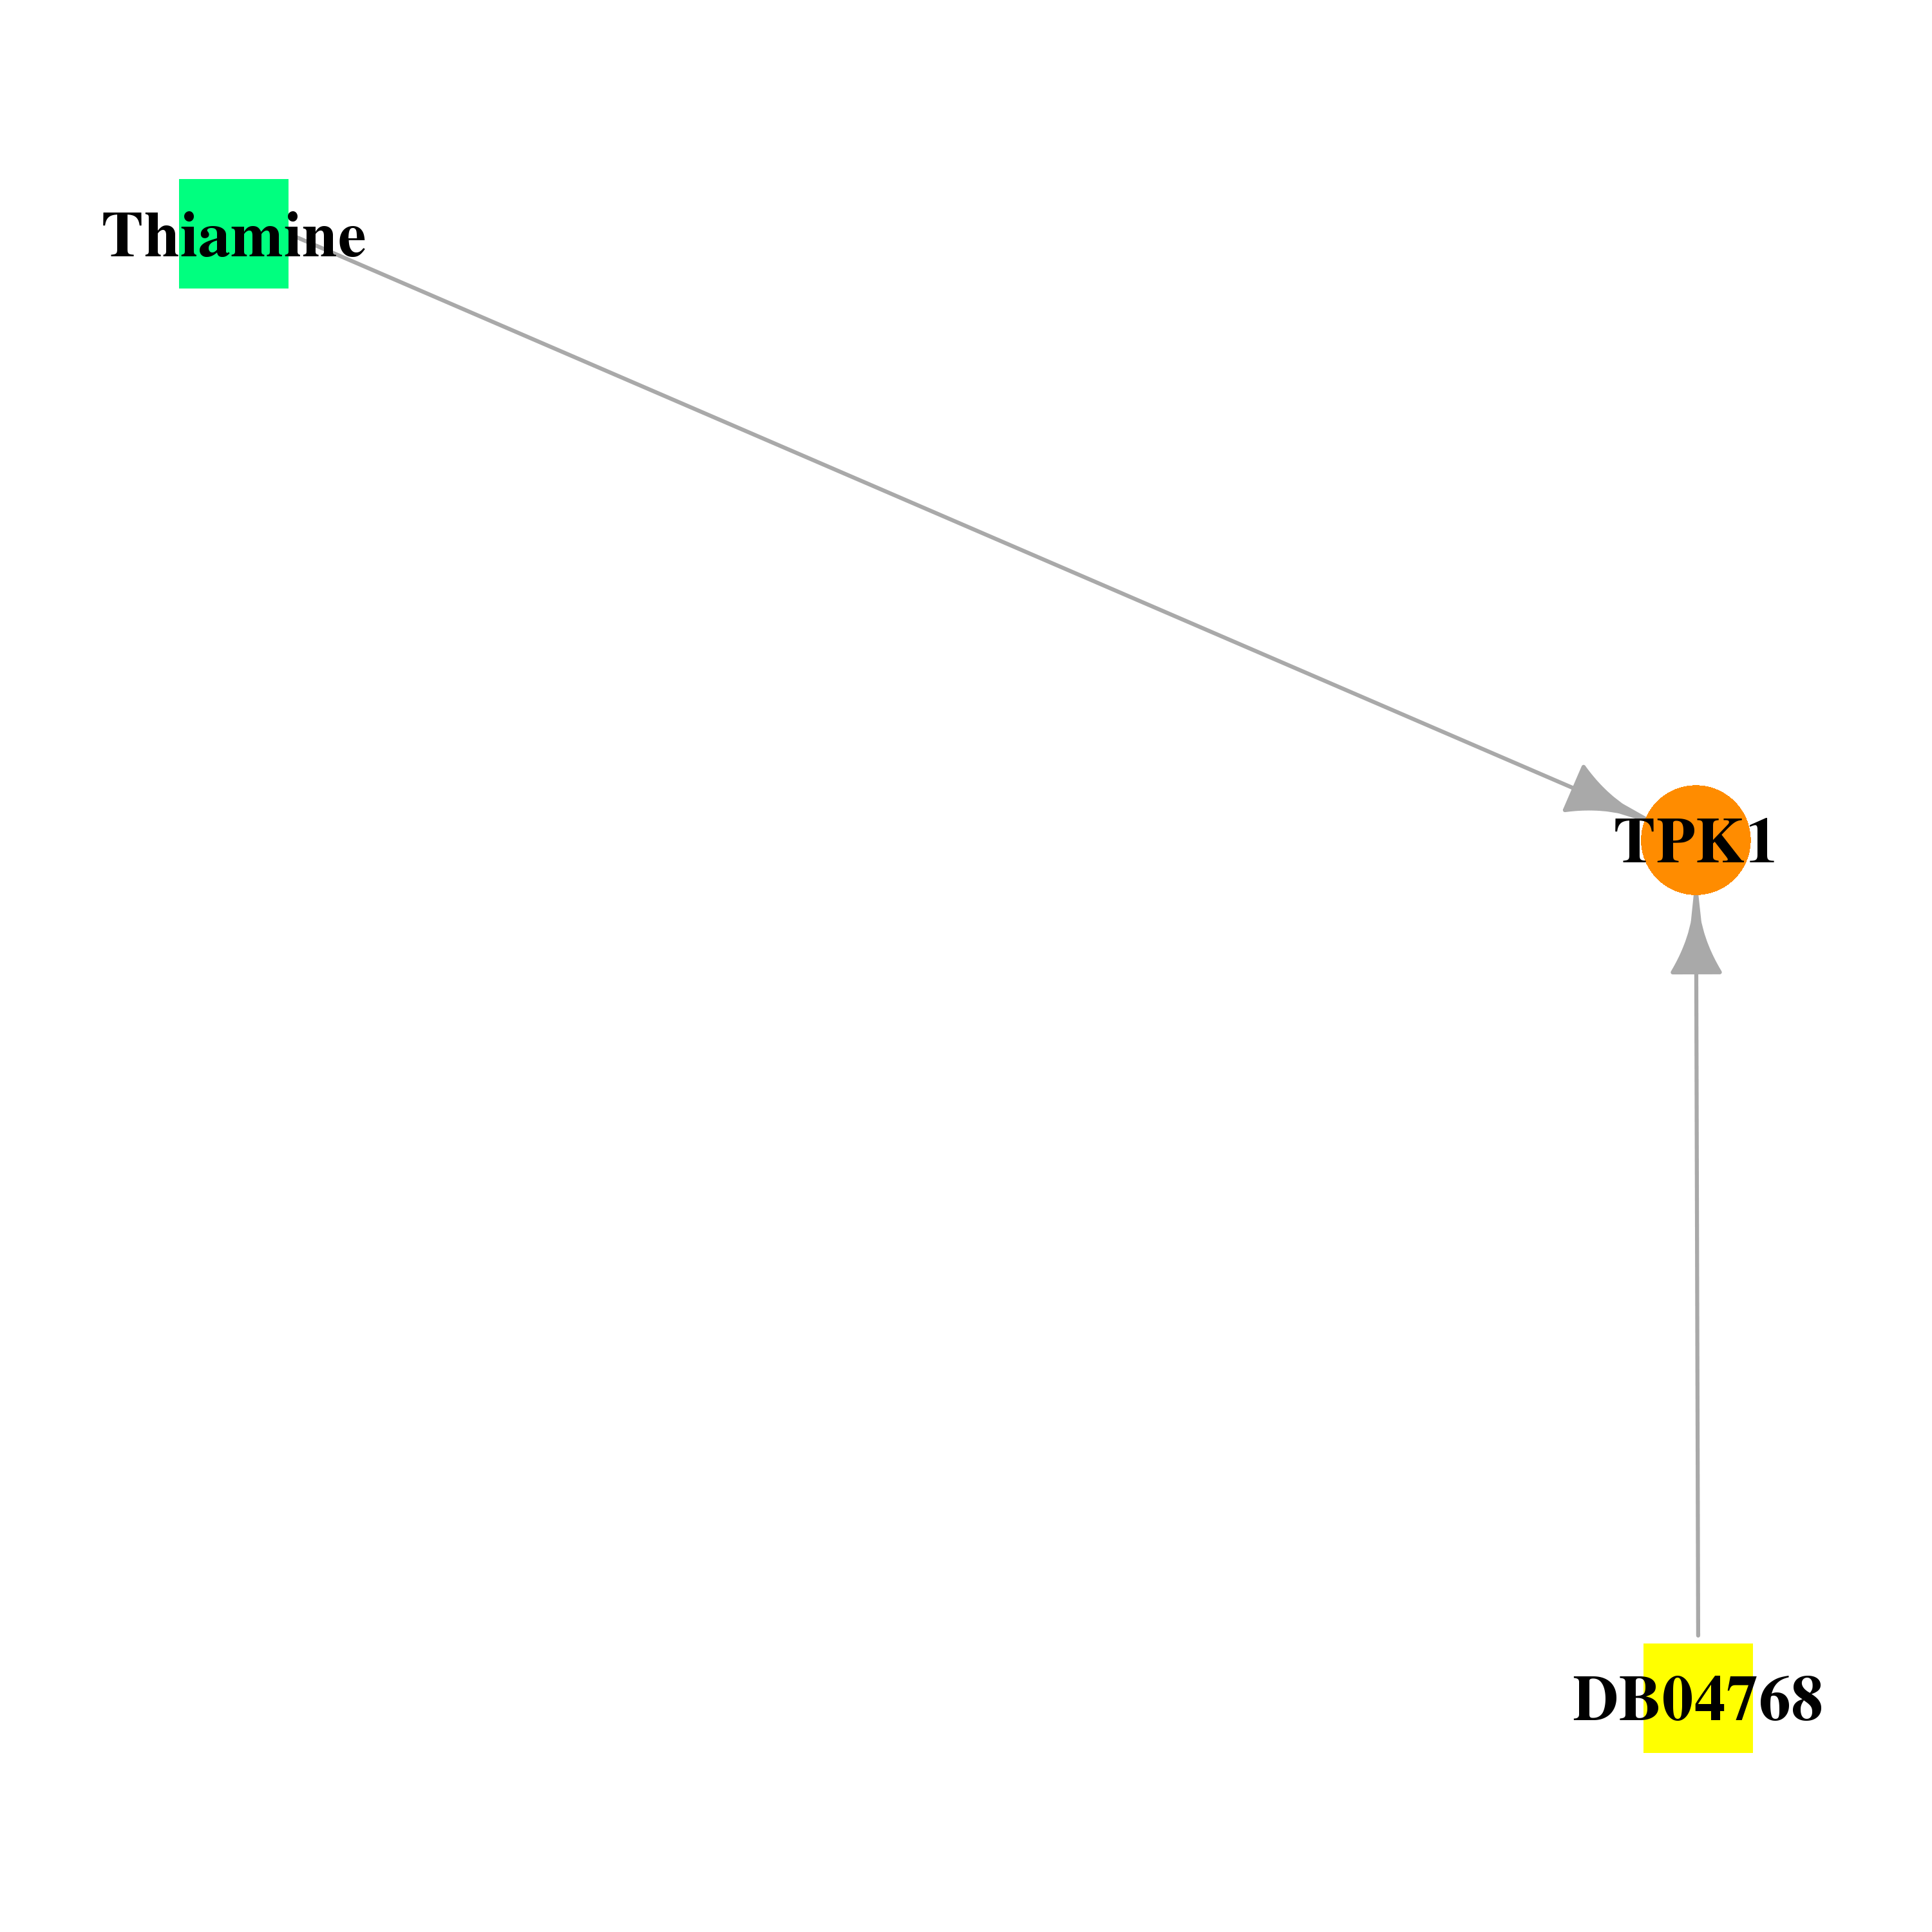 |
| * Drug Centered Interaction Network. |
| DrugBank ID | Target Name | Drug Groups | Generic Name | Drug Centered Network | Drug Structure |
| DB00152 | thiamin pyrophosphokinase 1 | approved; nutraceutical | Thiamine | 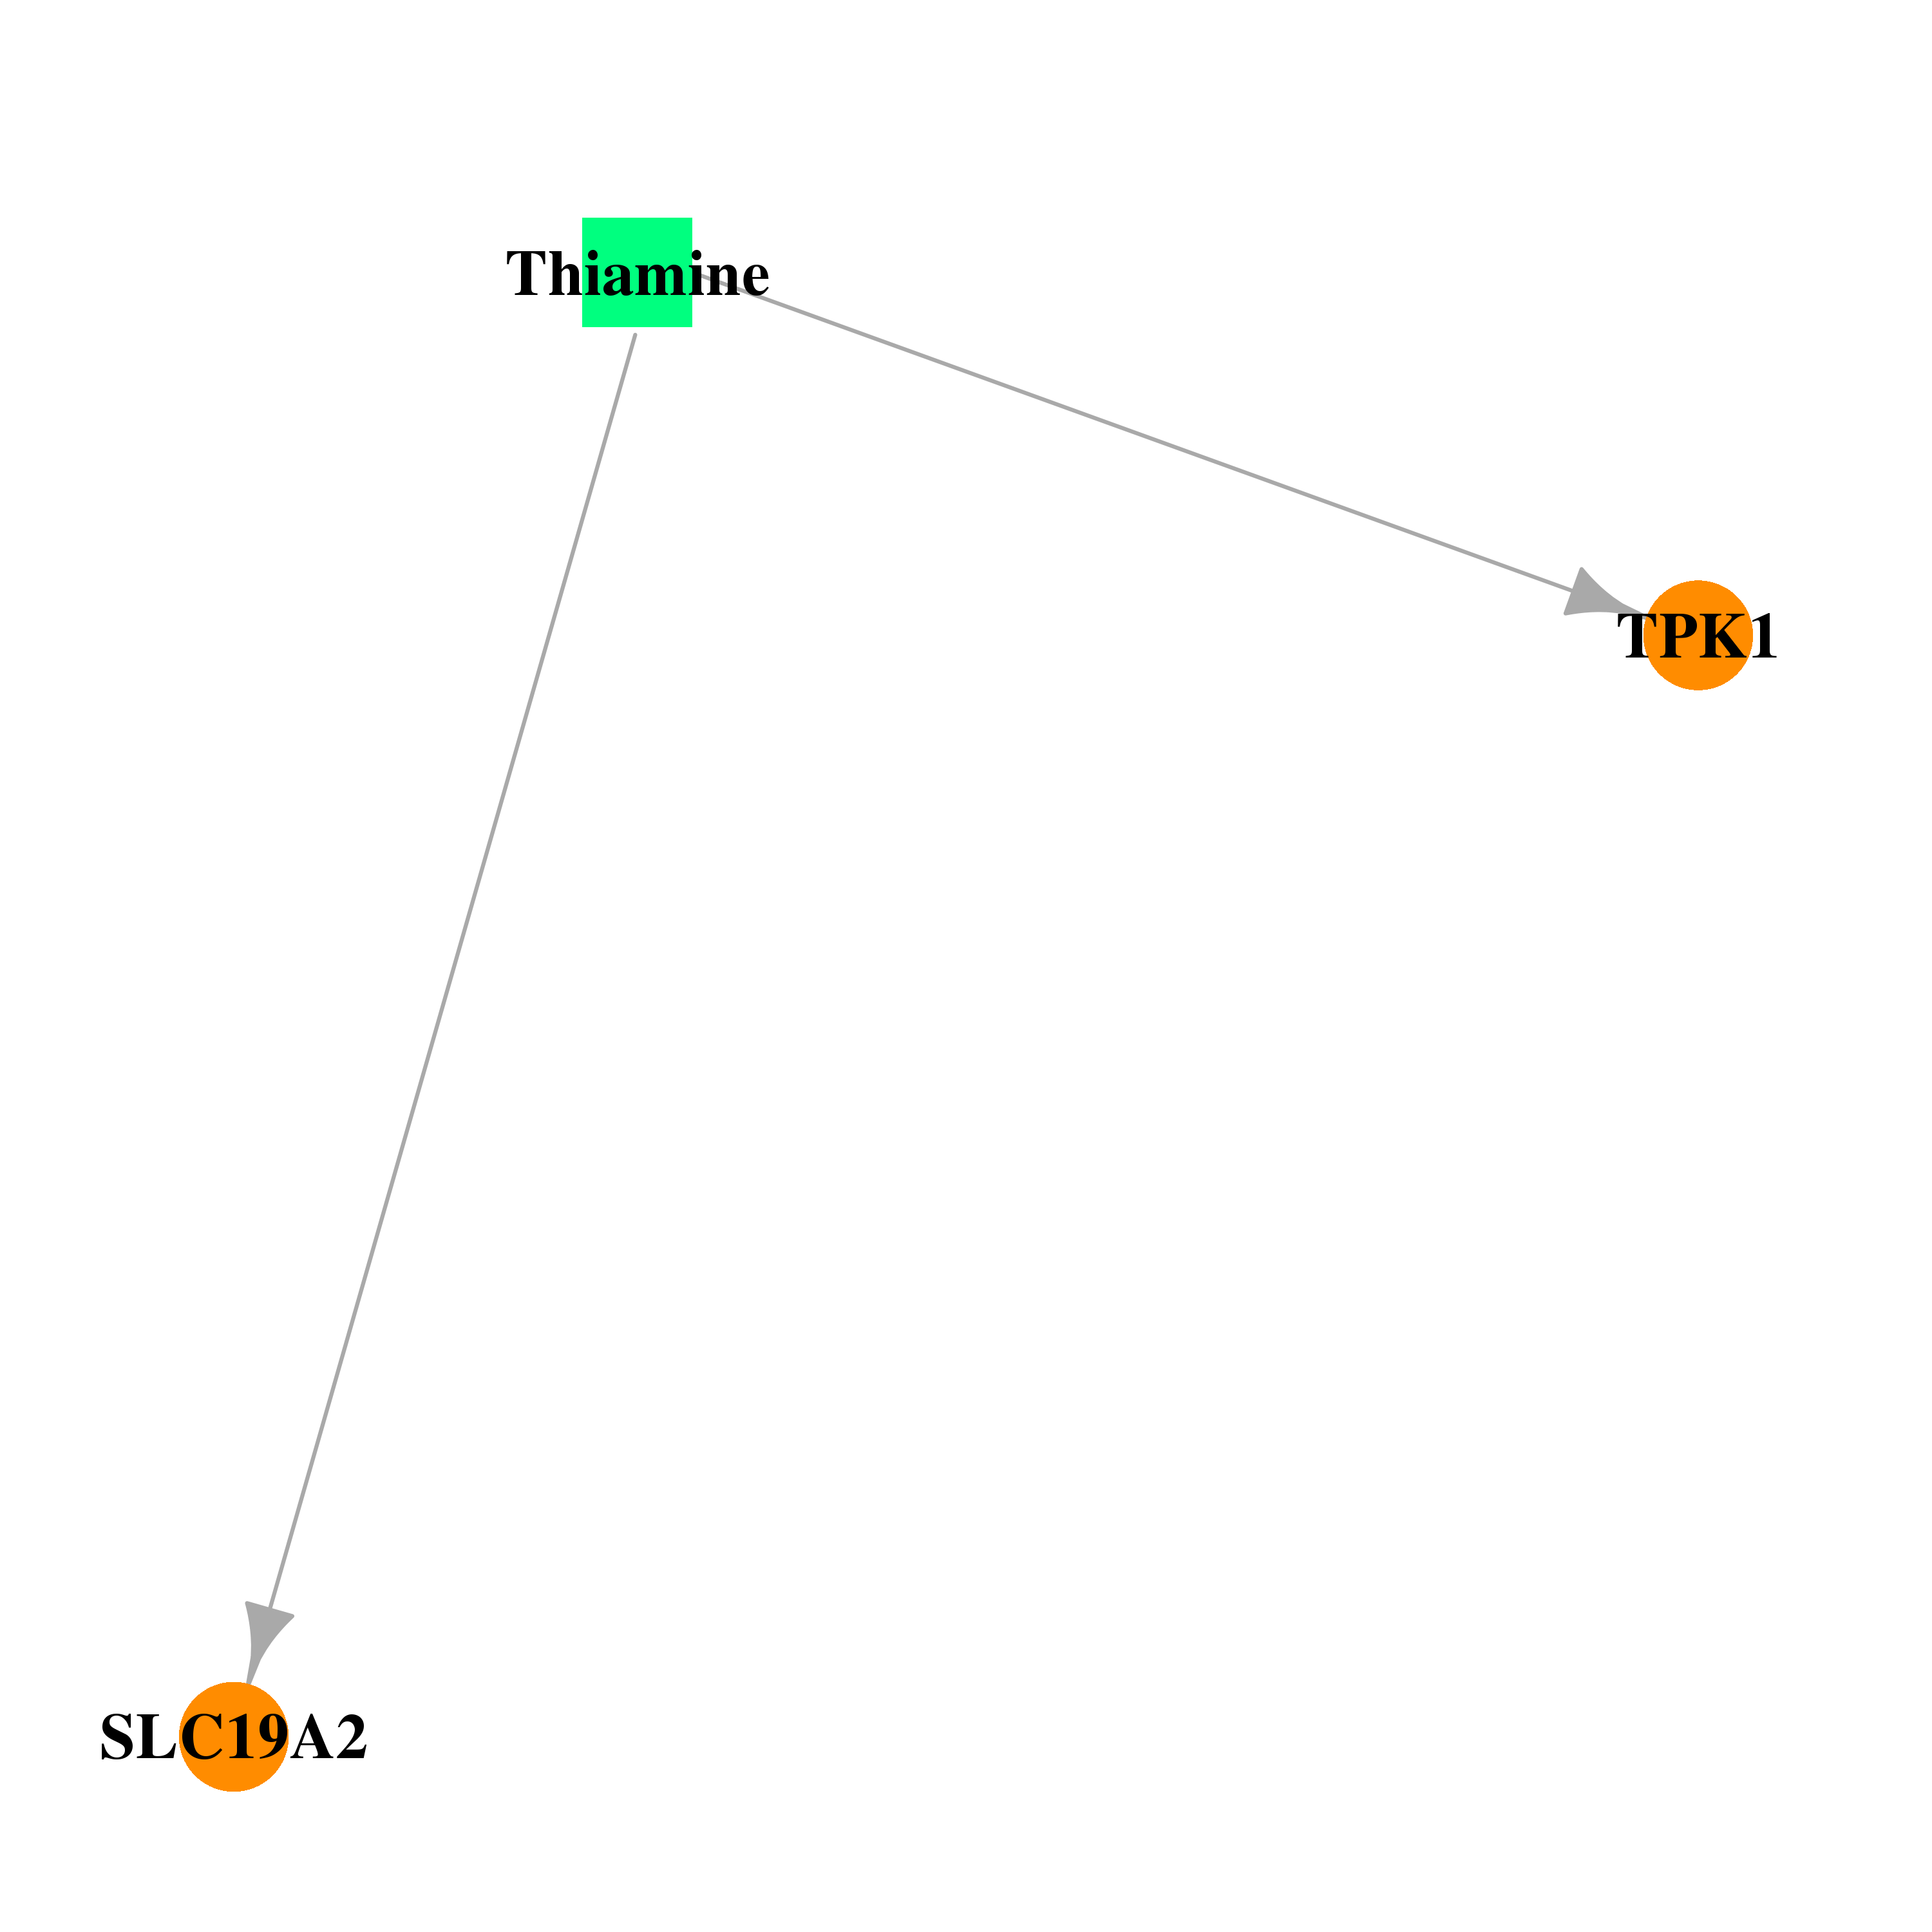 | 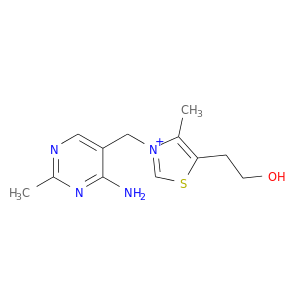 |
| DB04768 | thiamin pyrophosphokinase 1 | experimental | Pyrithiamine Pyrophosphate |  | 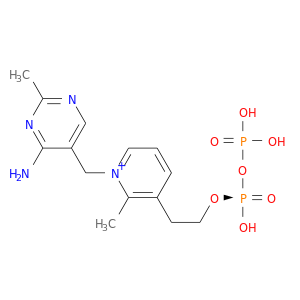 |
| Top |
| Cross referenced IDs for TPK1 |
| * We obtained these cross-references from Uniprot database. It covers 150 different DBs, 18 categories. http://www.uniprot.org/help/cross_references_section |
: Open all cross reference information
|
Copyright © 2016-Present - The Univsersity of Texas Health Science Center at Houston @ |