|
||||||||||||||||||||
| |
| Phenotypic Information (metabolism pathway, cancer, disease, phenome) |
| |
| |
| Gene-Gene Network Information: Co-Expression Network, Interacting Genes & KEGG |
| |
|


| Gene Summary for GK2 |
| Basic gene info. | Gene symbol | GK2 |
| Gene name | glycerol kinase 2 | |
| Synonyms | GKP2|GKTA | |
| Cytomap | UCSC genome browser: 4q13 | |
| Genomic location | chr4 :80327506-80329372 | |
| Type of gene | protein-coding | |
| RefGenes | NM_033214.2, | |
| Ensembl id | ENSG00000196475 | |
| Description | ATP:glycerol 3-phosphotransferase 2glycerokinase 2glycerol kinase pseudogene 2glycerol kinase testis specific 2glycerol kinase, testis specific 2 | |
| Modification date | 20141207 | |
| dbXrefs | MIM : 600148 | |
| HGNC : HGNC | ||
| Ensembl : ENSG00000196475 | ||
| HPRD : 15966 | ||
| Vega : OTTHUMG00000130199 | ||
| Protein | UniProt: go to UniProt's Cross Reference DB Table | |
| Expression | CleanEX: HS_GK2 | |
| BioGPS: 2712 | ||
| Gene Expression Atlas: ENSG00000196475 | ||
| The Human Protein Atlas: ENSG00000196475 | ||
| Pathway | NCI Pathway Interaction Database: GK2 | |
| KEGG: GK2 | ||
| REACTOME: GK2 | ||
| ConsensusPathDB | ||
| Pathway Commons: GK2 | ||
| Metabolism | MetaCyc: GK2 | |
| HUMANCyc: GK2 | ||
| Regulation | Ensembl's Regulation: ENSG00000196475 | |
| miRBase: chr4 :80,327,506-80,329,372 | ||
| TargetScan: NM_033214 | ||
| cisRED: ENSG00000196475 | ||
| Context | iHOP: GK2 | |
| cancer metabolism search in PubMed: GK2 | ||
| UCL Cancer Institute: GK2 | ||
| Assigned class in ccmGDB | C | |
| Top |
| Phenotypic Information for GK2(metabolism pathway, cancer, disease, phenome) |
| Cancer | CGAP: GK2 |
| Familial Cancer Database: GK2 | |
| * This gene is included in those cancer gene databases. |
|
|
|
|
|
|
| ||||||||||||||
Oncogene 1 | Significant driver gene in | |||||||||||||||||||
| cf) number; DB name 1 Oncogene; http://nar.oxfordjournals.org/content/35/suppl_1/D721.long, 2 Tumor Suppressor gene; https://bioinfo.uth.edu/TSGene/, 3 Cancer Gene Census; http://www.nature.com/nrc/journal/v4/n3/abs/nrc1299.html, 4 CancerGenes; http://nar.oxfordjournals.org/content/35/suppl_1/D721.long, 5 Network of Cancer Gene; http://ncg.kcl.ac.uk/index.php, 1Therapeutic Vulnerabilities in Cancer; http://cbio.mskcc.org/cancergenomics/statius/ |
| KEGG_GLYCEROLIPID_METABOLISM | |
| OMIM | |
| Orphanet | |
| Disease | KEGG Disease: GK2 |
| MedGen: GK2 (Human Medical Genetics with Condition) | |
| ClinVar: GK2 | |
| Phenotype | MGI: GK2 (International Mouse Phenotyping Consortium) |
| PhenomicDB: GK2 | |
| Mutations for GK2 |
| * Under tables are showing count per each tissue to give us broad intuition about tissue specific mutation patterns.You can go to the detailed page for each mutation database's web site. |
| There's no structural variation information in COSMIC data for this gene. |
| * From mRNA Sanger sequences, Chitars2.0 arranged chimeric transcripts. This table shows GK2 related fusion information. |
| ID | Head Gene | Tail Gene | Accession | Gene_a | qStart_a | qEnd_a | Chromosome_a | tStart_a | tEnd_a | Gene_a | qStart_a | qEnd_a | Chromosome_a | tStart_a | tEnd_a |
| Top |
| There's no copy number variation information in COSMIC data for this gene. |
| Top |
|
 |
| Top |
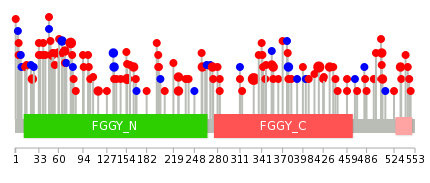
| Stat. for Non-Synonymous SNVs (# total SNVs=85) | (# total SNVs=18) |
 |  |
(# total SNVs=0) | (# total SNVs=0) |
| Top |
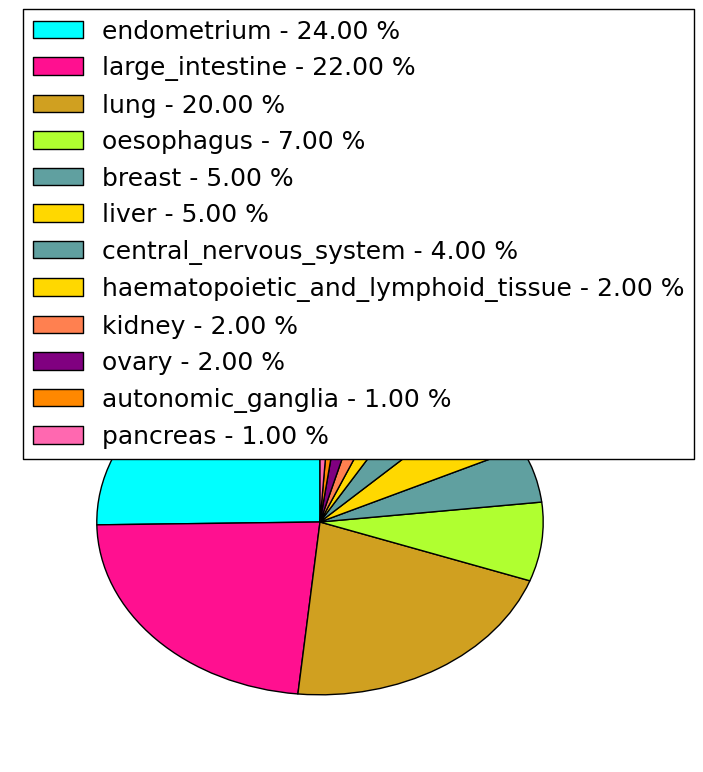
| * When you move the cursor on each content, you can see more deailed mutation information on the Tooltip. Those are primary_site,primary_histology,mutation(aa),pubmedID. |
| GRCh37 position | Mutation(aa) | Unique sampleID count |
| chr4:80328367-80328367 | p.R330C | 7 |
| chr4:80328097-80328097 | p.R420C | 5 |
| chr4:80329126-80329126 | p.E77K | 5 |
| chr4:80328892-80328892 | p.R155C | 3 |
| chr4:80327836-80327836 | p.V507I | 3 |
| chr4:80328285-80328285 | p.G357D | 3 |
| chr4:80329149-80329149 | p.A69V | 3 |
| chr4:80327758-80327758 | p.G533R | 2 |
| chr4:80329257-80329257 | p.A33V | 2 |
| chr4:80329284-80329284 | p.R24H | 2 |
| Top |
|
 |
| Point Mutation/ Tissue ID | 1 | 2 | 3 | 4 | 5 | 6 | 7 | 8 | 9 | 10 | 11 | 12 | 13 | 14 | 15 | 16 | 17 | 18 | 19 | 20 |
| # sample | 3 | 3 | 18 | 1 | 6 | 1 | 2 | 7 | 8 | 2 | 31 | 4 | 18 | |||||||
| # mutation | 3 | 3 | 17 | 1 | 6 | 1 | 2 | 7 | 8 | 2 | 31 | 4 | 19 | |||||||
| nonsynonymous SNV | 3 | 2 | 13 | 1 | 6 | 1 | 1 | 5 | 6 | 2 | 25 | 3 | 17 | |||||||
| synonymous SNV | 1 | 4 | 1 | 2 | 2 | 6 | 1 | 2 |
| cf) Tissue ID; Tissue type (1; BLCA[Bladder Urothelial Carcinoma], 2; BRCA[Breast invasive carcinoma], 3; CESC[Cervical squamous cell carcinoma and endocervical adenocarcinoma], 4; COAD[Colon adenocarcinoma], 5; GBM[Glioblastoma multiforme], 6; Glioma Low Grade, 7; HNSC[Head and Neck squamous cell carcinoma], 8; KICH[Kidney Chromophobe], 9; KIRC[Kidney renal clear cell carcinoma], 10; KIRP[Kidney renal papillary cell carcinoma], 11; LAML[Acute Myeloid Leukemia], 12; LUAD[Lung adenocarcinoma], 13; LUSC[Lung squamous cell carcinoma], 14; OV[Ovarian serous cystadenocarcinoma ], 15; PAAD[Pancreatic adenocarcinoma], 16; PRAD[Prostate adenocarcinoma], 17; SKCM[Skin Cutaneous Melanoma], 18:STAD[Stomach adenocarcinoma], 19:THCA[Thyroid carcinoma], 20:UCEC[Uterine Corpus Endometrial Carcinoma]) |
| Top |
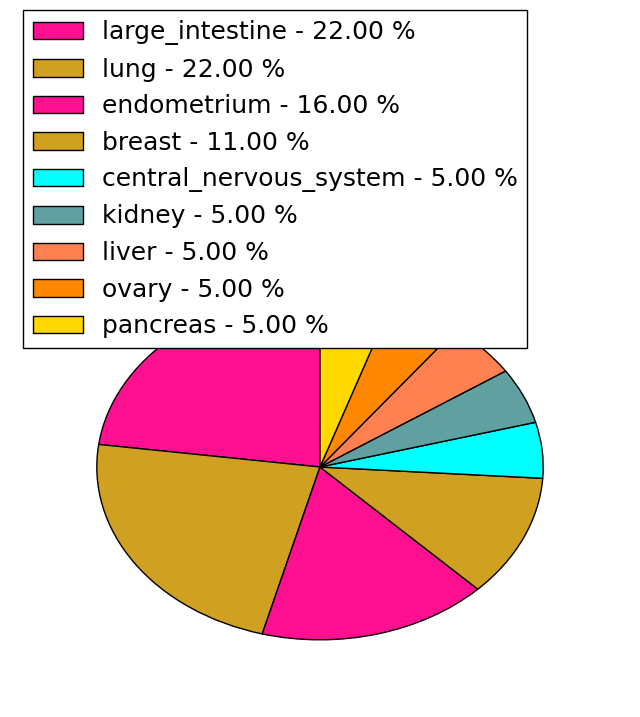
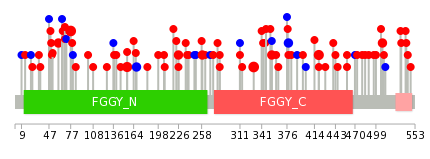
| * We represented just top 10 SNVs. When you move the cursor on each content, you can see more deailed mutation information on the Tooltip. Those are primary_site, primary_histology, mutation(aa), pubmedID. |
| Genomic Position | Mutation(aa) | Unique sampleID count |
| chr4:80329126 | p.R330C | 4 |
| chr4:80328367 | p.E77K | 4 |
| chr4:80328892 | p.R420C | 3 |
| chr4:80328097 | p.R155C | 3 |
| chr4:80328679 | p.M508I | 2 |
| chr4:80328221 | p.P226S | 2 |
| chr4:80327831 | p.E311E | 2 |
| chr4:80328580 | p.G378G | 2 |
| chr4:80329149 | p.V168V | 2 |
| chr4:80329176 | p.A69E | 2 |
| * Copy number data were extracted from TCGA using R package TCGA-Assembler. The URLs of all public data files on TCGA DCC data server were gathered on Jan-05-2015. Function ProcessCNAData in TCGA-Assembler package was used to obtain gene-level copy number value which is calculated as the average copy number of the genomic region of a gene. |
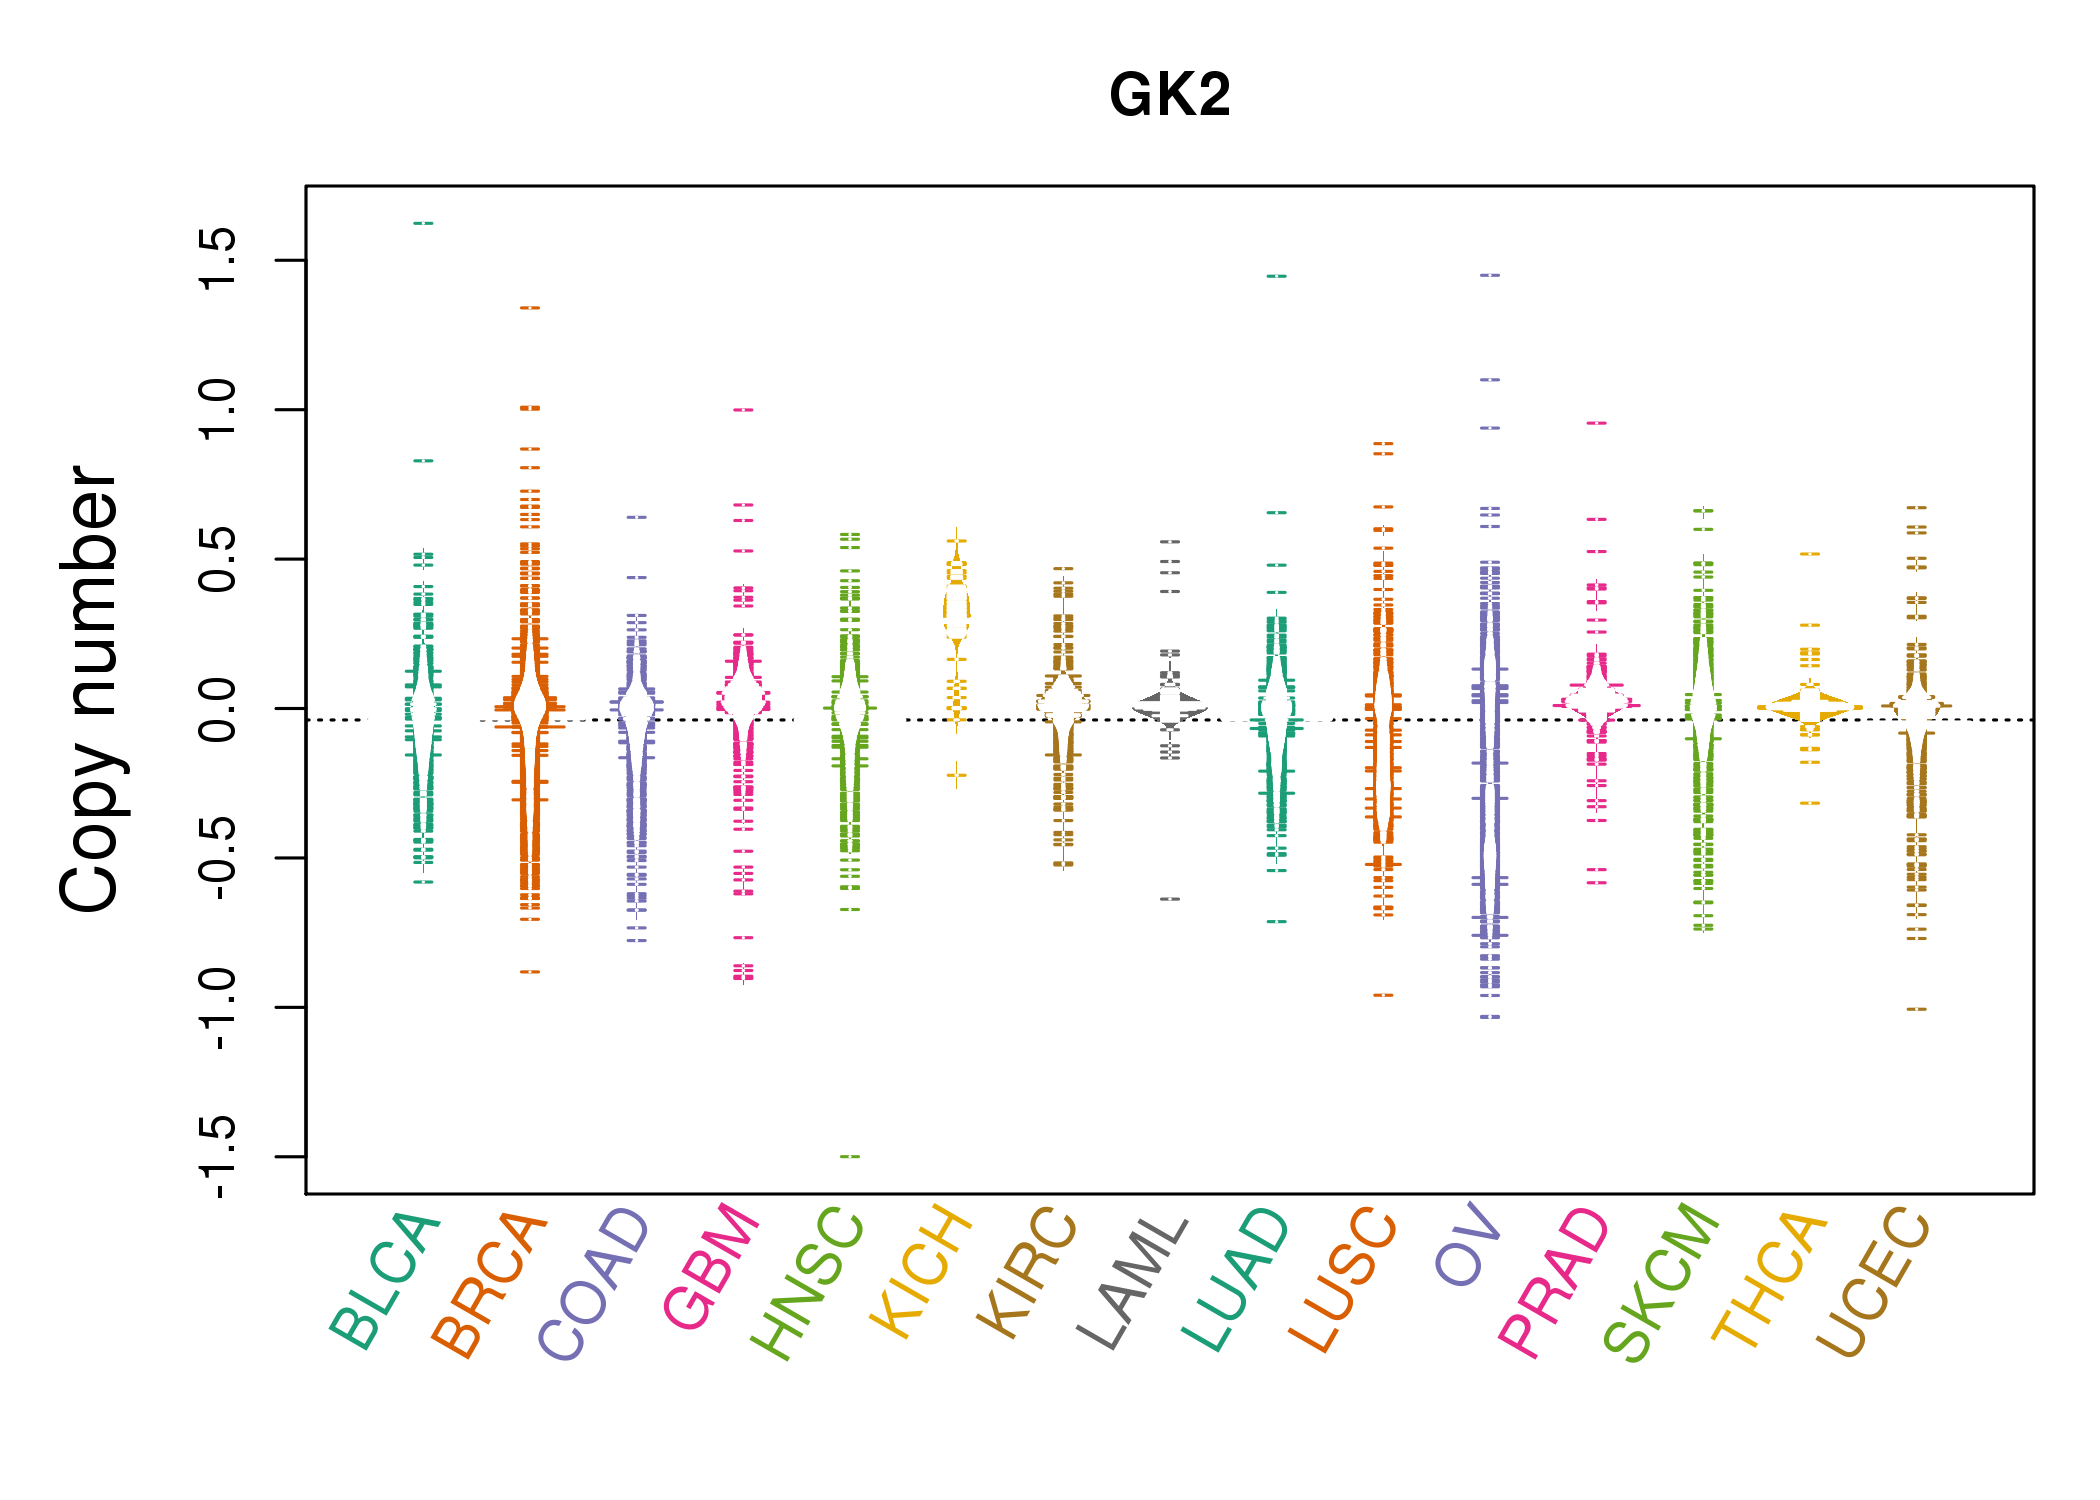 |
| cf) Tissue ID[Tissue type]: BLCA[Bladder Urothelial Carcinoma], BRCA[Breast invasive carcinoma], CESC[Cervical squamous cell carcinoma and endocervical adenocarcinoma], COAD[Colon adenocarcinoma], GBM[Glioblastoma multiforme], Glioma Low Grade, HNSC[Head and Neck squamous cell carcinoma], KICH[Kidney Chromophobe], KIRC[Kidney renal clear cell carcinoma], KIRP[Kidney renal papillary cell carcinoma], LAML[Acute Myeloid Leukemia], LUAD[Lung adenocarcinoma], LUSC[Lung squamous cell carcinoma], OV[Ovarian serous cystadenocarcinoma ], PAAD[Pancreatic adenocarcinoma], PRAD[Prostate adenocarcinoma], SKCM[Skin Cutaneous Melanoma], STAD[Stomach adenocarcinoma], THCA[Thyroid carcinoma], UCEC[Uterine Corpus Endometrial Carcinoma] |
| Top |
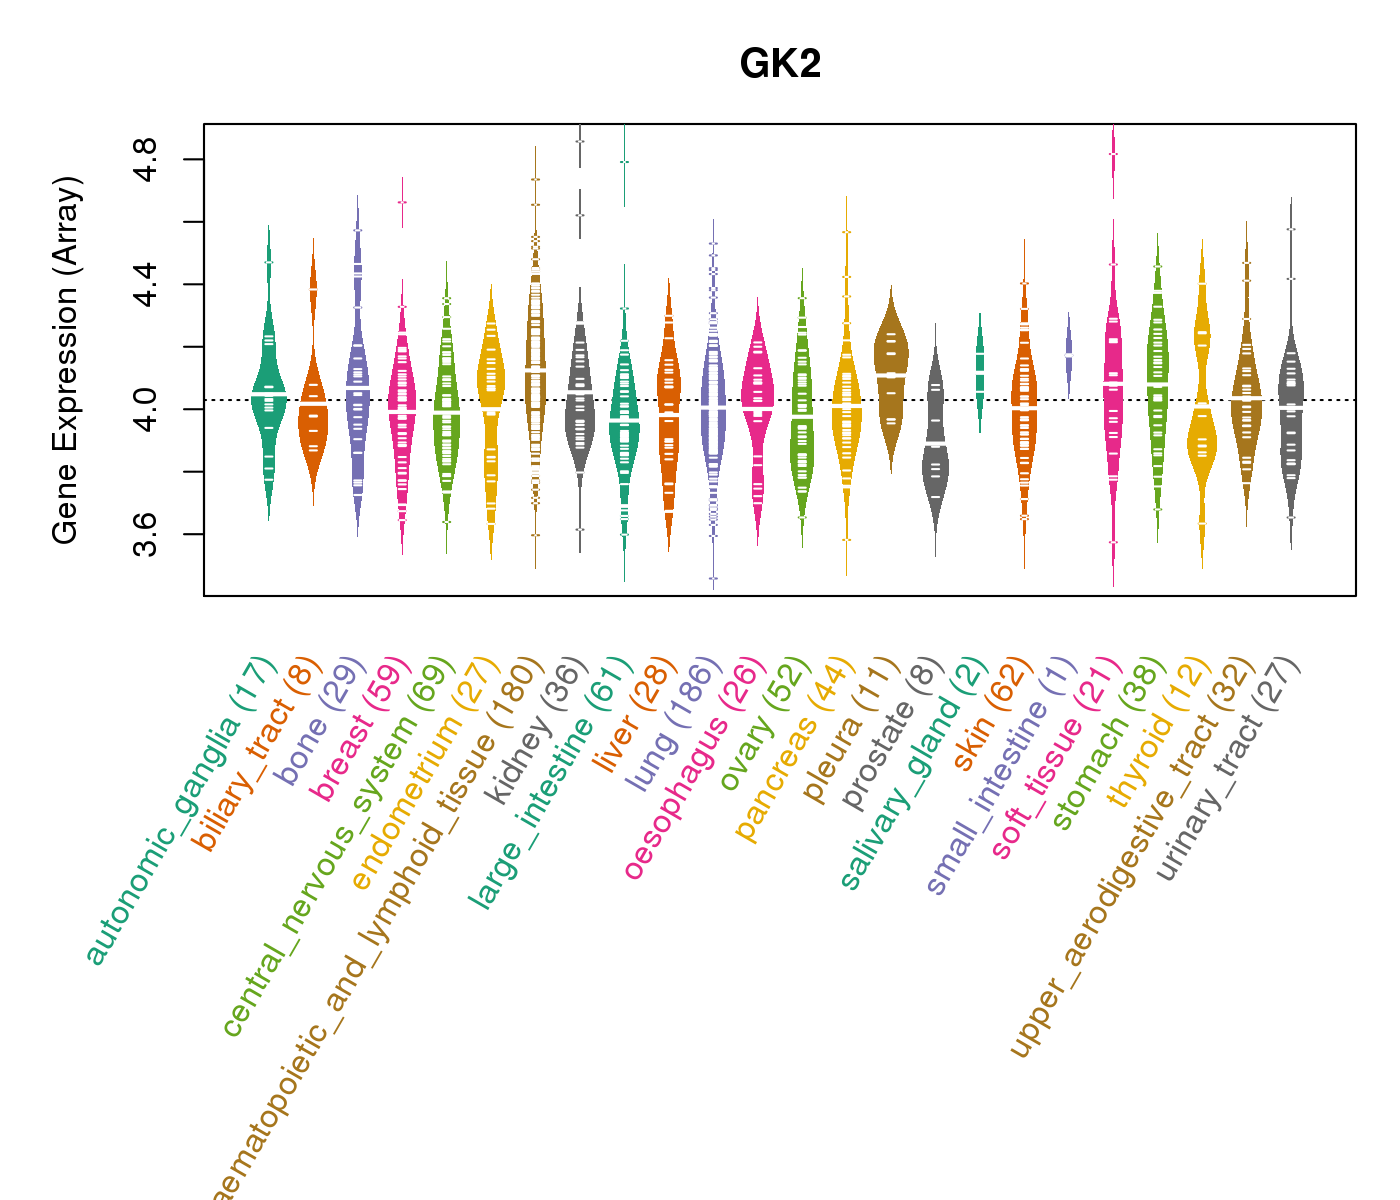
| Gene Expression for GK2 |
| * CCLE gene expression data were extracted from CCLE_Expression_Entrez_2012-10-18.res: Gene-centric RMA-normalized mRNA expression data. |
 |
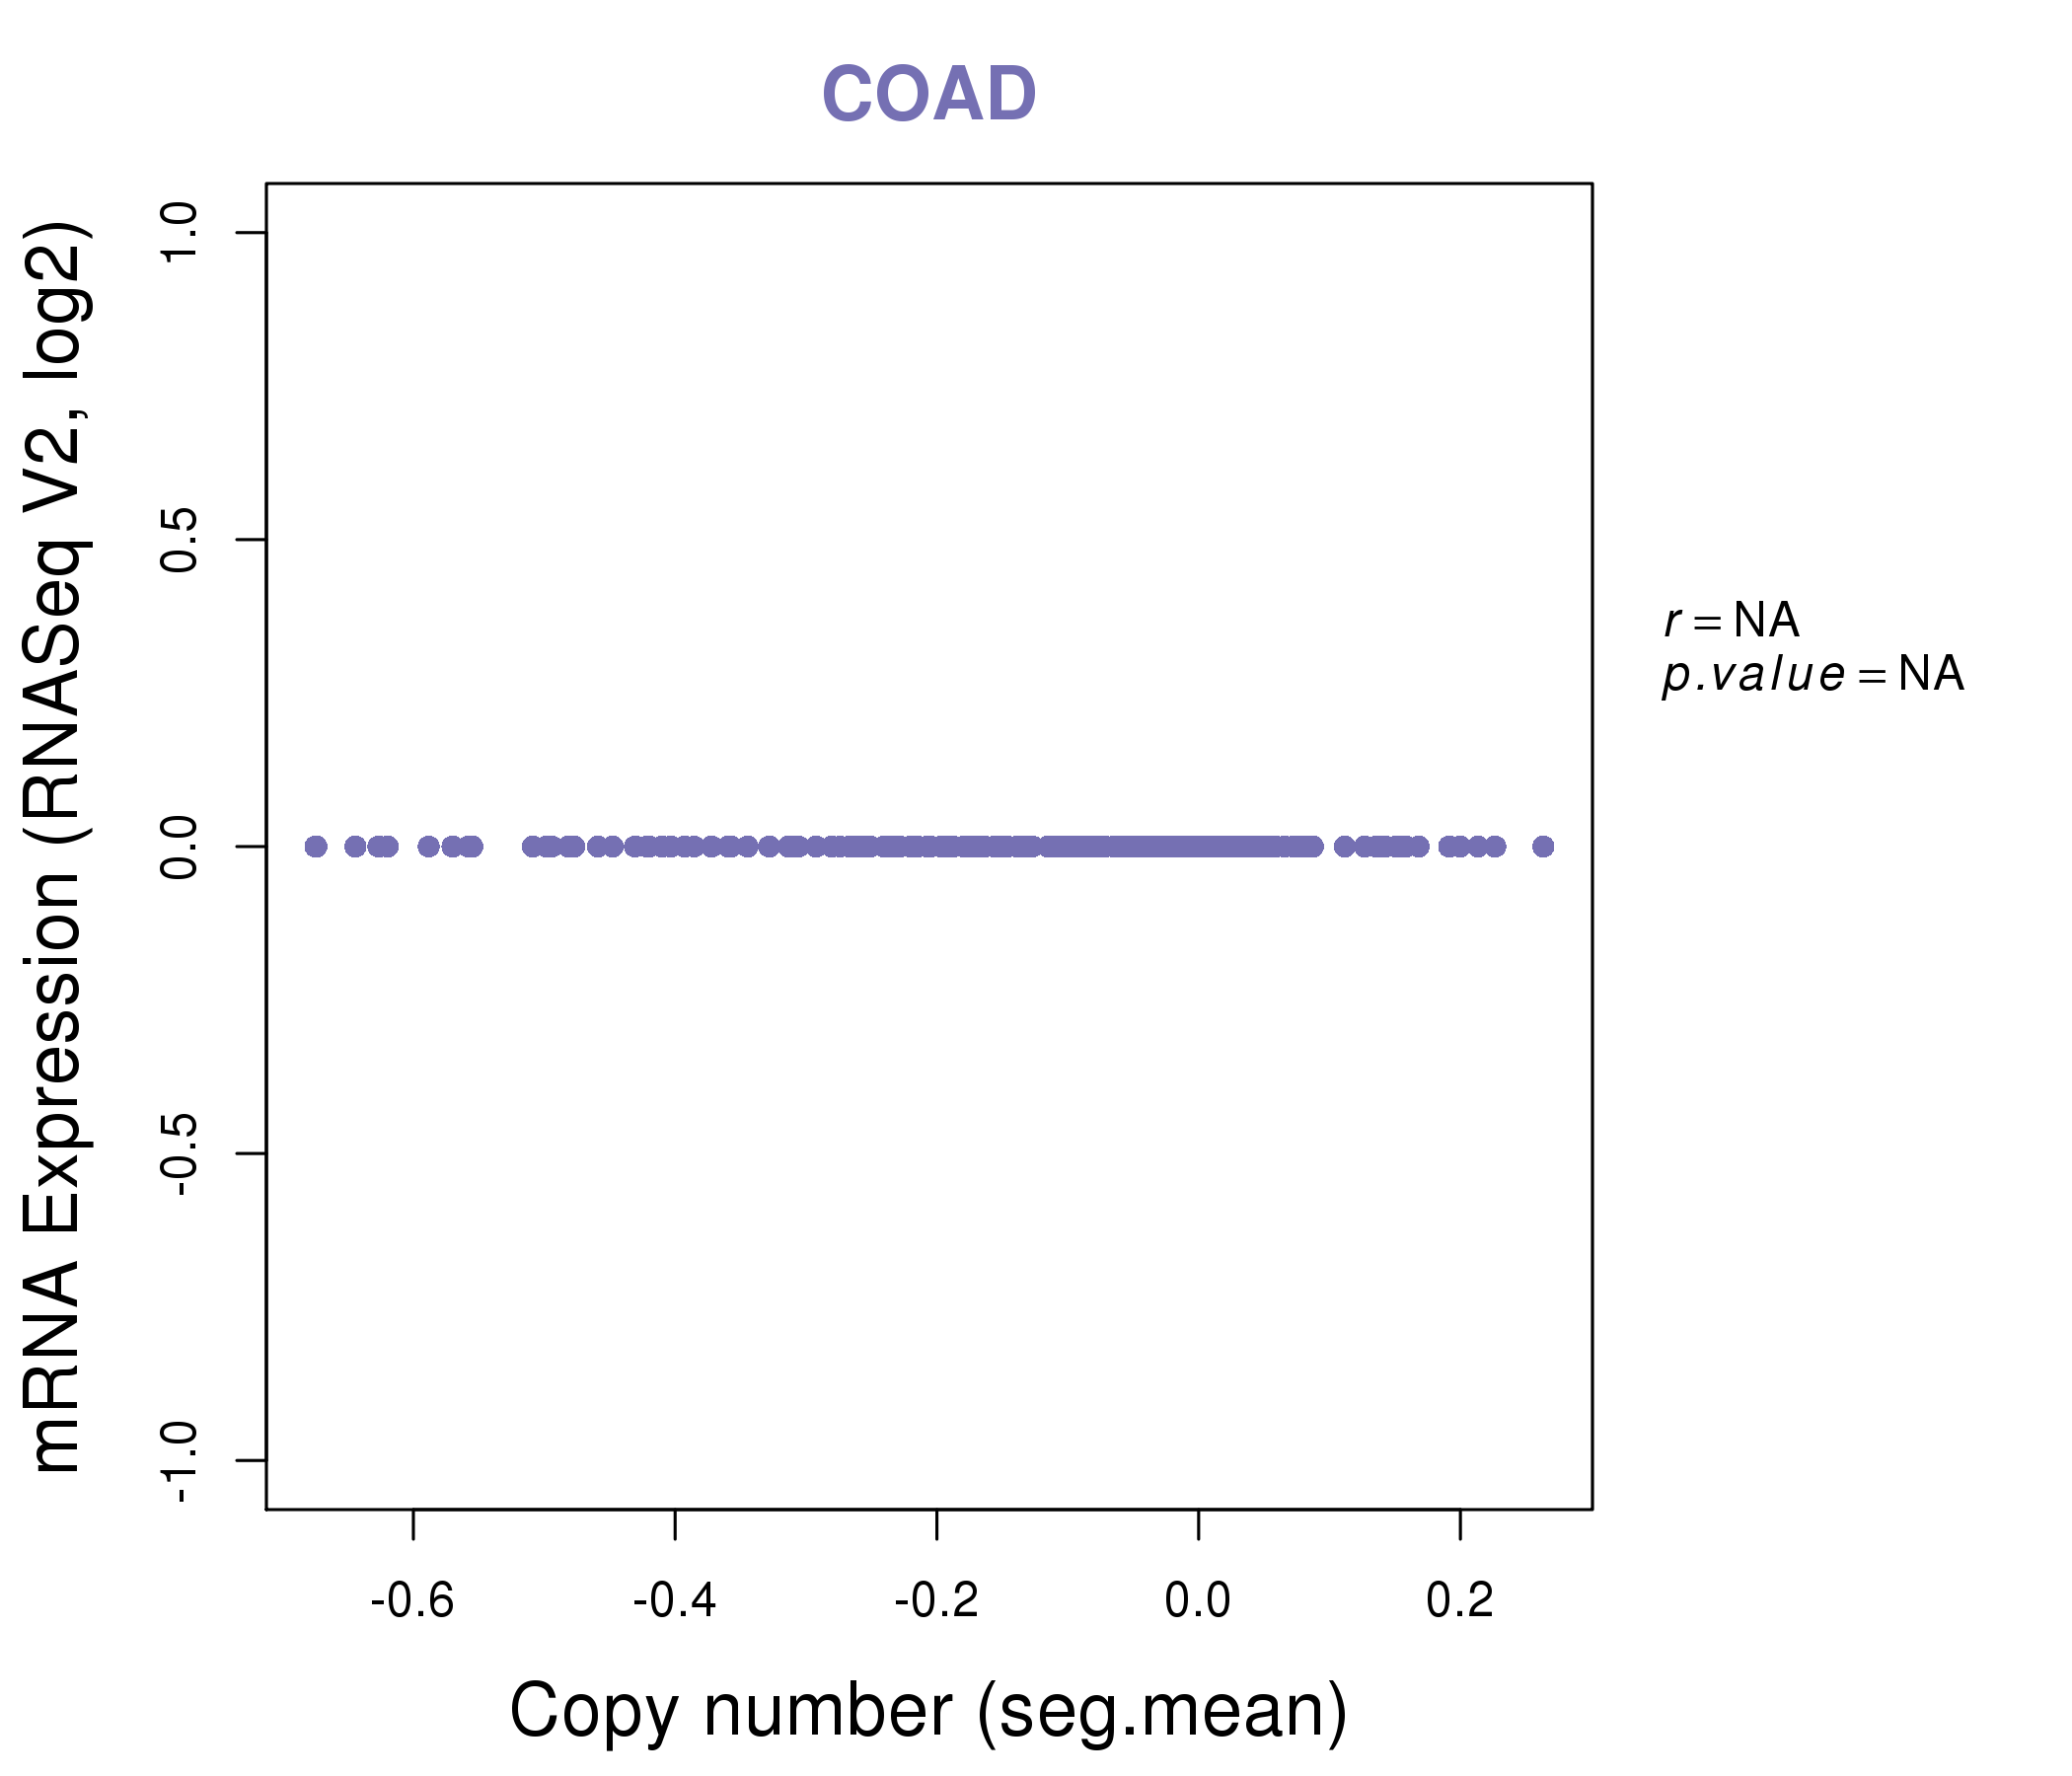
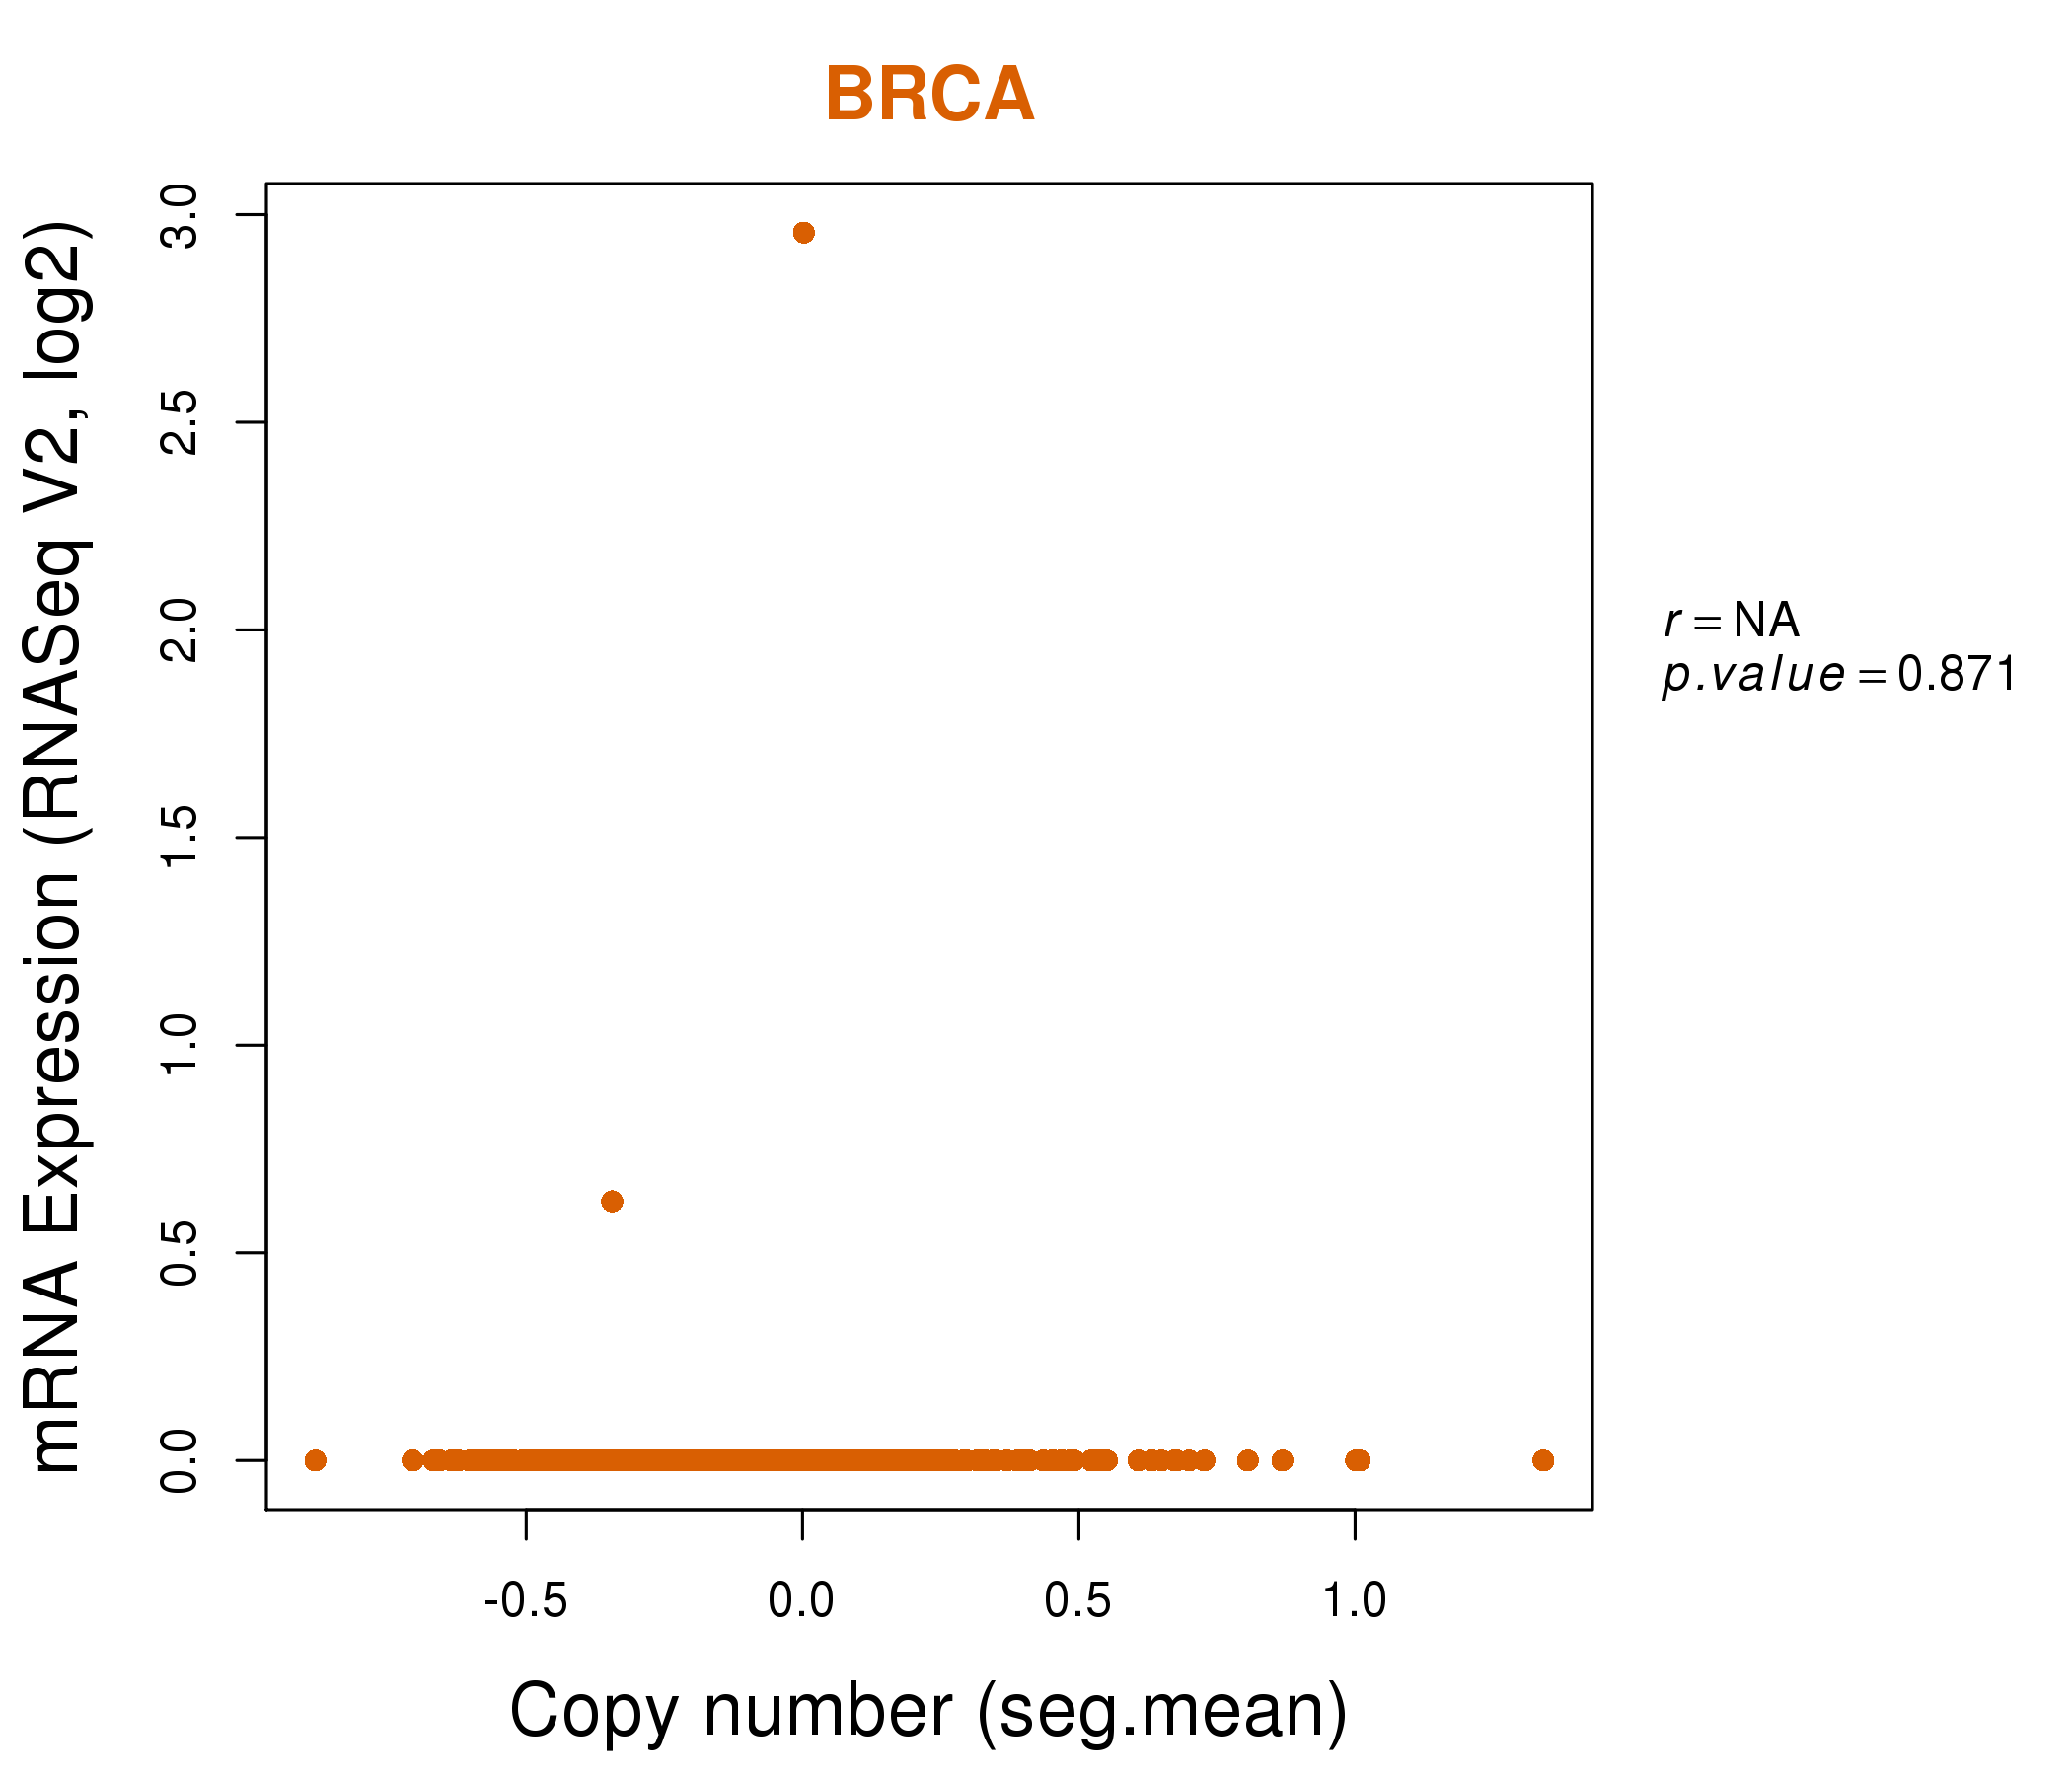
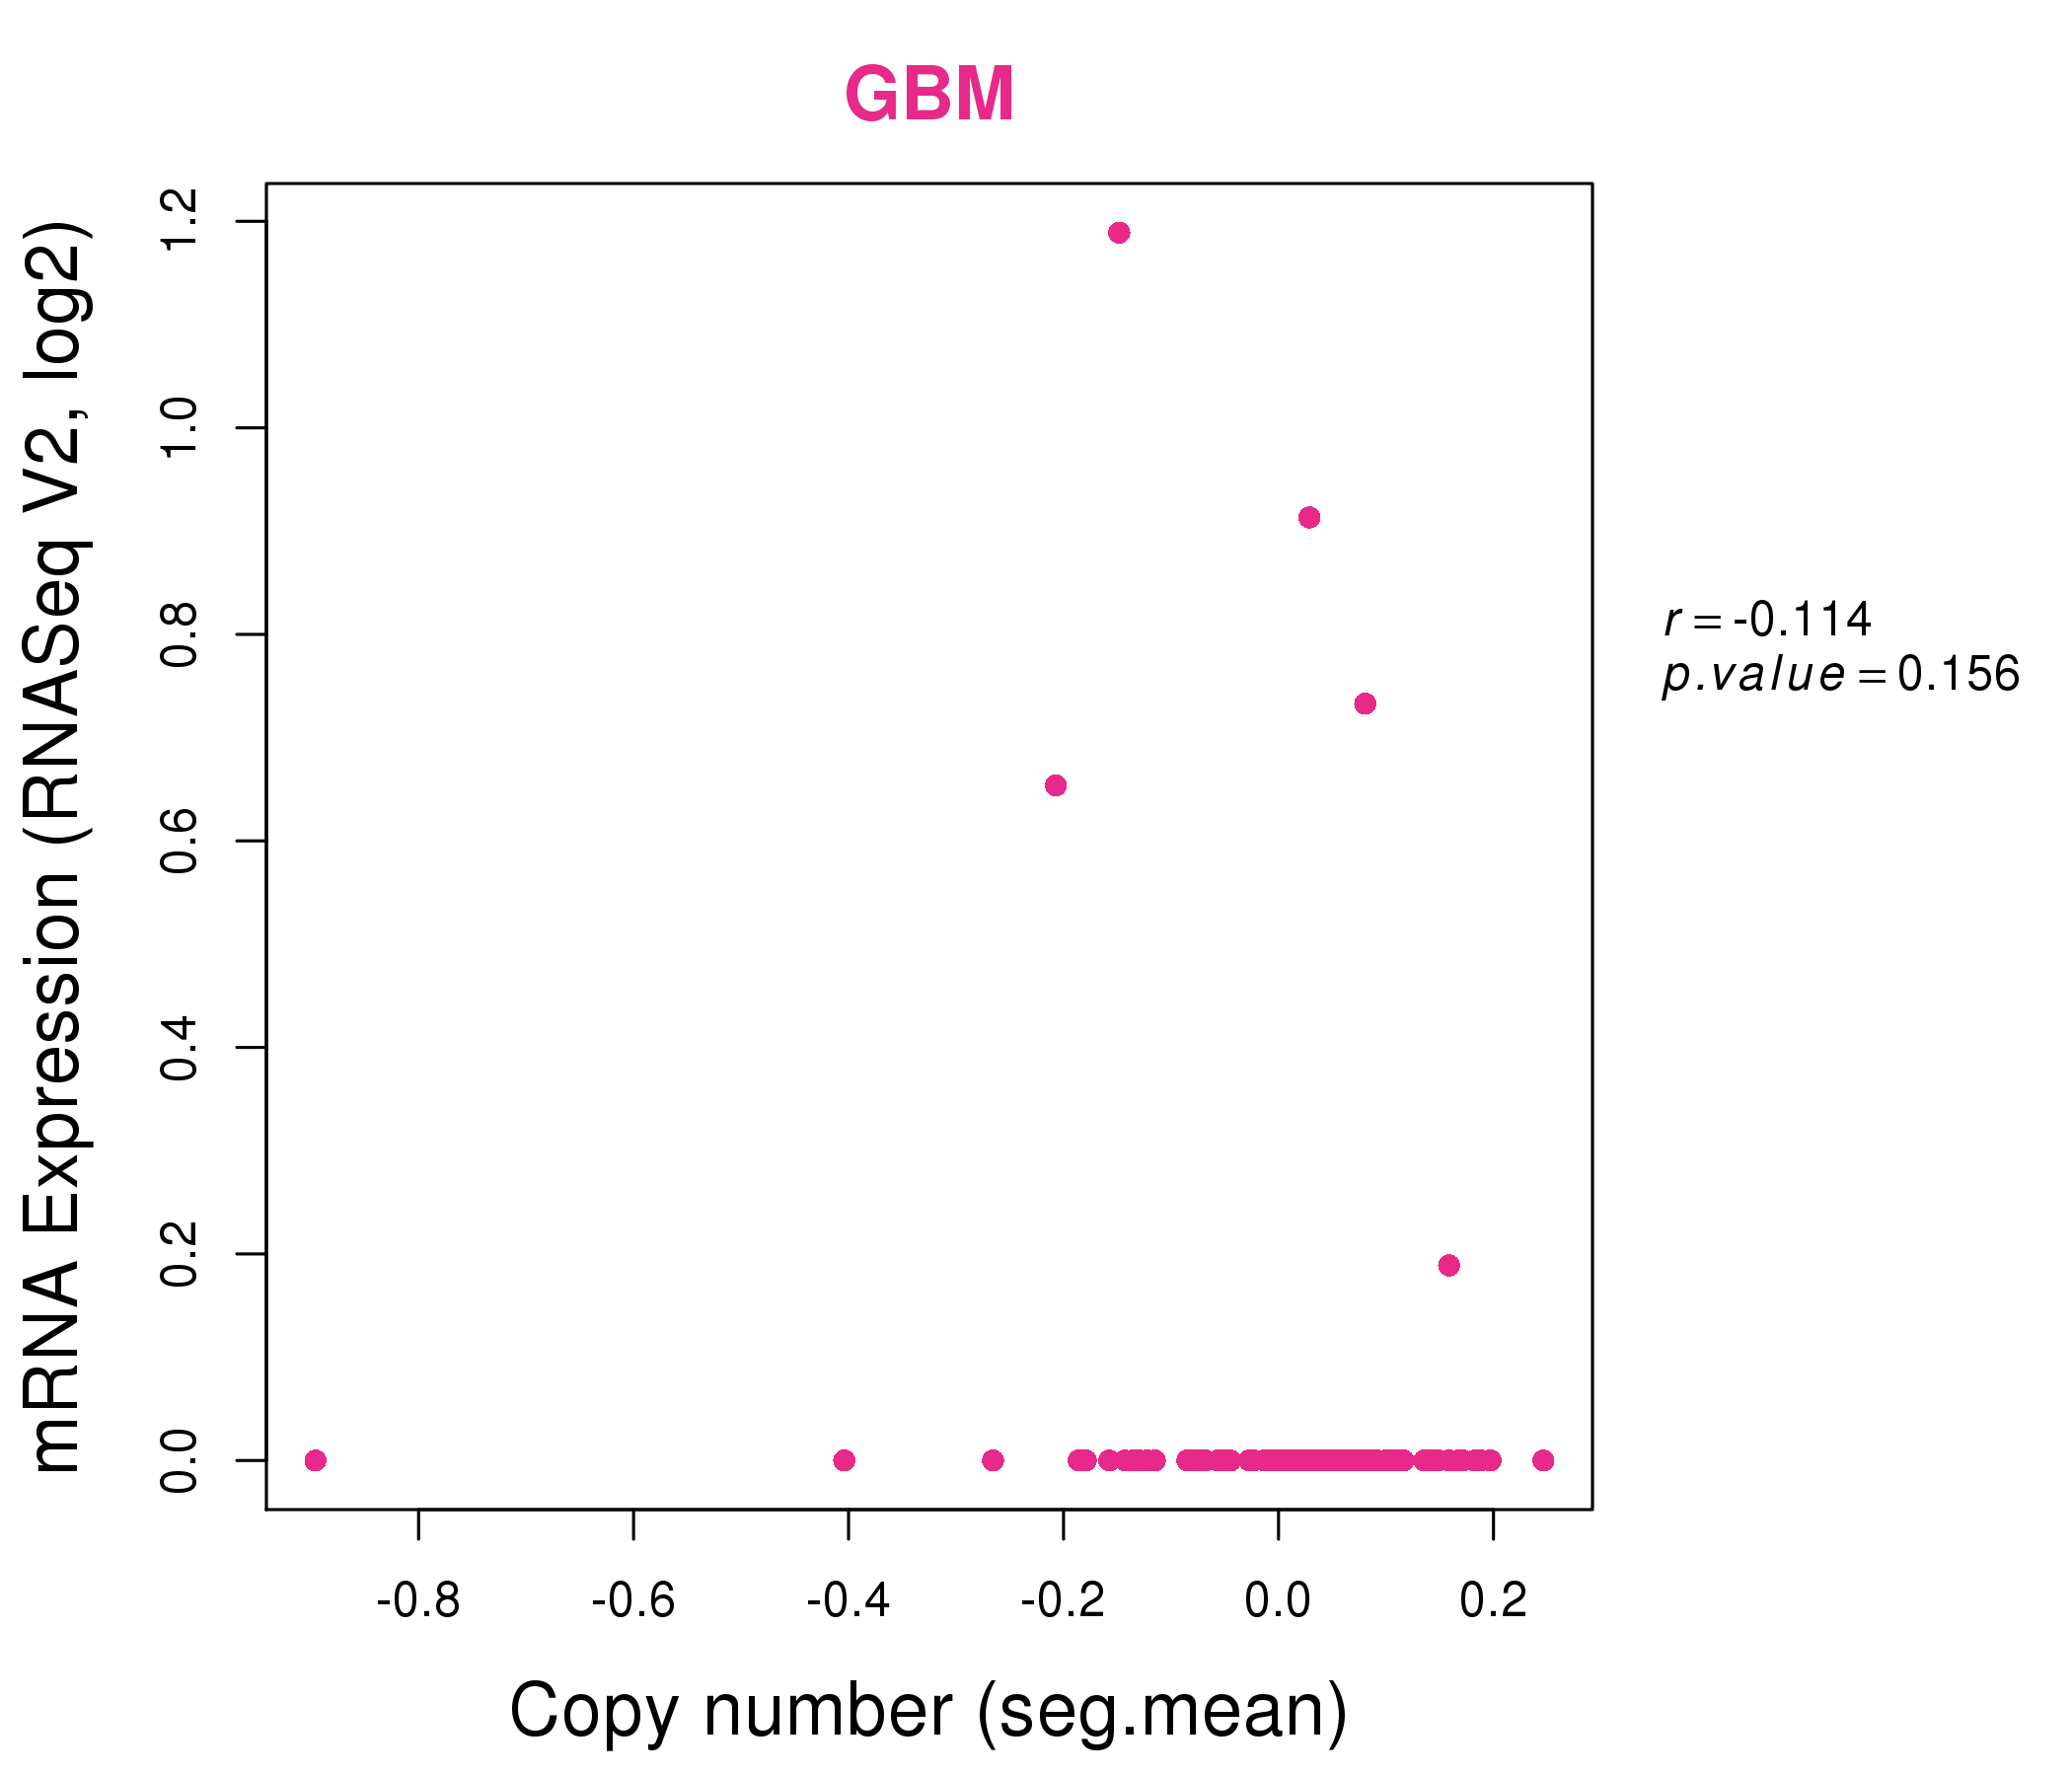
| * Normalized gene expression data of RNASeqV2 was extracted from TCGA using R package TCGA-Assembler. The URLs of all public data files on TCGA DCC data server were gathered at Jan-05-2015. Only eight cancer types have enough normal control samples for differential expression analysis. (t test, adjusted p<0.05 (using Benjamini-Hochberg FDR)) |
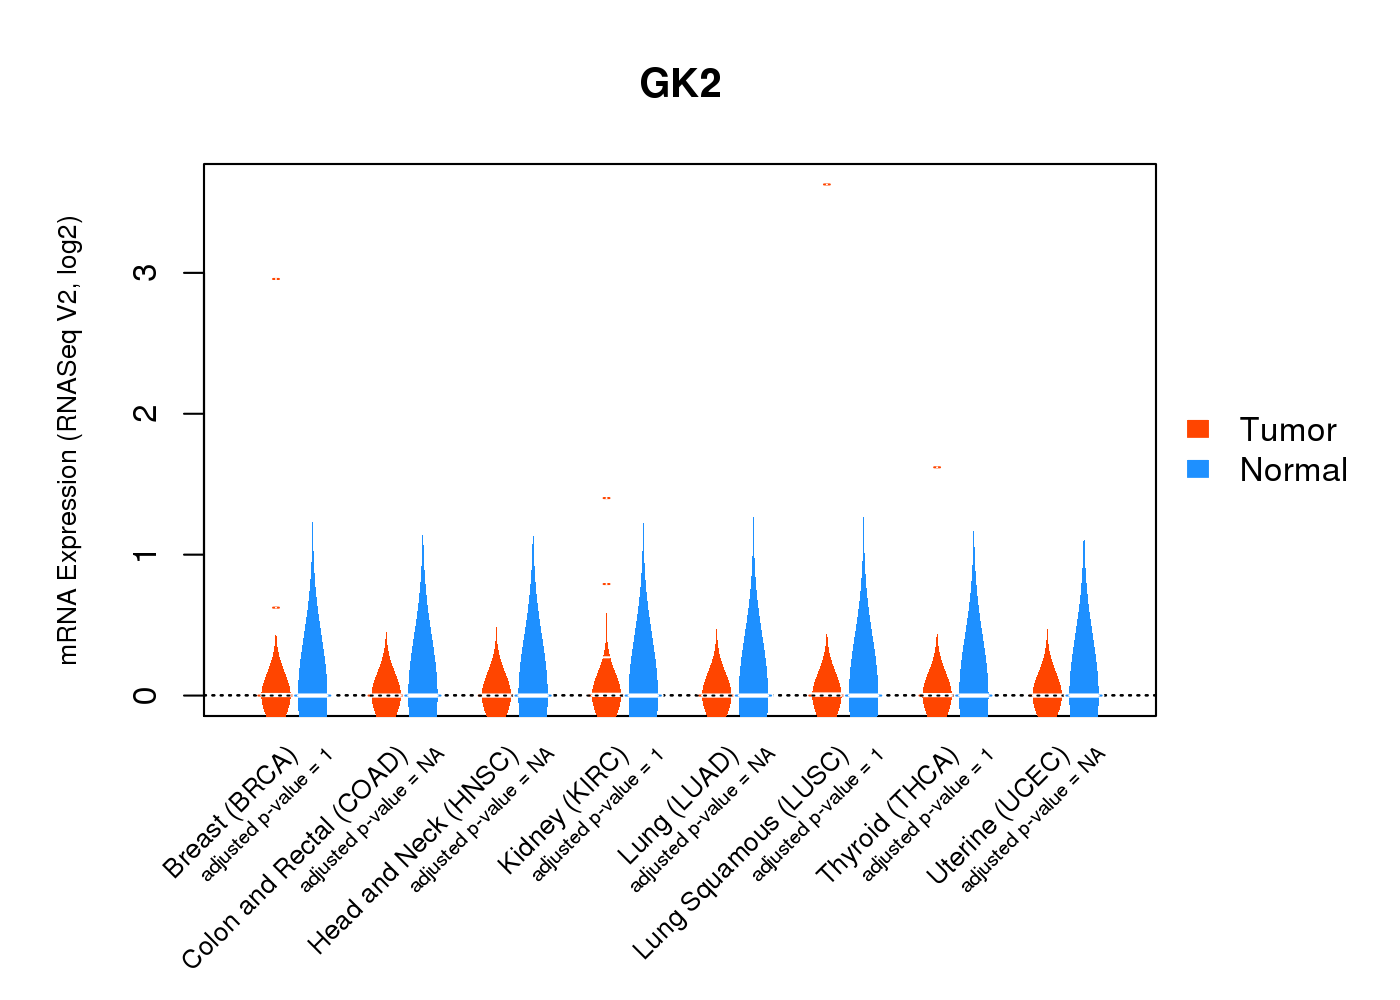 |
| Top |
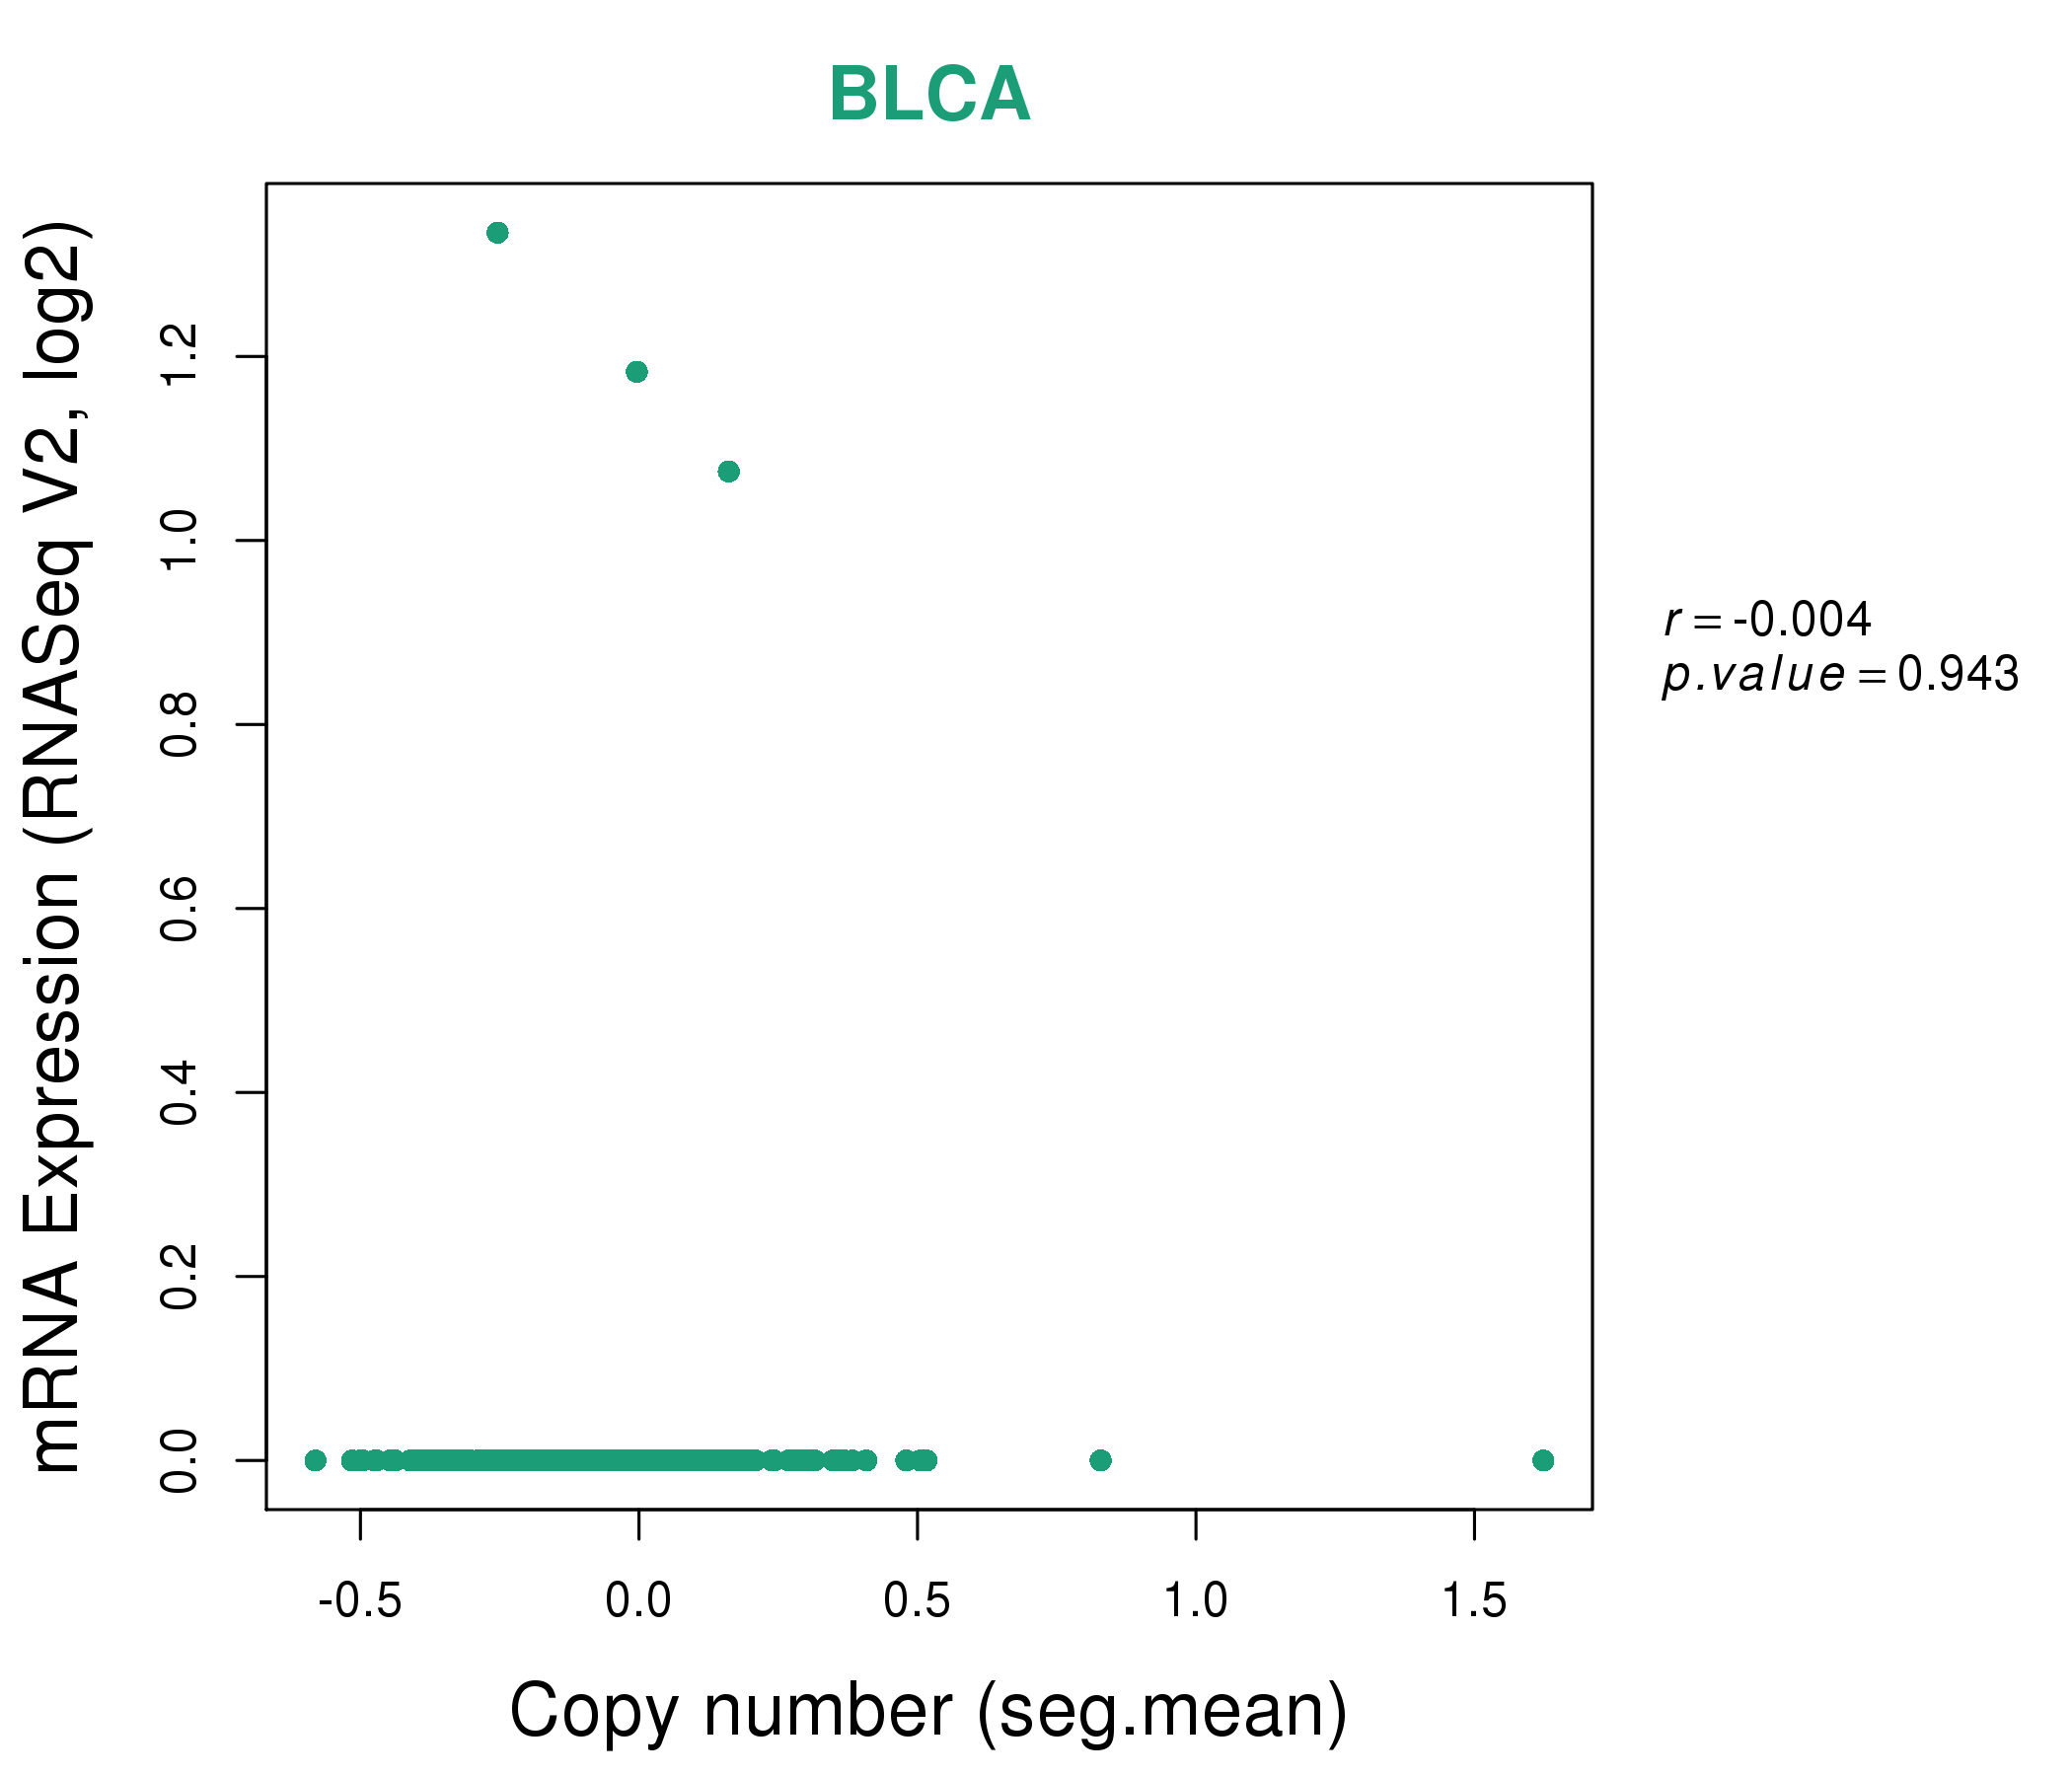
| * This plots show the correlation between CNV and gene expression. |
: Open all plots for all cancer types
 |
|
 |
|
| Top |
| Gene-Gene Network Information |
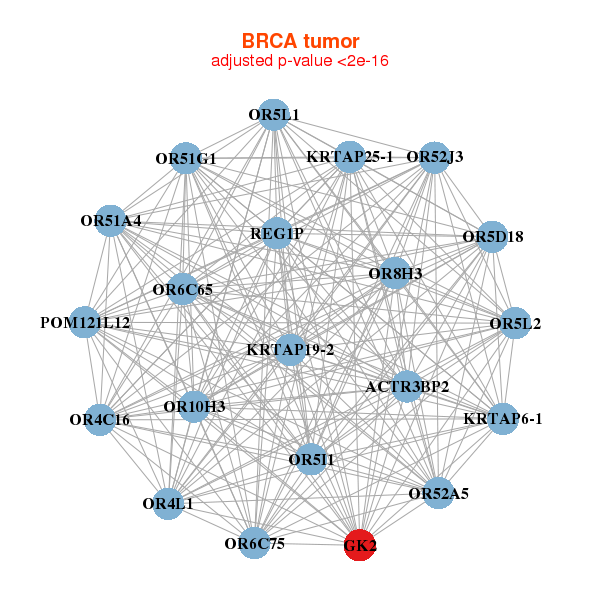
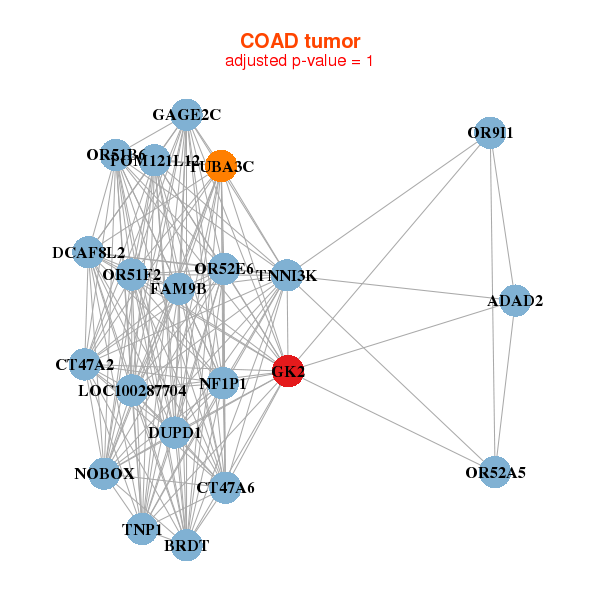
| * Co-Expression network figures were drawn using R package igraph. Only the top 20 genes with the highest correlations were shown. Red circle: input gene, orange circle: cell metabolism gene, sky circle: other gene |
: Open all plots for all cancer types
 |
|
| ACTR3BP2,GK2,KRTAP19-2,KRTAP25-1,KRTAP6-1,OR10H3,OR4C16, OR4L1,OR51A4,OR51G1,OR52A5,OR52J3,OR5D18,OR5I1, OR5L1,OR5L2,OR6C65,OR6C75,OR8H3,POM121L12,REG1P | ALB,ANGPTL3,BCO1,HNF1A-AS1,LINC00470___CHMP1B,DPY19L2,GK2, GNAT3,LOC153328,MAGEB2,MIA2,MTNR1B,OR5D16,PKHD1, POTEC,POTED,SCARNA15,SNORA71A,TAAR9,UGT2B15,UTS2 |
 |
|
| ADAD2,BRDT,CT47A2,CT47A6,DCAF8L2,DUPD1,FAM9B, GAGE2C,GK2,LOC100287704,NF1P1,NOBOX,OR51B6,OR51F2, OR52A5,OR52E6,OR9I1,POM121L12,TNNI3K,TNP1,TUBA3C | NA,NA,NA,NA,NA,NA,NA, NA,NA,NA,NA,NA,NA,NA, NA,NA,NA,NA,NA,NA,NA |
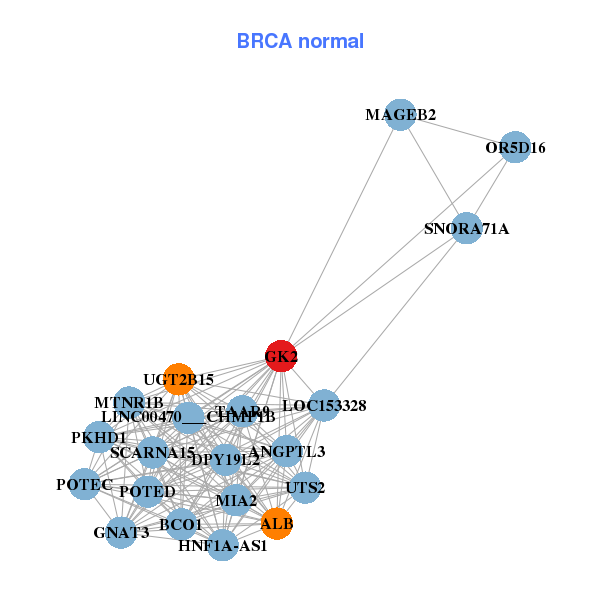
| * Co-Expression network figures were drawn using R package igraph. Only the top 20 genes with the highest correlations were shown. Red circle: input gene, orange circle: cell metabolism gene, sky circle: other gene |
: Open all plots for all cancer types
| Top |
: Open all interacting genes' information including KEGG pathway for all interacting genes from DAVID
| Top |
| Pharmacological Information for GK2 |
| There's no related Drug. |
| Top |
| Cross referenced IDs for GK2 |
| * We obtained these cross-references from Uniprot database. It covers 150 different DBs, 18 categories. http://www.uniprot.org/help/cross_references_section |
: Open all cross reference information
|
Copyright © 2016-Present - The Univsersity of Texas Health Science Center at Houston @ |