|
|||||||||||||||||||||||||||||||||||||||||||||||||||||||||||||||||||||||||||||||||||||||||||||||||||||||||||||||||||||||||||||||||||||||||||||||||||||||||||||||||||||||||||||||||||||||||||||||||||||||||||||||||||||||||||||||||||||||||||||||||||||||||||||||||||||||||||||||||||||||||||||||||||||||||||||||||||||||||||||||||||||||||||||||||||
| |
| Phenotypic Information (metabolism pathway, cancer, disease, phenome) |
| |
| |
| Gene-Gene Network Information: Co-Expression Network, Interacting Genes & KEGG |
| |
|


| Gene Summary for GLS2 |
| Top |
| Phenotypic Information for GLS2(metabolism pathway, cancer, disease, phenome) |
| Cancer | CGAP: GLS2 |
| Familial Cancer Database: GLS2 | |
| * This gene is included in those cancer gene databases. |
|
|
|
|
|
|
| |||||||||||||||||||||||||||||||||||||||||||||||||||||||||||||||||||||||||||||||||||||||||||||||||||||||||||||||||||||||||||||||||||||||||||||||||||||||||||||||||||||||||||||||||||||||||||||||||||||||||||||||||||||||||||||||||||||||||||||||||||||||||||||||||||||||||||||||||||||||||||||||||||||||||||||||||||||||||||||||||||||||||||||
Oncogene 1 | Significant driver gene in | ||||||||||||||||||||||||||||||||||||||||||||||||||||||||||||||||||||||||||||||||||||||||||||||||||||||||||||||||||||||||||||||||||||||||||||||||||||||||||||||||||||||||||||||||||||||||||||||||||||||||||||||||||||||||||||||||||||||||||||||||||||||||||||||||||||||||||||||||||||||||||||||||||||||||||||||||||||||||||||||||||||||||||||||||||
| cf) number; DB name 1 Oncogene; http://nar.oxfordjournals.org/content/35/suppl_1/D721.long, 2 Tumor Suppressor gene; https://bioinfo.uth.edu/TSGene/, 3 Cancer Gene Census; http://www.nature.com/nrc/journal/v4/n3/abs/nrc1299.html, 4 CancerGenes; http://nar.oxfordjournals.org/content/35/suppl_1/D721.long, 5 Network of Cancer Gene; http://ncg.kcl.ac.uk/index.php, 1Therapeutic Vulnerabilities in Cancer; http://cbio.mskcc.org/cancergenomics/statius/ |
| KEGG_ALANINE_ASPARTATE_AND_GLUTAMATE_METABOLISM KEGG_ARGININE_AND_PROLINE_METABOLISM KEGG_NITROGEN_METABOLISM REACTOME_METABOLISM_OF_AMINO_ACIDS_AND_DERIVATIVES | |
| OMIM | |
| Orphanet | |
| Disease | KEGG Disease: GLS2 |
| MedGen: GLS2 (Human Medical Genetics with Condition) | |
| ClinVar: GLS2 | |
| Phenotype | MGI: GLS2 (International Mouse Phenotyping Consortium) |
| PhenomicDB: GLS2 | |
| Mutations for GLS2 |
| * Under tables are showing count per each tissue to give us broad intuition about tissue specific mutation patterns.You can go to the detailed page for each mutation database's web site. |
| There's no structural variation information in COSMIC data for this gene. |
| * From mRNA Sanger sequences, Chitars2.0 arranged chimeric transcripts. This table shows GLS2 related fusion information. |
| ID | Head Gene | Tail Gene | Accession | Gene_a | qStart_a | qEnd_a | Chromosome_a | tStart_a | tEnd_a | Gene_a | qStart_a | qEnd_a | Chromosome_a | tStart_a | tEnd_a |
| AW894954 | GLS2 | 11 | 140 | 12 | 56880217 | 56880346 | GLS2 | 137 | 435 | 12 | 56876296 | 56876594 | |
| Top |
| Mutation type/ Tissue ID | brca | cns | cerv | endome | haematopo | kidn | Lintest | liver | lung | ns | ovary | pancre | prost | skin | stoma | thyro | urina | |||
| Total # sample | 1 | 1 | ||||||||||||||||||
| GAIN (# sample) | 1 | 1 | ||||||||||||||||||
| LOSS (# sample) |
| cf) Tissue ID; Tissue type (1; Breast, 2; Central_nervous_system, 3; Cervix, 4; Endometrium, 5; Haematopoietic_and_lymphoid_tissue, 6; Kidney, 7; Large_intestine, 8; Liver, 9; Lung, 10; NS, 11; Ovary, 12; Pancreas, 13; Prostate, 14; Skin, 15; Stomach, 16; Thyroid, 17; Urinary_tract) |
| Top |
|
 |
| Top |
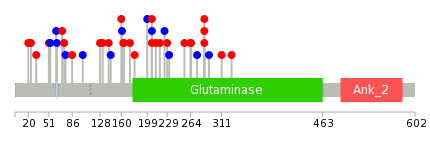
| Stat. for Non-Synonymous SNVs (# total SNVs=32) | (# total SNVs=10) |
 |  |
(# total SNVs=2) | (# total SNVs=0) |
 |
| Top |
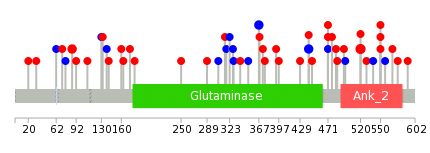
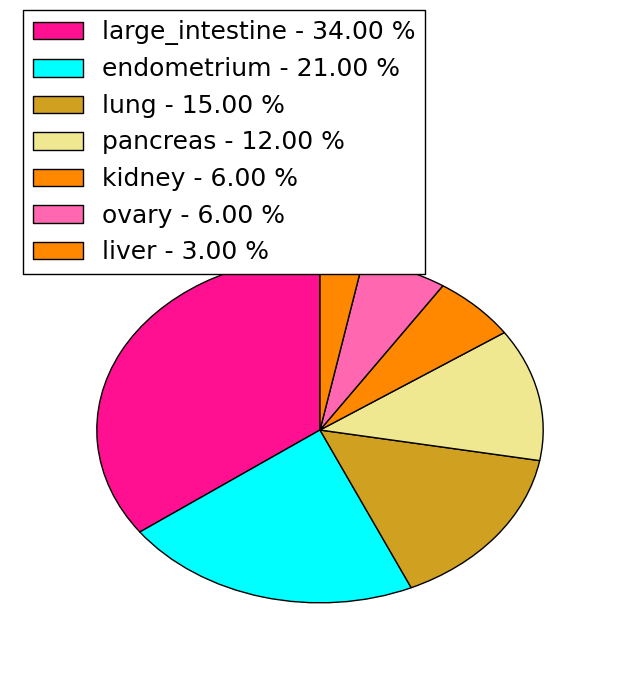
| * When you move the cursor on each content, you can see more deailed mutation information on the Tooltip. Those are primary_site,primary_histology,mutation(aa),pubmedID. |
| GRCh37 position | Mutation(aa) | Unique sampleID count |
| chr12:56865933-56865933 | p.R520C | 3 |
| chr12:56881845-56881845 | p.R20G | 2 |
| chr12:56868451-56868451 | p.L367L | 2 |
| chr12:56867050-56867050 | p.R471W | 2 |
| chr12:56874097-56874097 | p.R86Q | 2 |
| chr12:56867277-56867277 | p.G442G | 2 |
| chr12:56873574-56873574 | p.L132I | 1 |
| chr12:56866531-56866531 | p.K485T | 1 |
| chr12:56868425-56868425 | p.T376I | 1 |
| chr12:56868895-56868895 | p.? | 1 |
| Top |
|
 |
| Point Mutation/ Tissue ID | 1 | 2 | 3 | 4 | 5 | 6 | 7 | 8 | 9 | 10 | 11 | 12 | 13 | 14 | 15 | 16 | 17 | 18 | 19 | 20 |
| # sample | 1 | 7 | 2 | 2 | 5 | 1 | 1 | 2 | 8 | 1 | 8 | |||||||||
| # mutation | 1 | 7 | 2 | 2 | 5 | 1 | 1 | 3 | 8 | 1 | 9 | |||||||||
| nonsynonymous SNV | 6 | 1 | 2 | 3 | 1 | 1 | 2 | 7 | 5 | |||||||||||
| synonymous SNV | 1 | 1 | 1 | 2 | 1 | 1 | 1 | 4 |
| cf) Tissue ID; Tissue type (1; BLCA[Bladder Urothelial Carcinoma], 2; BRCA[Breast invasive carcinoma], 3; CESC[Cervical squamous cell carcinoma and endocervical adenocarcinoma], 4; COAD[Colon adenocarcinoma], 5; GBM[Glioblastoma multiforme], 6; Glioma Low Grade, 7; HNSC[Head and Neck squamous cell carcinoma], 8; KICH[Kidney Chromophobe], 9; KIRC[Kidney renal clear cell carcinoma], 10; KIRP[Kidney renal papillary cell carcinoma], 11; LAML[Acute Myeloid Leukemia], 12; LUAD[Lung adenocarcinoma], 13; LUSC[Lung squamous cell carcinoma], 14; OV[Ovarian serous cystadenocarcinoma ], 15; PAAD[Pancreatic adenocarcinoma], 16; PRAD[Prostate adenocarcinoma], 17; SKCM[Skin Cutaneous Melanoma], 18:STAD[Stomach adenocarcinoma], 19:THCA[Thyroid carcinoma], 20:UCEC[Uterine Corpus Endometrial Carcinoma]) |
| Top |
| * We represented just top 10 SNVs. When you move the cursor on each content, you can see more deailed mutation information on the Tooltip. Those are primary_site, primary_histology, mutation(aa), pubmedID. |
| Genomic Position | Mutation(aa) | Unique sampleID count |
| chr12:56867050 | p.R206W,GLS2 | 2 |
| chr12:56872043 | p.E51K,GLS2 | 1 |
| chr12:56881809 | p.R255H,GLS2 | 1 |
| chr12:56865592 | p.D24H,GLS2 | 1 |
| chr12:56867069 | p.G232G,GLS2 | 1 |
| chr12:56872853 | p.A180T | 1 |
| chr12:56881845 | p.A229V,GLS2 | 1 |
| chr12:56865620 | p.E173K | 1 |
| chr12:56867316 | p.L225L,GLS2 | 1 |
| chr12:56872883 | p.R218W,GLS2 | 1 |
| * Copy number data were extracted from TCGA using R package TCGA-Assembler. The URLs of all public data files on TCGA DCC data server were gathered on Jan-05-2015. Function ProcessCNAData in TCGA-Assembler package was used to obtain gene-level copy number value which is calculated as the average copy number of the genomic region of a gene. |
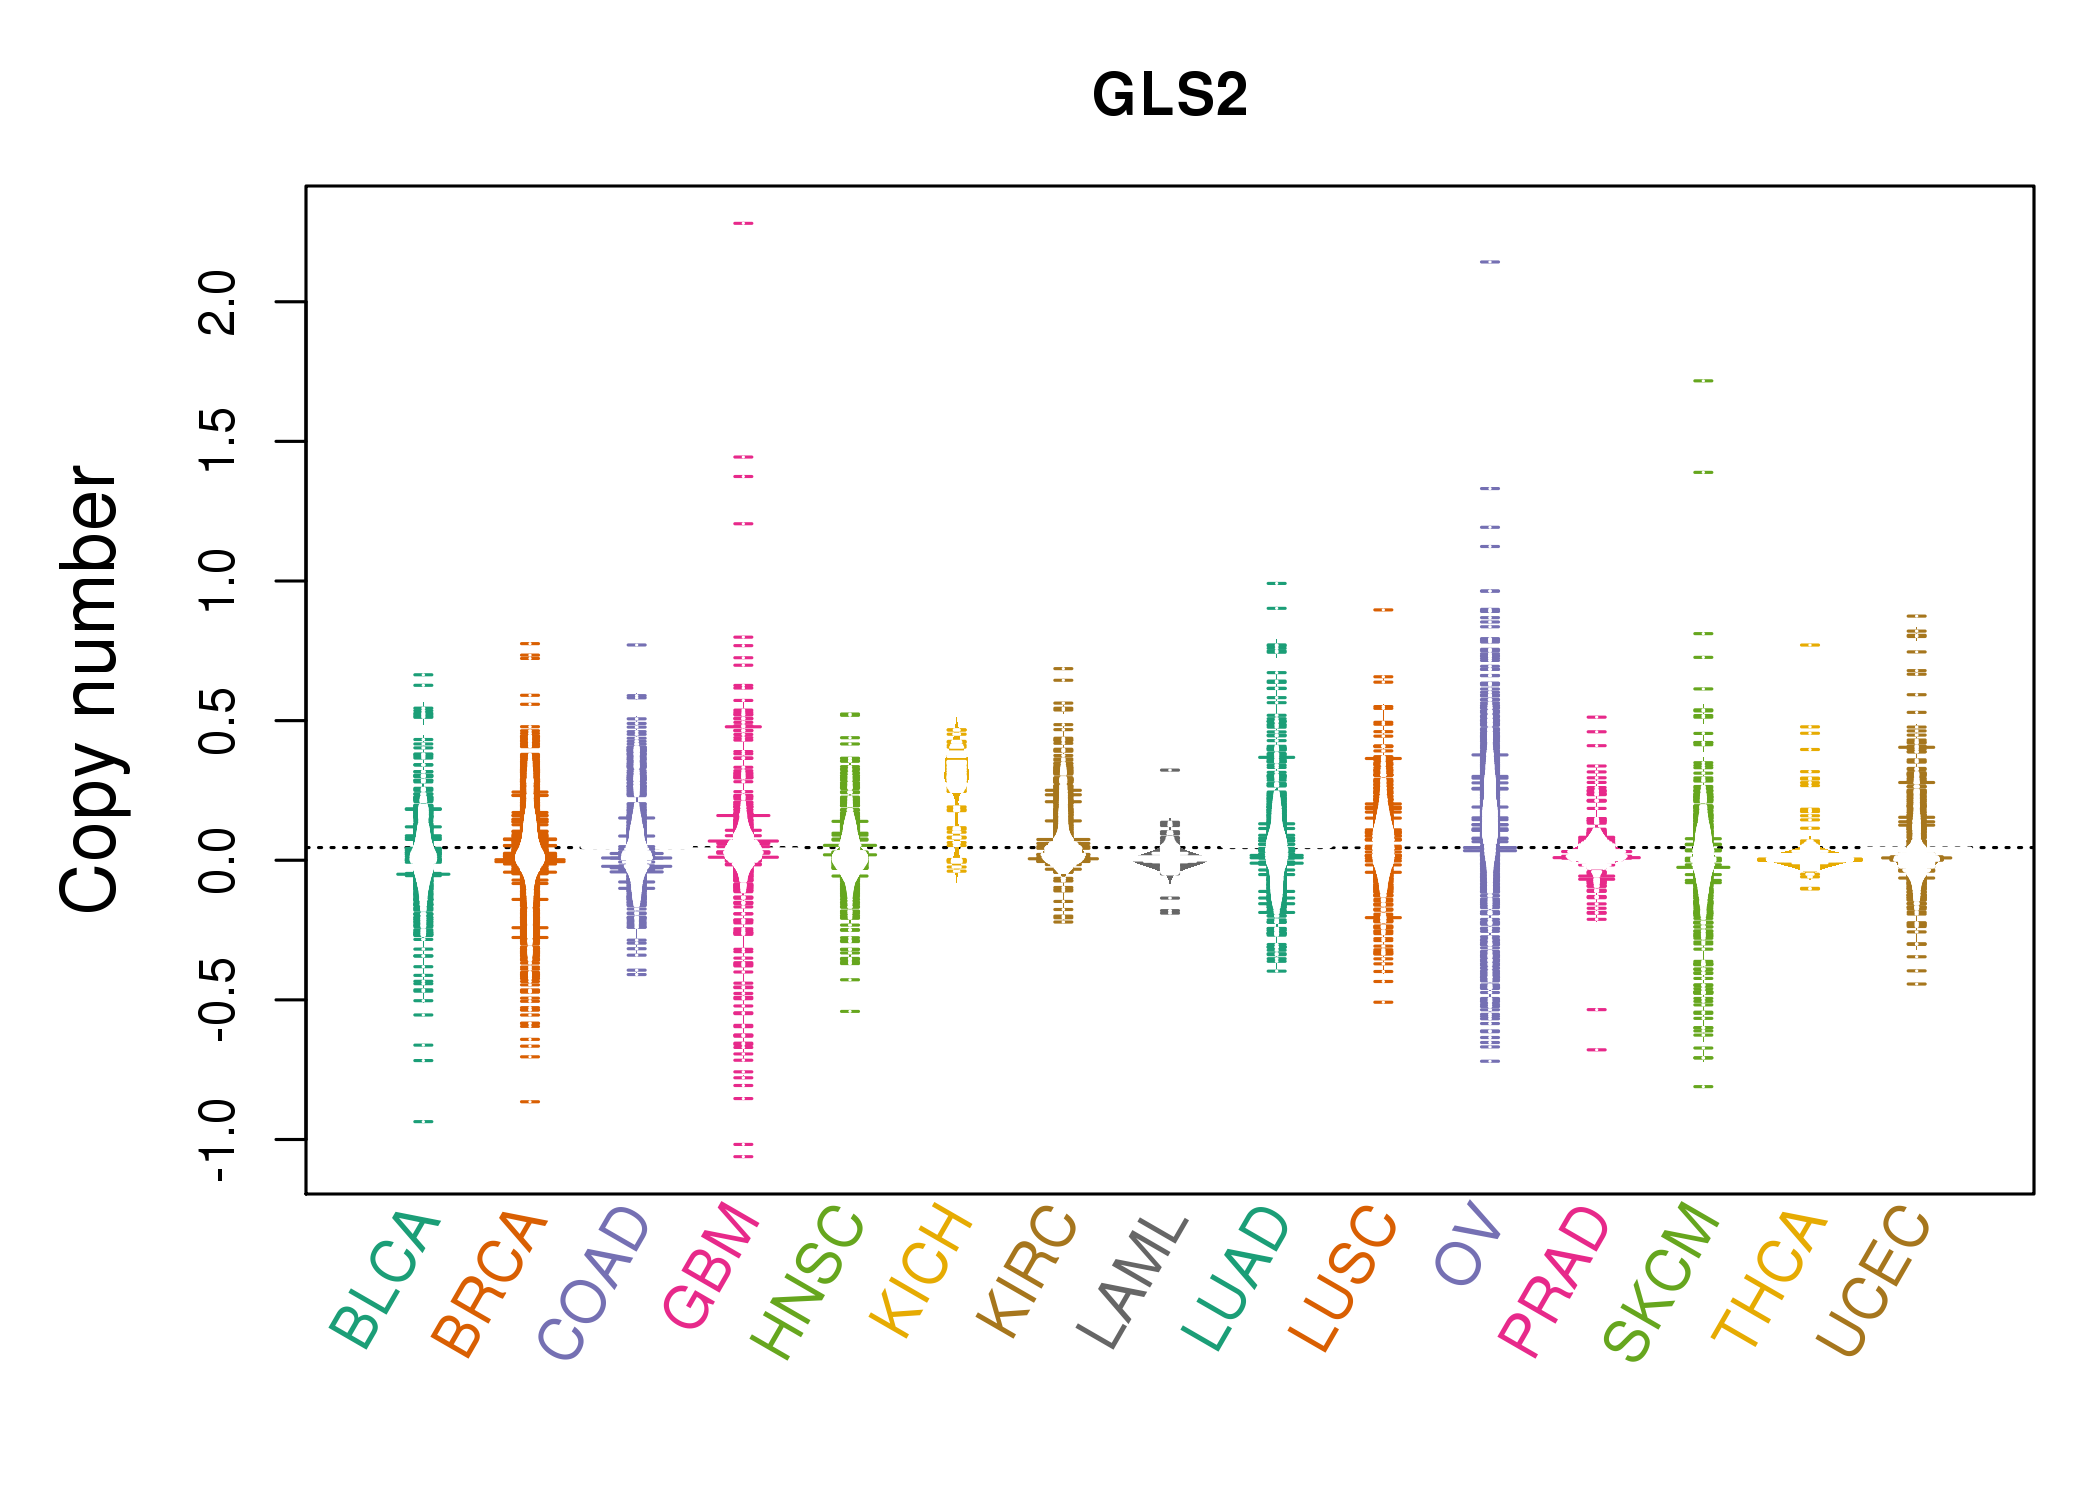 |
| cf) Tissue ID[Tissue type]: BLCA[Bladder Urothelial Carcinoma], BRCA[Breast invasive carcinoma], CESC[Cervical squamous cell carcinoma and endocervical adenocarcinoma], COAD[Colon adenocarcinoma], GBM[Glioblastoma multiforme], Glioma Low Grade, HNSC[Head and Neck squamous cell carcinoma], KICH[Kidney Chromophobe], KIRC[Kidney renal clear cell carcinoma], KIRP[Kidney renal papillary cell carcinoma], LAML[Acute Myeloid Leukemia], LUAD[Lung adenocarcinoma], LUSC[Lung squamous cell carcinoma], OV[Ovarian serous cystadenocarcinoma ], PAAD[Pancreatic adenocarcinoma], PRAD[Prostate adenocarcinoma], SKCM[Skin Cutaneous Melanoma], STAD[Stomach adenocarcinoma], THCA[Thyroid carcinoma], UCEC[Uterine Corpus Endometrial Carcinoma] |
| Top |
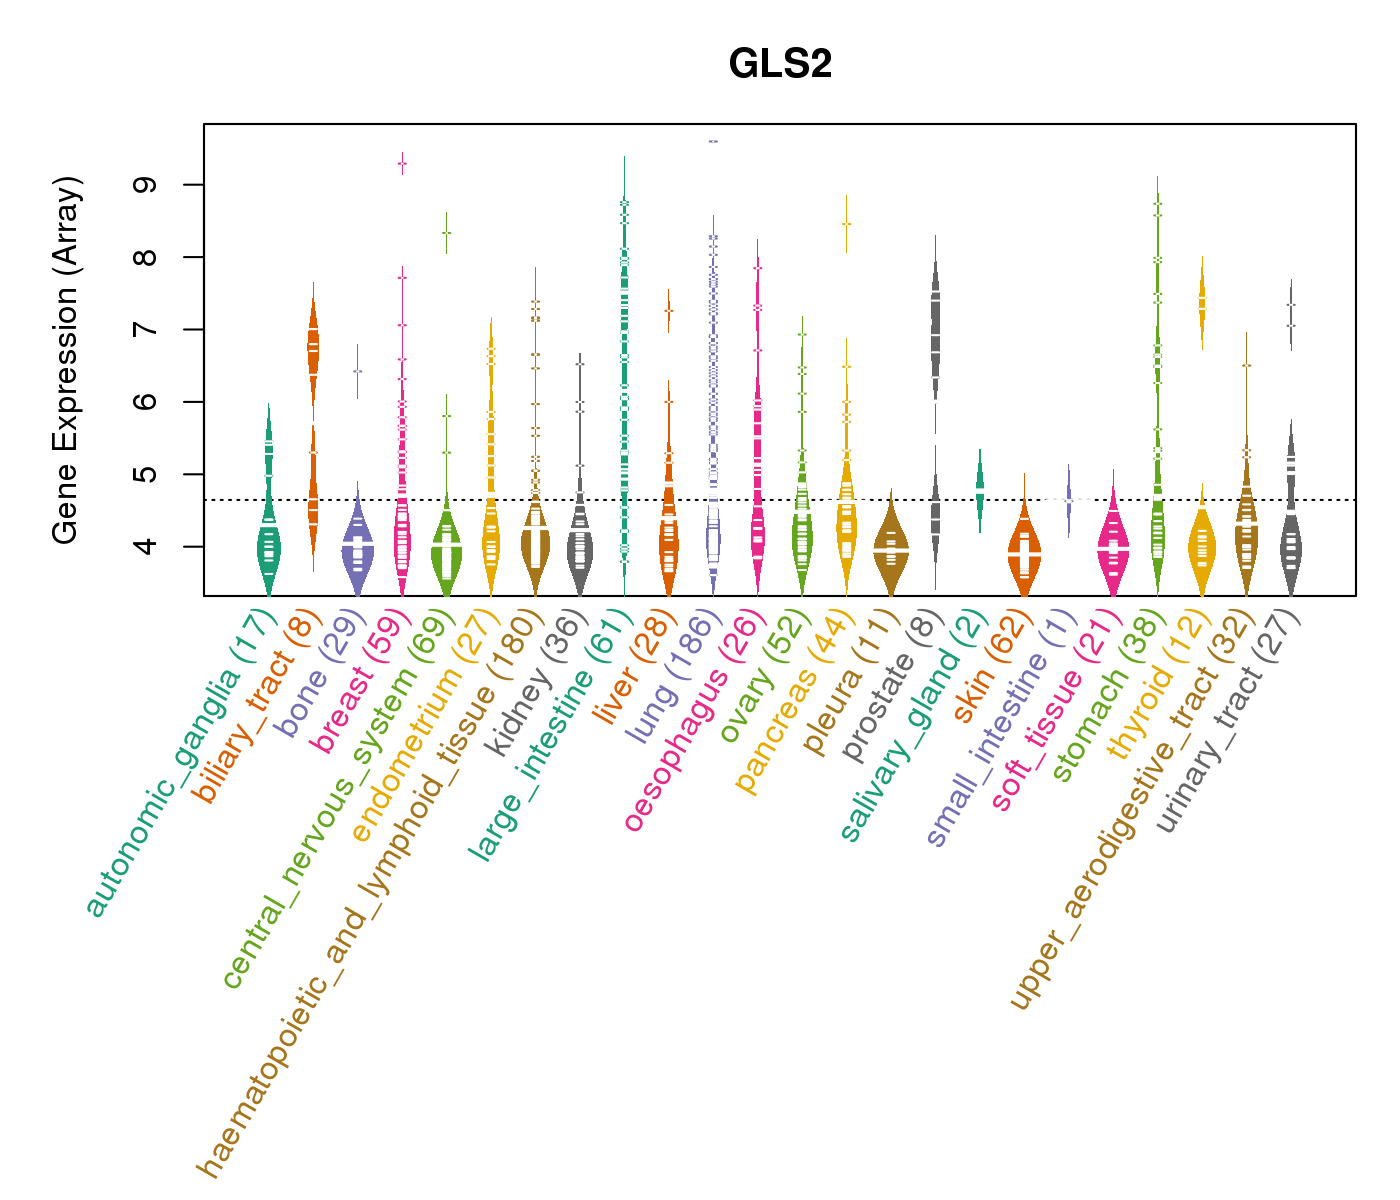
| Gene Expression for GLS2 |
| * CCLE gene expression data were extracted from CCLE_Expression_Entrez_2012-10-18.res: Gene-centric RMA-normalized mRNA expression data. |
 |
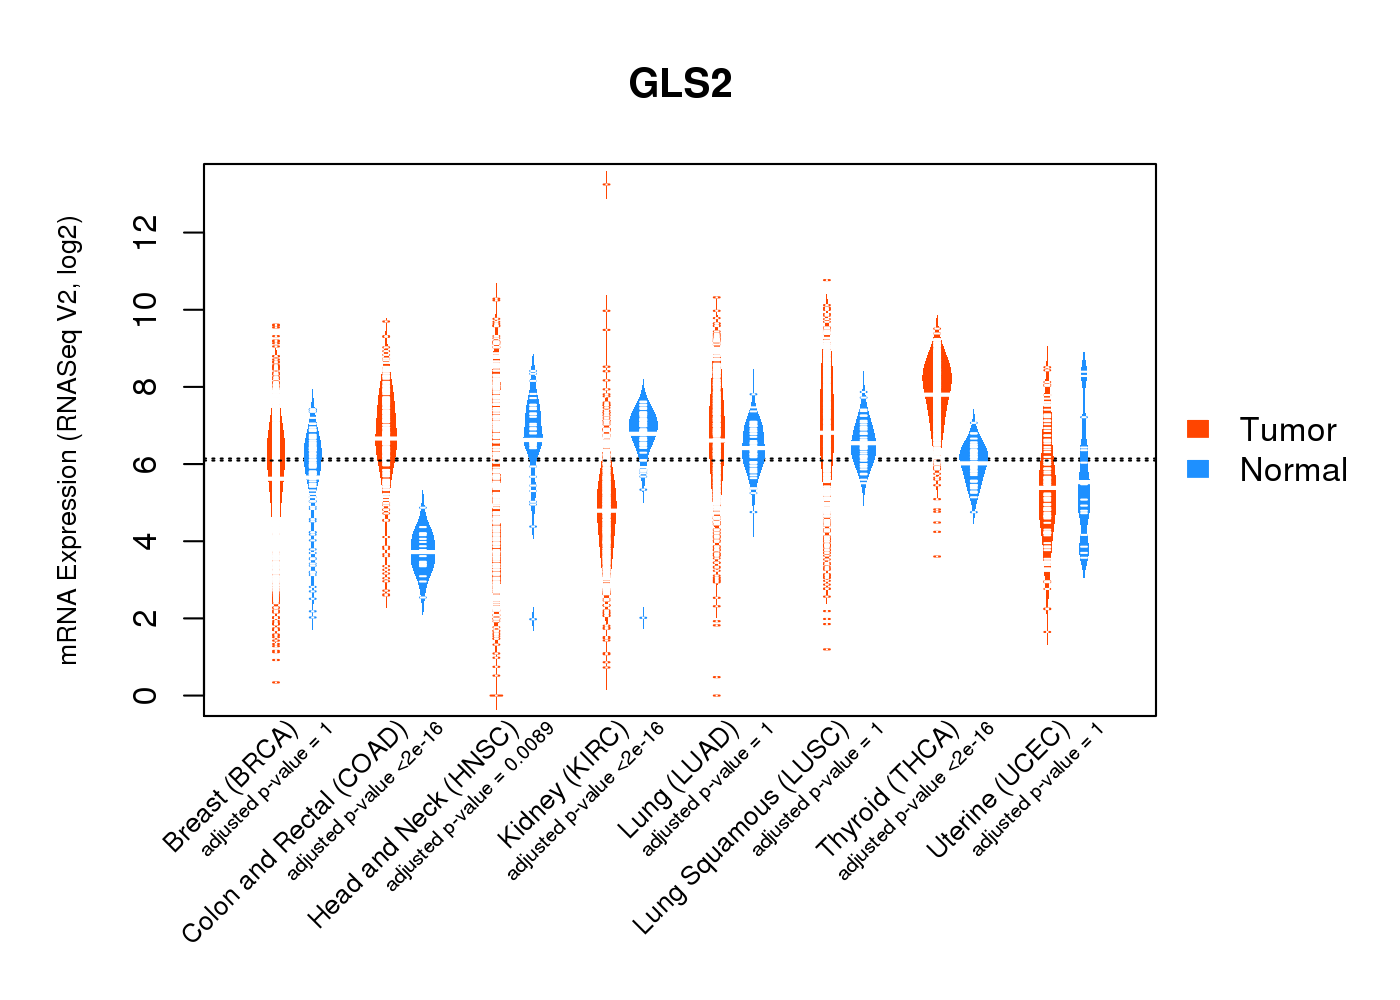
| * Normalized gene expression data of RNASeqV2 was extracted from TCGA using R package TCGA-Assembler. The URLs of all public data files on TCGA DCC data server were gathered at Jan-05-2015. Only eight cancer types have enough normal control samples for differential expression analysis. (t test, adjusted p<0.05 (using Benjamini-Hochberg FDR)) |
 |
| Top |
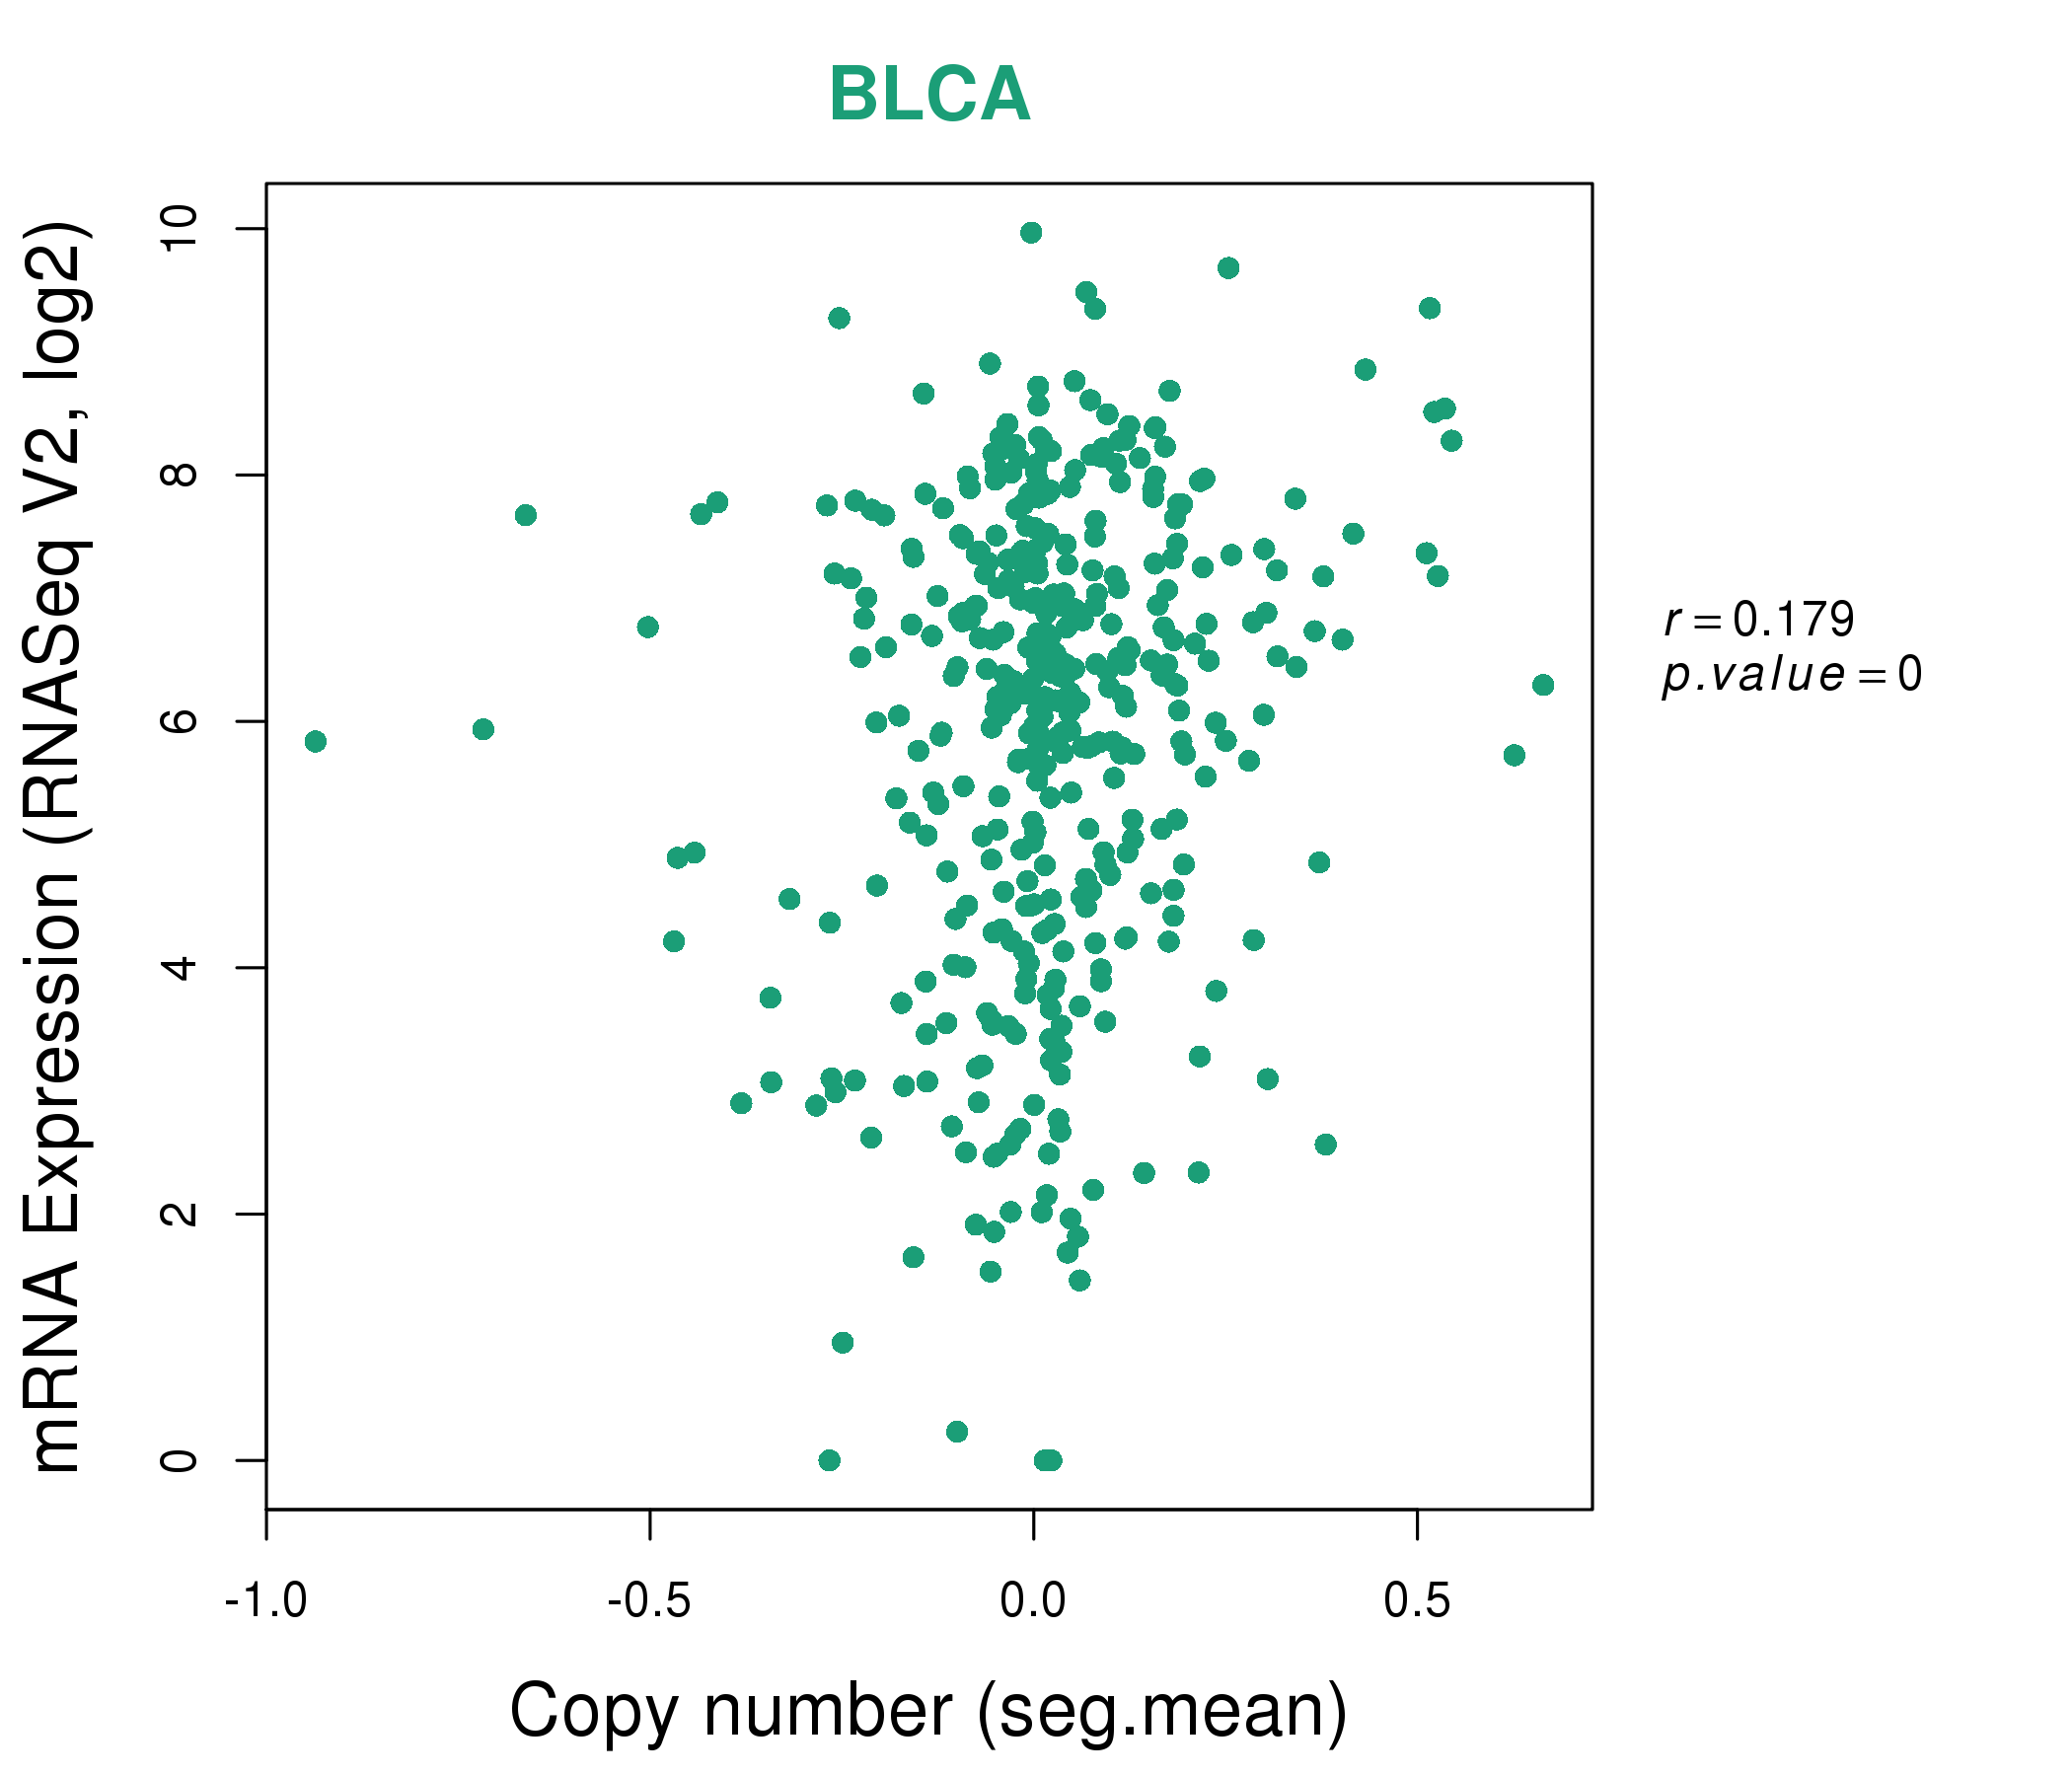
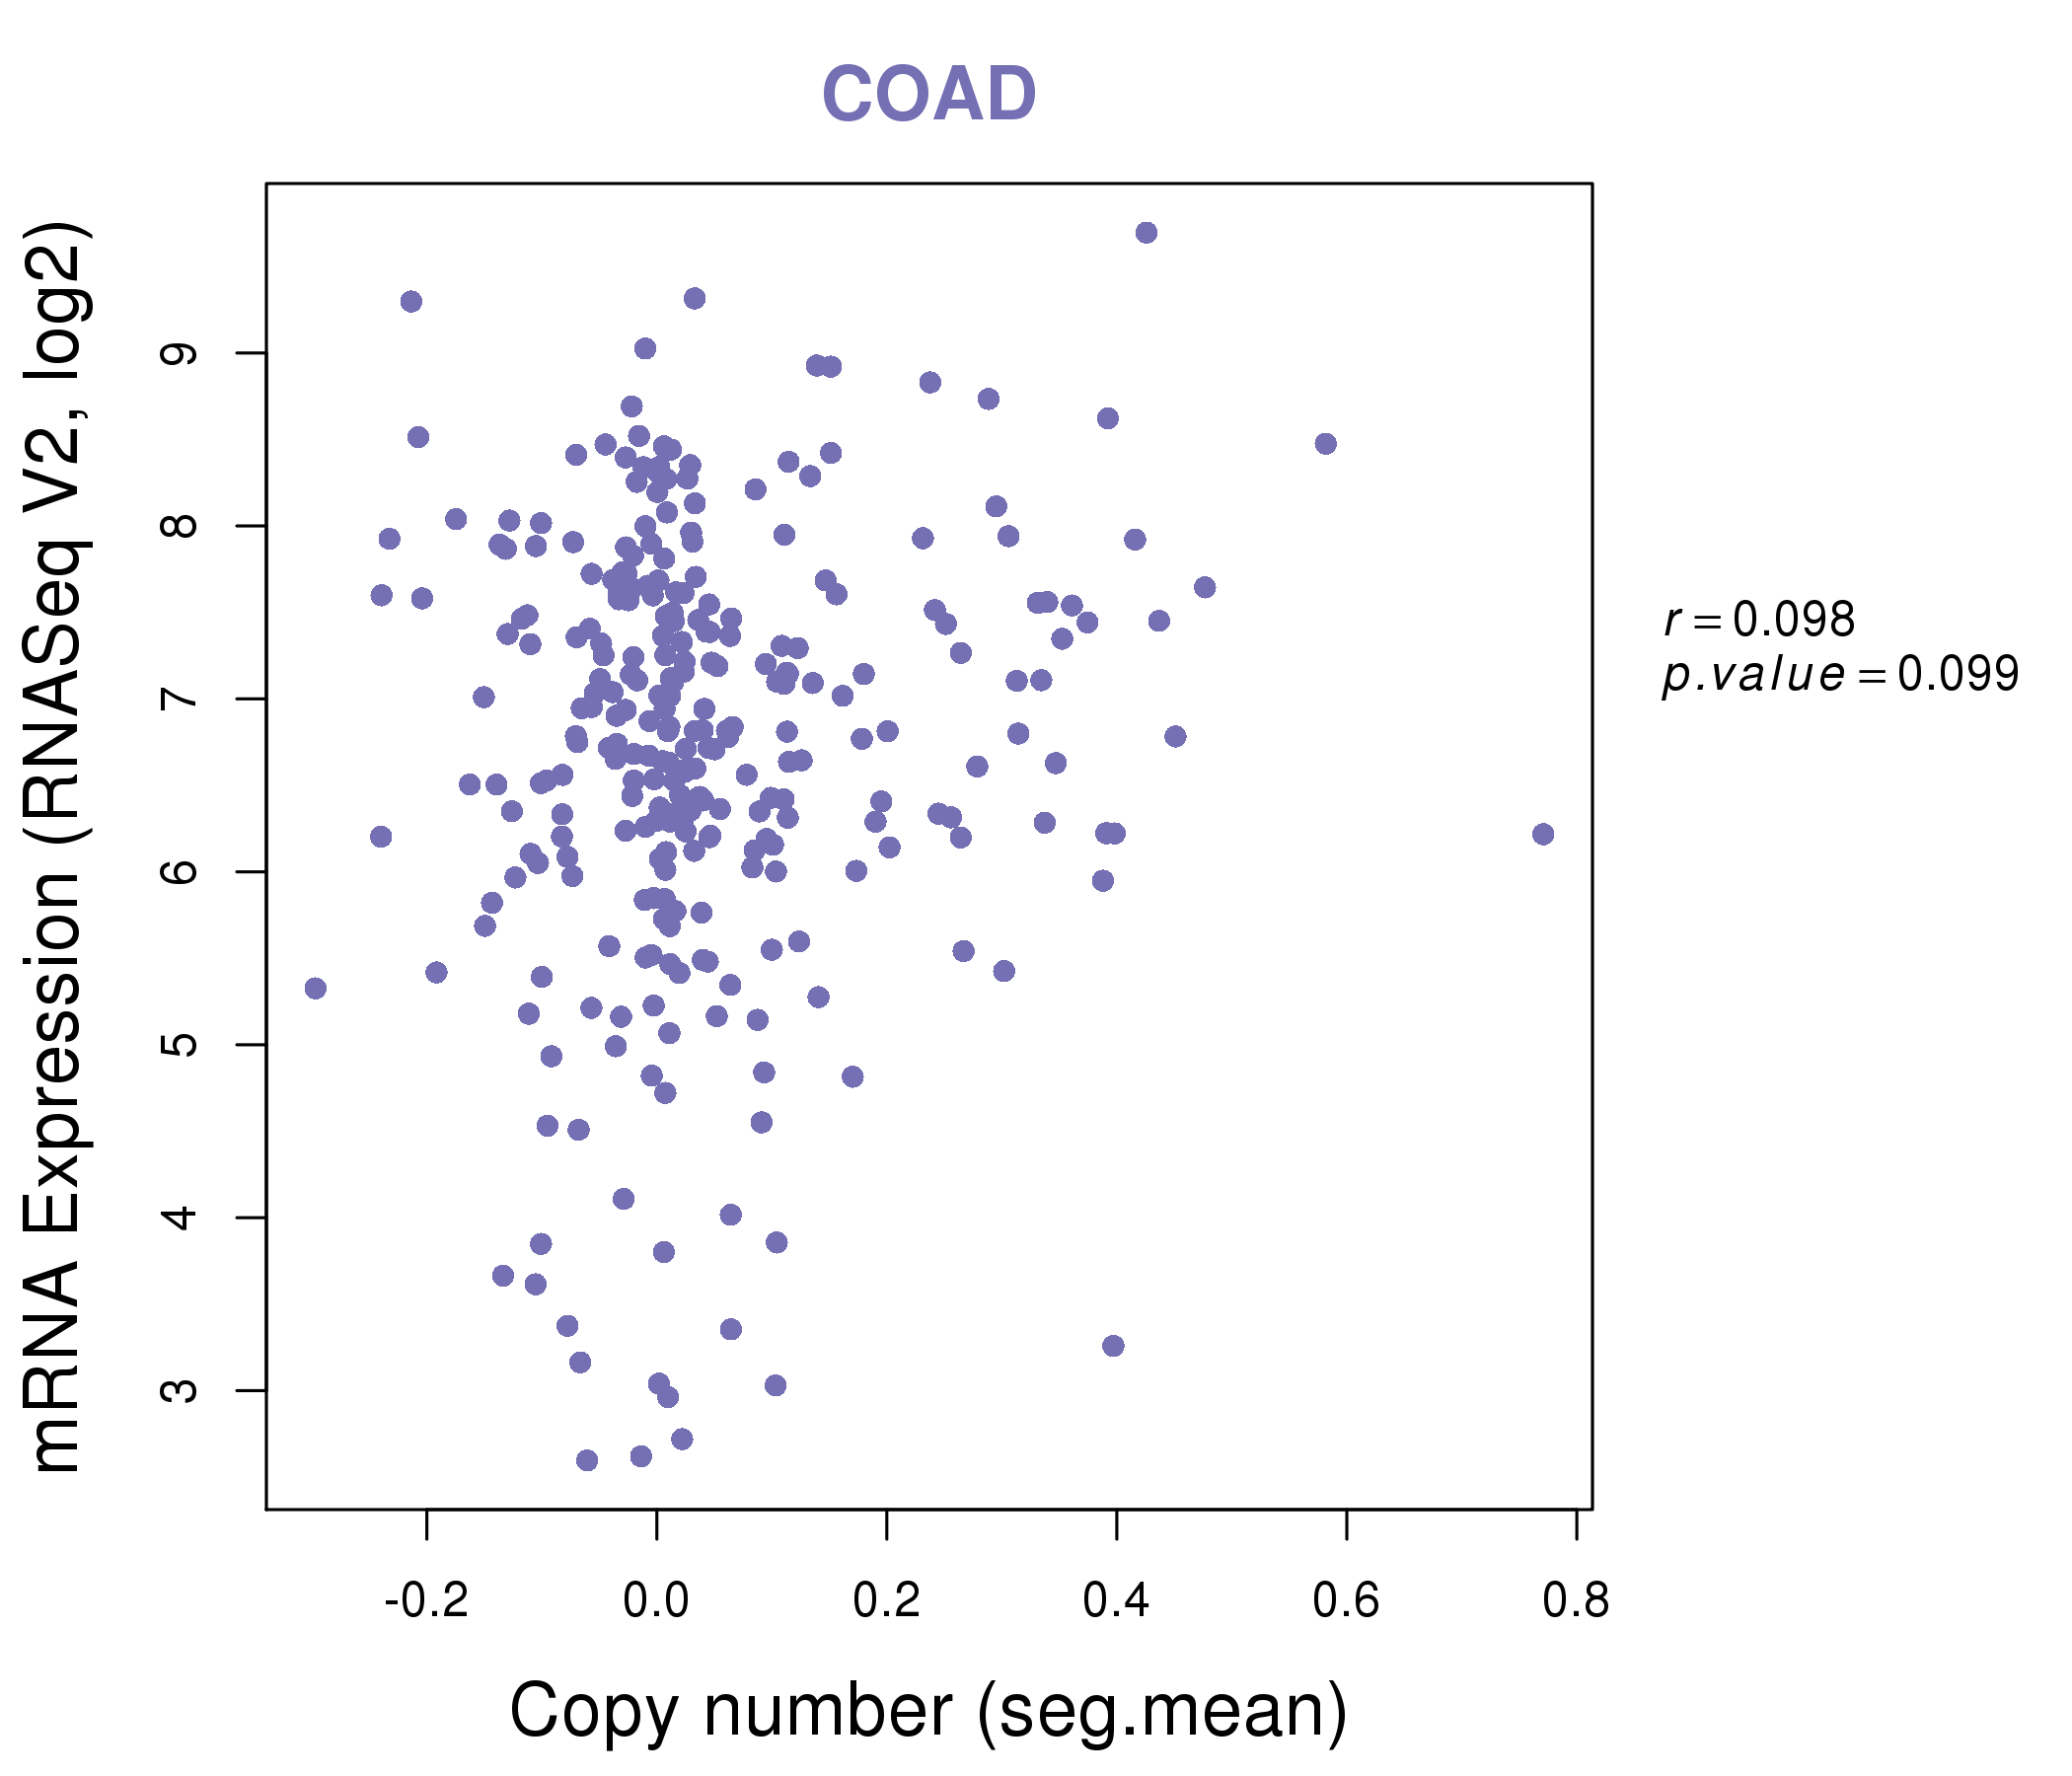
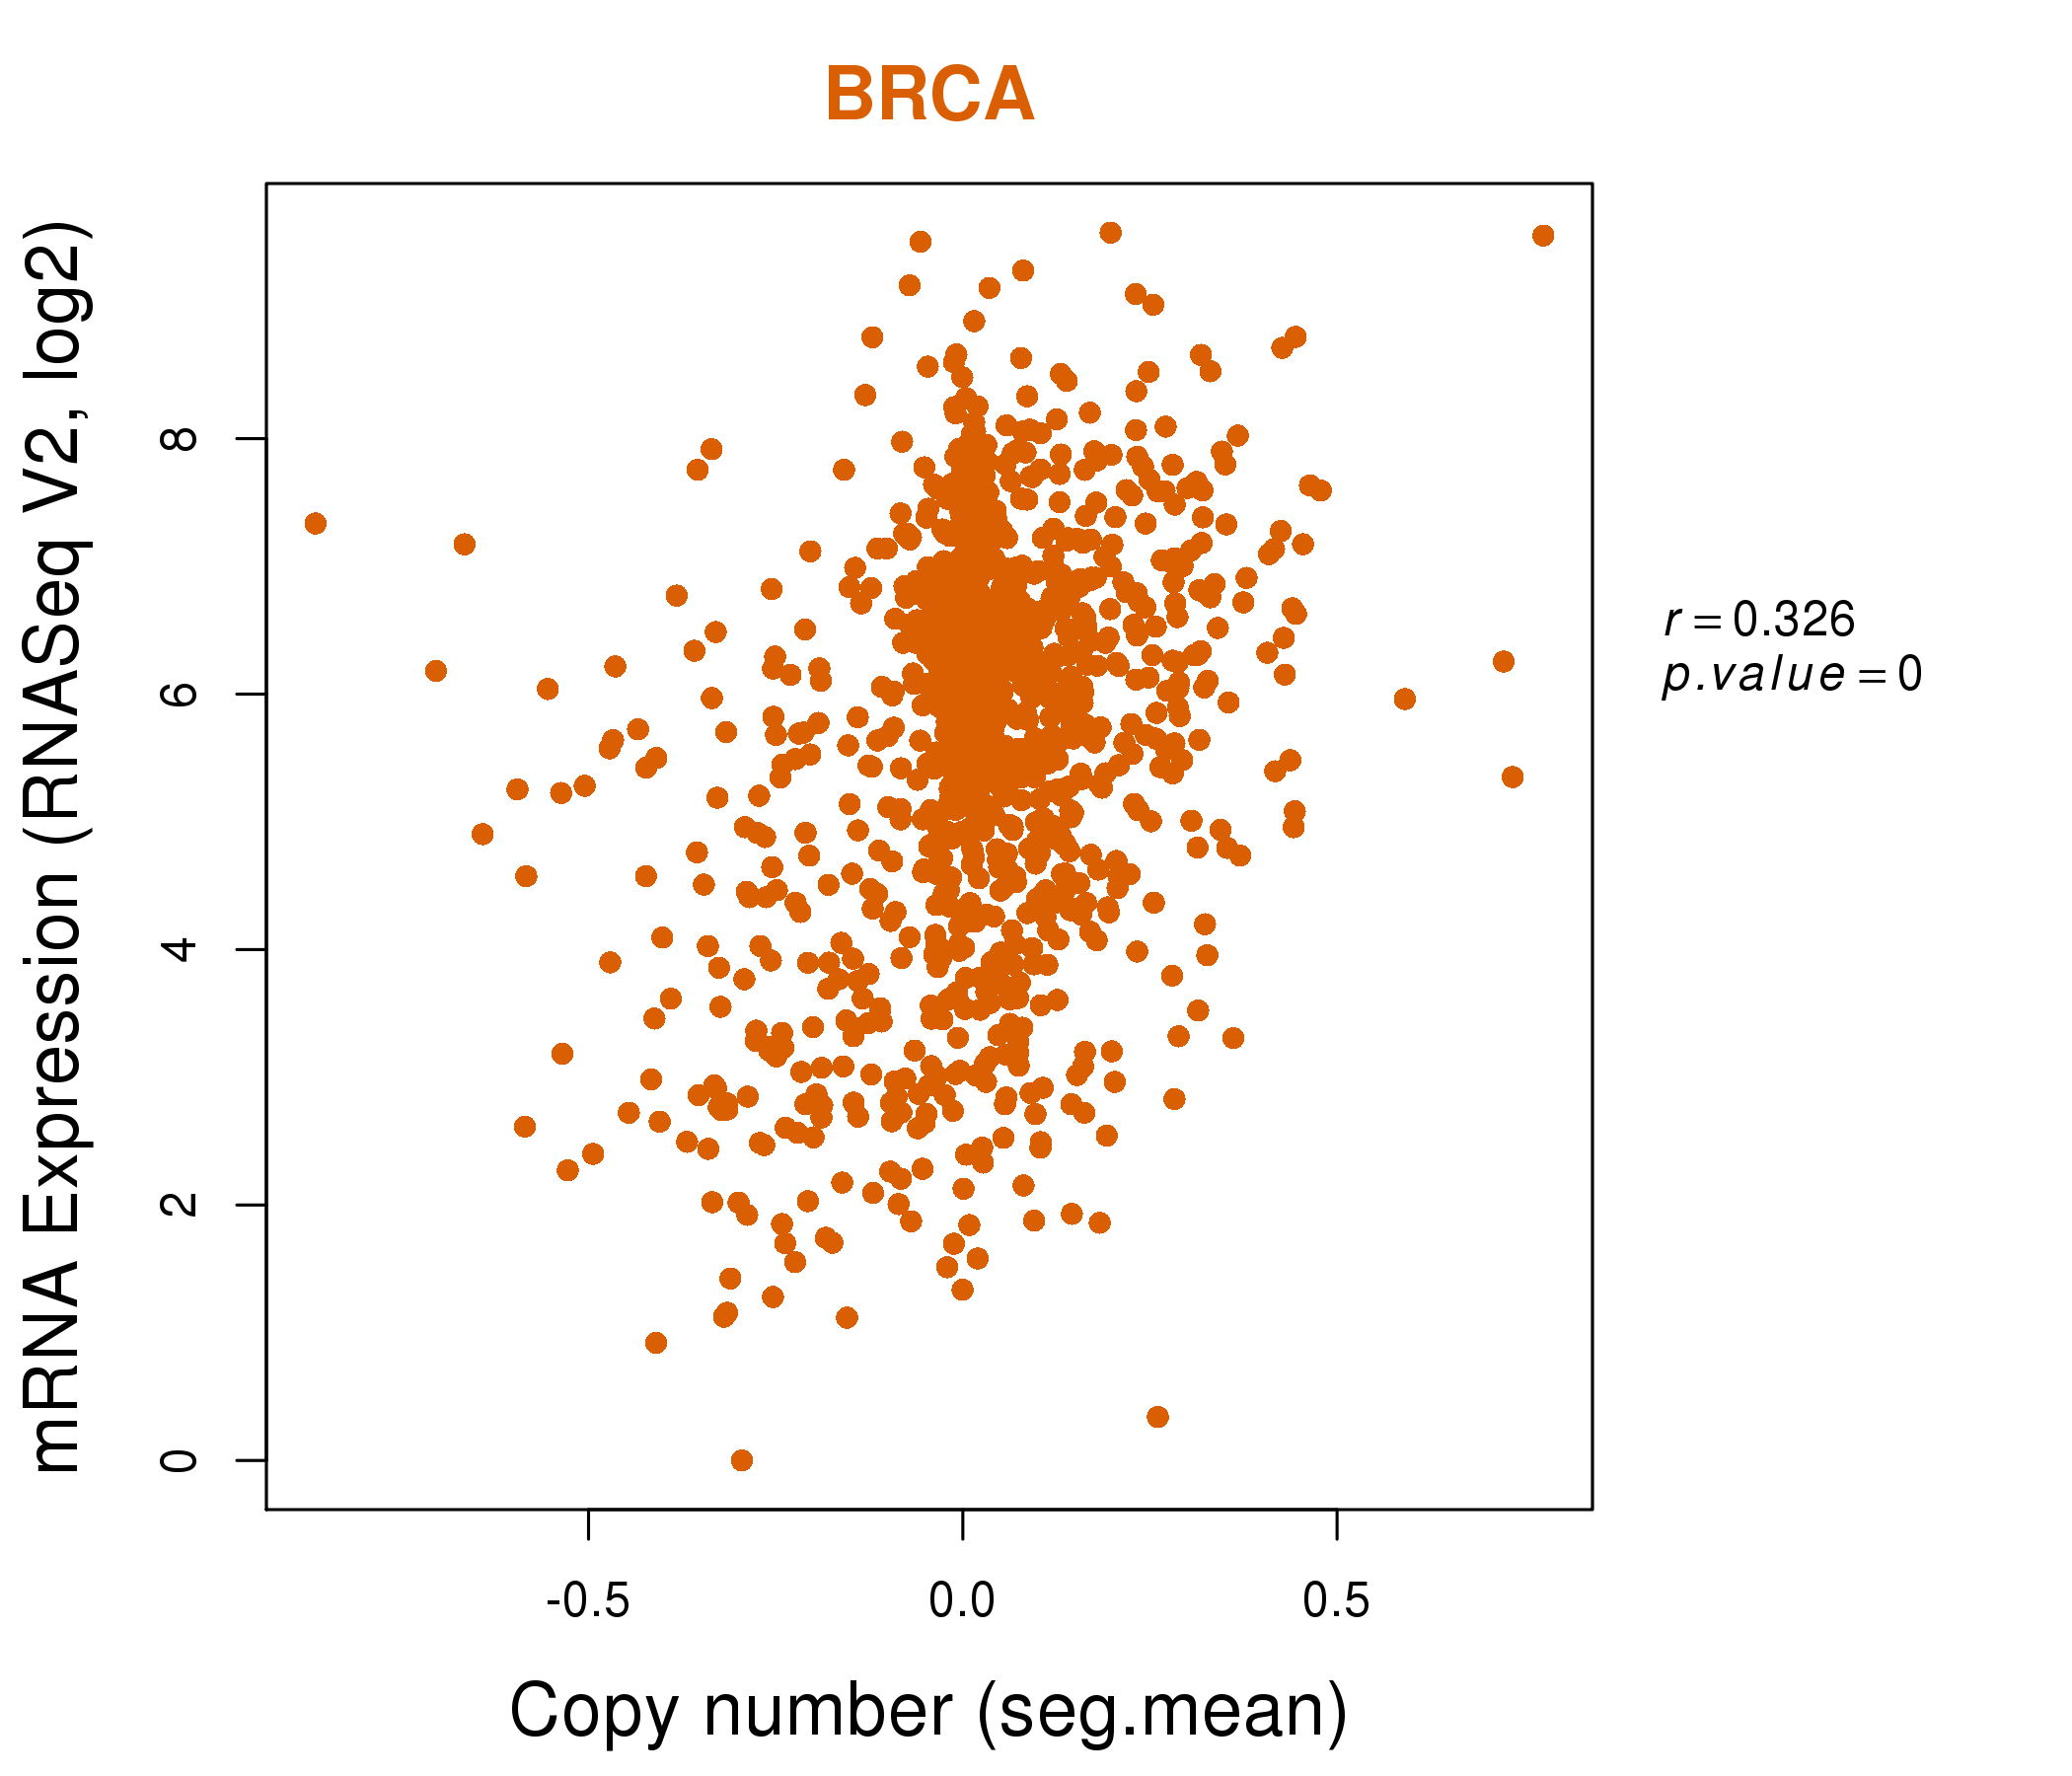
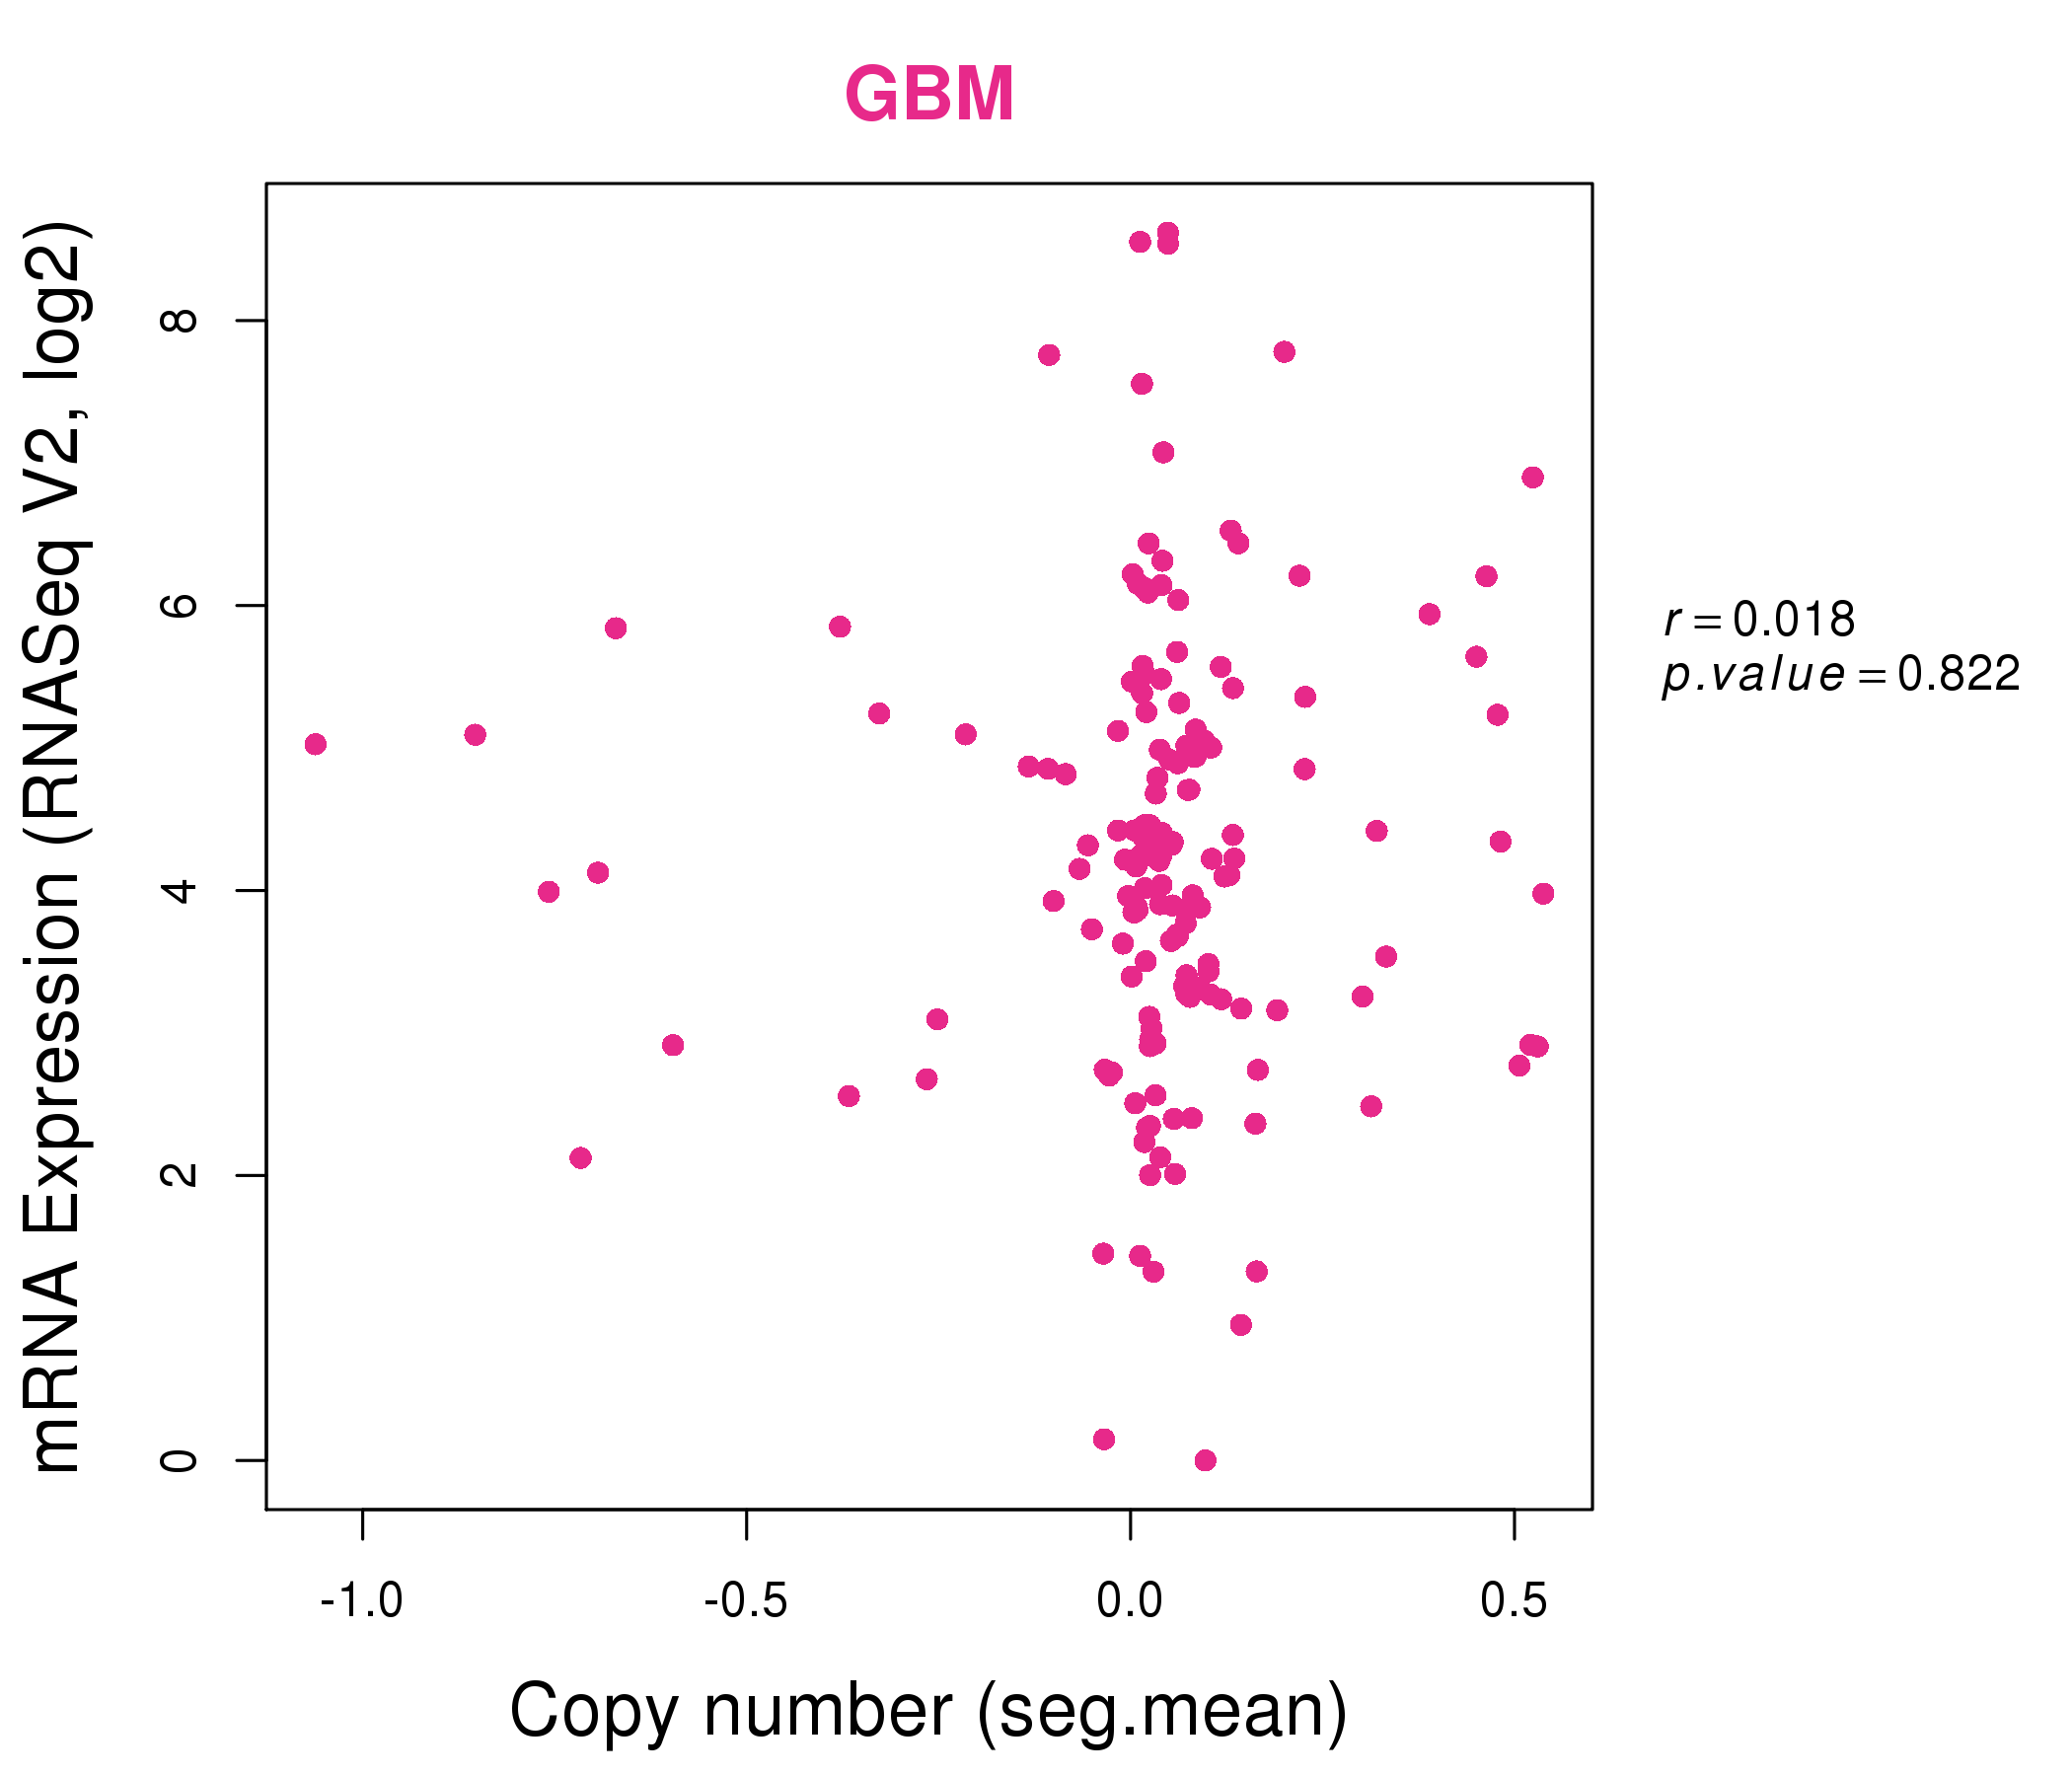
| * This plots show the correlation between CNV and gene expression. |
: Open all plots for all cancer types
 |
|
 |
|
| Top |
| Gene-Gene Network Information |
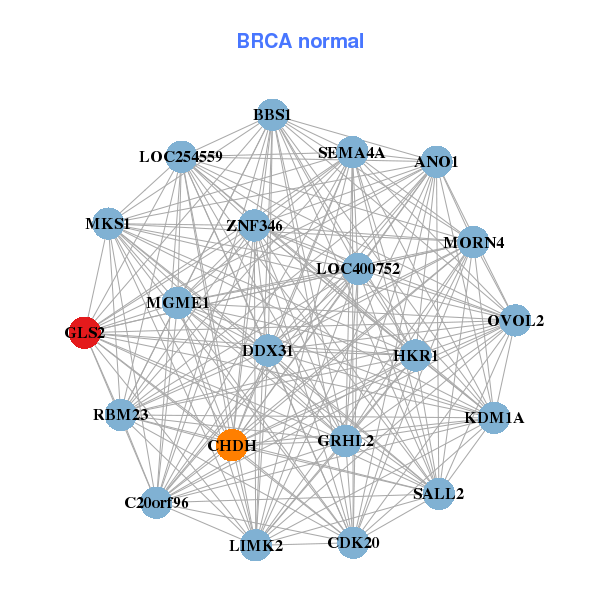
| * Co-Expression network figures were drawn using R package igraph. Only the top 20 genes with the highest correlations were shown. Red circle: input gene, orange circle: cell metabolism gene, sky circle: other gene |
: Open all plots for all cancer types
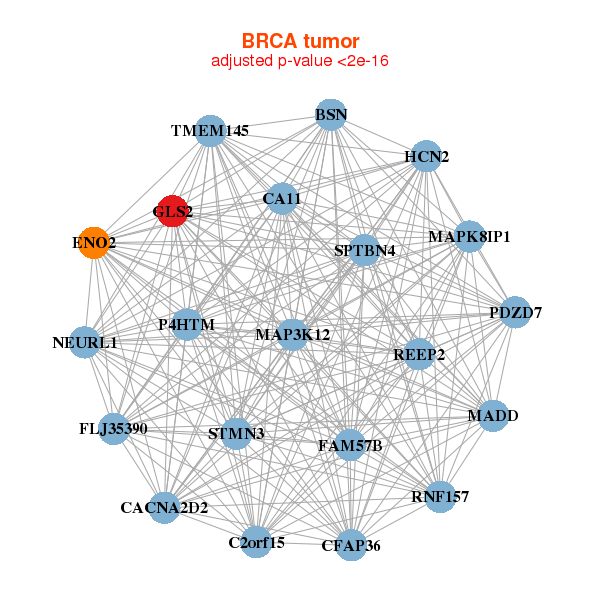 |
| ||||
| BSN,C2orf15,CA11,CACNA2D2,CFAP36,ENO2,FAM57B, FLJ35390,GLS2,HCN2,MADD,MAP3K12,MAPK8IP1,NEURL1, P4HTM,PDZD7,REEP2,RNF157,SPTBN4,STMN3,TMEM145 | ANO1,BBS1,MGME1,C20orf96,CDK20,CHDH,DDX31, GLS2,GRHL2,HKR1,KDM1A,LIMK2,LOC254559,LOC400752, MKS1,MORN4,OVOL2,RBM23,SALL2,SEMA4A,ZNF346 | ||||
 |
| ||||
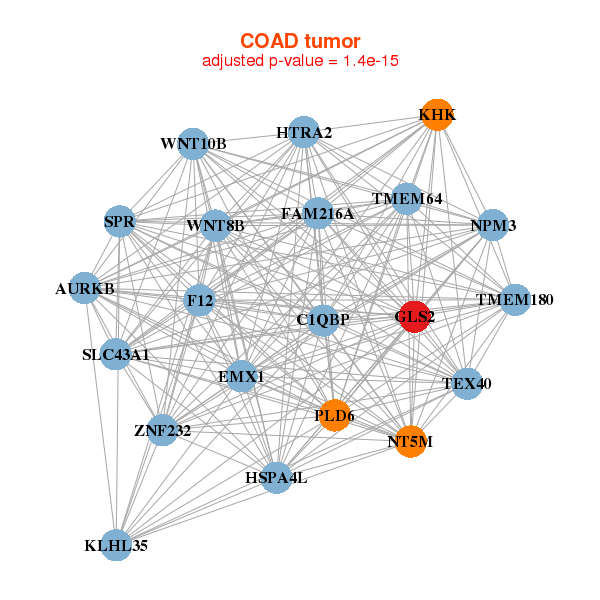
| AURKB,TEX40,FAM216A,C1QBP,EMX1,F12,GLS2, HSPA4L,HTRA2,KHK,KLHL35,NPM3,NT5M,PLD6, SLC43A1,SPR,TMEM180,TMEM64,WNT10B,WNT8B,ZNF232 | ARX,CA8,CELSR1,CFC1B,CHRM1,CYP2W1,CYP39A1, DSCAML1,FMOD,GLS2,GP2,KCNJ6,KLK15,LOC440925, MARCH4,NOL4,PPFIA2,SYBU,TUSC3,ZNF473,ZNF550 |
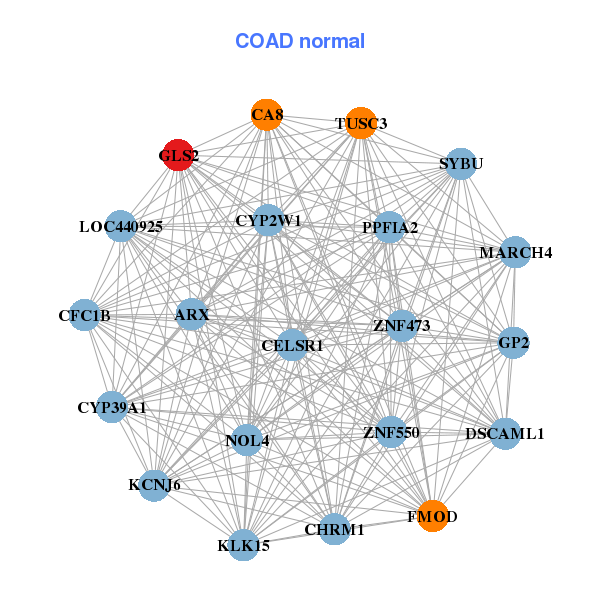
| * Co-Expression network figures were drawn using R package igraph. Only the top 20 genes with the highest correlations were shown. Red circle: input gene, orange circle: cell metabolism gene, sky circle: other gene |
: Open all plots for all cancer types
| Top |
: Open all interacting genes' information including KEGG pathway for all interacting genes from DAVID
| Top |
| Pharmacological Information for GLS2 |
| DB Category | DB Name | DB's ID and Url link |
| * Gene Centered Interaction Network. |
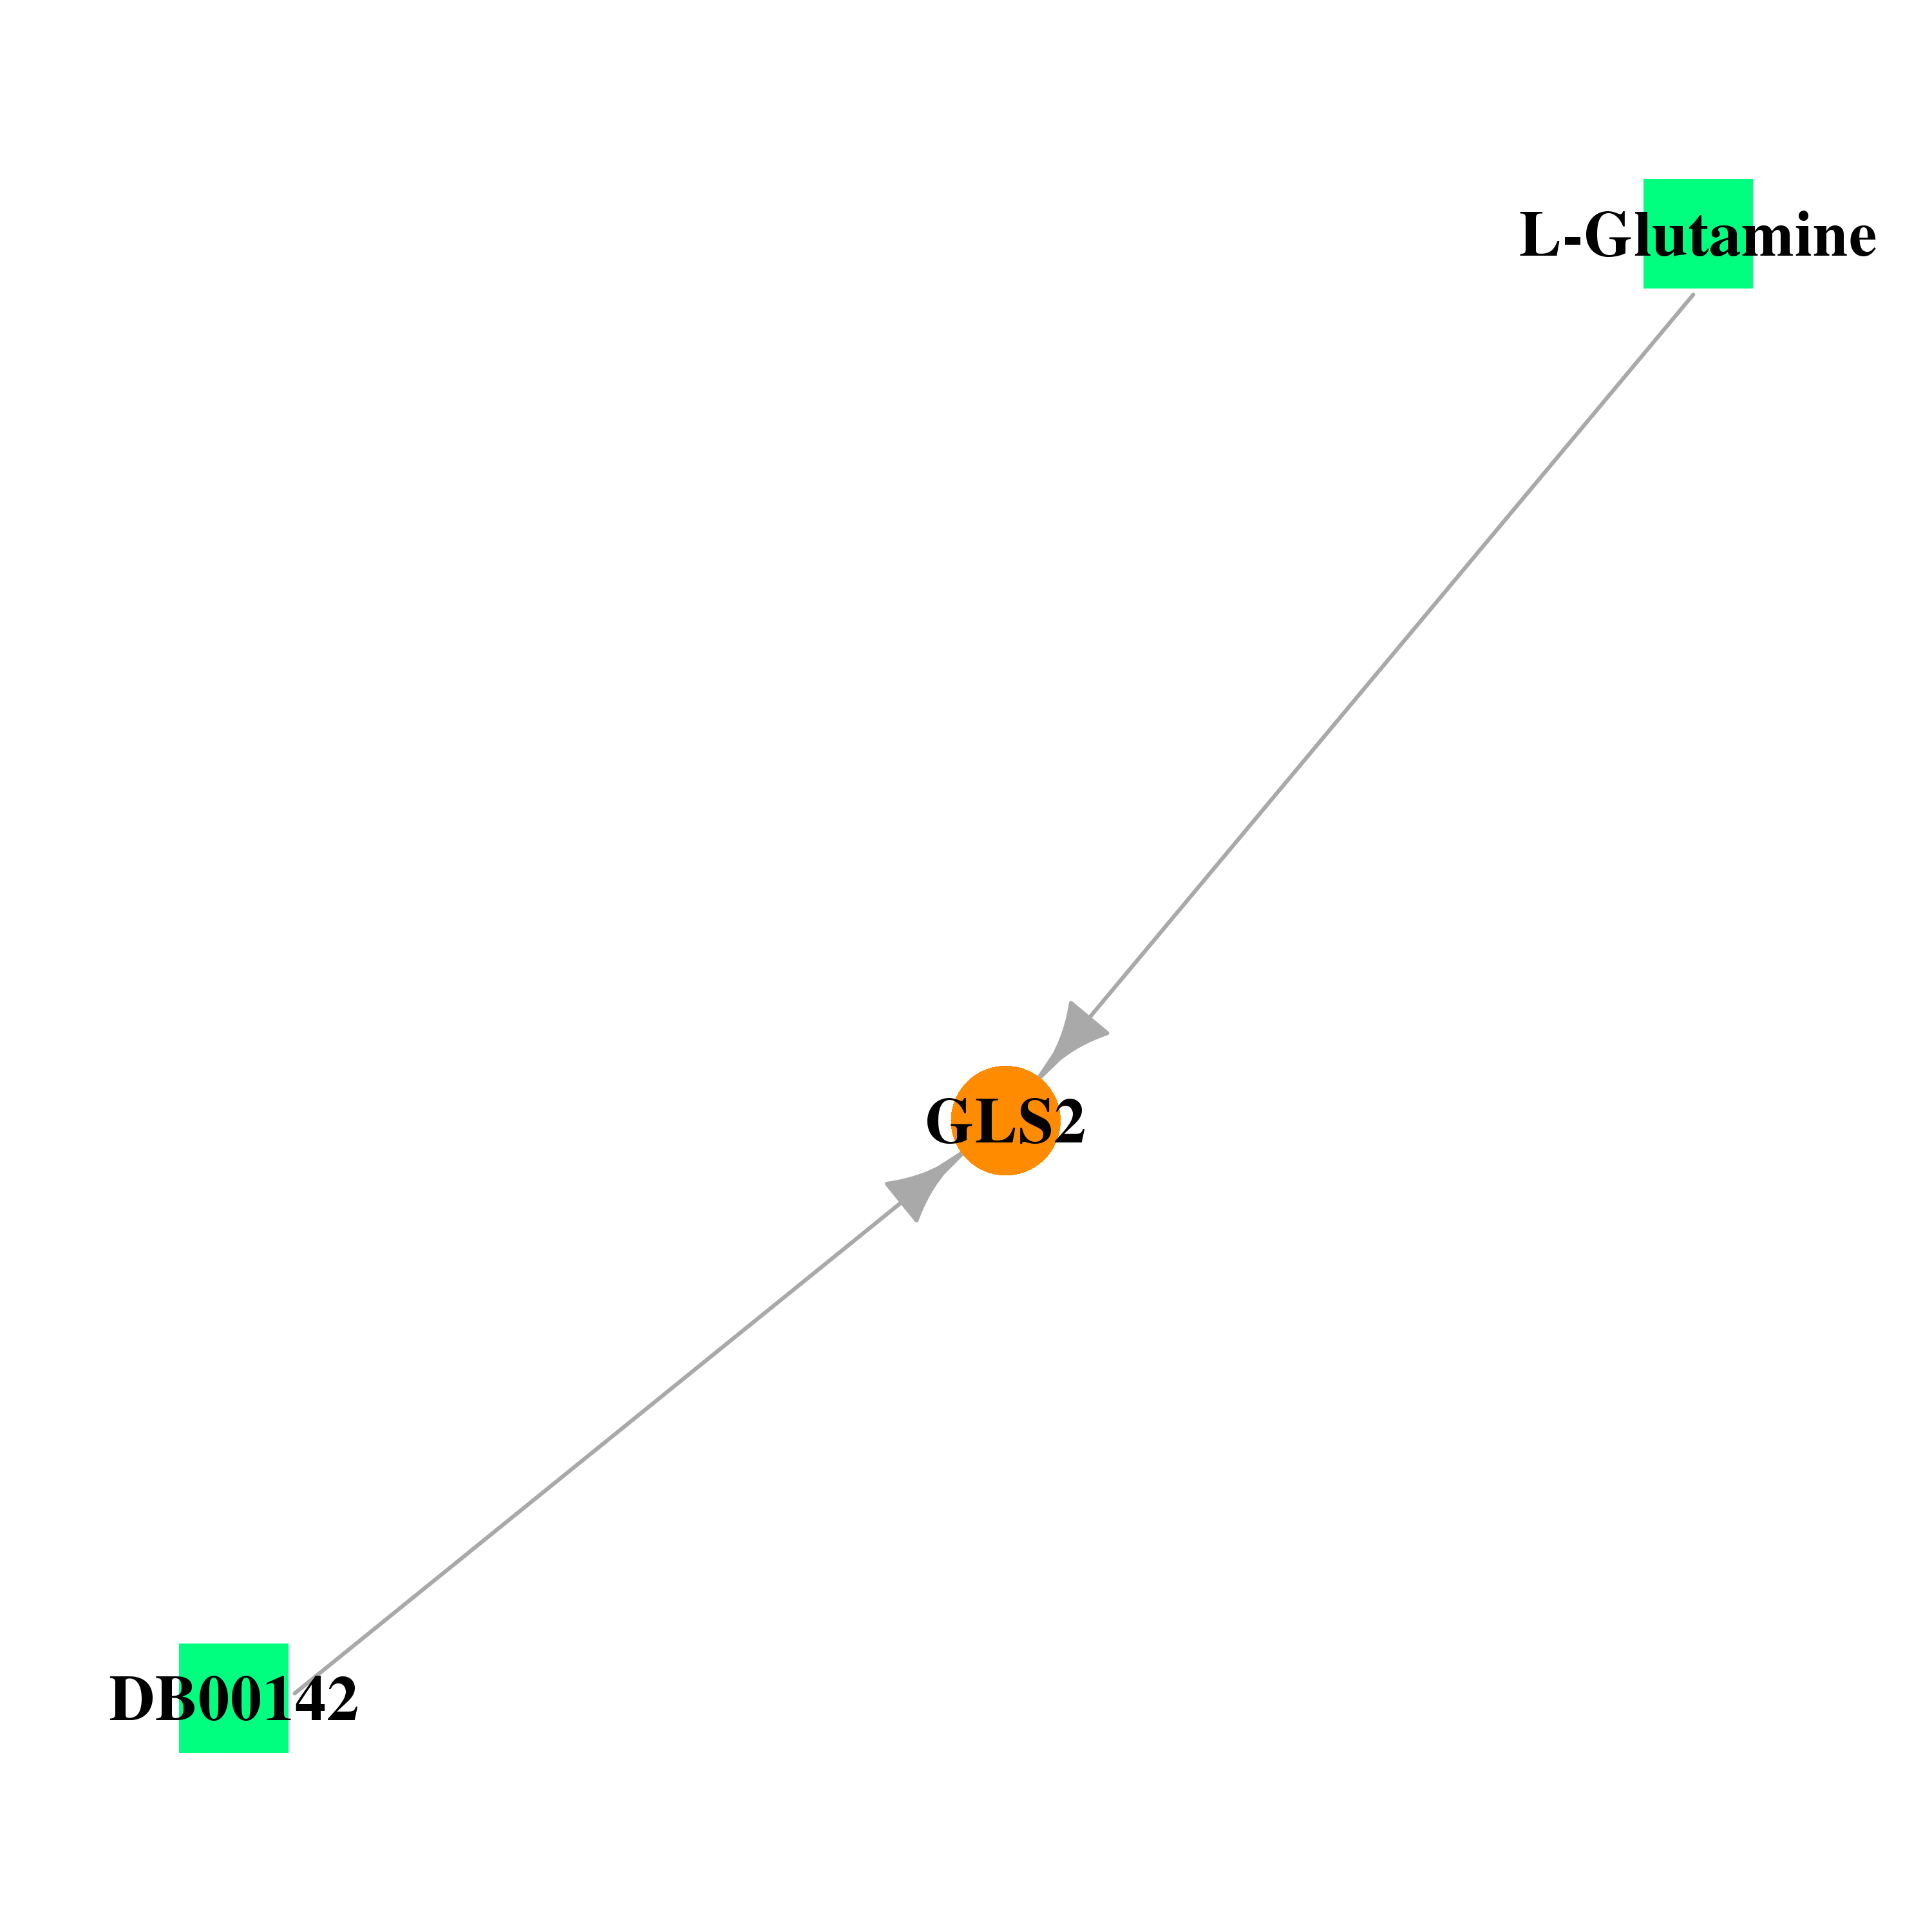 |
| * Drug Centered Interaction Network. |
| DrugBank ID | Target Name | Drug Groups | Generic Name | Drug Centered Network | Drug Structure |
| DB00142 | glutaminase 2 (liver, mitochondrial) | approved; nutraceutical | L-Glutamic Acid | 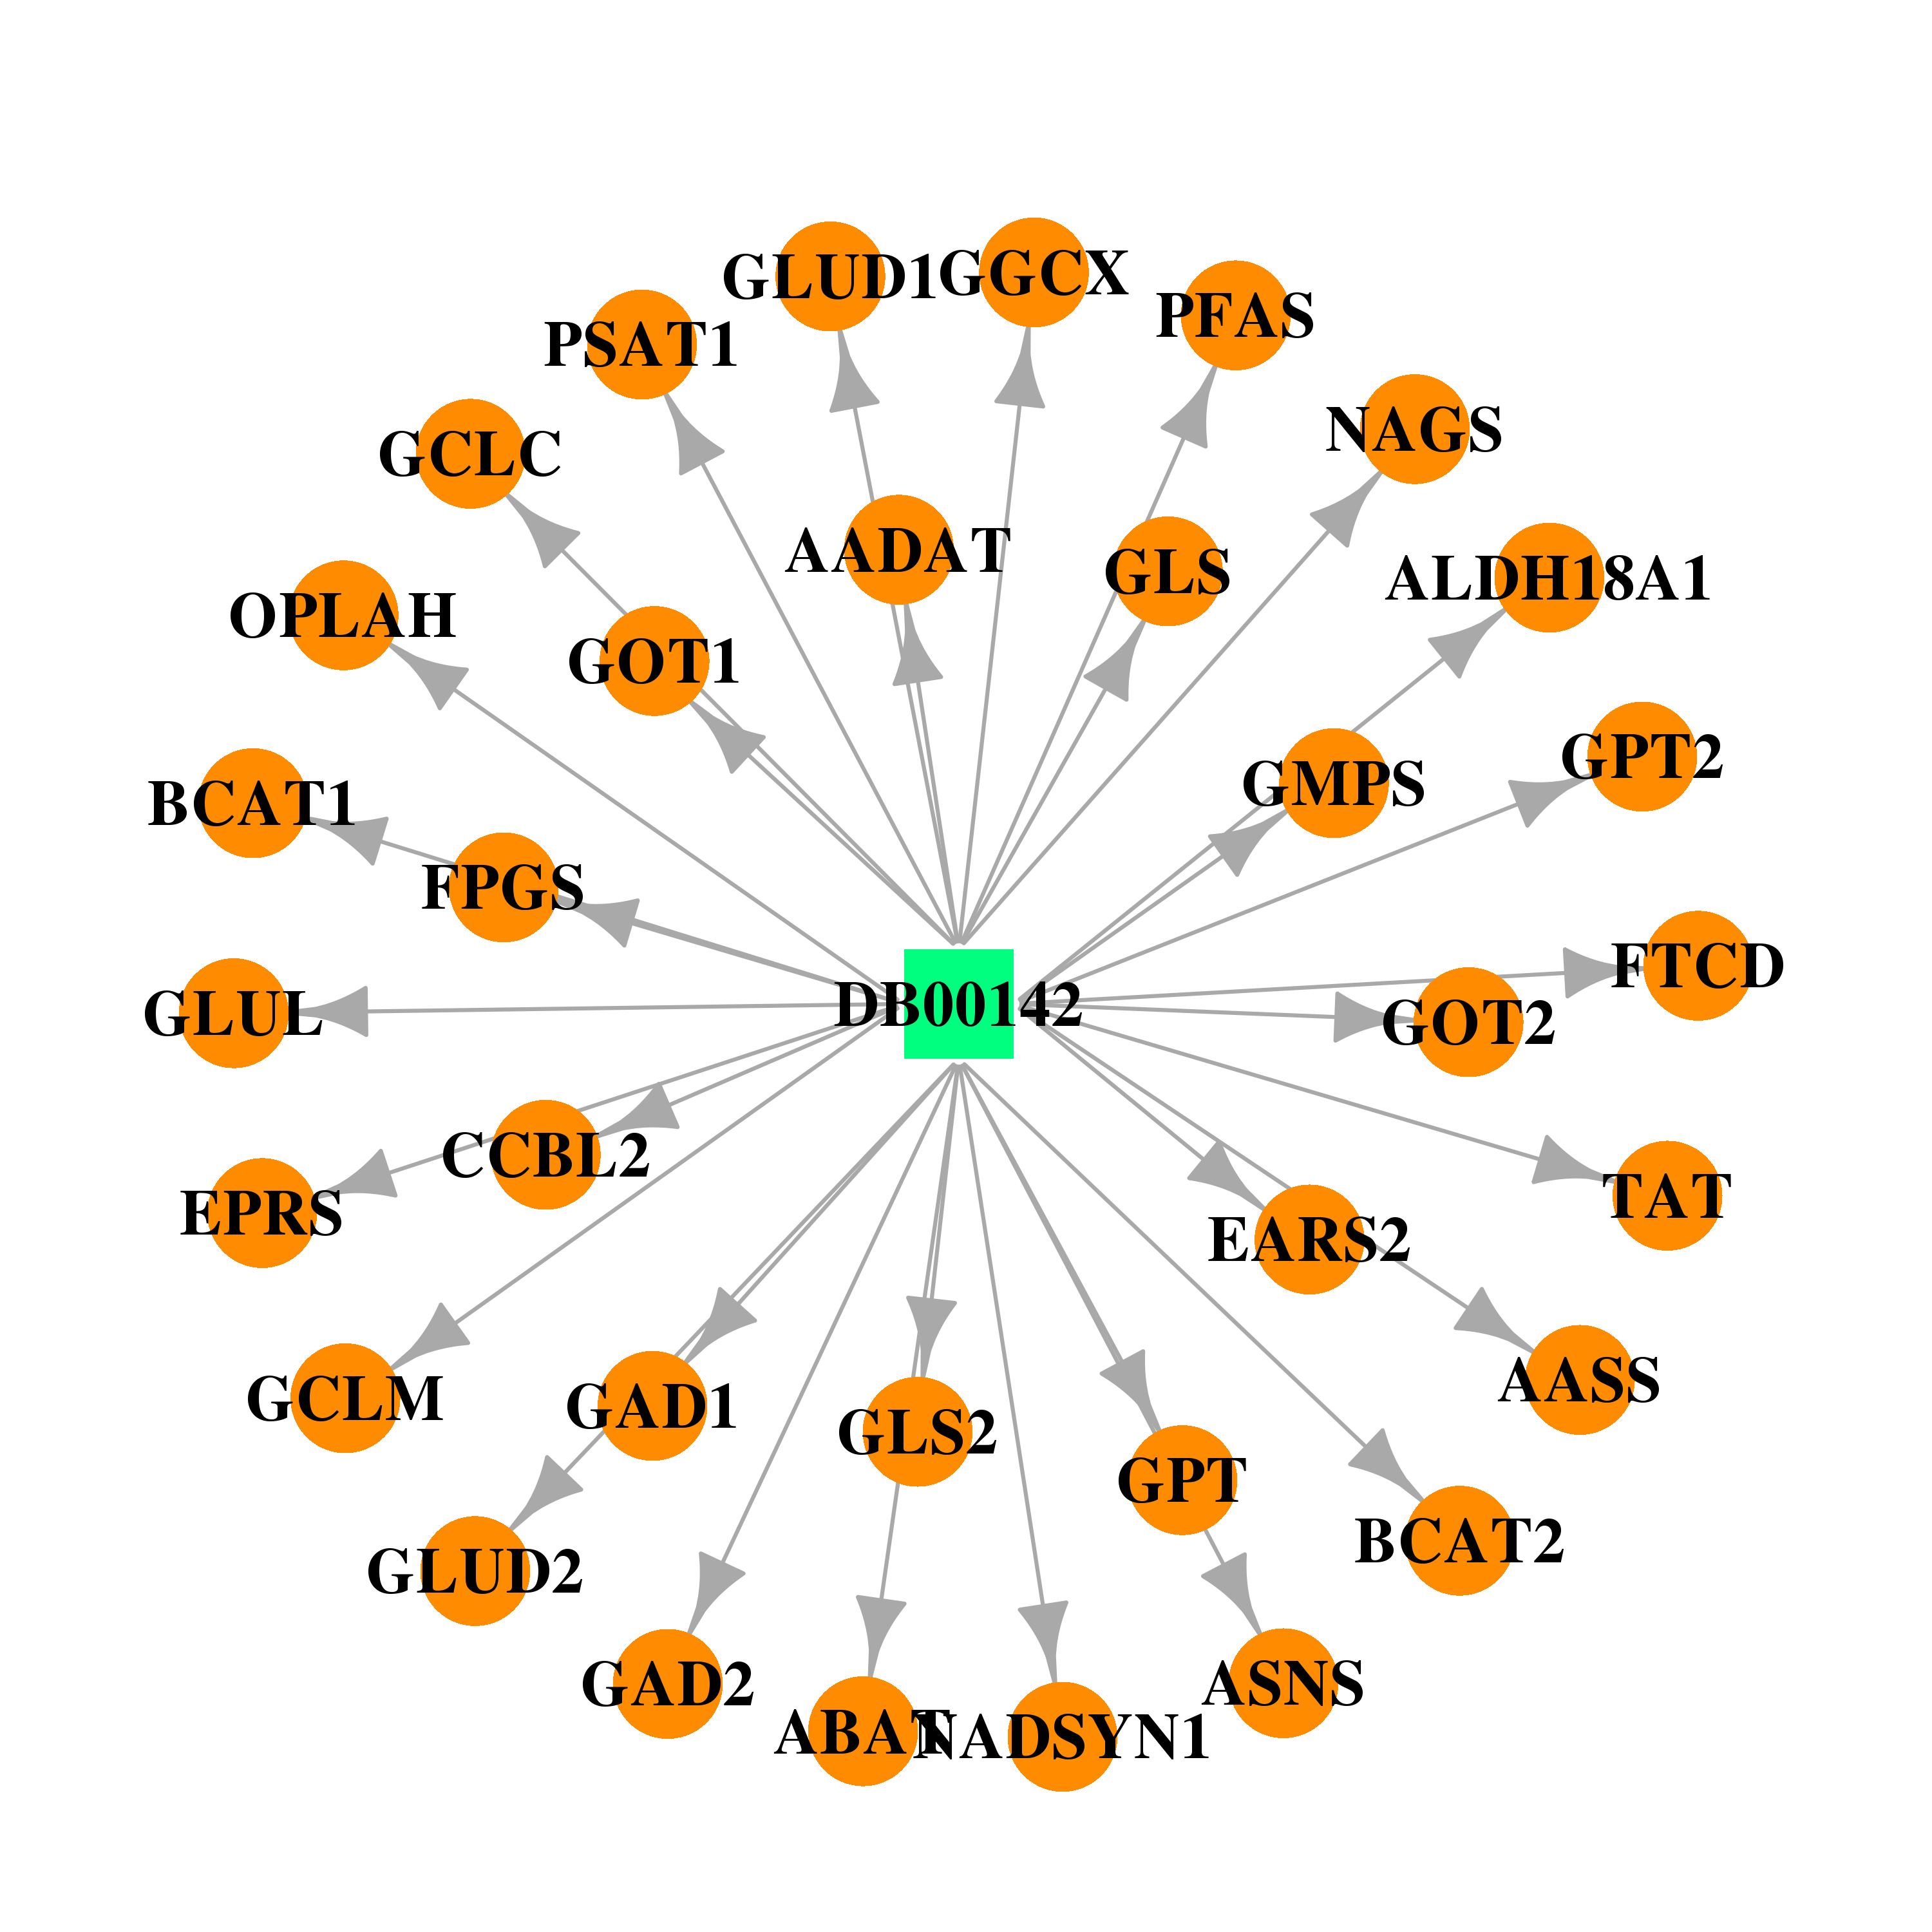 | 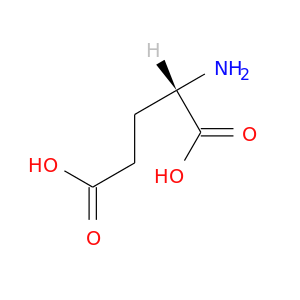 |
| DB00130 | glutaminase 2 (liver, mitochondrial) | approved; nutraceutical; investigational | L-Glutamine |  |  |
| Top |
| Cross referenced IDs for GLS2 |
| * We obtained these cross-references from Uniprot database. It covers 150 different DBs, 18 categories. http://www.uniprot.org/help/cross_references_section |
: Open all cross reference information
|
Copyright © 2016-Present - The Univsersity of Texas Health Science Center at Houston @ |