|
||||||||||||||||||||
| |
| Phenotypic Information (metabolism pathway, cancer, disease, phenome) |
| |
| |
| Gene-Gene Network Information: Co-Expression Network, Interacting Genes & KEGG |
| |
|


| Gene Summary for GLA |
| Basic gene info. | Gene symbol | GLA |
| Gene name | galactosidase, alpha | |
| Synonyms | GALA | |
| Cytomap | UCSC genome browser: Xq22 | |
| Genomic location | chrX :100652778-100663001 | |
| Type of gene | protein-coding | |
| RefGenes | NM_000169.2, | |
| Ensembl id | ENSG00000268815 | |
| Description | agalsidase alfaalpha-D-galactosidase Aalpha-D-galactoside galactohydrolase 1alpha-gal Aalpha-galactosidase Amelibiase | |
| Modification date | 20141219 | |
| dbXrefs | MIM : 300644 | |
| HGNC : HGNC | ||
| Ensembl : ENSG00000102393 | ||
| HPRD : 02357 | ||
| Vega : OTTHUMG00000022026 | ||
| Protein | UniProt: P06280 go to UniProt's Cross Reference DB Table | |
| Expression | CleanEX: HS_GLA | |
| BioGPS: 2717 | ||
| Gene Expression Atlas: ENSG00000268815 | ||
| The Human Protein Atlas: ENSG00000268815 | ||
| Pathway | NCI Pathway Interaction Database: GLA | |
| KEGG: GLA | ||
| REACTOME: GLA | ||
| ConsensusPathDB | ||
| Pathway Commons: GLA | ||
| Metabolism | MetaCyc: GLA | |
| HUMANCyc: GLA | ||
| Regulation | Ensembl's Regulation: ENSG00000268815 | |
| miRBase: chrX :100,652,778-100,663,001 | ||
| TargetScan: NM_000169 | ||
| cisRED: ENSG00000268815 | ||
| Context | iHOP: GLA | |
| cancer metabolism search in PubMed: GLA | ||
| UCL Cancer Institute: GLA | ||
| Assigned class in ccmGDB | B - This gene belongs to cancer gene. | |
| Top |
| Phenotypic Information for GLA(metabolism pathway, cancer, disease, phenome) |
| Cancer | CGAP: GLA |
| Familial Cancer Database: GLA | |
| * This gene is included in those cancer gene databases. |
|
|
|
|
|
| . | ||||||||||||||
Oncogene 1 | Significant driver gene in | |||||||||||||||||||
| cf) number; DB name 1 Oncogene; http://nar.oxfordjournals.org/content/35/suppl_1/D721.long, 2 Tumor Suppressor gene; https://bioinfo.uth.edu/TSGene/, 3 Cancer Gene Census; http://www.nature.com/nrc/journal/v4/n3/abs/nrc1299.html, 4 CancerGenes; http://nar.oxfordjournals.org/content/35/suppl_1/D721.long, 5 Network of Cancer Gene; http://ncg.kcl.ac.uk/index.php, 1Therapeutic Vulnerabilities in Cancer; http://cbio.mskcc.org/cancergenomics/statius/ |
| KEGG_GALACTOSE_METABOLISM KEGG_GLYCEROLIPID_METABOLISM KEGG_SPHINGOLIPID_METABOLISM REACTOME_GLYCOSPHINGOLIPID_METABOLISM REACTOME_PHOSPHOLIPID_METABOLISM REACTOME_SPHINGOLIPID_METABOLISM REACTOME_METABOLISM_OF_LIPIDS_AND_LIPOPROTEINS | |
| OMIM | 300644; gene. 301500; phenotype. |
| Orphanet | 324; Fabry disease. |
| Disease | KEGG Disease: GLA |
| MedGen: GLA (Human Medical Genetics with Condition) | |
| ClinVar: GLA | |
| Phenotype | MGI: GLA (International Mouse Phenotyping Consortium) |
| PhenomicDB: GLA | |
| Mutations for GLA |
| * Under tables are showing count per each tissue to give us broad intuition about tissue specific mutation patterns.You can go to the detailed page for each mutation database's web site. |
| There's no structural variation information in COSMIC data for this gene. |
| * From mRNA Sanger sequences, Chitars2.0 arranged chimeric transcripts. This table shows GLA related fusion information. |
| ID | Head Gene | Tail Gene | Accession | Gene_a | qStart_a | qEnd_a | Chromosome_a | tStart_a | tEnd_a | Gene_a | qStart_a | qEnd_a | Chromosome_a | tStart_a | tEnd_a |
| Top |
| There's no copy number variation information in COSMIC data for this gene. |
| Top |
|
 |
| Top |
| Stat. for Non-Synonymous SNVs (# total SNVs=44) | (# total SNVs=5) |
 |  |
(# total SNVs=0) | (# total SNVs=0) |
| Top |
| * When you move the cursor on each content, you can see more deailed mutation information on the Tooltip. Those are primary_site,primary_histology,mutation(aa),pubmedID. |
| GRCh37 position | Mutation(aa) | Unique sampleID count |
| chr23:100652899-100652899 | p.F396L | 2 |
| chr23:100656792-100656792 | p.H125Q | 2 |
| chr23:100662732-100662732 | p.L54I | 1 |
| chr23:100653447-100653447 | p.S304C | 1 |
| chr23:100655654-100655654 | p.K213N | 1 |
| chr23:100652895-100652895 | p.E398Q | 1 |
| chr23:100658838-100658838 | p.P110P | 1 |
| chr23:100662735-100662735 | p.N53Y | 1 |
| chr23:100653459-100653459 | p.L300F | 1 |
| chr23:100655659-100655659 | p.Q212E | 1 |
| Top |
|
 |
| Point Mutation/ Tissue ID | 1 | 2 | 3 | 4 | 5 | 6 | 7 | 8 | 9 | 10 | 11 | 12 | 13 | 14 | 15 | 16 | 17 | 18 | 19 | 20 |
| # sample | 2 | 1 | 6 | 2 | 2 | 6 | 4 | 1 | 2 | 8 | ||||||||||
| # mutation | 2 | 1 | 7 | 2 | 2 | 6 | 4 | 1 | 2 | 10 | ||||||||||
| nonsynonymous SNV | 2 | 1 | 6 | 2 | 2 | 5 | 3 | 1 | 7 | |||||||||||
| synonymous SNV | 1 | 1 | 1 | 2 | 3 |
| cf) Tissue ID; Tissue type (1; BLCA[Bladder Urothelial Carcinoma], 2; BRCA[Breast invasive carcinoma], 3; CESC[Cervical squamous cell carcinoma and endocervical adenocarcinoma], 4; COAD[Colon adenocarcinoma], 5; GBM[Glioblastoma multiforme], 6; Glioma Low Grade, 7; HNSC[Head and Neck squamous cell carcinoma], 8; KICH[Kidney Chromophobe], 9; KIRC[Kidney renal clear cell carcinoma], 10; KIRP[Kidney renal papillary cell carcinoma], 11; LAML[Acute Myeloid Leukemia], 12; LUAD[Lung adenocarcinoma], 13; LUSC[Lung squamous cell carcinoma], 14; OV[Ovarian serous cystadenocarcinoma ], 15; PAAD[Pancreatic adenocarcinoma], 16; PRAD[Prostate adenocarcinoma], 17; SKCM[Skin Cutaneous Melanoma], 18:STAD[Stomach adenocarcinoma], 19:THCA[Thyroid carcinoma], 20:UCEC[Uterine Corpus Endometrial Carcinoma]) |
| Top |
| * We represented just top 10 SNVs. When you move the cursor on each content, you can see more deailed mutation information on the Tooltip. Those are primary_site, primary_histology, mutation(aa), pubmedID. |
| Genomic Position | Mutation(aa) | Unique sampleID count |
| chrX:100652899 | p.F396L | 2 |
| chrX:100656649 | p.L300F | 1 |
| chrX:100658891 | p.D109H | 1 |
| chrX:100653447 | p.V281V | 1 |
| chrX:100656651 | p.R105K | 1 |
| chrX:100658904 | p.N278K | 1 |
| chrX:100653459 | p.E103D | 1 |
| chrX:100656666 | p.P265Q | 1 |
| chrX:100658929 | p.Q99K | 1 |
| chrX:100653514 | p.E251E | 1 |
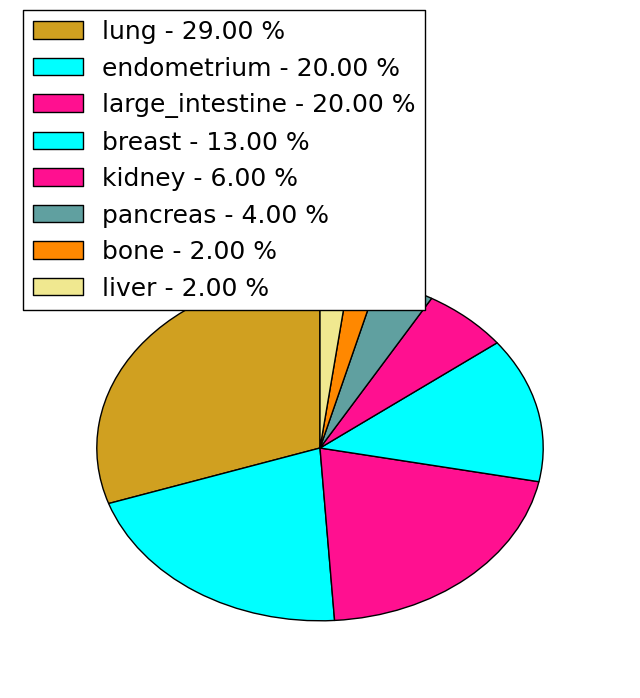
| * Copy number data were extracted from TCGA using R package TCGA-Assembler. The URLs of all public data files on TCGA DCC data server were gathered on Jan-05-2015. Function ProcessCNAData in TCGA-Assembler package was used to obtain gene-level copy number value which is calculated as the average copy number of the genomic region of a gene. |
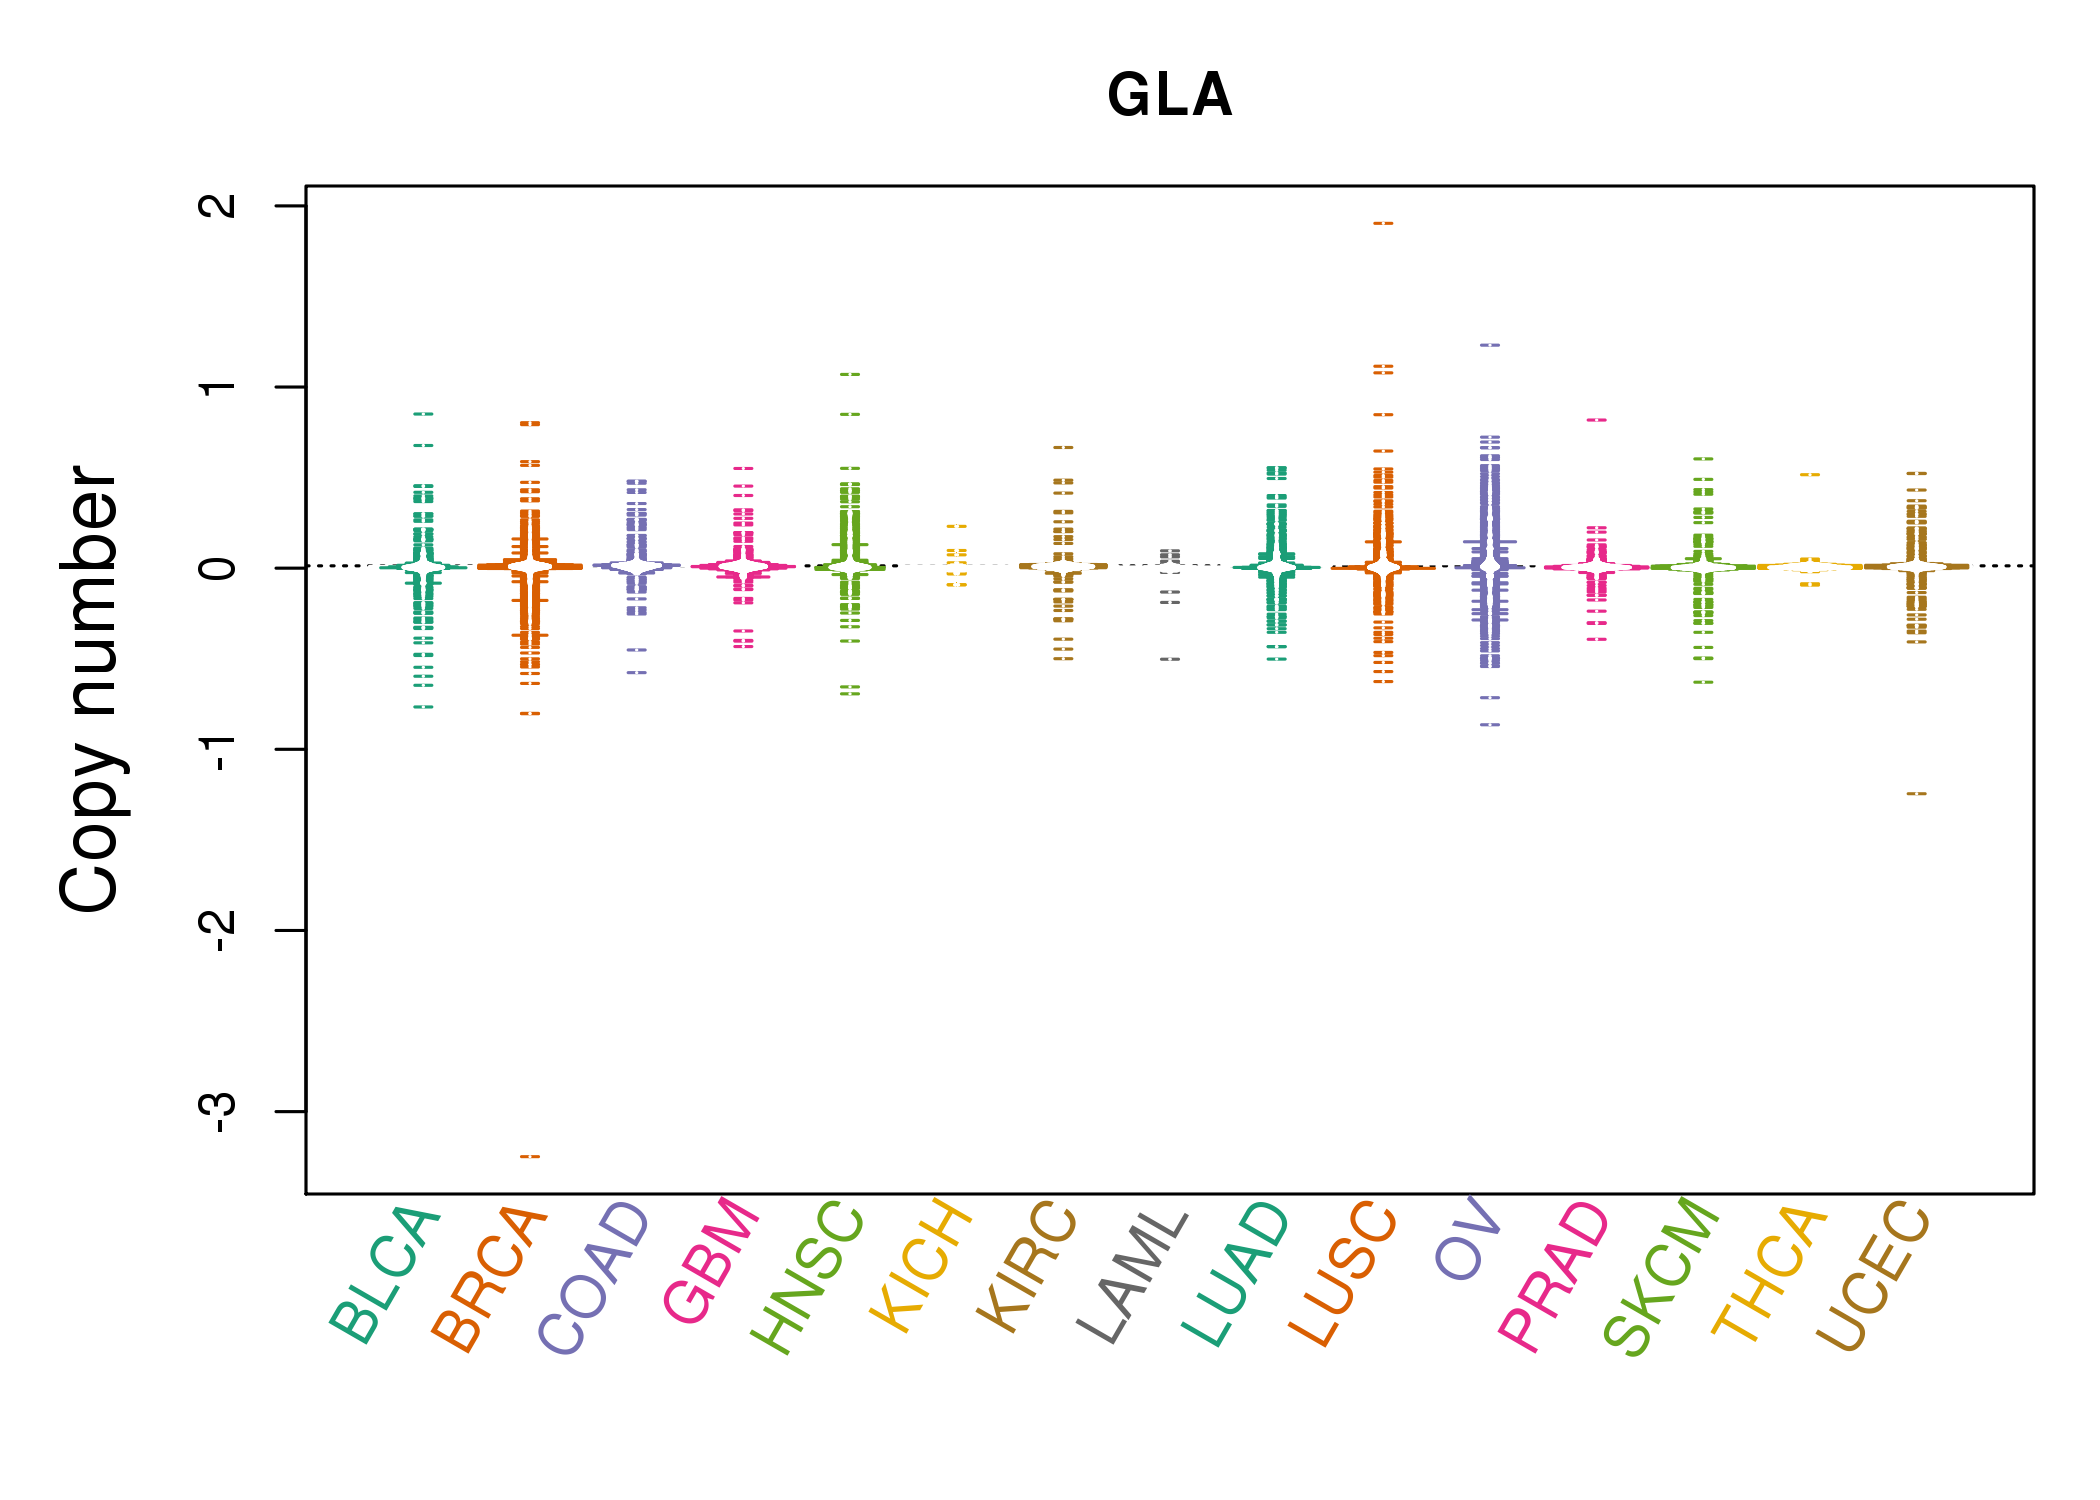 |
| cf) Tissue ID[Tissue type]: BLCA[Bladder Urothelial Carcinoma], BRCA[Breast invasive carcinoma], CESC[Cervical squamous cell carcinoma and endocervical adenocarcinoma], COAD[Colon adenocarcinoma], GBM[Glioblastoma multiforme], Glioma Low Grade, HNSC[Head and Neck squamous cell carcinoma], KICH[Kidney Chromophobe], KIRC[Kidney renal clear cell carcinoma], KIRP[Kidney renal papillary cell carcinoma], LAML[Acute Myeloid Leukemia], LUAD[Lung adenocarcinoma], LUSC[Lung squamous cell carcinoma], OV[Ovarian serous cystadenocarcinoma ], PAAD[Pancreatic adenocarcinoma], PRAD[Prostate adenocarcinoma], SKCM[Skin Cutaneous Melanoma], STAD[Stomach adenocarcinoma], THCA[Thyroid carcinoma], UCEC[Uterine Corpus Endometrial Carcinoma] |
| Top |
| Gene Expression for GLA |
| * CCLE gene expression data were extracted from CCLE_Expression_Entrez_2012-10-18.res: Gene-centric RMA-normalized mRNA expression data. |
 |
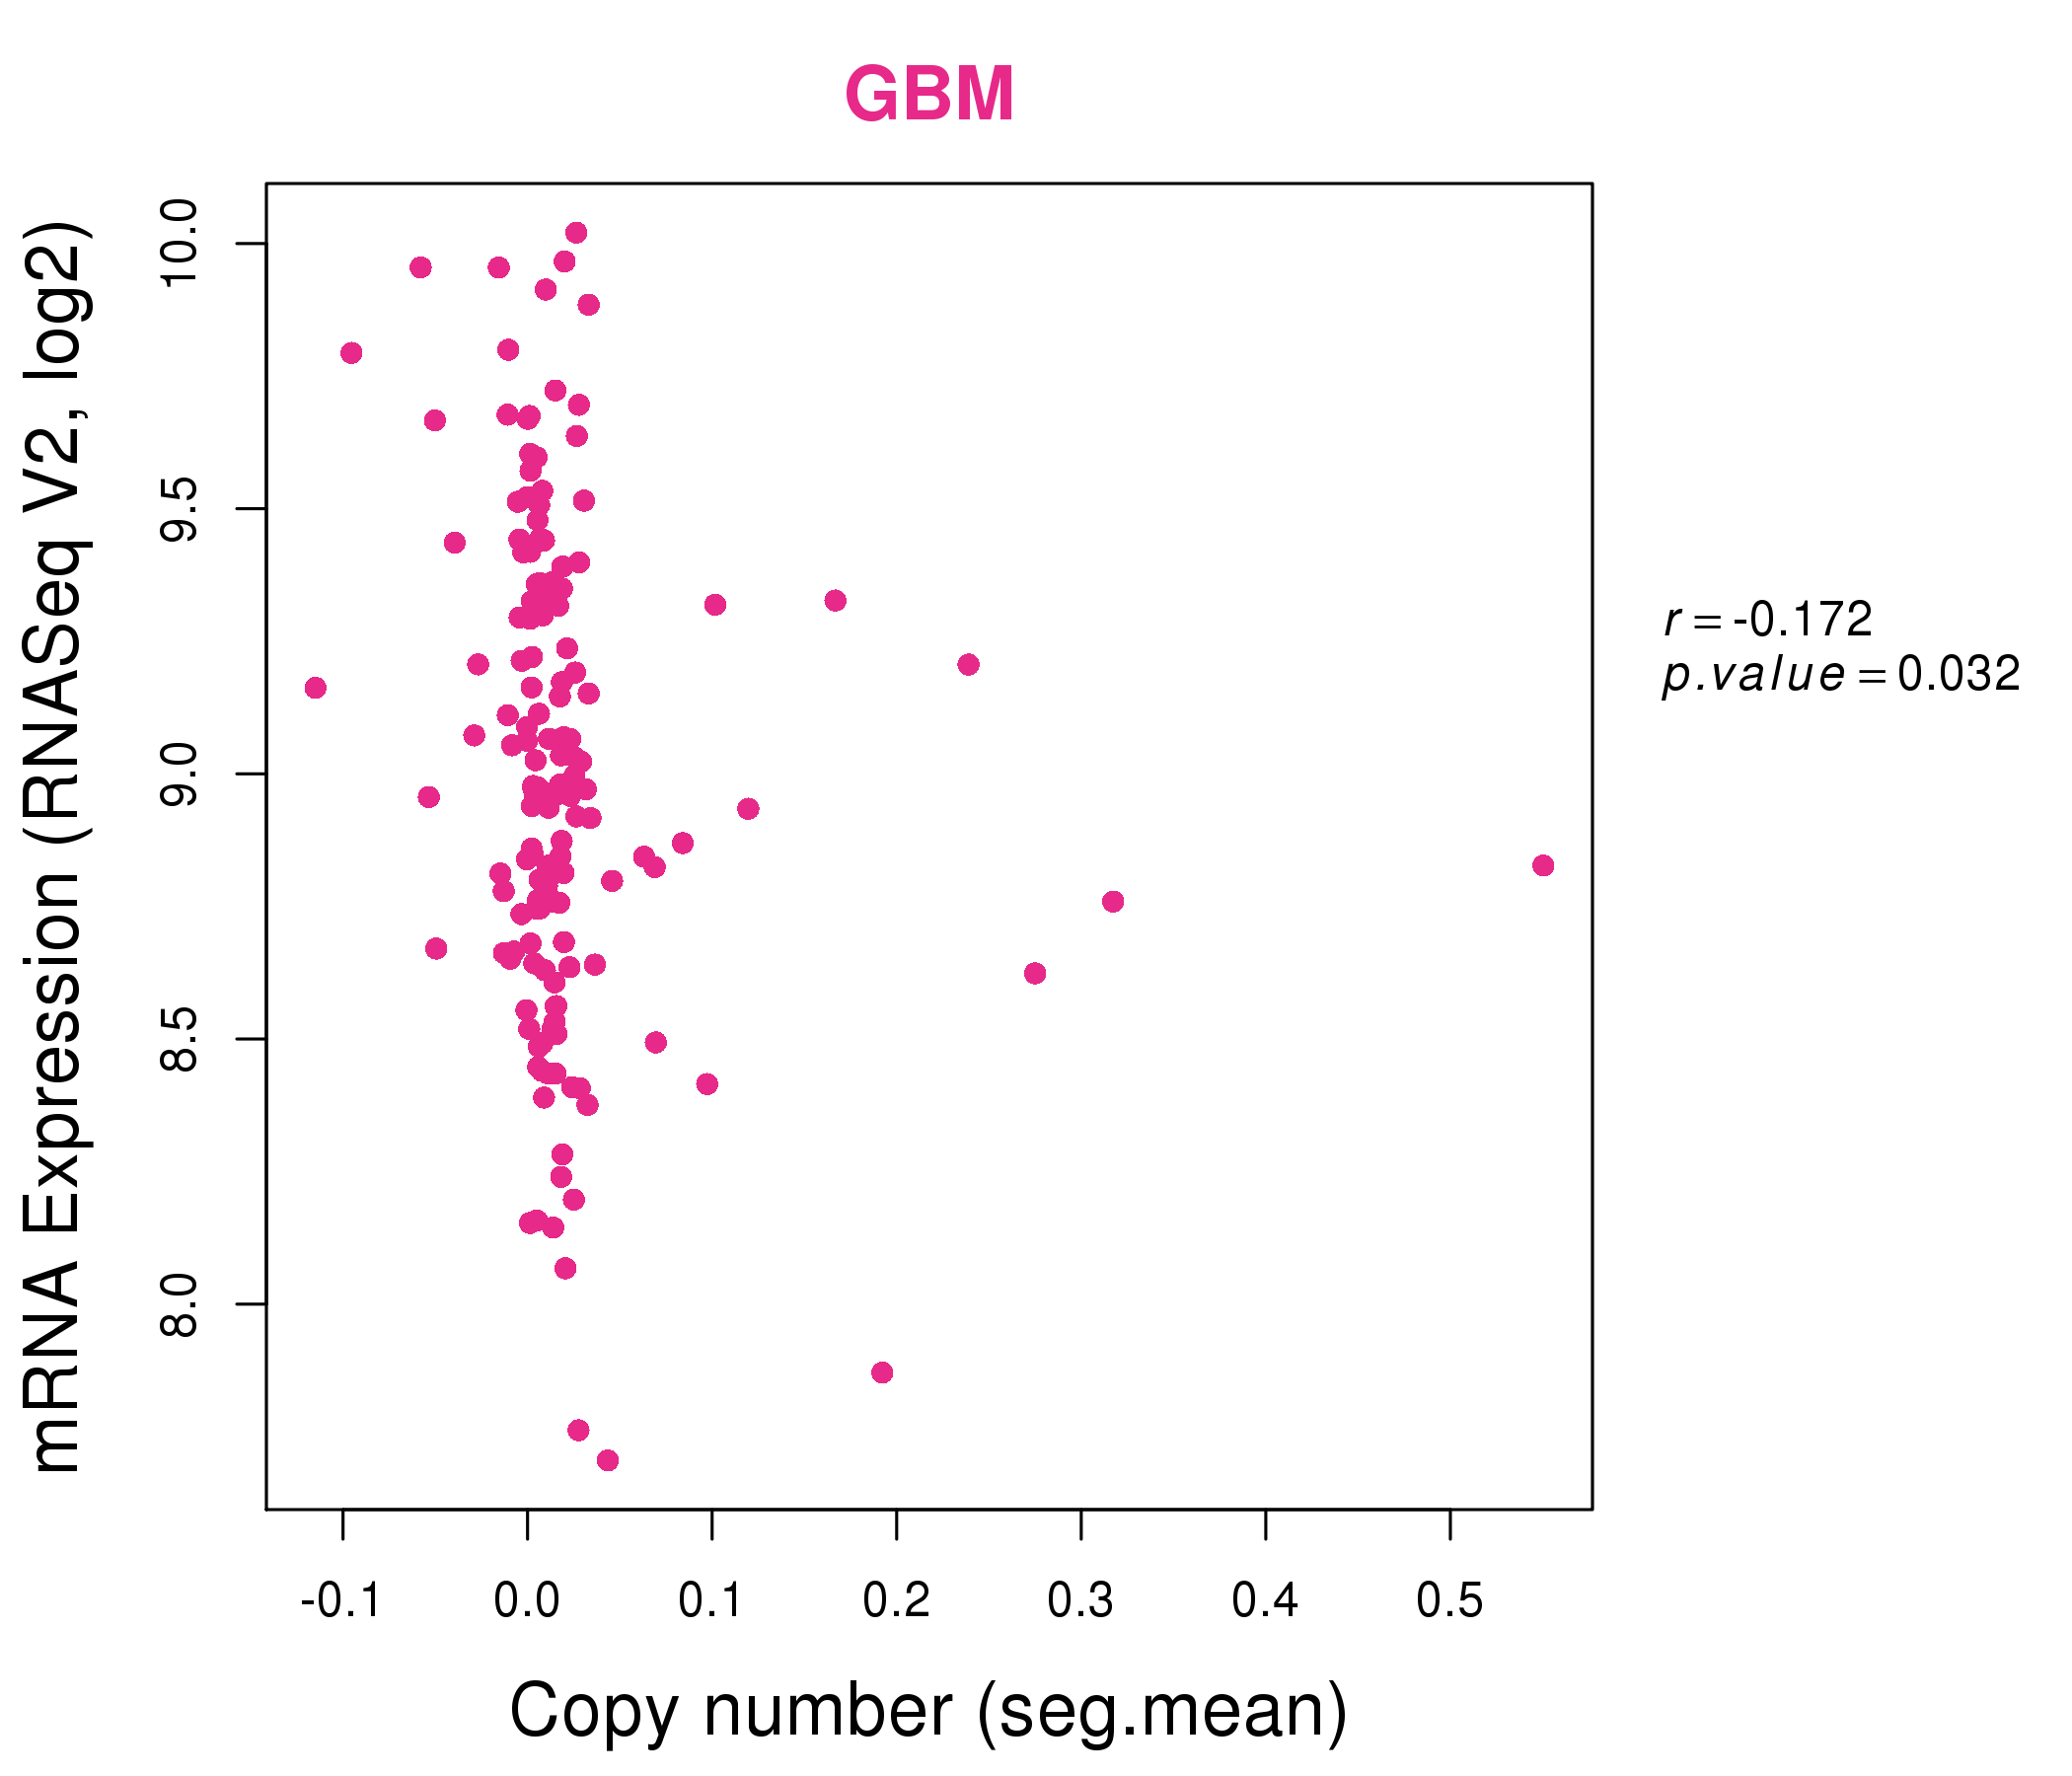
| * Normalized gene expression data of RNASeqV2 was extracted from TCGA using R package TCGA-Assembler. The URLs of all public data files on TCGA DCC data server were gathered at Jan-05-2015. Only eight cancer types have enough normal control samples for differential expression analysis. (t test, adjusted p<0.05 (using Benjamini-Hochberg FDR)) |
 |
| Top |
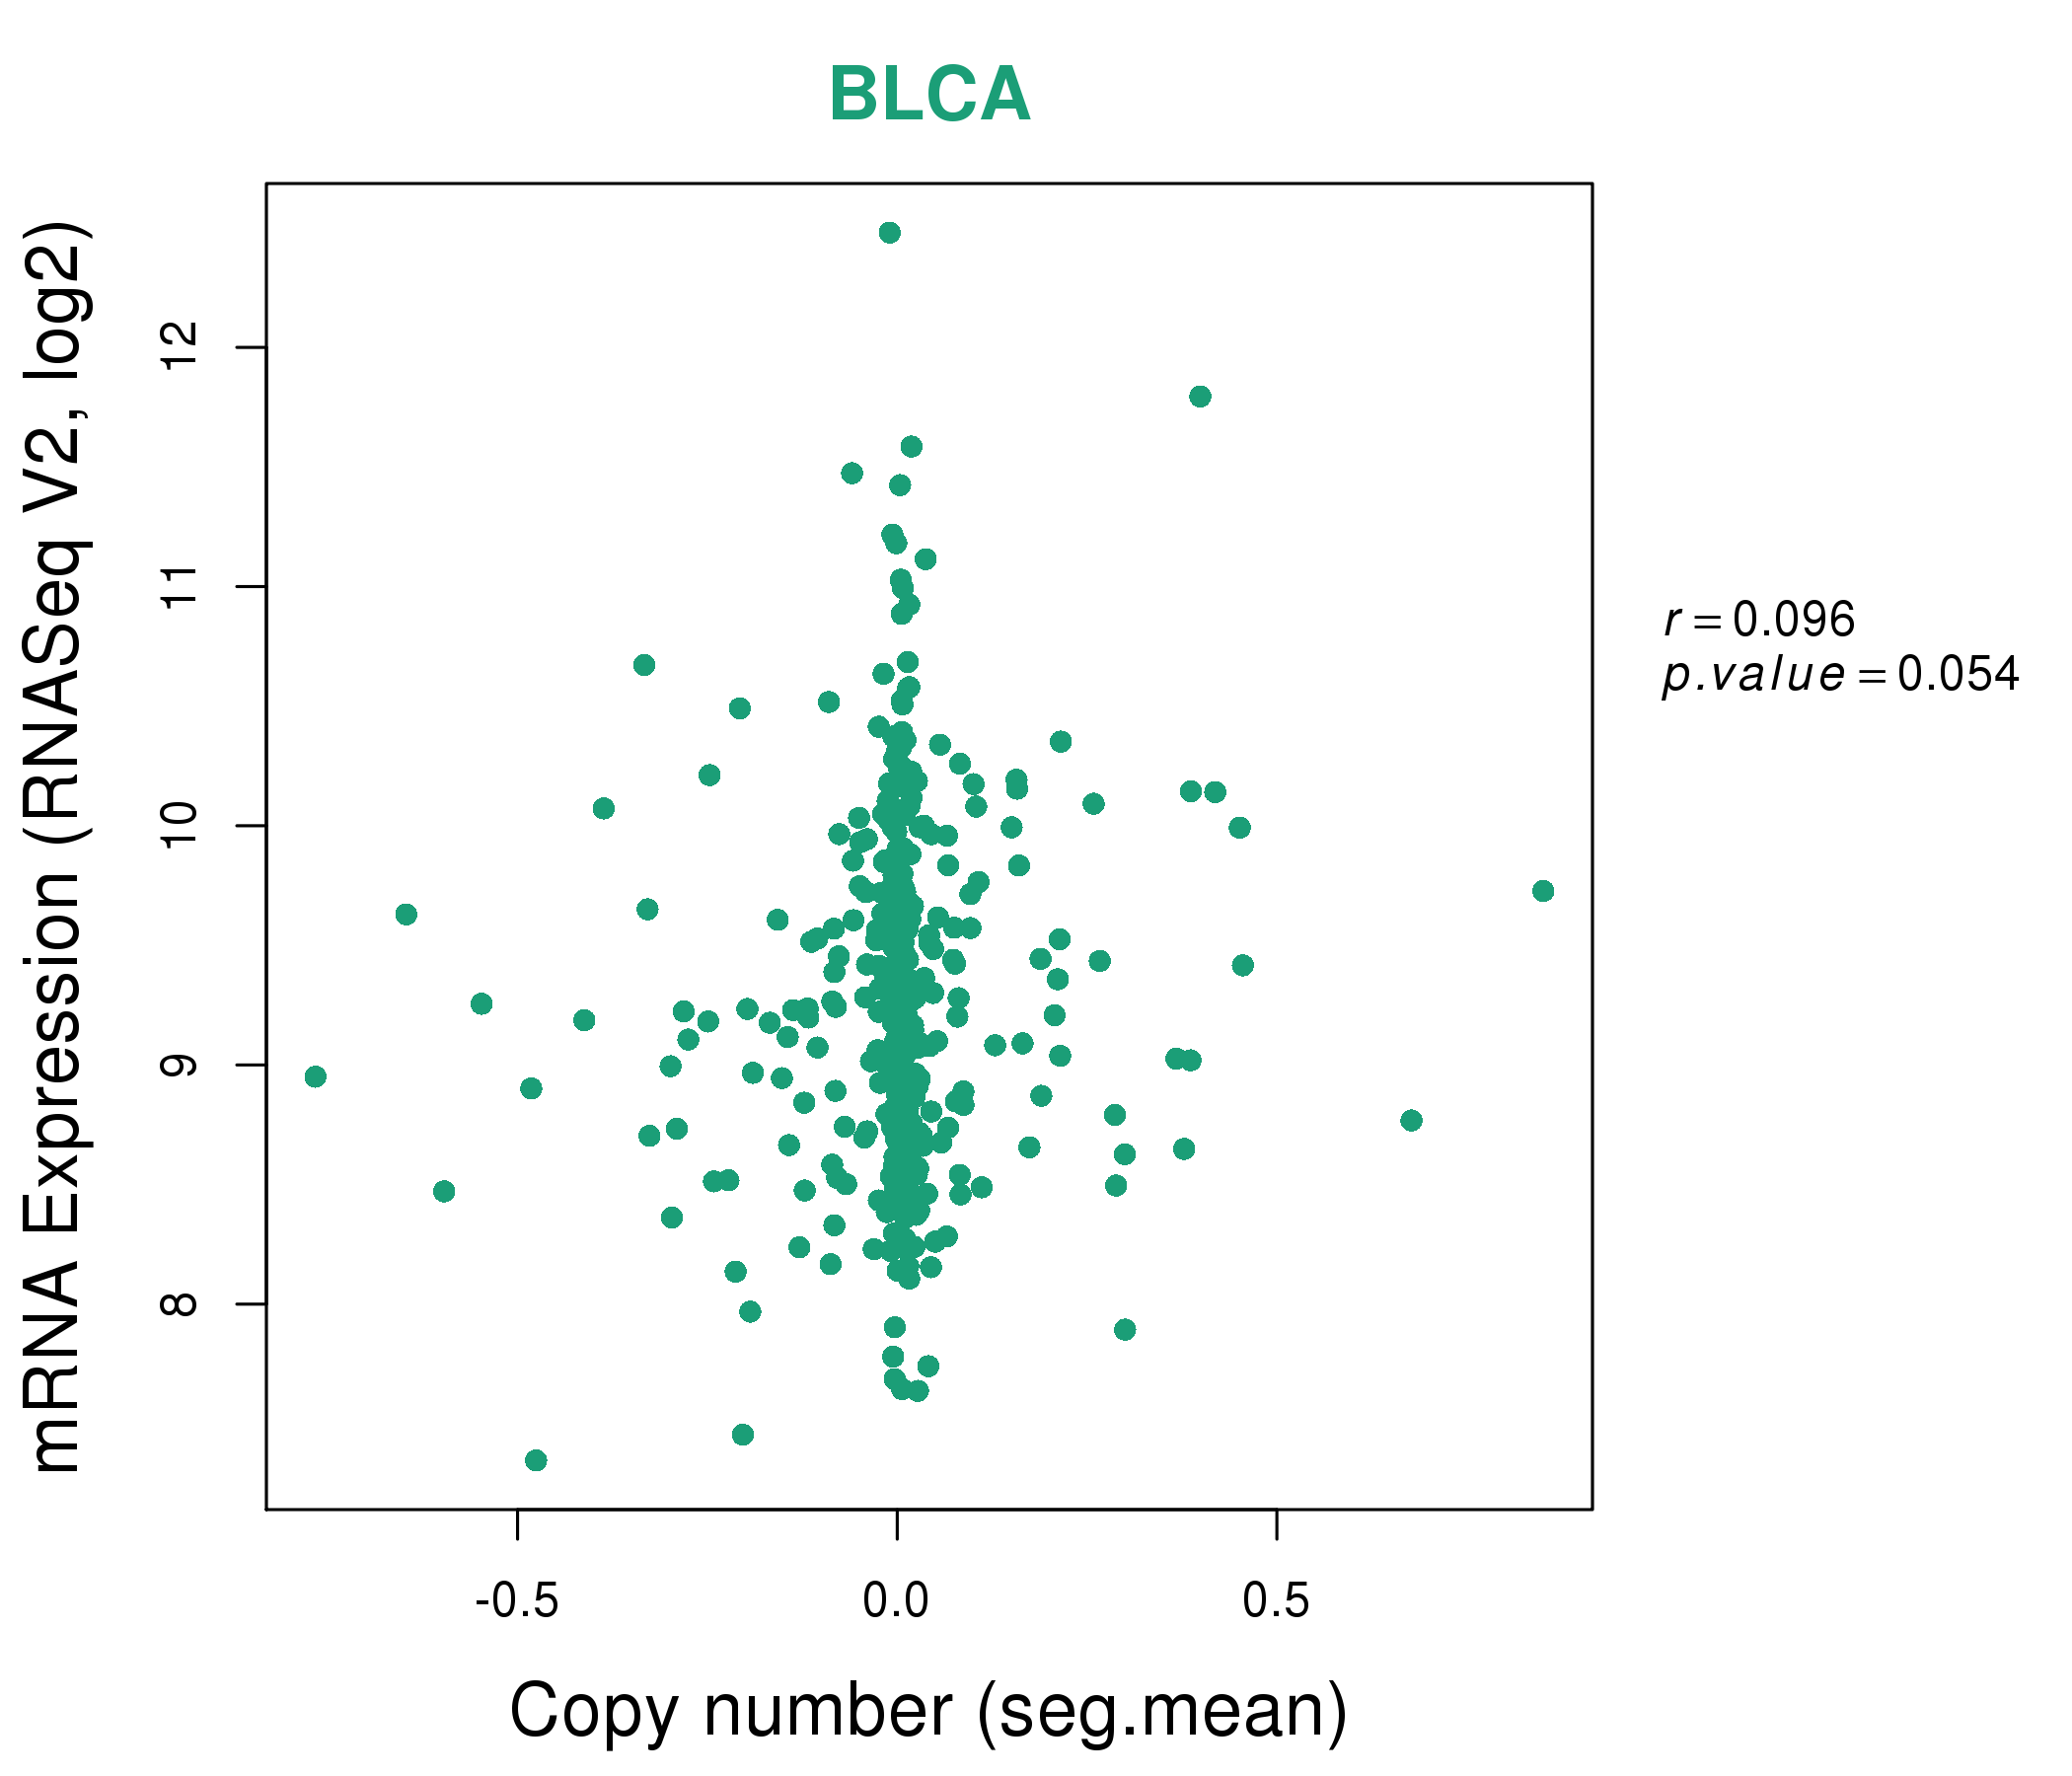
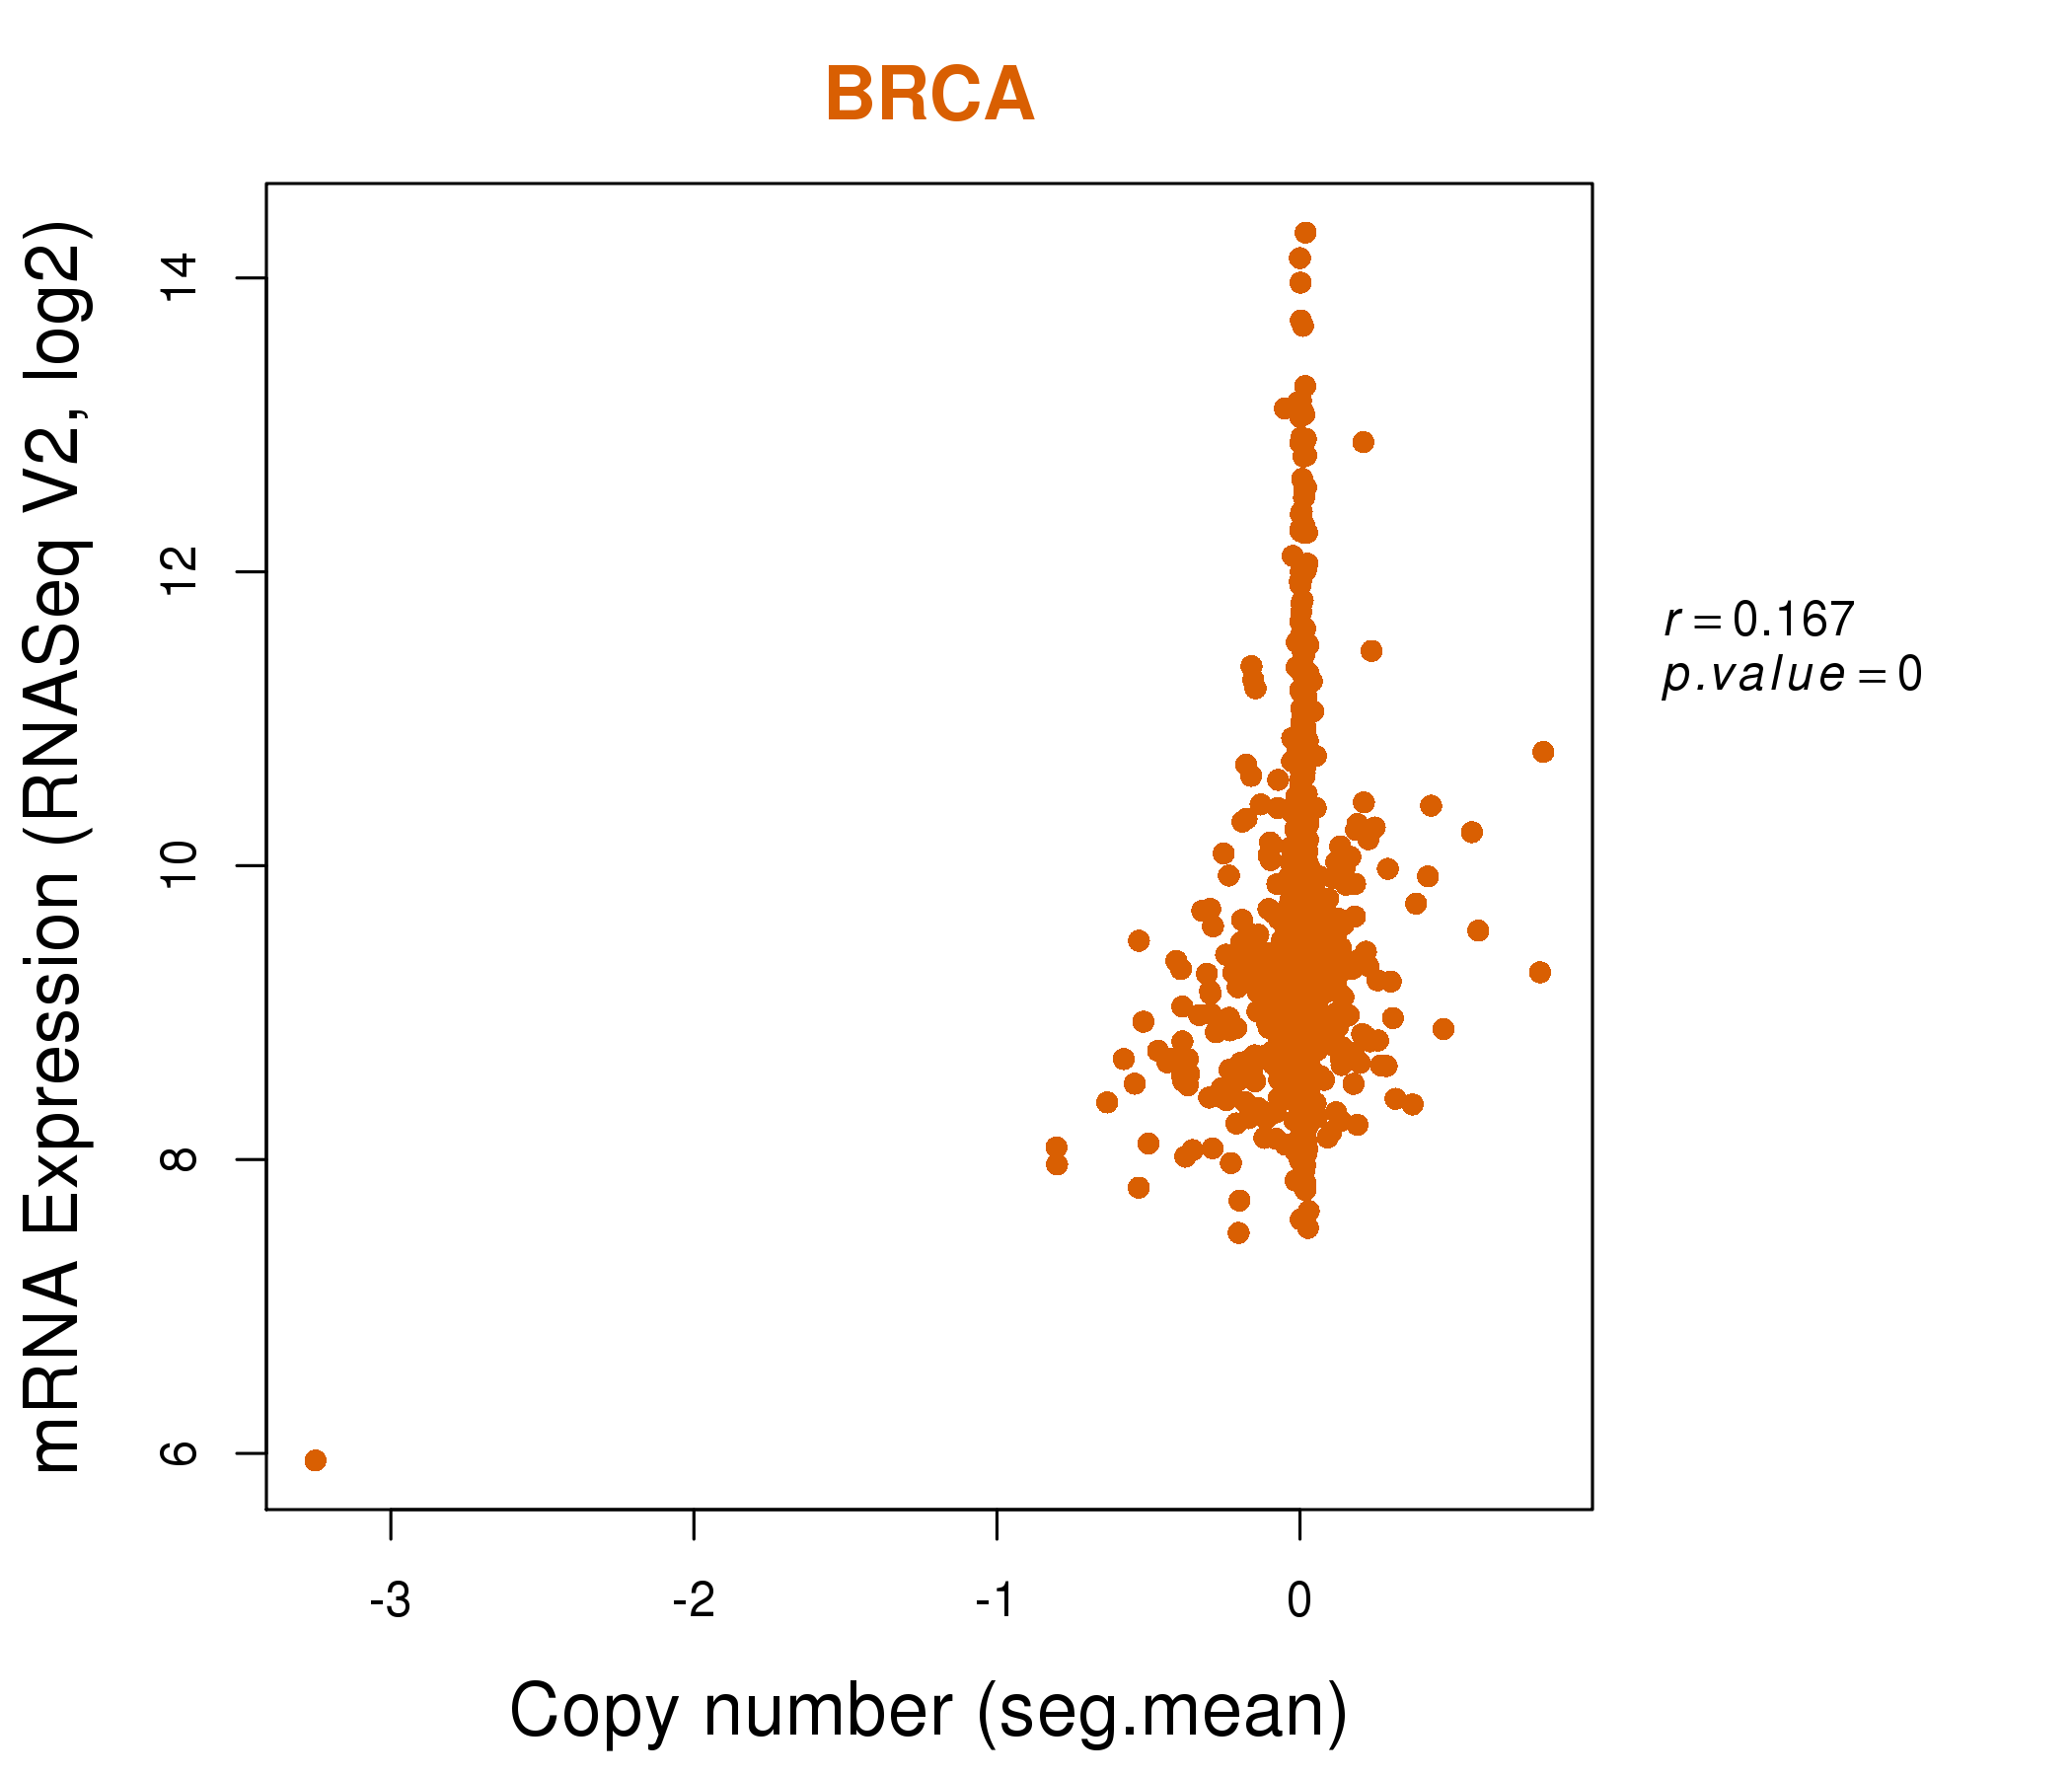
| * This plots show the correlation between CNV and gene expression. |
: Open all plots for all cancer types
 |
|
 |
|
| Top |
| Gene-Gene Network Information |
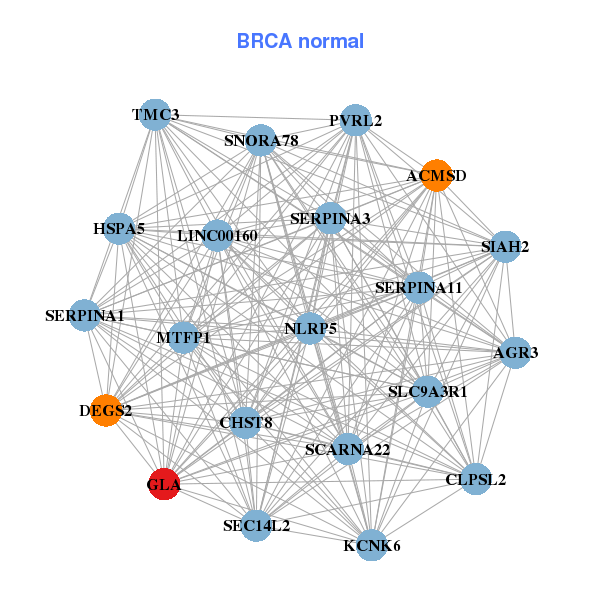
| * Co-Expression network figures were drawn using R package igraph. Only the top 20 genes with the highest correlations were shown. Red circle: input gene, orange circle: cell metabolism gene, sky circle: other gene |
: Open all plots for all cancer types
 |
| ||||
| ARMCX1,ARMCX3,CLIC6,CYP2C8,FUT8,GLA,GLUL, HNRNPH2,LOC645431,LRIG1,MREG,MYB,MYBPC1,NMUR2, NXNL2,PDCD4,PTHLH,RUNX1,SEMA3C,SGK223,TMEM26 | ACMSD,AGR3,CLPSL2,CHST8,DEGS2,GLA,HSPA5, KCNK6,MTFP1,LINC00160,NLRP5,PVRL2,SCARNA22,SEC14L2, SERPINA11,SERPINA1,SERPINA3,SIAH2,SLC9A3R1,SNORA78,TMC3 | ||||
 |
| ||||
| APEX2,CXorf40B,EMD,FTSJ1,GLA,HDAC8,LAS1L, MORF4L2,NAA10,NKRF,NSDHL,PDZD11,PRPS1,RBMX2, SLC25A14,SLC25A5,SUV39H1,TIMM8A,UBE2A,UBL4A,VBP1 | ABHD6,AKR1A1,ANPEP,ANXA4,APOBEC1,ARG2,FUOM, TMEM256,RTCB,IDNK,CA13,CBR1,FAM3B,GCHFR, GK,GK3P,GLA,GLRX,GOLT1A,HOXC9,MOCOS |

| * Co-Expression network figures were drawn using R package igraph. Only the top 20 genes with the highest correlations were shown. Red circle: input gene, orange circle: cell metabolism gene, sky circle: other gene |
: Open all plots for all cancer types
| Top |
: Open all interacting genes' information including KEGG pathway for all interacting genes from DAVID
| Top |
| Pharmacological Information for GLA |
| DB Category | DB Name | DB's ID and Url link |
| Chemistry | BindingDB | P06280; -. |
| Chemistry | ChEMBL | CHEMBL2524; -. |
| Organism-specific databases | PharmGKB | PA28707; -. |
| Organism-specific databases | CTD | 2717; -. |
| * Gene Centered Interaction Network. |
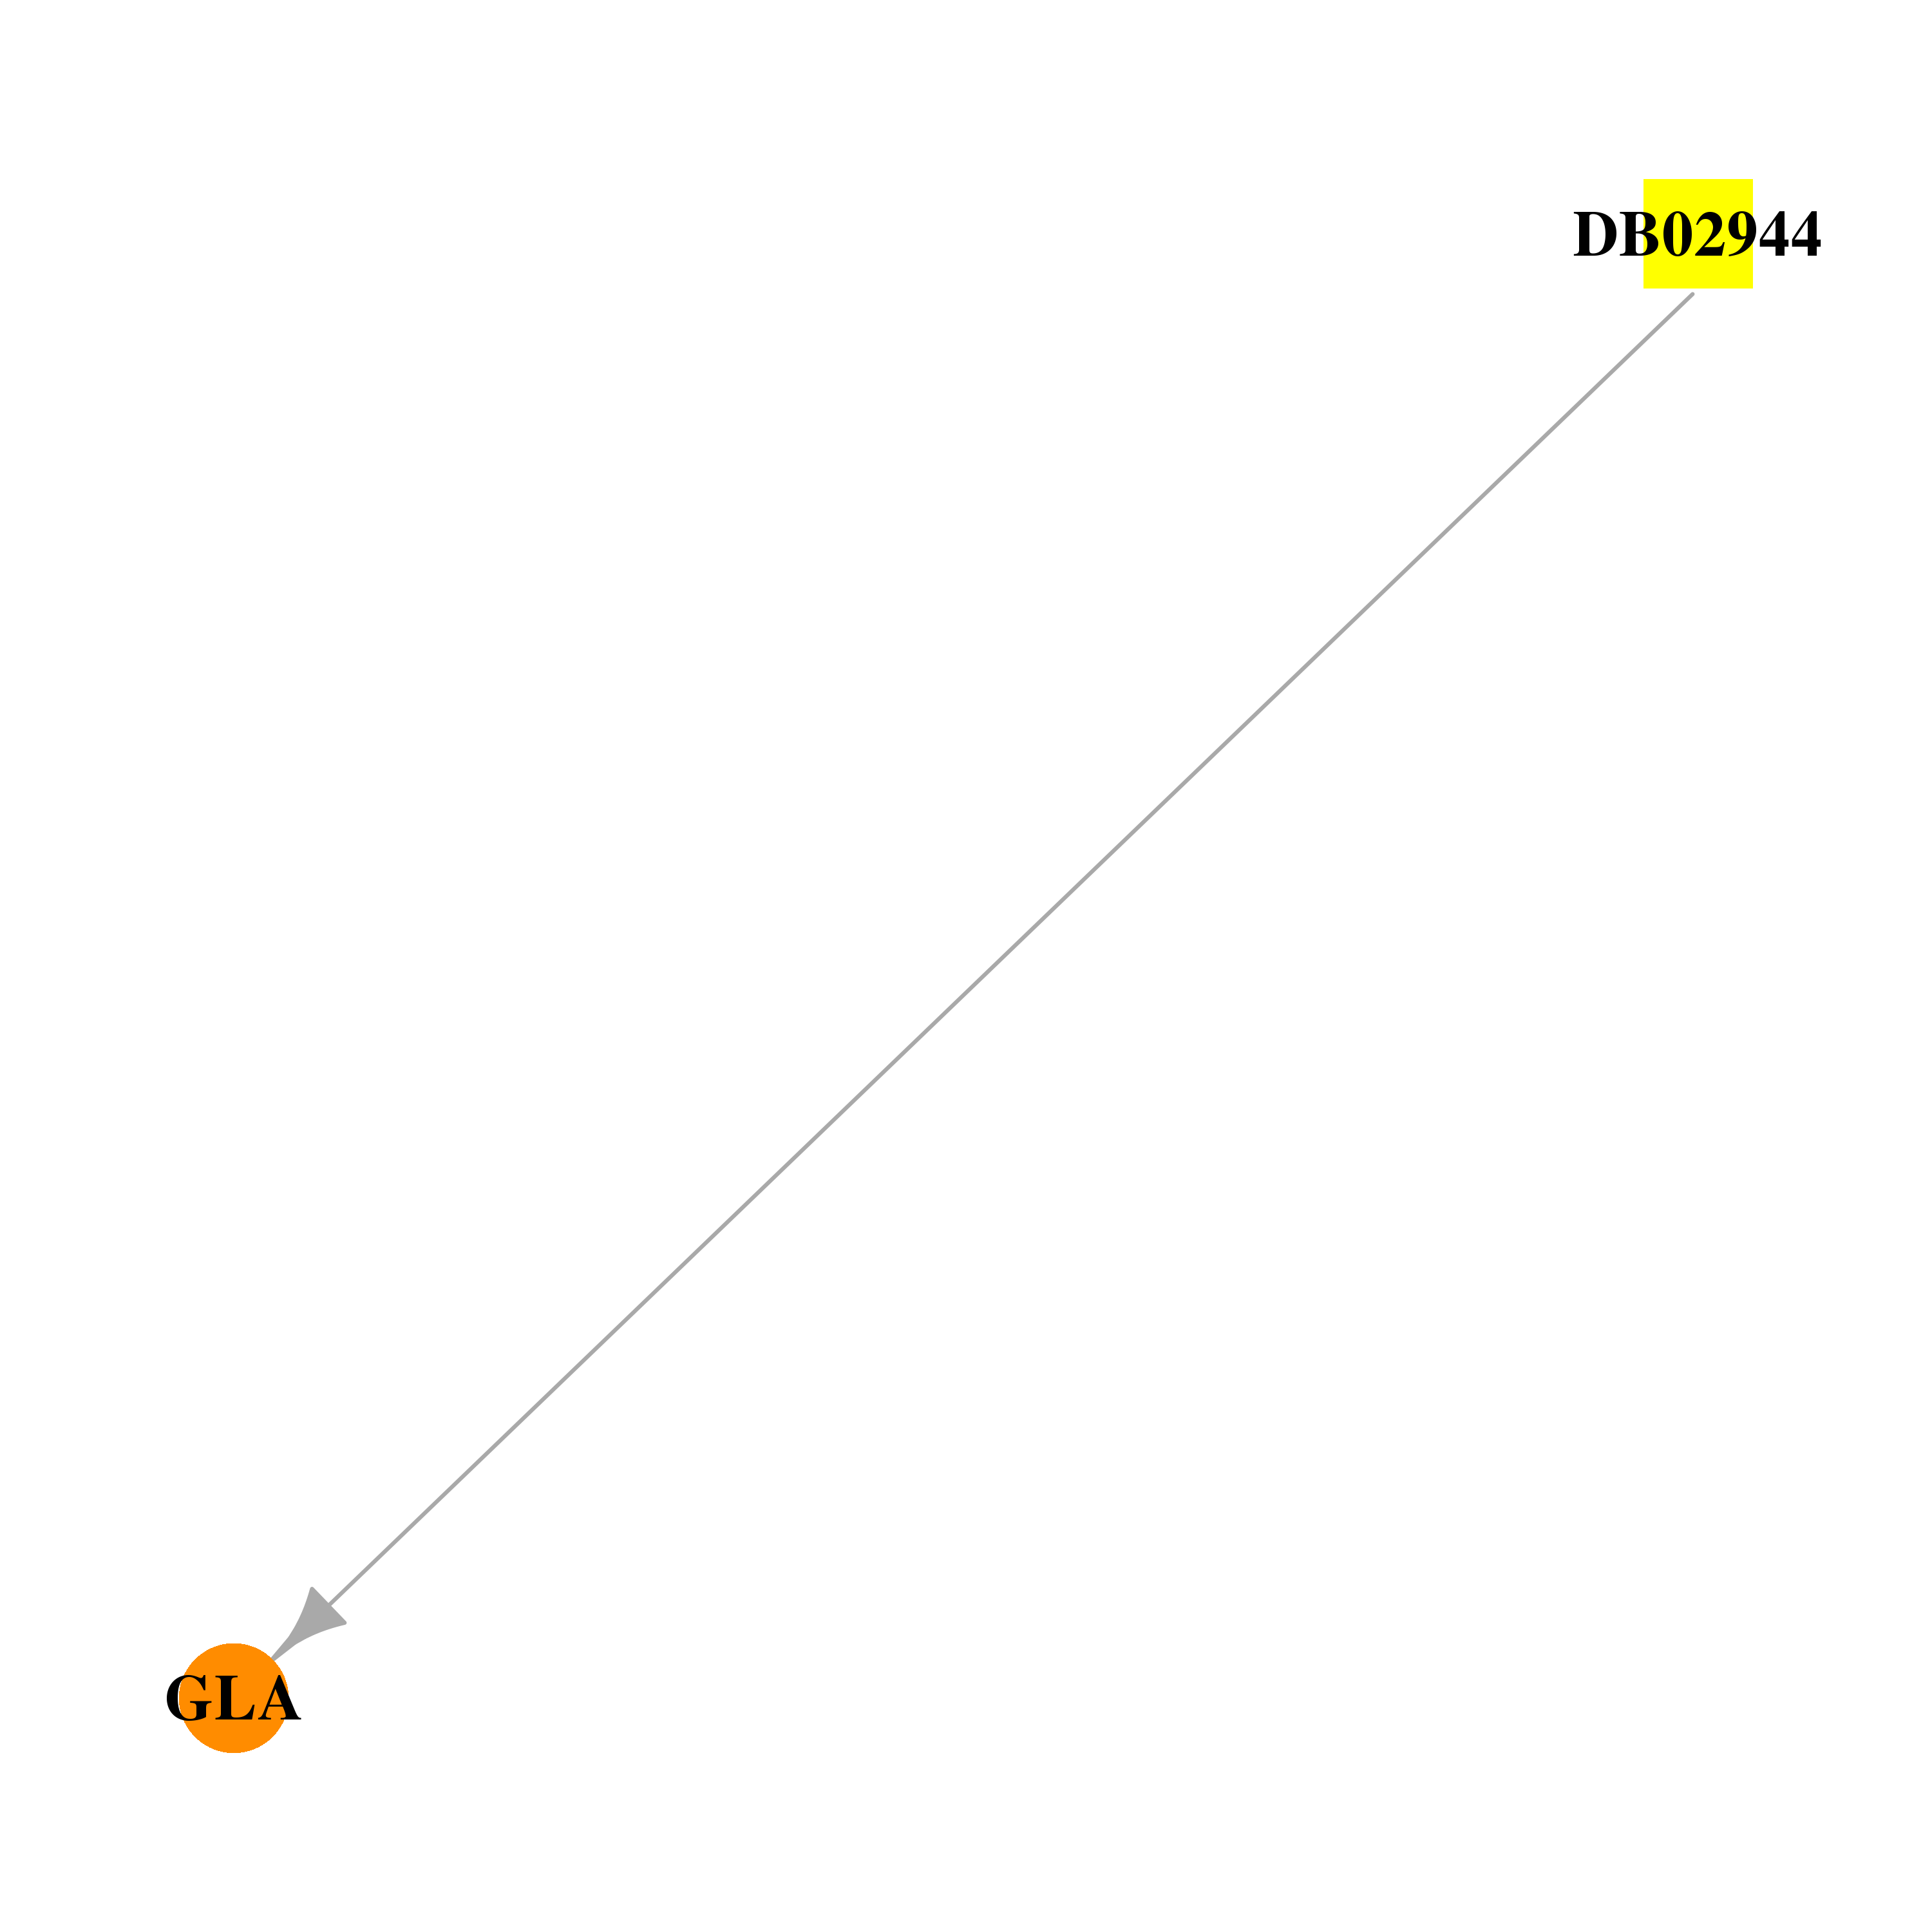 |
| * Drug Centered Interaction Network. |
| DrugBank ID | Target Name | Drug Groups | Generic Name | Drug Centered Network | Drug Structure |
| DB02944 | galactosidase, alpha | experimental | Alpha-D-Mannose |  |  |
| Top |
| Cross referenced IDs for GLA |
| * We obtained these cross-references from Uniprot database. It covers 150 different DBs, 18 categories. http://www.uniprot.org/help/cross_references_section |
: Open all cross reference information
|
Copyright © 2016-Present - The Univsersity of Texas Health Science Center at Houston @ |