|
||||||||||||||||||||
| |
| Phenotypic Information (metabolism pathway, cancer, disease, phenome) |
| |
| |
| Gene-Gene Network Information: Co-Expression Network, Interacting Genes & KEGG |
| |
|


| Gene Summary for AMPD3 |
| Top |
| Phenotypic Information for AMPD3(metabolism pathway, cancer, disease, phenome) |
| Cancer | CGAP: AMPD3 |
| Familial Cancer Database: AMPD3 | |
| * This gene is included in those cancer gene databases. |
|
|
|
|
|
|
| ||||||||||||||
Oncogene 1 | Significant driver gene in | |||||||||||||||||||
| cf) number; DB name 1 Oncogene; http://nar.oxfordjournals.org/content/35/suppl_1/D721.long, 2 Tumor Suppressor gene; https://bioinfo.uth.edu/TSGene/, 3 Cancer Gene Census; http://www.nature.com/nrc/journal/v4/n3/abs/nrc1299.html, 4 CancerGenes; http://nar.oxfordjournals.org/content/35/suppl_1/D721.long, 5 Network of Cancer Gene; http://ncg.kcl.ac.uk/index.php, 1Therapeutic Vulnerabilities in Cancer; http://cbio.mskcc.org/cancergenomics/statius/ |
| KEGG_PURINE_METABOLISM REACTOME_METABOLISM_OF_NUCLEOTIDES REACTOME_PURINE_METABOLISM | |
| OMIM | |
| Orphanet | |
| Disease | KEGG Disease: AMPD3 |
| MedGen: AMPD3 (Human Medical Genetics with Condition) | |
| ClinVar: AMPD3 | |
| Phenotype | MGI: AMPD3 (International Mouse Phenotyping Consortium) |
| PhenomicDB: AMPD3 | |
| Mutations for AMPD3 |
| * Under tables are showing count per each tissue to give us broad intuition about tissue specific mutation patterns.You can go to the detailed page for each mutation database's web site. |
| There's no structural variation information in COSMIC data for this gene. |
| * From mRNA Sanger sequences, Chitars2.0 arranged chimeric transcripts. This table shows AMPD3 related fusion information. |
| ID | Head Gene | Tail Gene | Accession | Gene_a | qStart_a | qEnd_a | Chromosome_a | tStart_a | tEnd_a | Gene_a | qStart_a | qEnd_a | Chromosome_a | tStart_a | tEnd_a |
| BI027290 | CLEC18A | 1 | 183 | 16 | 70152414 | 70152597 | AMPD3 | 179 | 406 | 11 | 10518039 | 10518266 | |
| AW882230 | AMPD3 | 14 | 236 | 11 | 10495832 | 10496054 | PTMS | 232 | 301 | 12 | 6879812 | 6879881 | |
| CD109332 | AMPD3 | 1 | 114 | 11 | 10471947 | 10472060 | IER3 | 103 | 370 | 6 | 2043297 | 2043564 | |
| BF915326 | AMPD3 | 19 | 251 | 11 | 10494805 | 10495037 | MAN1B1 | 250 | 541 | 9 | 139981514 | 139983346 | |
| Top |
| There's no copy number variation information in COSMIC data for this gene. |
| Top |
|
 |
| Top |
| Stat. for Non-Synonymous SNVs (# total SNVs=54) | (# total SNVs=13) |
 |  |
(# total SNVs=3) | (# total SNVs=1) |
 |  |
| Top |
| * When you move the cursor on each content, you can see more deailed mutation information on the Tooltip. Those are primary_site,primary_histology,mutation(aa),pubmedID. |
| GRCh37 position | Mutation(aa) | Unique sampleID count |
| chr11:10527270-10527270 | p.L724M | 2 |
| chr11:10503622-10503622 | p.D156N | 2 |
| chr11:10508849-10508849 | p.E302K | 2 |
| chr11:10527315-10527315 | p.R739* | 2 |
| chr11:10515037-10515037 | p.G370C | 2 |
| chr11:10527398-10527398 | p.M766I | 2 |
| chr11:10483070-10483070 | p.P11S | 2 |
| chr11:10500095-10500095 | p.R91W | 2 |
| chr11:10526201-10526203 | p.H717delH | 1 |
| chr11:10500113-10500113 | p.L97L | 1 |
| Top |
|
 |
| Point Mutation/ Tissue ID | 1 | 2 | 3 | 4 | 5 | 6 | 7 | 8 | 9 | 10 | 11 | 12 | 13 | 14 | 15 | 16 | 17 | 18 | 19 | 20 |
| # sample | 4 | 1 | 1 | 8 | 1 | 1 | 3 | 4 | 7 | 1 | 1 | 19 | 15 | 1 | 6 | |||||
| # mutation | 4 | 1 | 1 | 10 | 1 | 1 | 3 | 4 | 8 | 1 | 1 | 21 | 16 | 1 | 7 | |||||
| nonsynonymous SNV | 3 | 1 | 8 | 1 | 1 | 3 | 1 | 6 | 1 | 16 | 14 | 1 | 5 | |||||||
| synonymous SNV | 1 | 1 | 2 | 3 | 2 | 1 | 5 | 2 | 2 |
| cf) Tissue ID; Tissue type (1; BLCA[Bladder Urothelial Carcinoma], 2; BRCA[Breast invasive carcinoma], 3; CESC[Cervical squamous cell carcinoma and endocervical adenocarcinoma], 4; COAD[Colon adenocarcinoma], 5; GBM[Glioblastoma multiforme], 6; Glioma Low Grade, 7; HNSC[Head and Neck squamous cell carcinoma], 8; KICH[Kidney Chromophobe], 9; KIRC[Kidney renal clear cell carcinoma], 10; KIRP[Kidney renal papillary cell carcinoma], 11; LAML[Acute Myeloid Leukemia], 12; LUAD[Lung adenocarcinoma], 13; LUSC[Lung squamous cell carcinoma], 14; OV[Ovarian serous cystadenocarcinoma ], 15; PAAD[Pancreatic adenocarcinoma], 16; PRAD[Prostate adenocarcinoma], 17; SKCM[Skin Cutaneous Melanoma], 18:STAD[Stomach adenocarcinoma], 19:THCA[Thyroid carcinoma], 20:UCEC[Uterine Corpus Endometrial Carcinoma]) |
| Top |
| * We represented just top 10 SNVs. When you move the cursor on each content, you can see more deailed mutation information on the Tooltip. Those are primary_site, primary_histology, mutation(aa), pubmedID. |
| Genomic Position | Mutation(aa) | Unique sampleID count |
| chr11:10527398 | p.T94T,AMPD3 | 2 |
| chr11:10506536 | p.M598I,AMPD3 | 2 |
| chr11:10508849 | p.E134K,AMPD3 | 2 |
| chr11:10500113 | p.A35D,AMPD3 | 1 |
| chr11:10516458 | p.T130M,AMPD3 | 1 |
| chr11:10527309 | p.T157I,AMPD3 | 1 |
| chr11:10503757 | p.Y257D,AMPD3 | 1 |
| chr11:10517233 | p.L451L,AMPD3 | 1 |
| chr11:10483090 | p.R39R,AMPD3 | 1 |
| chr11:10514899 | p.Q20K,AMPD3 | 1 |
| * Copy number data were extracted from TCGA using R package TCGA-Assembler. The URLs of all public data files on TCGA DCC data server were gathered on Jan-05-2015. Function ProcessCNAData in TCGA-Assembler package was used to obtain gene-level copy number value which is calculated as the average copy number of the genomic region of a gene. |
 |
| cf) Tissue ID[Tissue type]: BLCA[Bladder Urothelial Carcinoma], BRCA[Breast invasive carcinoma], CESC[Cervical squamous cell carcinoma and endocervical adenocarcinoma], COAD[Colon adenocarcinoma], GBM[Glioblastoma multiforme], Glioma Low Grade, HNSC[Head and Neck squamous cell carcinoma], KICH[Kidney Chromophobe], KIRC[Kidney renal clear cell carcinoma], KIRP[Kidney renal papillary cell carcinoma], LAML[Acute Myeloid Leukemia], LUAD[Lung adenocarcinoma], LUSC[Lung squamous cell carcinoma], OV[Ovarian serous cystadenocarcinoma ], PAAD[Pancreatic adenocarcinoma], PRAD[Prostate adenocarcinoma], SKCM[Skin Cutaneous Melanoma], STAD[Stomach adenocarcinoma], THCA[Thyroid carcinoma], UCEC[Uterine Corpus Endometrial Carcinoma] |
| Top |
| Gene Expression for AMPD3 |
| * CCLE gene expression data were extracted from CCLE_Expression_Entrez_2012-10-18.res: Gene-centric RMA-normalized mRNA expression data. |
 |
| * Normalized gene expression data of RNASeqV2 was extracted from TCGA using R package TCGA-Assembler. The URLs of all public data files on TCGA DCC data server were gathered at Jan-05-2015. Only eight cancer types have enough normal control samples for differential expression analysis. (t test, adjusted p<0.05 (using Benjamini-Hochberg FDR)) |
 |
| Top |
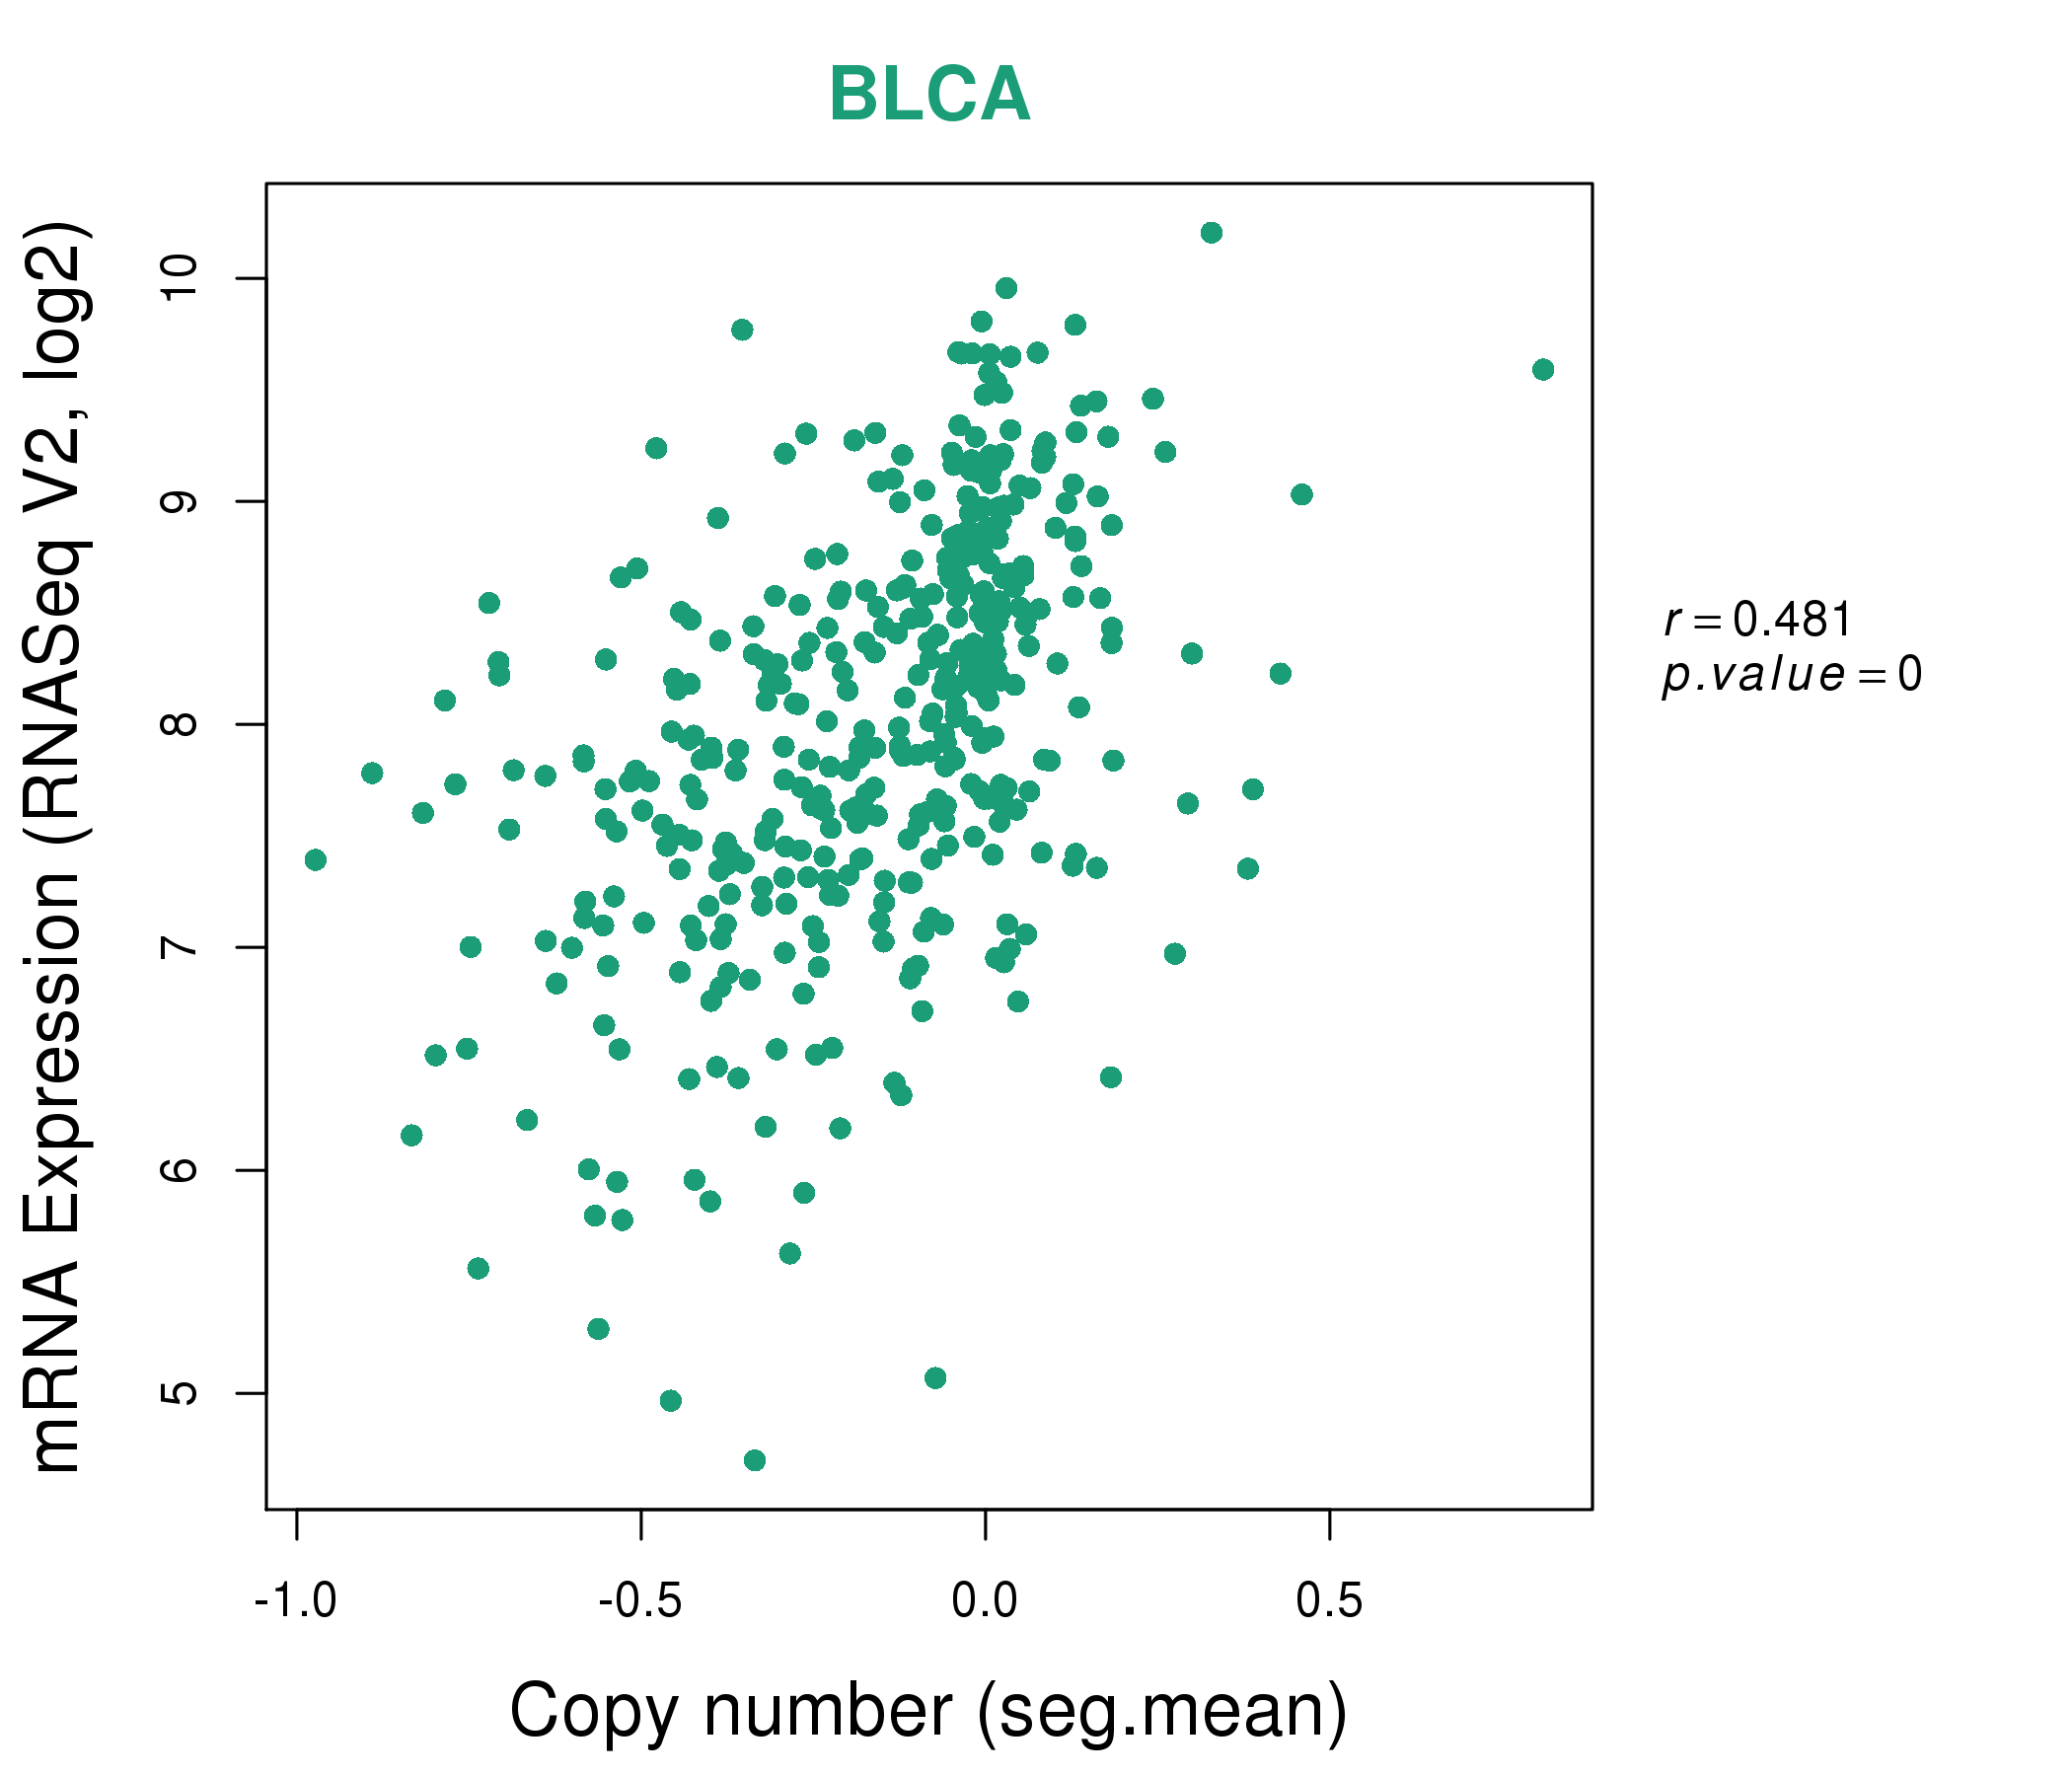
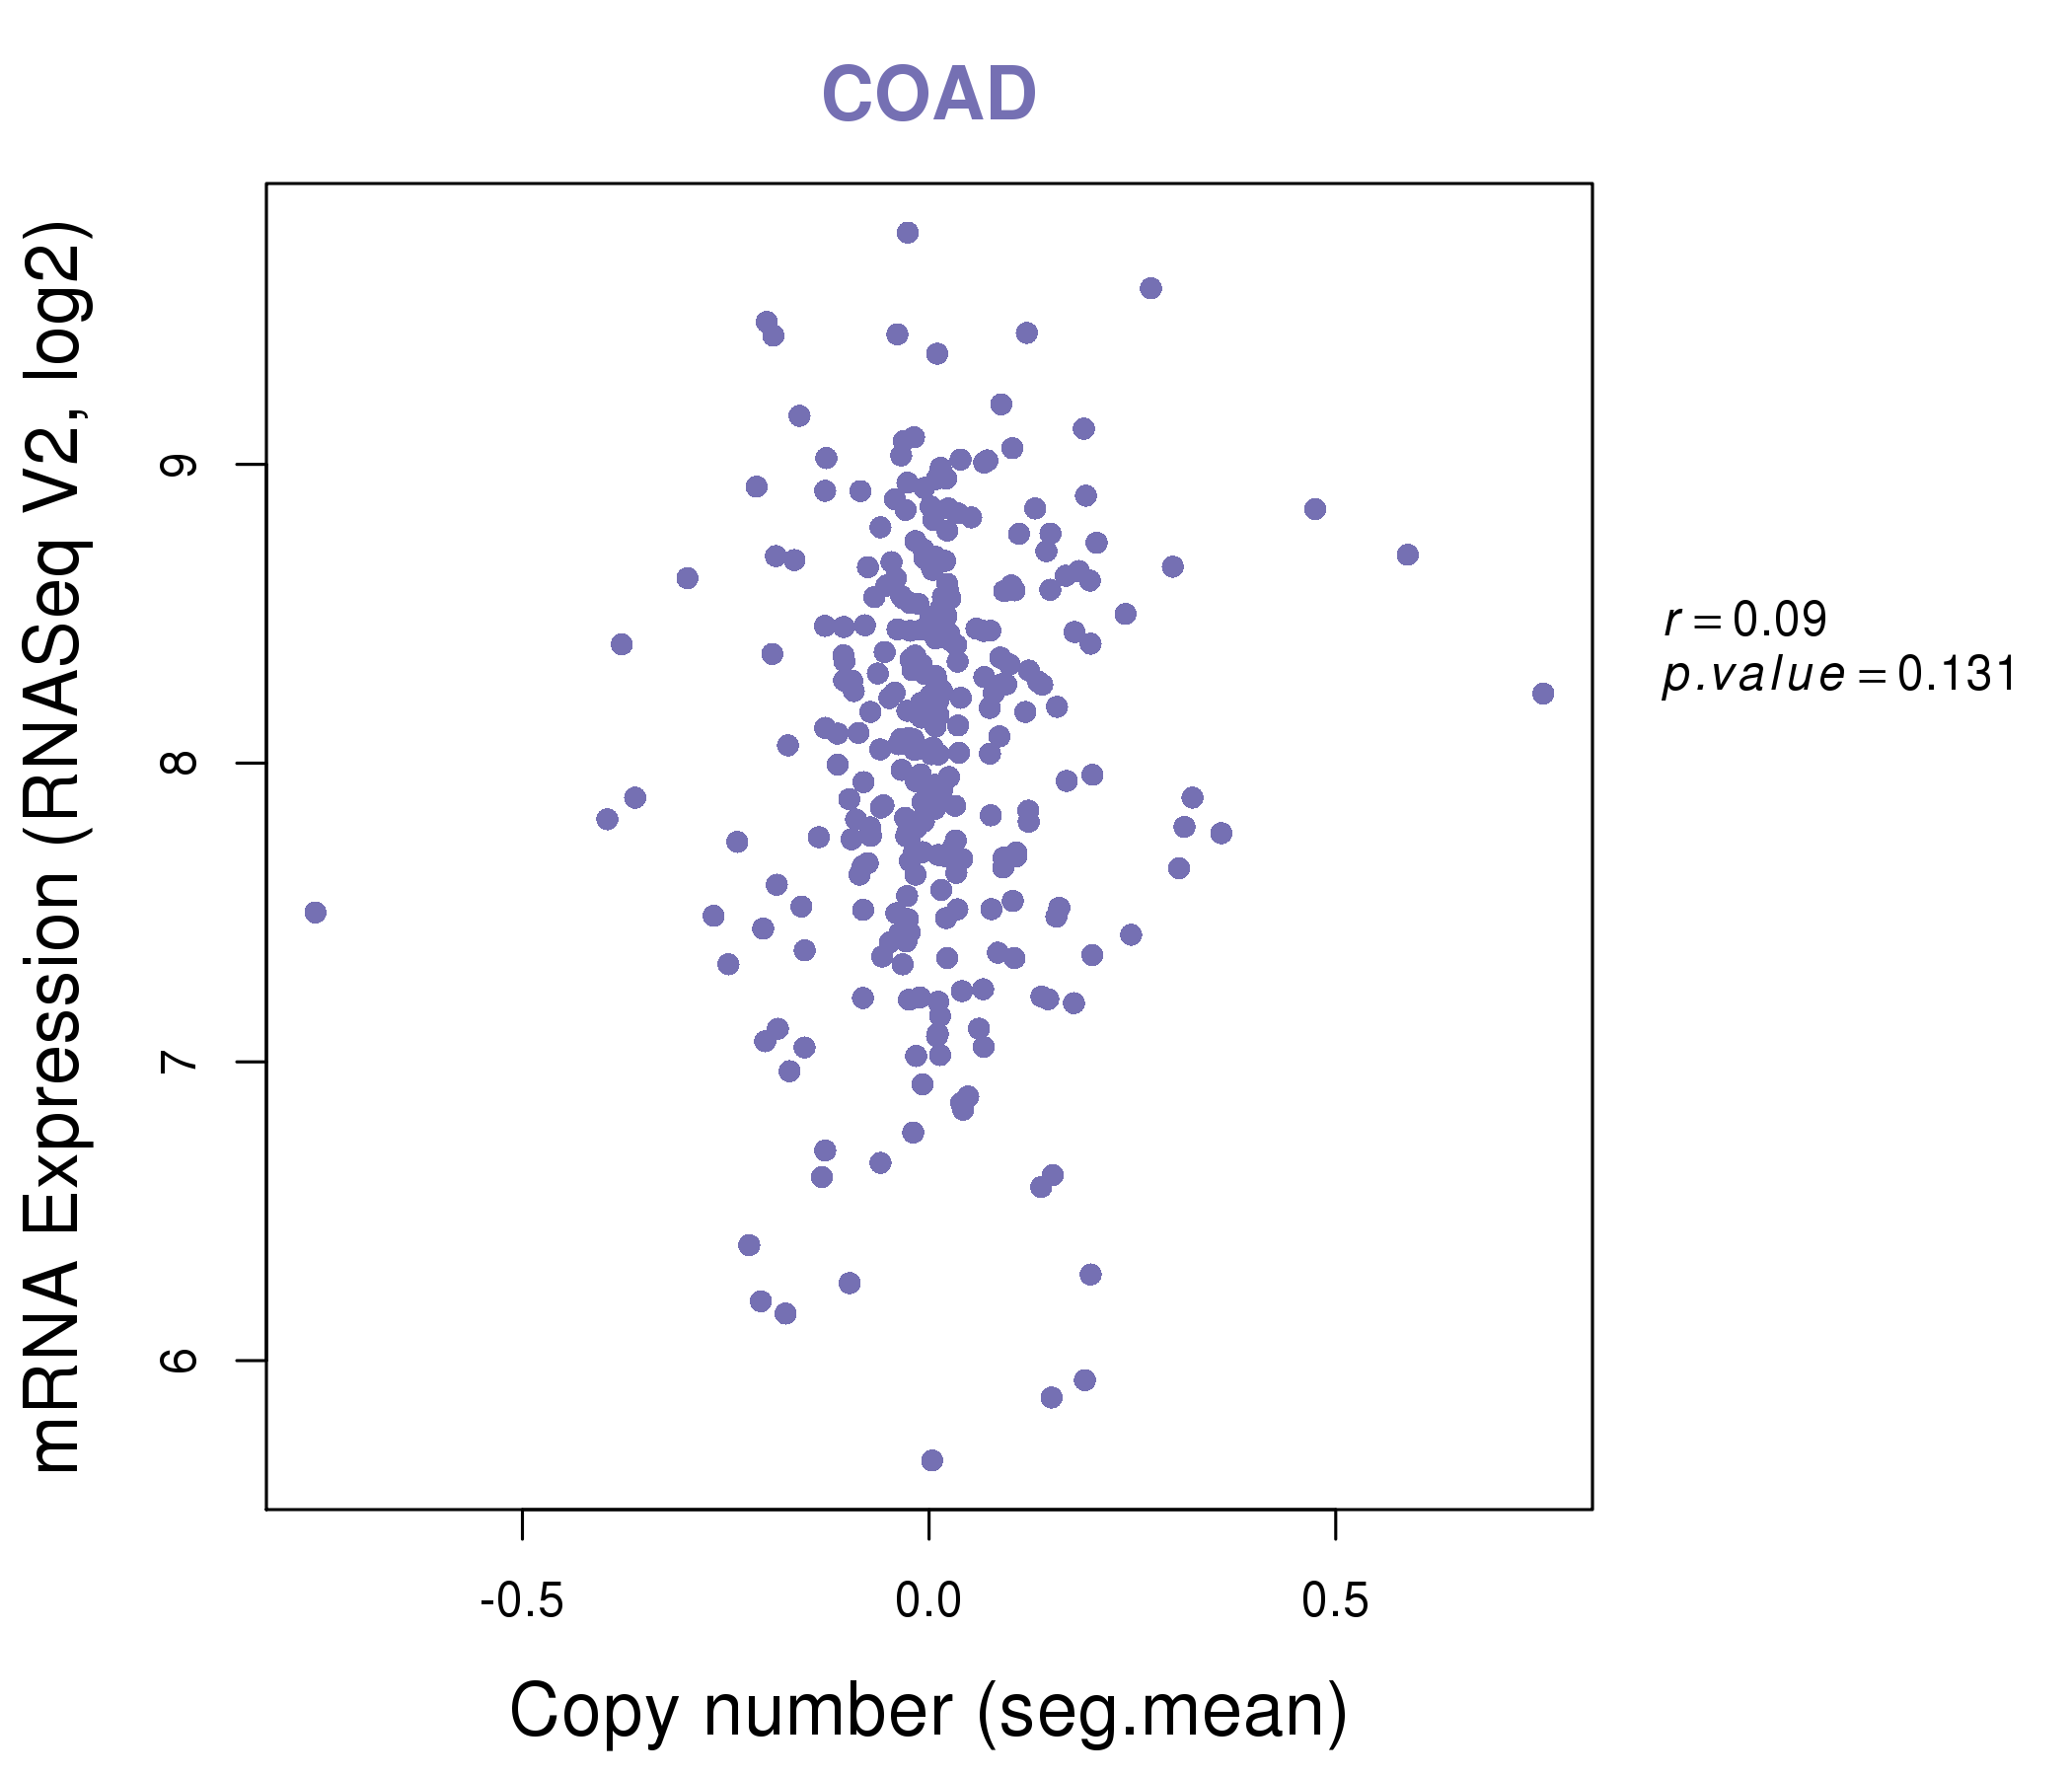
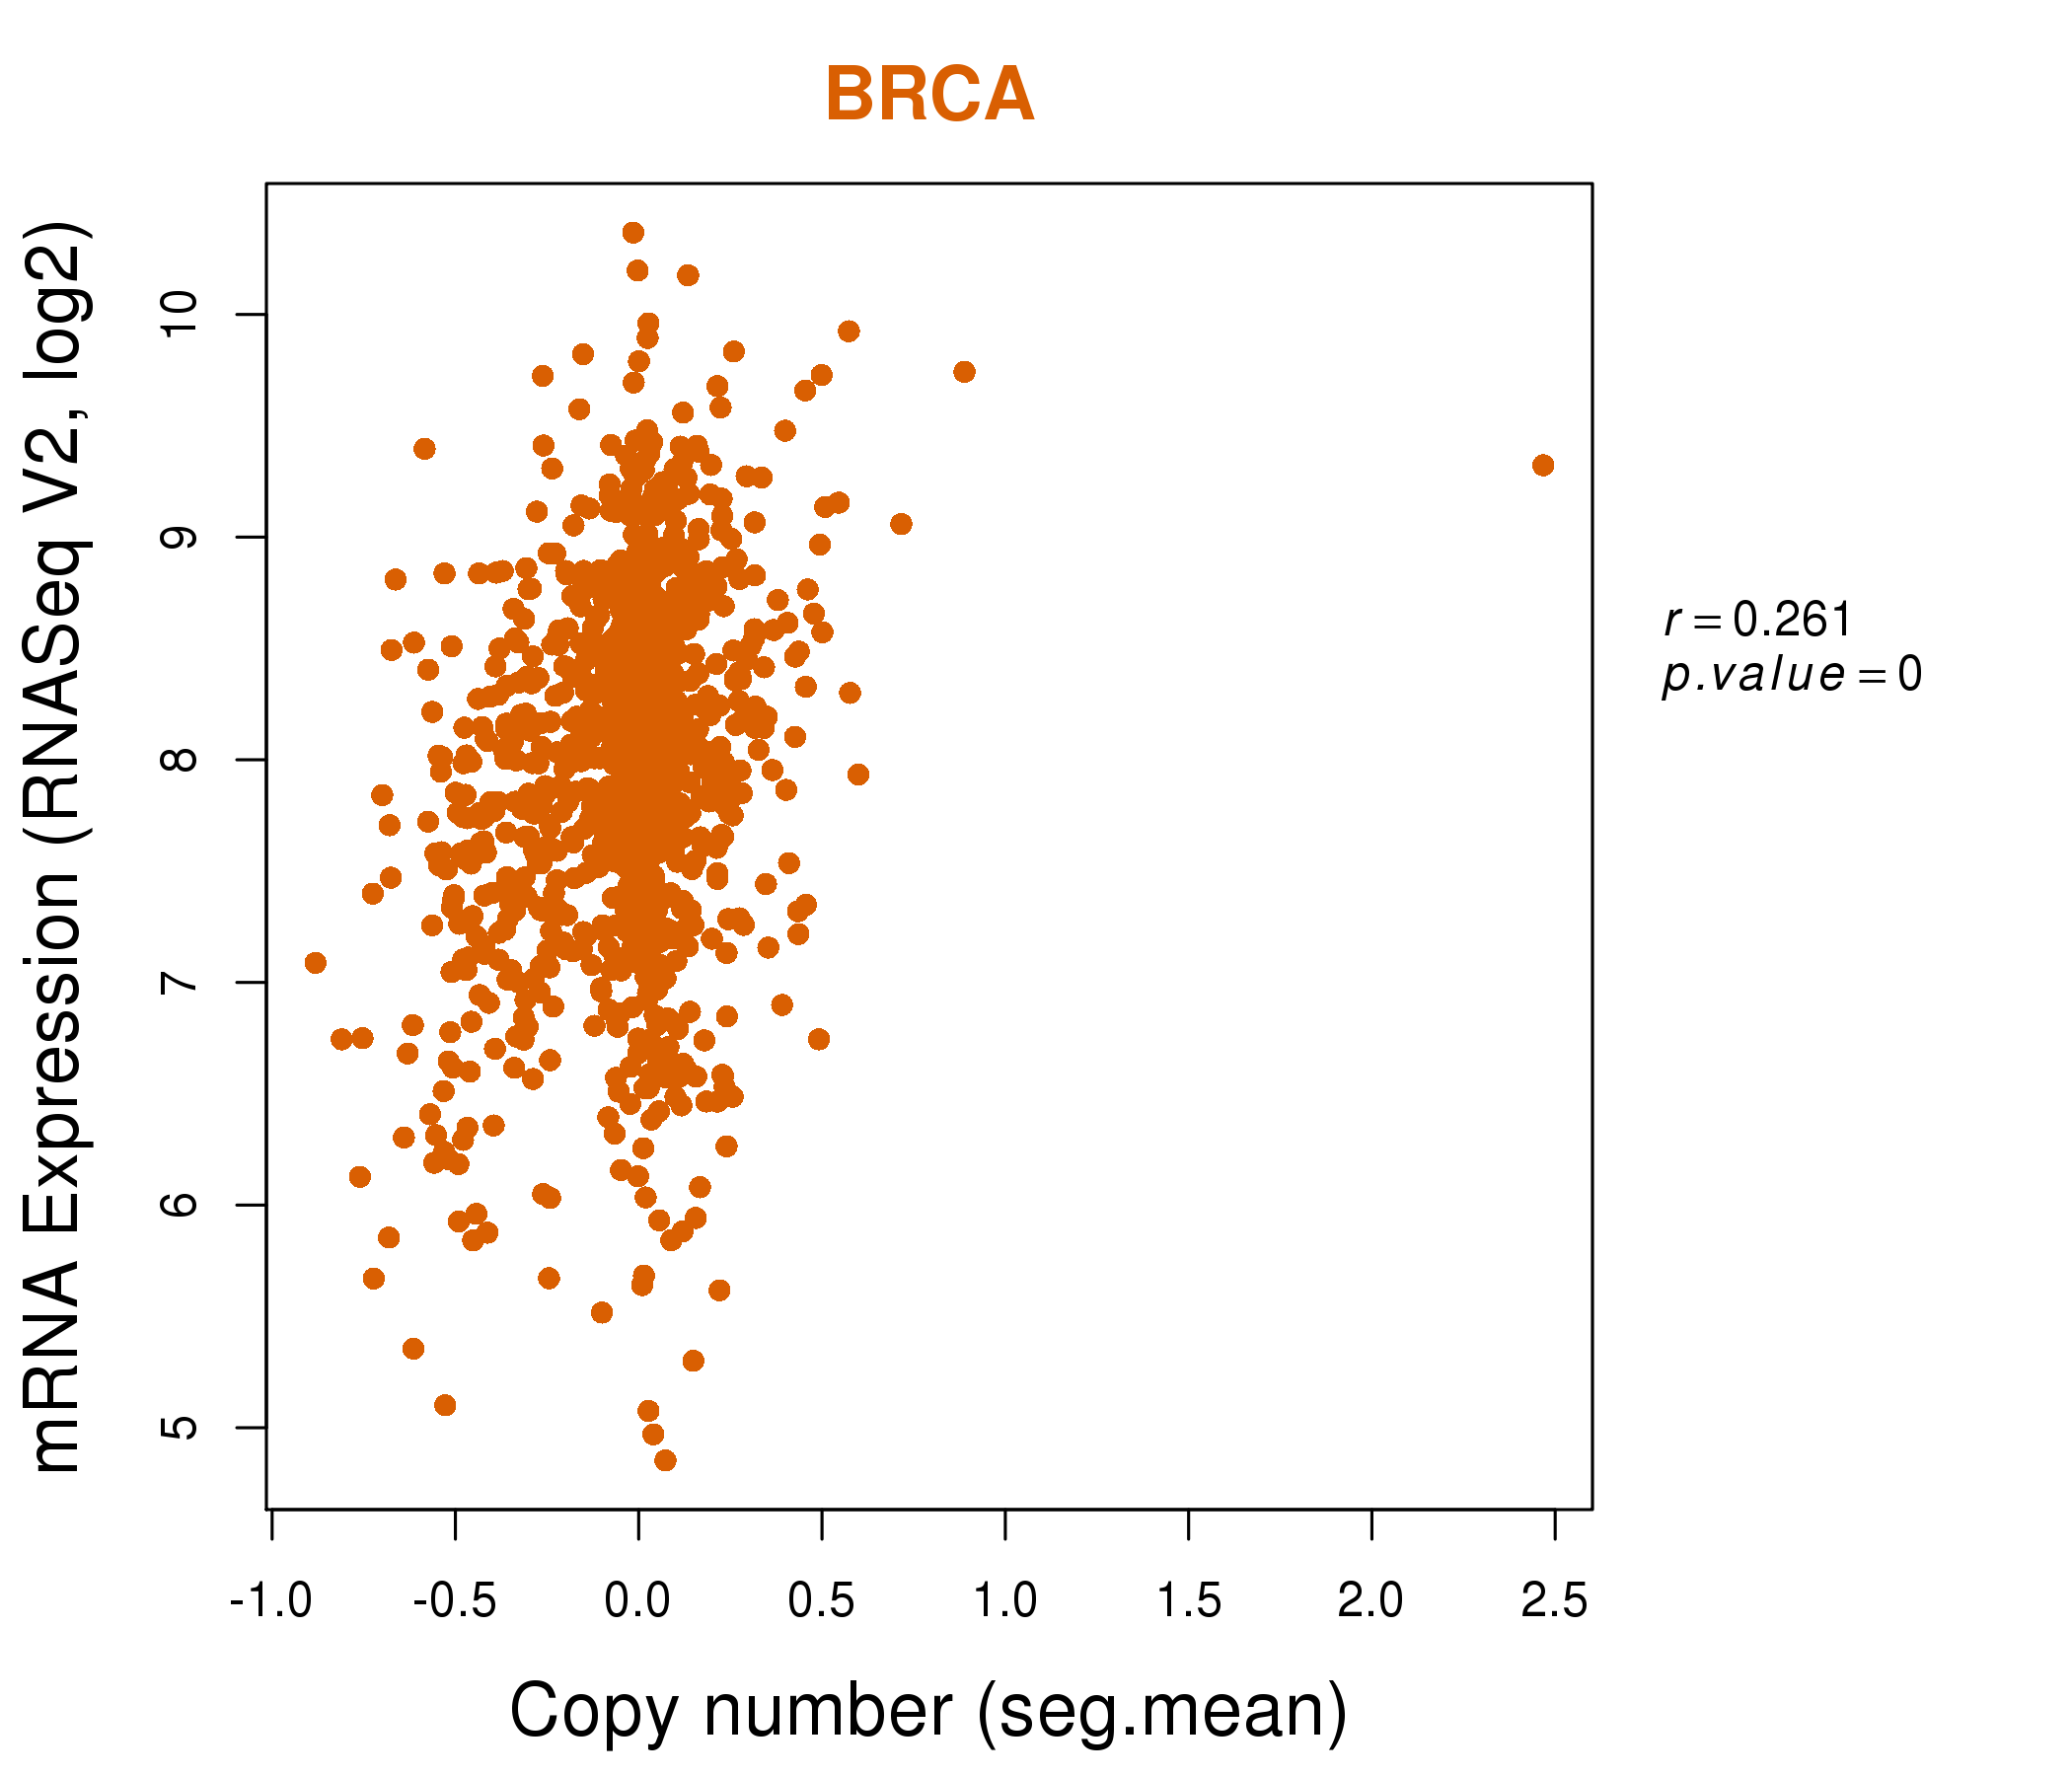
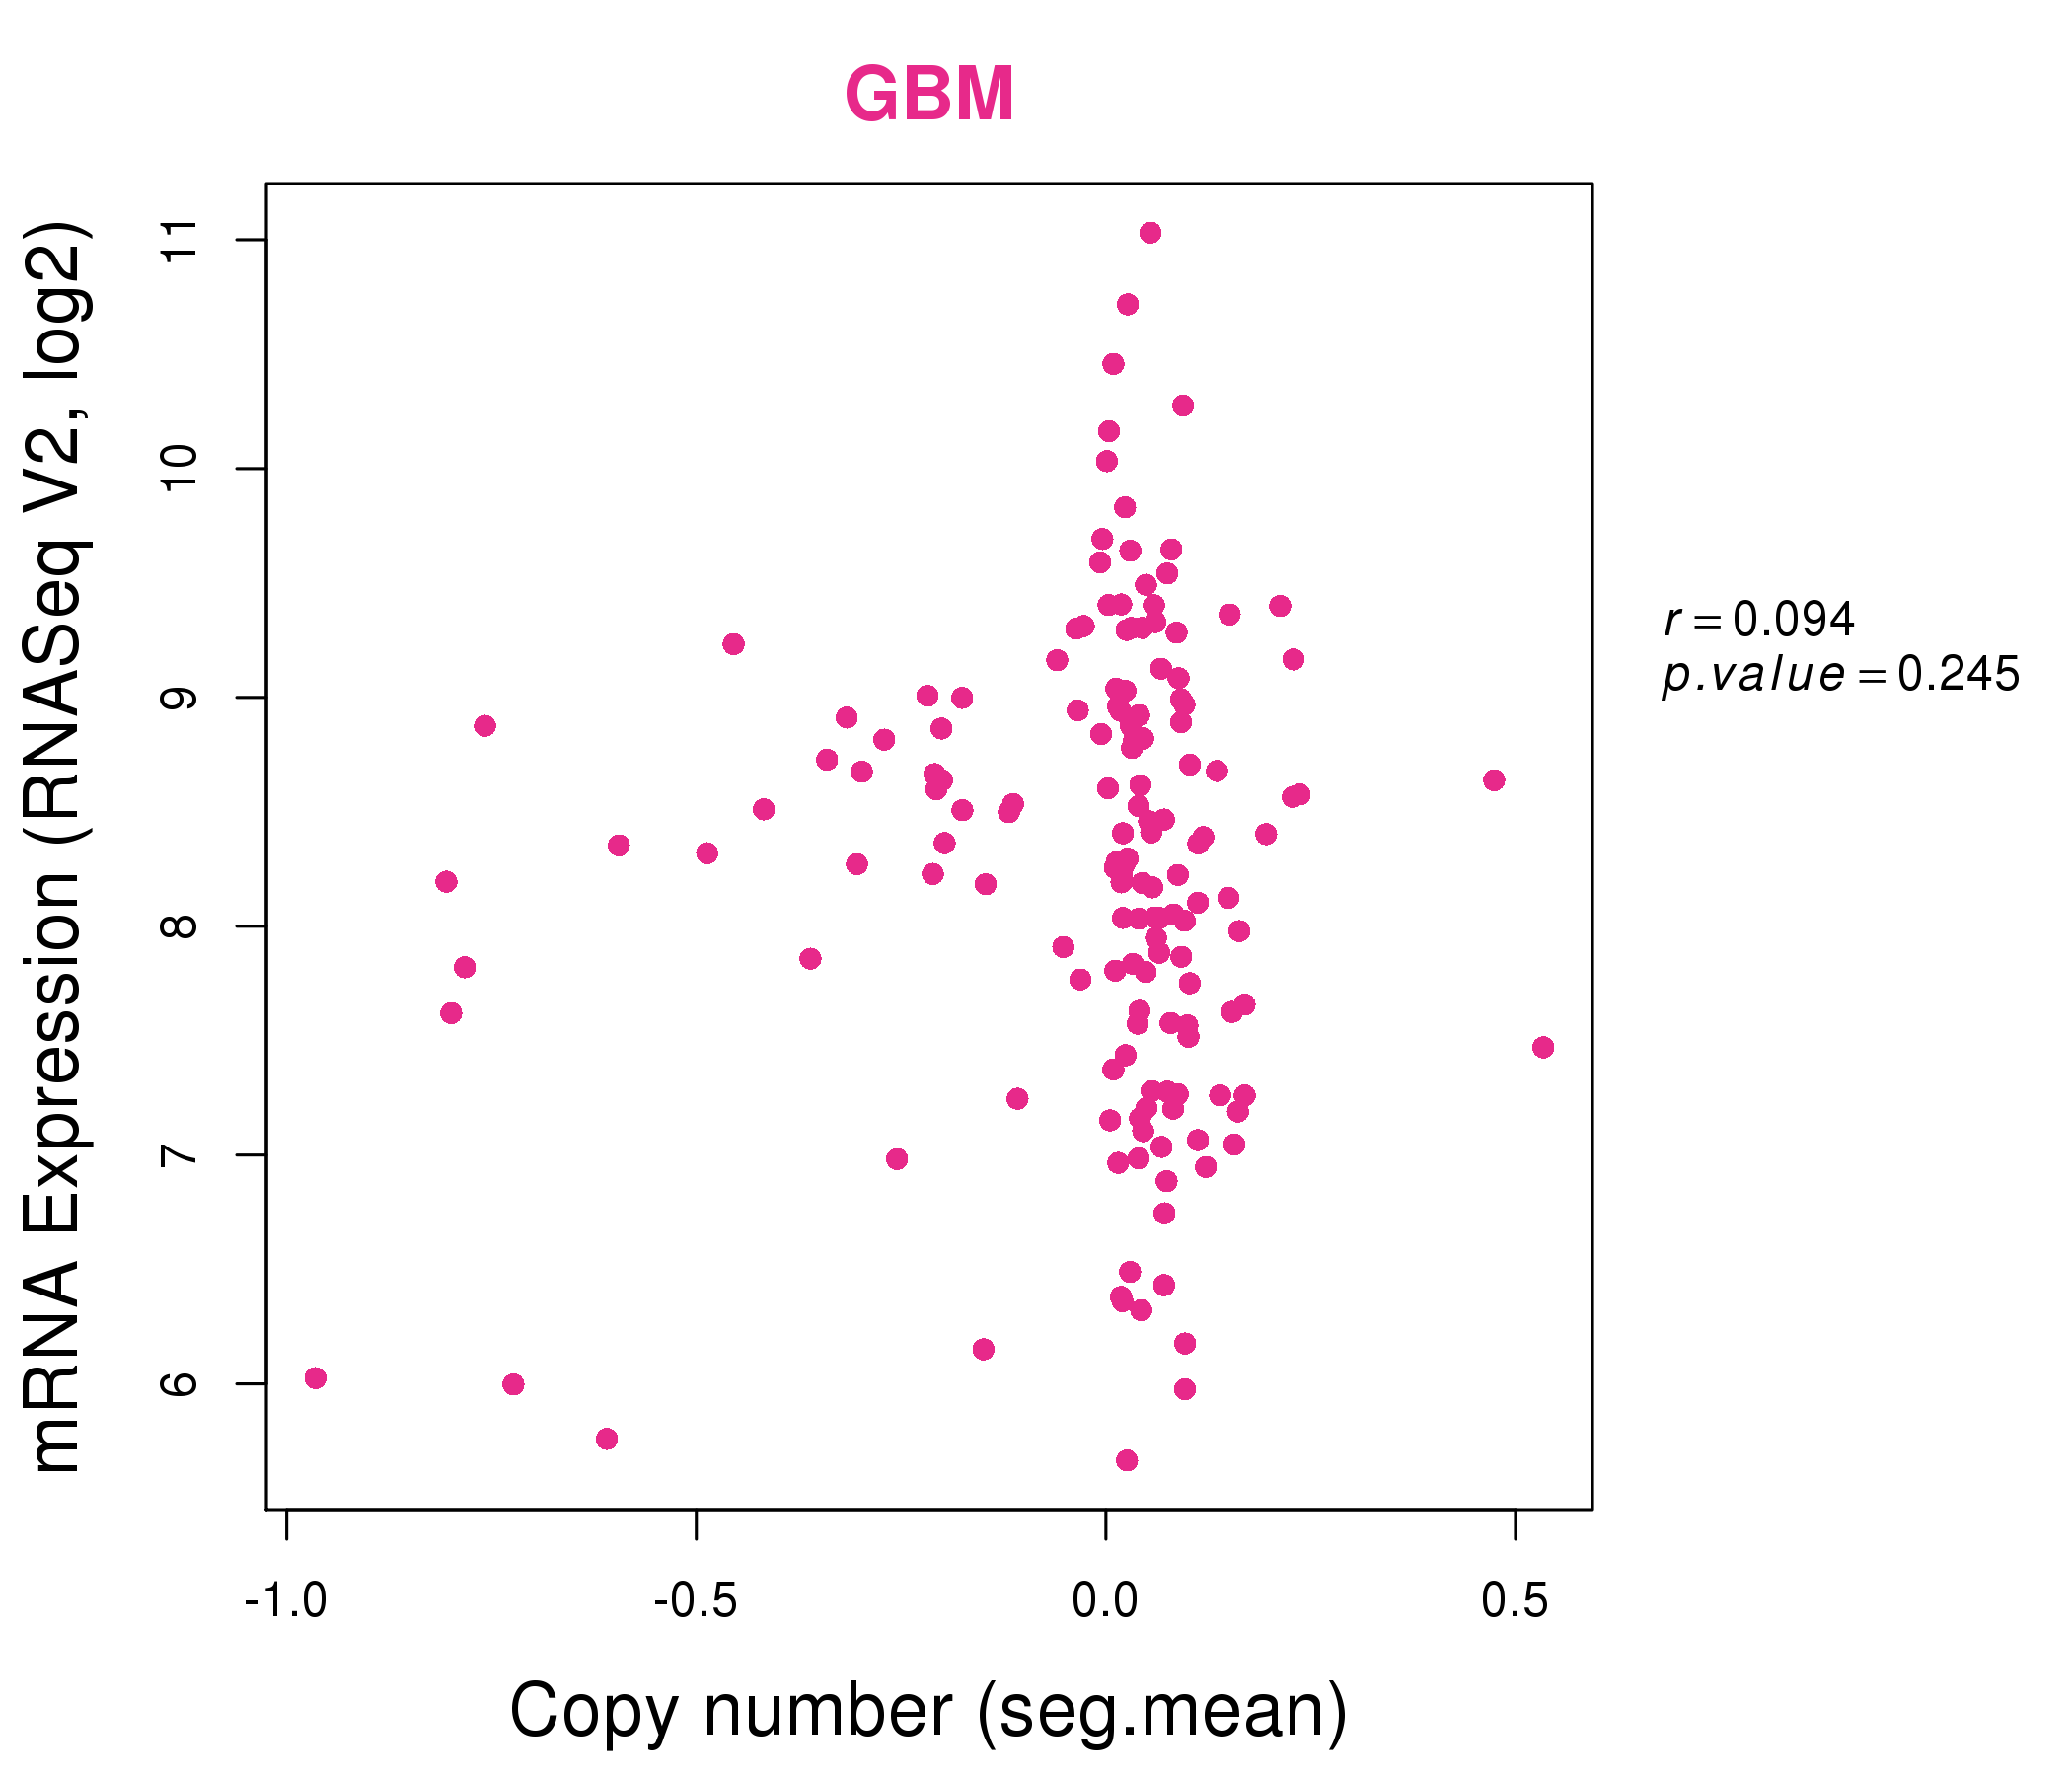
| * This plots show the correlation between CNV and gene expression. |
: Open all plots for all cancer types
 |
|
 |
|
| Top |
| Gene-Gene Network Information |
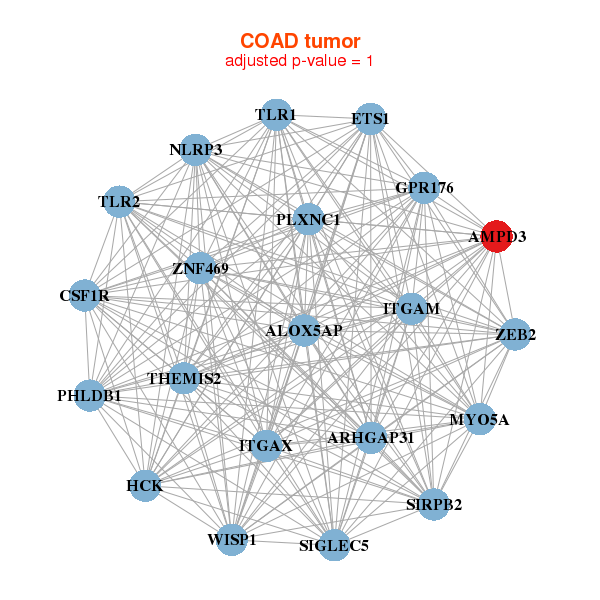
| * Co-Expression network figures were drawn using R package igraph. Only the top 20 genes with the highest correlations were shown. Red circle: input gene, orange circle: cell metabolism gene, sky circle: other gene |
: Open all plots for all cancer types
 |
| ||||
| AMPD3,BTK,CD4,CD53,CXorf21,CYBB,DOCK2, EVI2B,FYB,GPR65,LAPTM5,LCP2,MARCH1,MPEG1, NCKAP1L,PIK3CG,PLEK,PTAFR,PTPRC,SNX20,TFEC | AMPD3,ATP8A1,CAB39,CACNA2D1,CD38,COL19A1,DENND4B, FAM78A,GPA33,HTR7,LACTB,LOC728989,LRRC66,MBP, OSBPL11,P2RX5,P2RX6,RCSD1,SEMA4D,SHD,SMYD2 | ||||
 |
| ||||
| ALOX5AP,AMPD3,ARHGAP31,THEMIS2,CSF1R,ETS1,GPR176, HCK,ITGAM,ITGAX,MYO5A,NLRP3,PHLDB1,PLXNC1, SIGLEC5,SIRPB2,TLR1,TLR2,WISP1,ZEB2,ZNF469 | AMPD3,ANKZF1,ANO7,CACNA2D2,COL2A1,INSM1,KIAA1147, KIAA1324,MAP3K1,MCF2L,MUTYH,NEIL1,NEK8,NKX2-2, PGBD2,PTPRN2,RAP1GAP,SIAH2,SLC38A11,SYTL1,ZNF253 |
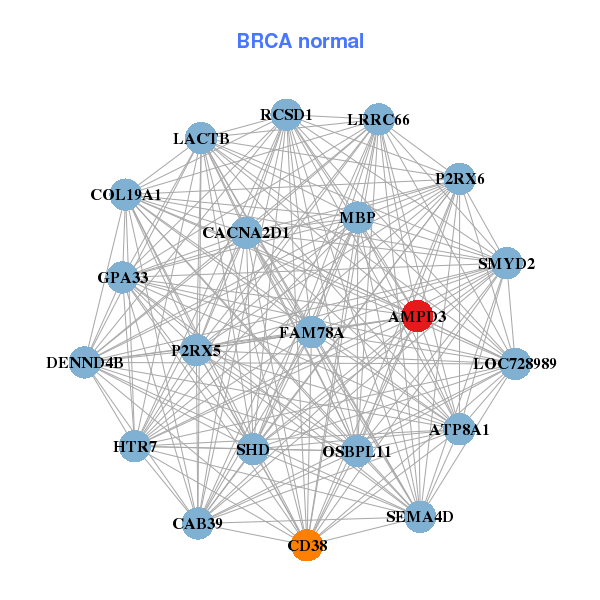
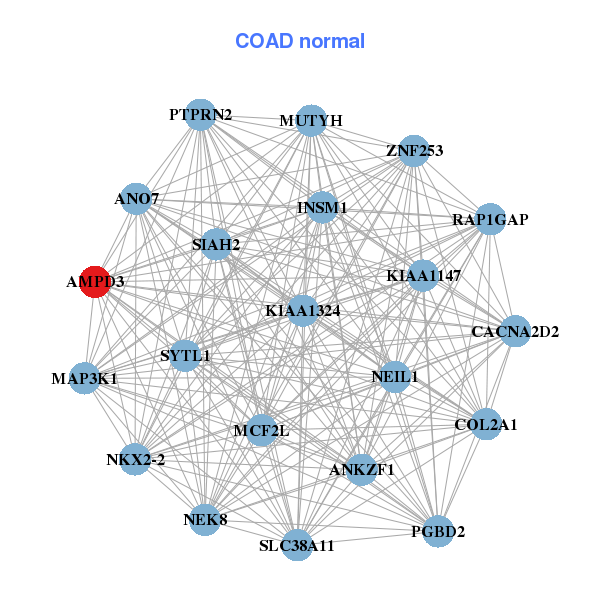
| * Co-Expression network figures were drawn using R package igraph. Only the top 20 genes with the highest correlations were shown. Red circle: input gene, orange circle: cell metabolism gene, sky circle: other gene |
: Open all plots for all cancer types
| Top |
: Open all interacting genes' information including KEGG pathway for all interacting genes from DAVID
| Top |
| Pharmacological Information for AMPD3 |
| DB Category | DB Name | DB's ID and Url link |
| * Gene Centered Interaction Network. |
 |
| * Drug Centered Interaction Network. |
| DrugBank ID | Target Name | Drug Groups | Generic Name | Drug Centered Network | Drug Structure |
| DB00173 | adenosine monophosphate deaminase 3 | approved; nutraceutical | Adenine | 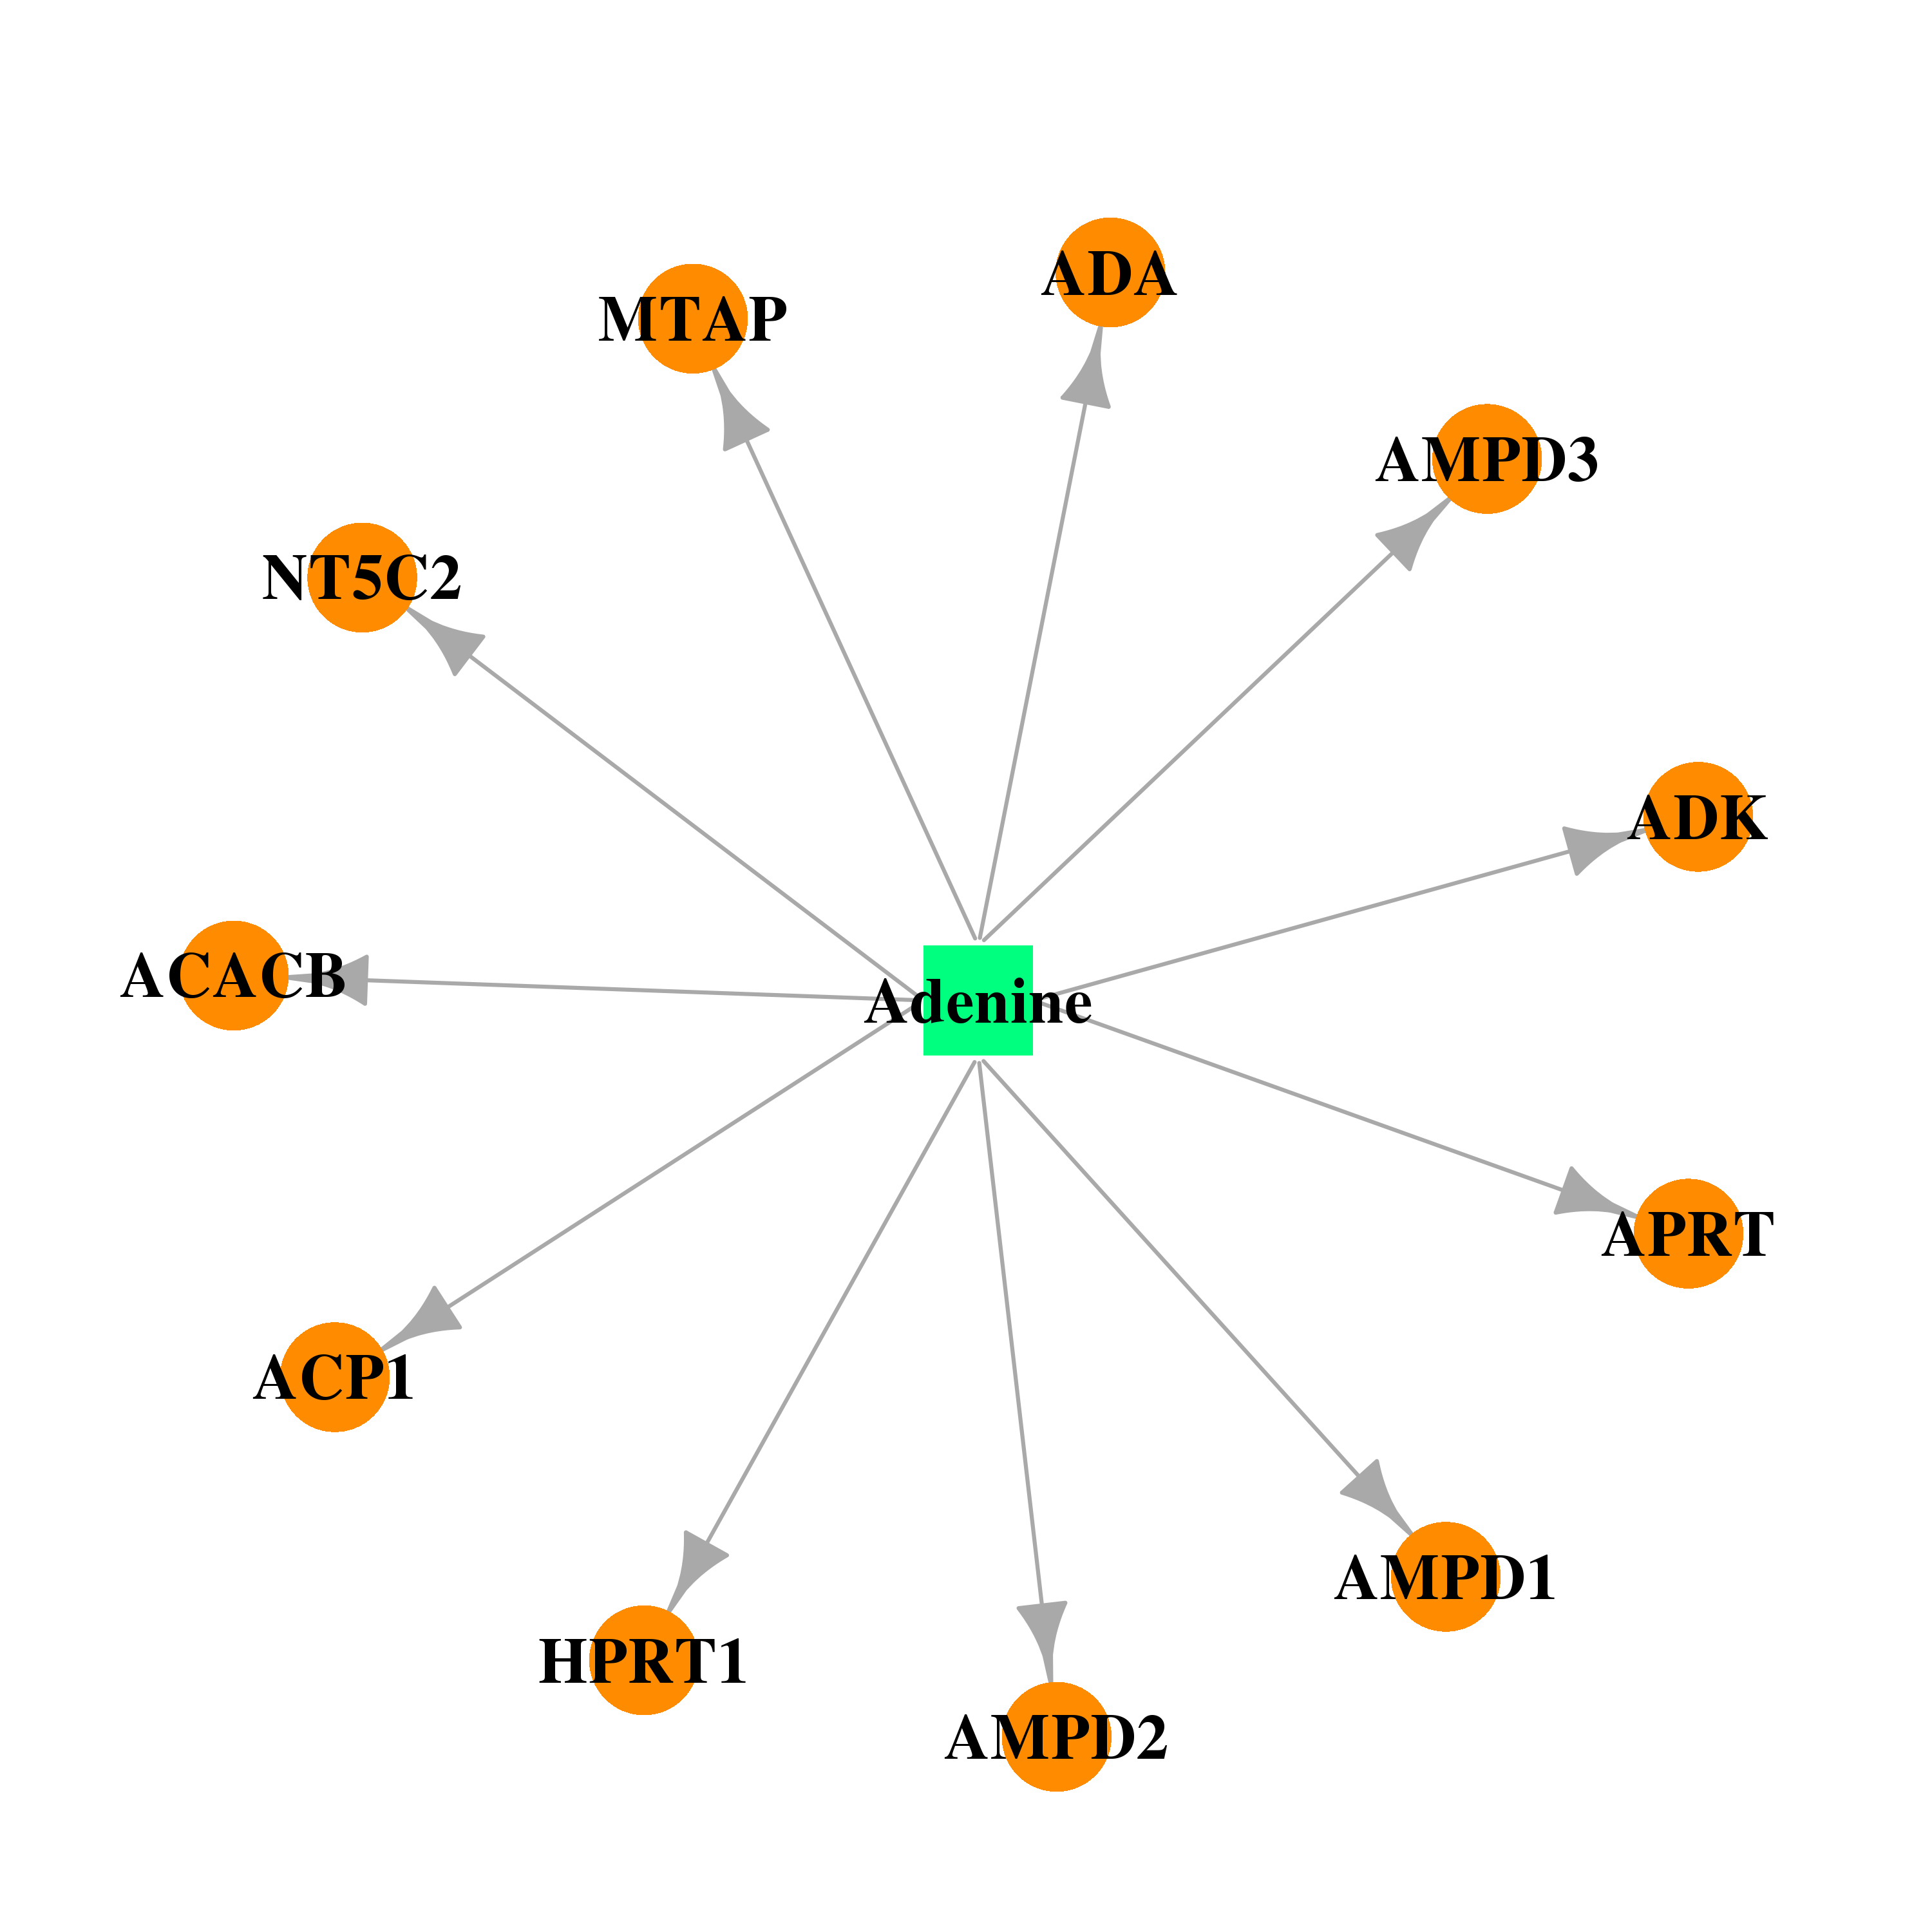 |  |
| DB00640 | adenosine monophosphate deaminase 3 | approved; investigational | Adenosine | 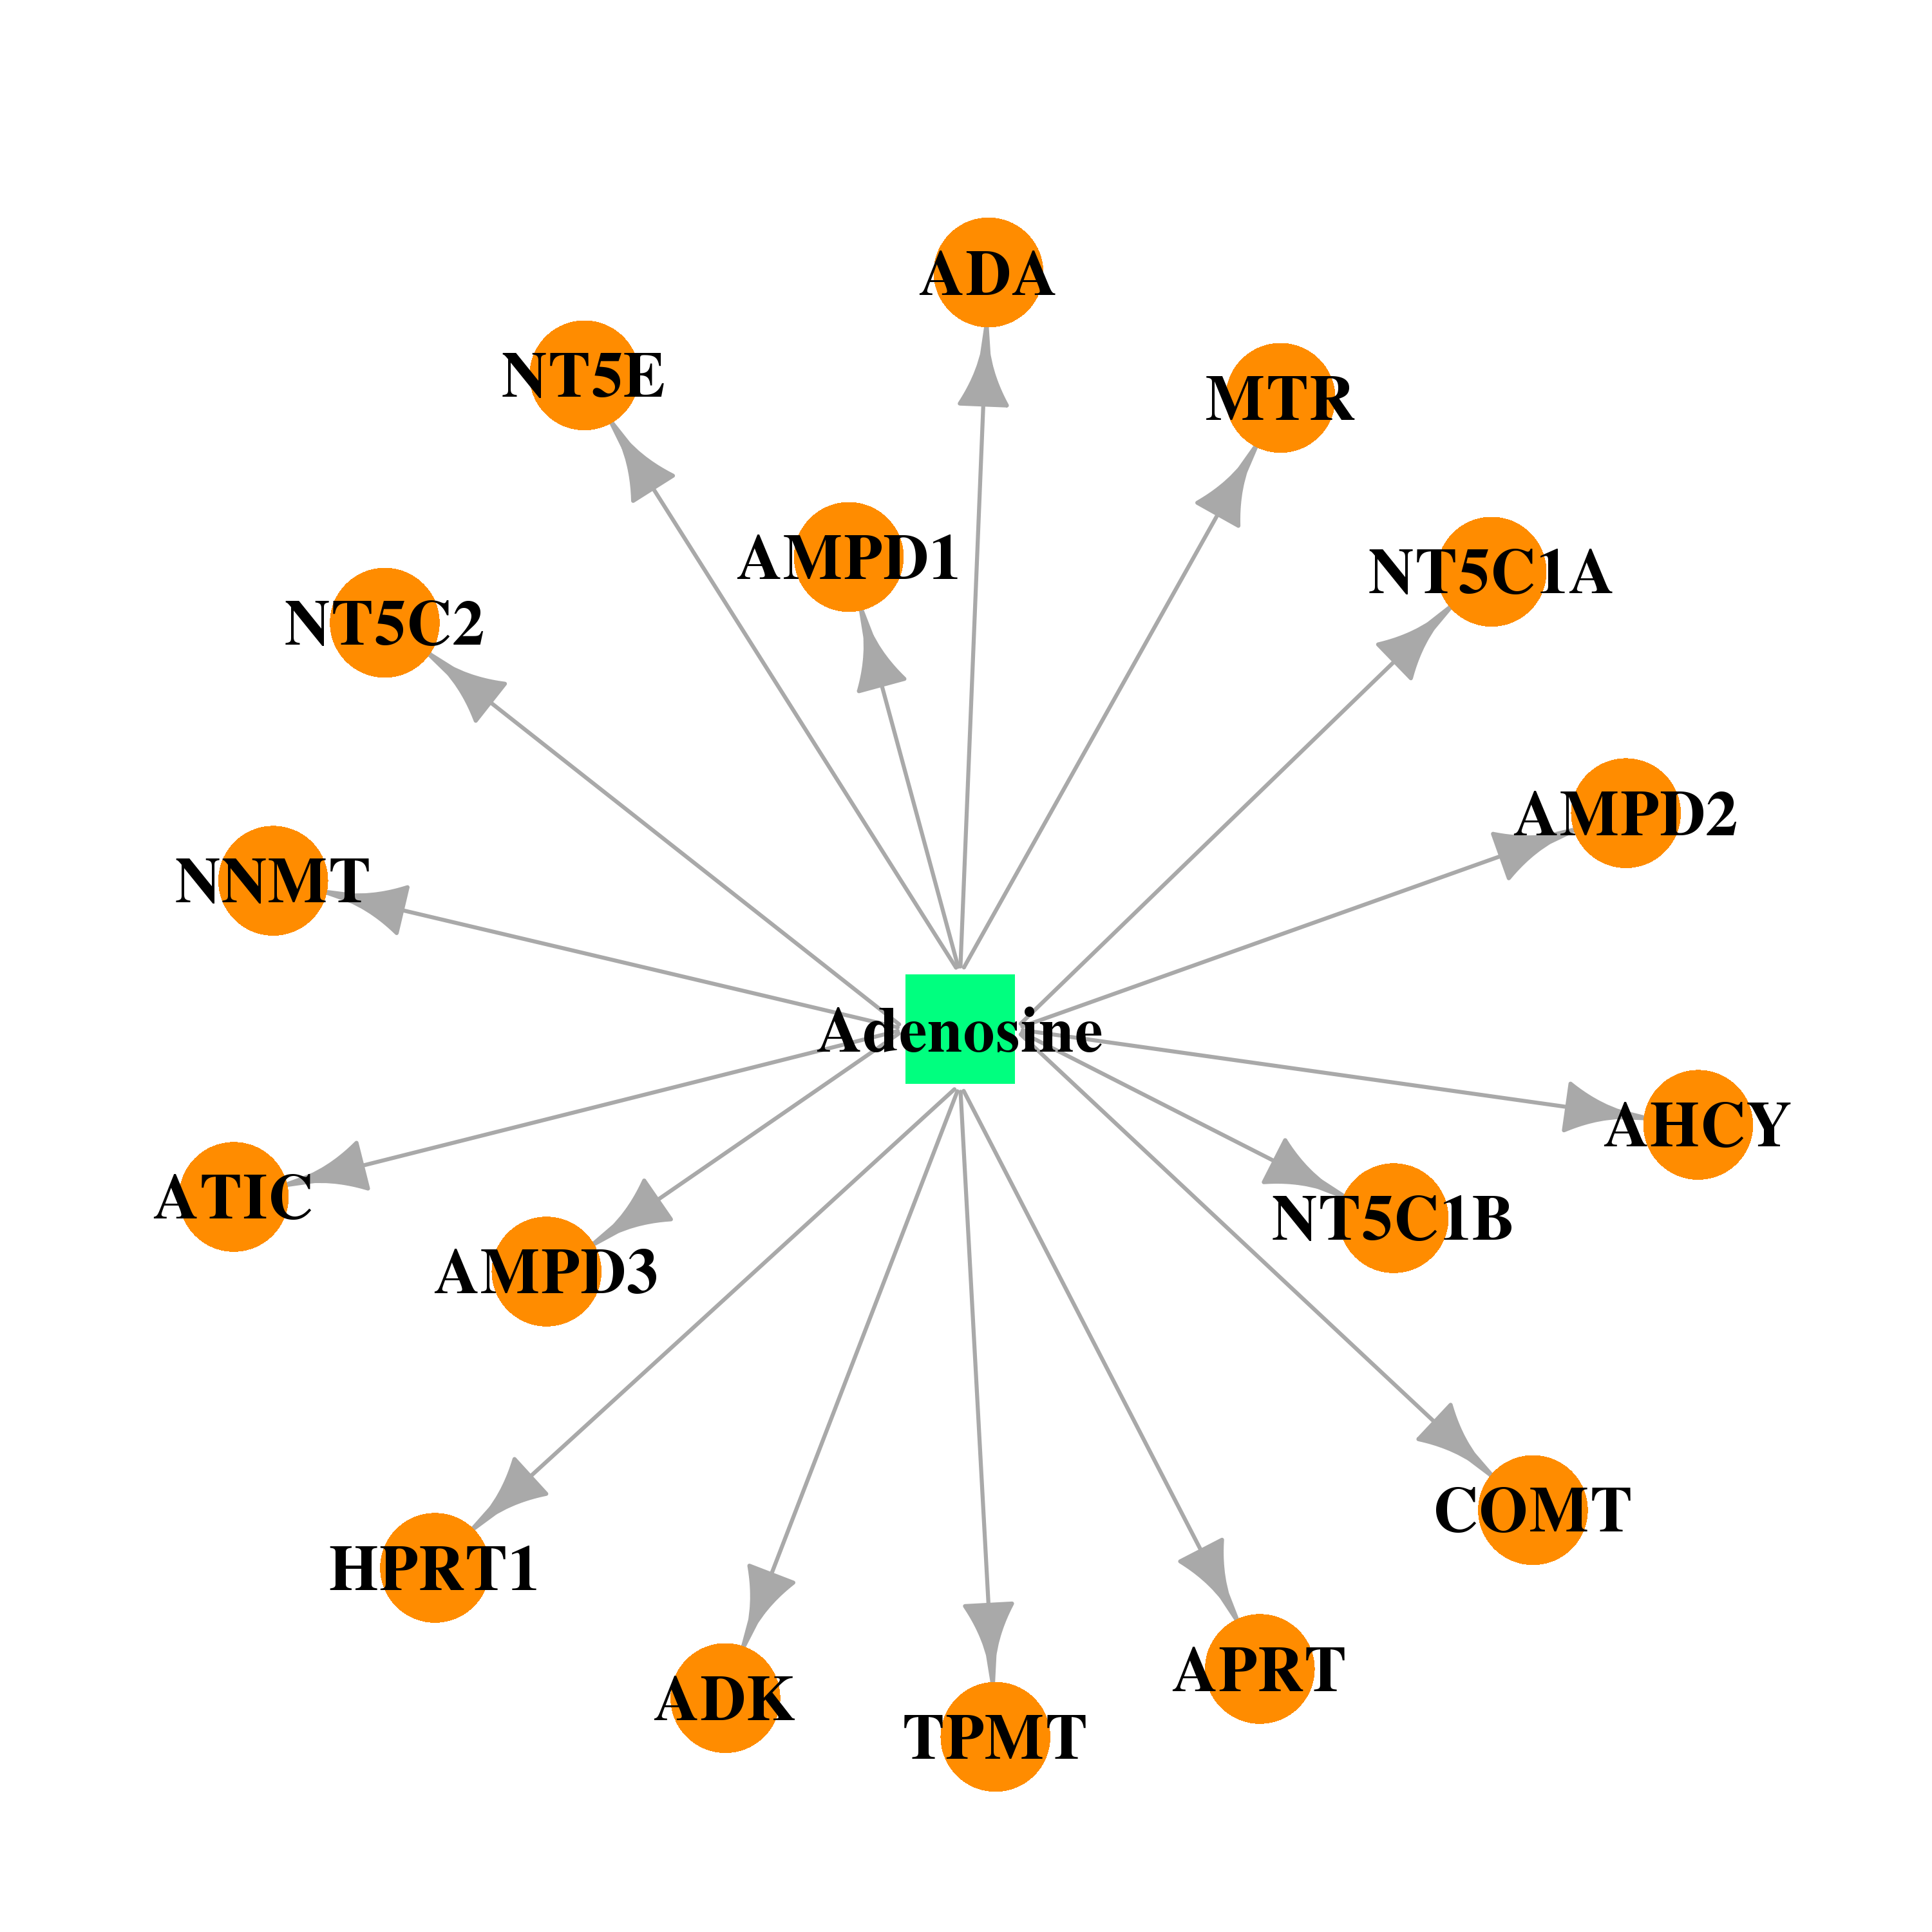 |  |
| Top |
| Cross referenced IDs for AMPD3 |
| * We obtained these cross-references from Uniprot database. It covers 150 different DBs, 18 categories. http://www.uniprot.org/help/cross_references_section |
: Open all cross reference information
|
Copyright © 2016-Present - The Univsersity of Texas Health Science Center at Houston @ |