|
||||||||||||||||||||
| |
| Phenotypic Information (metabolism pathway, cancer, disease, phenome) |
| |
| |
| Gene-Gene Network Information: Co-Expression Network, Interacting Genes & KEGG |
| |
|


| Gene Summary for COQ2 |
| Basic gene info. | Gene symbol | COQ2 |
| Gene name | coenzyme Q2 4-hydroxybenzoate polyprenyltransferase | |
| Synonyms | CL640|COQ10D1|MSA1 | |
| Cytomap | UCSC genome browser: 4q21.23 | |
| Genomic location | chr4 :84184976-84206067 | |
| Type of gene | protein-coding | |
| RefGenes | NM_015697.7, | |
| Ensembl id | ENSG00000173085 | |
| Description | 4-hydroxybenzoate polyprenyltransferase, mitochondrialPHB:polyprenyltransferasecoenzyme Q2 homolog, prenyltransferasepara-hydroxybenzoate-polyprenyltransferase, mitochondrial | |
| Modification date | 20141207 | |
| dbXrefs | MIM : 609825 | |
| HGNC : HGNC | ||
| Ensembl : ENSG00000173085 | ||
| HPRD : 13062 | ||
| Vega : OTTHUMG00000160940 | ||
| Protein | UniProt: go to UniProt's Cross Reference DB Table | |
| Expression | CleanEX: HS_COQ2 | |
| BioGPS: 27235 | ||
| Gene Expression Atlas: ENSG00000173085 | ||
| The Human Protein Atlas: ENSG00000173085 | ||
| Pathway | NCI Pathway Interaction Database: COQ2 | |
| KEGG: COQ2 | ||
| REACTOME: COQ2 | ||
| ConsensusPathDB | ||
| Pathway Commons: COQ2 | ||
| Metabolism | MetaCyc: COQ2 | |
| HUMANCyc: COQ2 | ||
| Regulation | Ensembl's Regulation: ENSG00000173085 | |
| miRBase: chr4 :84,184,976-84,206,067 | ||
| TargetScan: NM_015697 | ||
| cisRED: ENSG00000173085 | ||
| Context | iHOP: COQ2 | |
| cancer metabolism search in PubMed: COQ2 | ||
| UCL Cancer Institute: COQ2 | ||
| Assigned class in ccmGDB | C | |
| Top |
| Phenotypic Information for COQ2(metabolism pathway, cancer, disease, phenome) |
| Cancer | CGAP: COQ2 |
| Familial Cancer Database: COQ2 | |
| * This gene is included in those cancer gene databases. |
|
|
|
|
|
| . | ||||||||||||||
Oncogene 1 | Significant driver gene in | |||||||||||||||||||
| cf) number; DB name 1 Oncogene; http://nar.oxfordjournals.org/content/35/suppl_1/D721.long, 2 Tumor Suppressor gene; https://bioinfo.uth.edu/TSGene/, 3 Cancer Gene Census; http://www.nature.com/nrc/journal/v4/n3/abs/nrc1299.html, 4 CancerGenes; http://nar.oxfordjournals.org/content/35/suppl_1/D721.long, 5 Network of Cancer Gene; http://ncg.kcl.ac.uk/index.php, 1Therapeutic Vulnerabilities in Cancer; http://cbio.mskcc.org/cancergenomics/statius/ |
| REACTOME_METABOLISM_OF_PROTEINS | |
| OMIM | |
| Orphanet | |
| Disease | KEGG Disease: COQ2 |
| MedGen: COQ2 (Human Medical Genetics with Condition) | |
| ClinVar: COQ2 | |
| Phenotype | MGI: COQ2 (International Mouse Phenotyping Consortium) |
| PhenomicDB: COQ2 | |
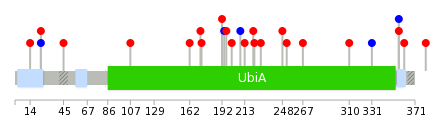
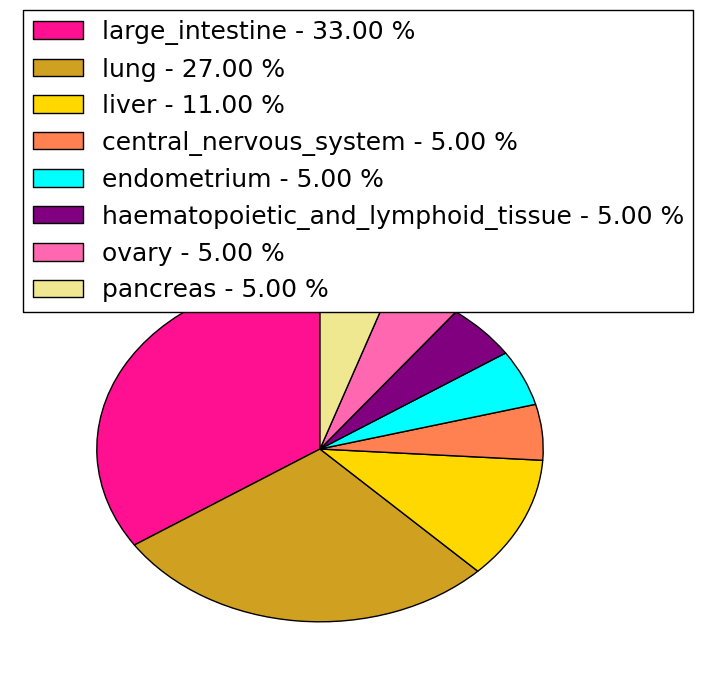
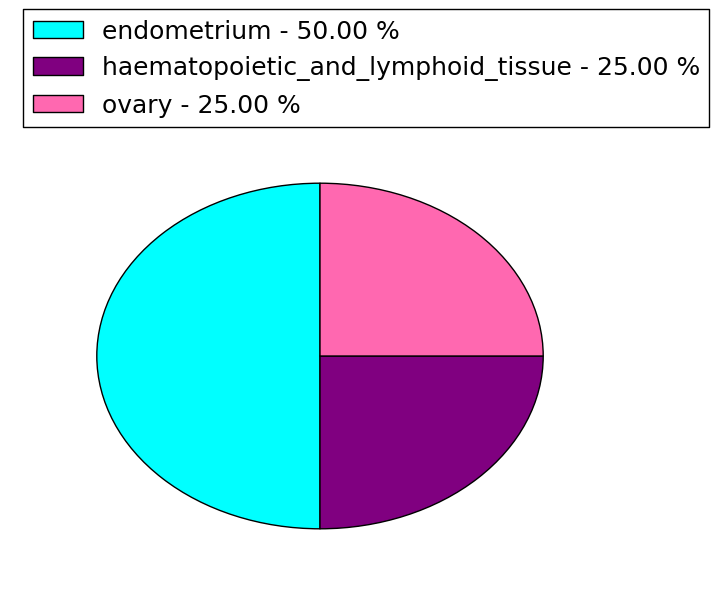
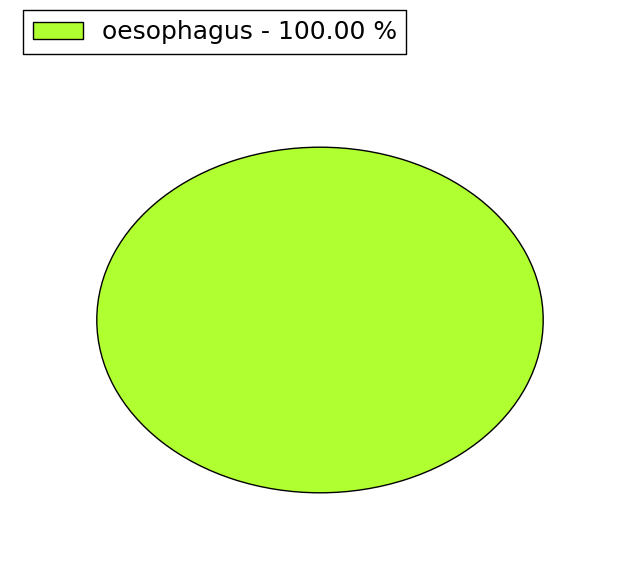
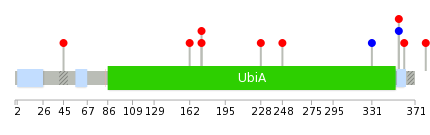
| Mutations for COQ2 |
| * Under tables are showing count per each tissue to give us broad intuition about tissue specific mutation patterns.You can go to the detailed page for each mutation database's web site. |
| There's no structural variation information in COSMIC data for this gene. |
| * From mRNA Sanger sequences, Chitars2.0 arranged chimeric transcripts. This table shows COQ2 related fusion information. |
| ID | Head Gene | Tail Gene | Accession | Gene_a | qStart_a | qEnd_a | Chromosome_a | tStart_a | tEnd_a | Gene_a | qStart_a | qEnd_a | Chromosome_a | tStart_a | tEnd_a |
| Top |
| There's no copy number variation information in COSMIC data for this gene. |
| Top |
|
 |
| Top |
| Stat. for Non-Synonymous SNVs (# total SNVs=18) | (# total SNVs=4) |
 |  |
(# total SNVs=1) | (# total SNVs=0) |
 |
| Top |
| * When you move the cursor on each content, you can see more deailed mutation information on the Tooltip. Those are primary_site,primary_histology,mutation(aa),pubmedID. |
| GRCh37 position | Mutation(aa) | Unique sampleID count |
| chr4:84188759-84188759 | p.G361R | 1 |
| chr4:84194680-84194680 | p.L221V | 1 |
| chr4:84205749-84205749 | p.S107C | 1 |
| chr4:84188772-84188772 | p.A356A | 1 |
| chr4:84194704-84194704 | p.L213F | 1 |
| chr4:84205934-84205934 | p.P45L | 1 |
| chr4:84188773-84188773 | p.A356V | 1 |
| chr4:84194714-84194714 | p.S209S | 1 |
| chr4:84205996-84205996 | p.G24G | 1 |
| chr4:84188847-84188847 | p.G331G | 1 |
| Top |
|
 |
| Point Mutation/ Tissue ID | 1 | 2 | 3 | 4 | 5 | 6 | 7 | 8 | 9 | 10 | 11 | 12 | 13 | 14 | 15 | 16 | 17 | 18 | 19 | 20 |
| # sample | 5 | 1 | 1 | 2 | 2 | 3 | ||||||||||||||
| # mutation | 5 | 1 | 1 | 2 | 2 | 3 | ||||||||||||||
| nonsynonymous SNV | 5 | 1 | 1 | 2 | 1 | |||||||||||||||
| synonymous SNV | 1 | 1 | 2 |
| cf) Tissue ID; Tissue type (1; BLCA[Bladder Urothelial Carcinoma], 2; BRCA[Breast invasive carcinoma], 3; CESC[Cervical squamous cell carcinoma and endocervical adenocarcinoma], 4; COAD[Colon adenocarcinoma], 5; GBM[Glioblastoma multiforme], 6; Glioma Low Grade, 7; HNSC[Head and Neck squamous cell carcinoma], 8; KICH[Kidney Chromophobe], 9; KIRC[Kidney renal clear cell carcinoma], 10; KIRP[Kidney renal papillary cell carcinoma], 11; LAML[Acute Myeloid Leukemia], 12; LUAD[Lung adenocarcinoma], 13; LUSC[Lung squamous cell carcinoma], 14; OV[Ovarian serous cystadenocarcinoma ], 15; PAAD[Pancreatic adenocarcinoma], 16; PRAD[Prostate adenocarcinoma], 17; SKCM[Skin Cutaneous Melanoma], 18:STAD[Stomach adenocarcinoma], 19:THCA[Thyroid carcinoma], 20:UCEC[Uterine Corpus Endometrial Carcinoma]) |
| Top |
| * We represented just top 10 SNVs. When you move the cursor on each content, you can see more deailed mutation information on the Tooltip. Those are primary_site, primary_histology, mutation(aa), pubmedID. |
| Genomic Position | Mutation(aa) | Unique sampleID count |
| chr4:84188759 | p.G361R | 1 |
| chr4:84188772 | p.A356A | 1 |
| chr4:84188773 | p.A356V | 1 |
| chr4:84188847 | p.G331G | 1 |
| chr4:84193274 | p.M248I | 1 |
| chr4:84194659 | p.N228H | 1 |
| chr4:84200153 | p.R173H | 1 |
| chr4:84185391 | p.R173S | 1 |
| chr4:84200154 | p.L162F | 1 |
| chr4:84185424 | p.P45L | 1 |
| * Copy number data were extracted from TCGA using R package TCGA-Assembler. The URLs of all public data files on TCGA DCC data server were gathered on Jan-05-2015. Function ProcessCNAData in TCGA-Assembler package was used to obtain gene-level copy number value which is calculated as the average copy number of the genomic region of a gene. |
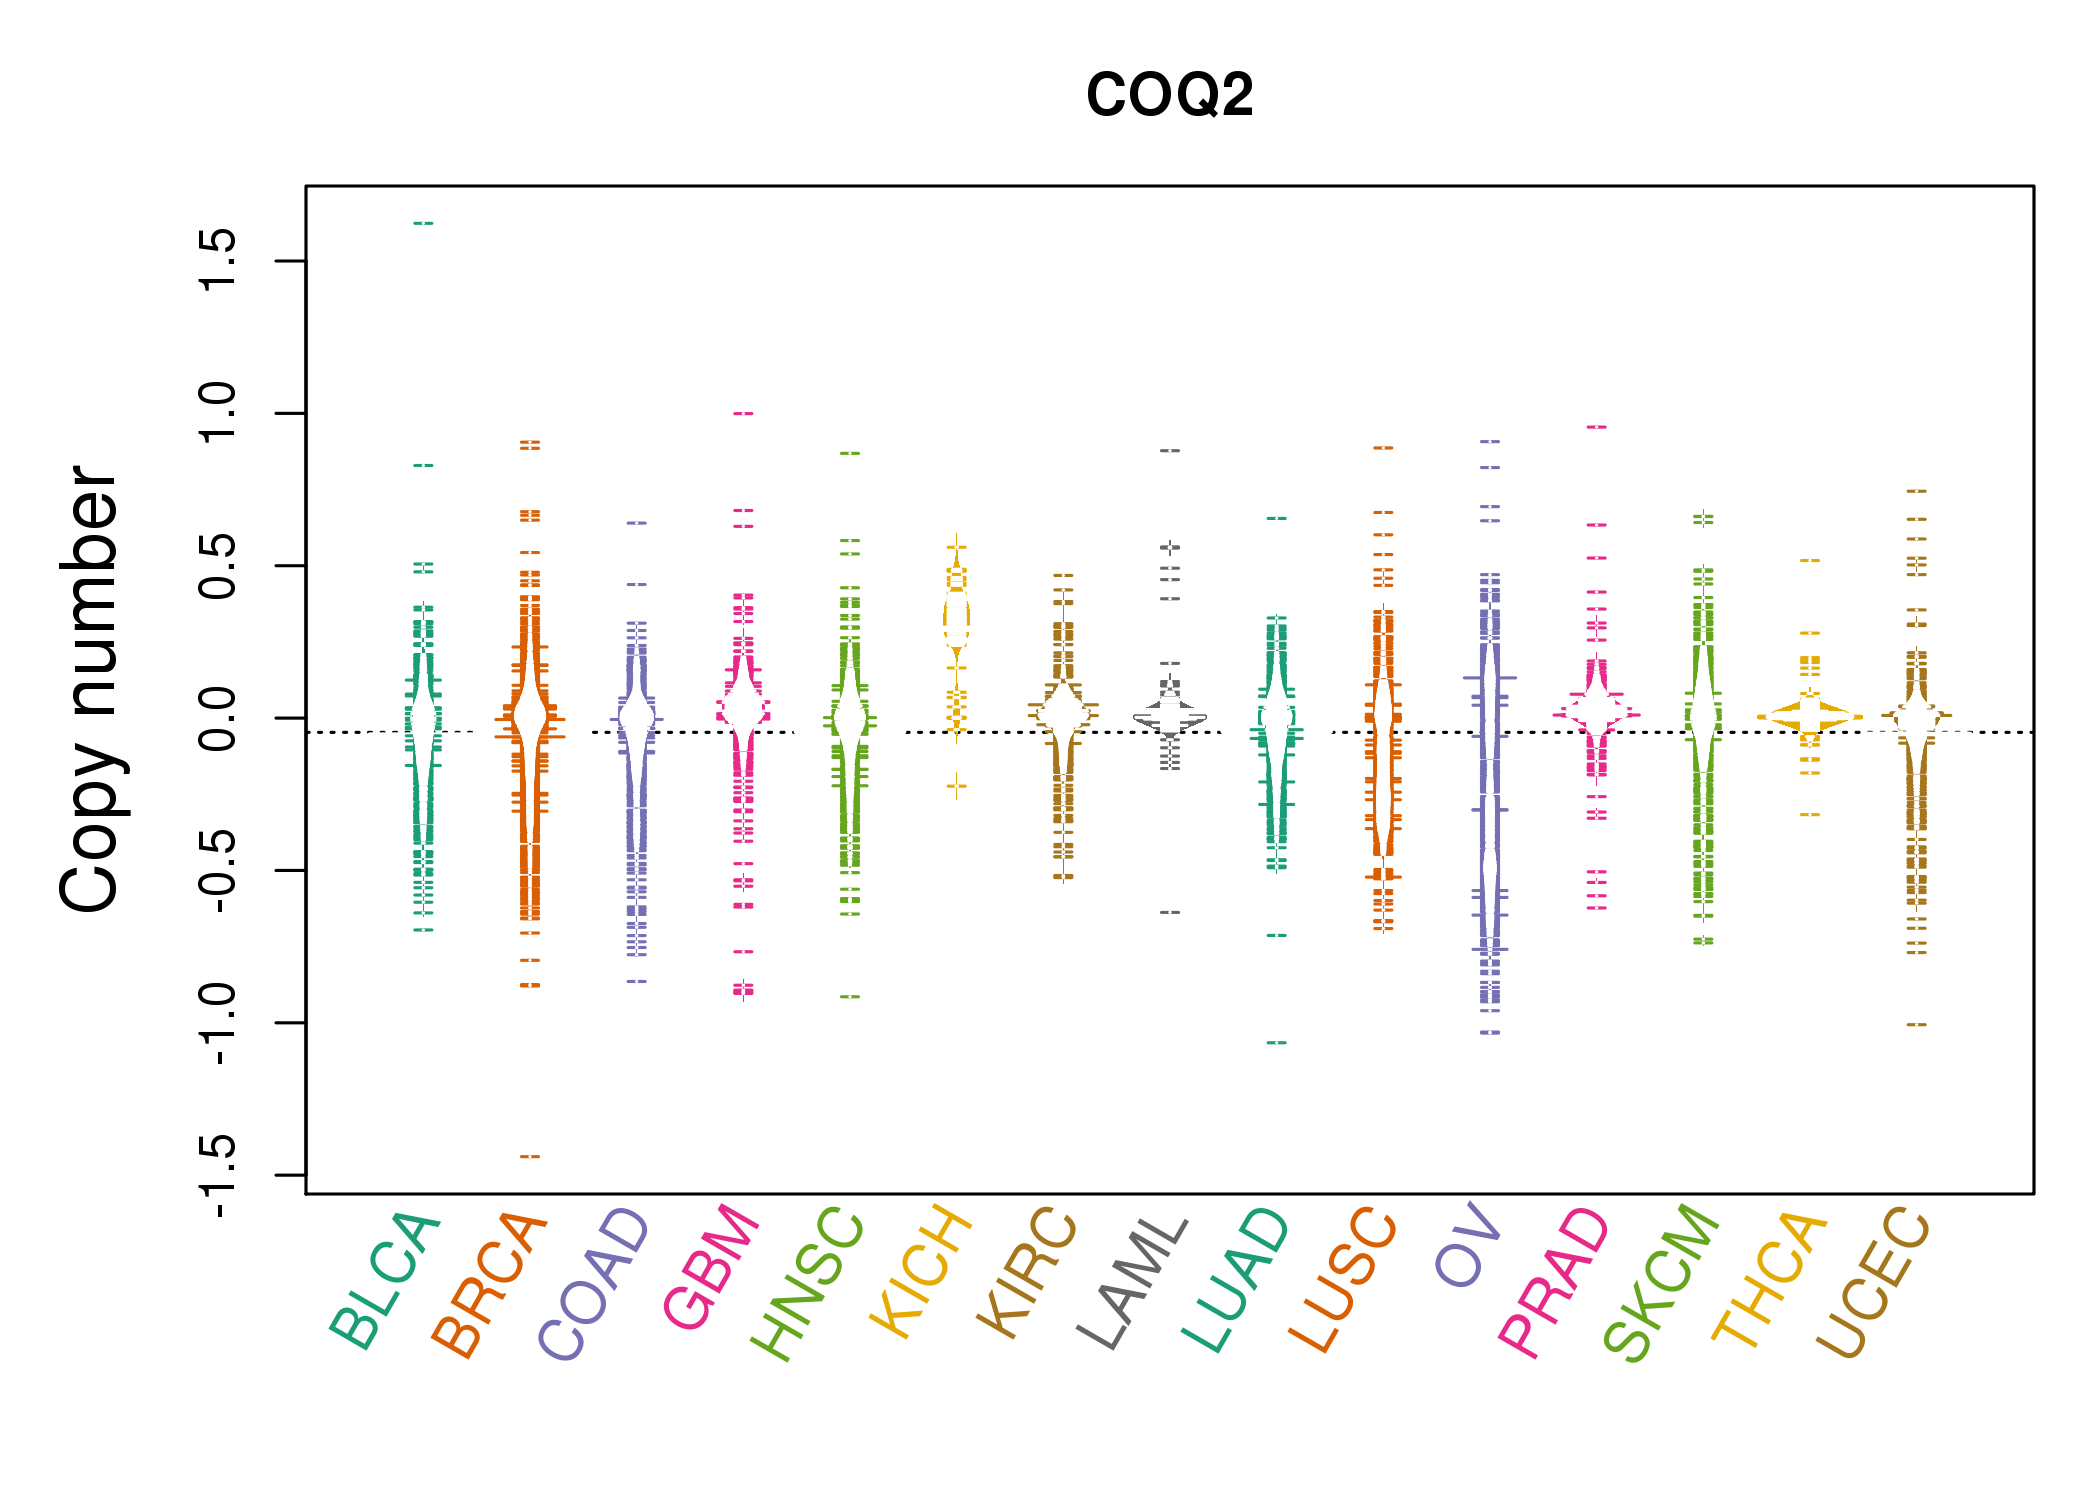 |
| cf) Tissue ID[Tissue type]: BLCA[Bladder Urothelial Carcinoma], BRCA[Breast invasive carcinoma], CESC[Cervical squamous cell carcinoma and endocervical adenocarcinoma], COAD[Colon adenocarcinoma], GBM[Glioblastoma multiforme], Glioma Low Grade, HNSC[Head and Neck squamous cell carcinoma], KICH[Kidney Chromophobe], KIRC[Kidney renal clear cell carcinoma], KIRP[Kidney renal papillary cell carcinoma], LAML[Acute Myeloid Leukemia], LUAD[Lung adenocarcinoma], LUSC[Lung squamous cell carcinoma], OV[Ovarian serous cystadenocarcinoma ], PAAD[Pancreatic adenocarcinoma], PRAD[Prostate adenocarcinoma], SKCM[Skin Cutaneous Melanoma], STAD[Stomach adenocarcinoma], THCA[Thyroid carcinoma], UCEC[Uterine Corpus Endometrial Carcinoma] |
| Top |
| Gene Expression for COQ2 |
| * CCLE gene expression data were extracted from CCLE_Expression_Entrez_2012-10-18.res: Gene-centric RMA-normalized mRNA expression data. |
 |
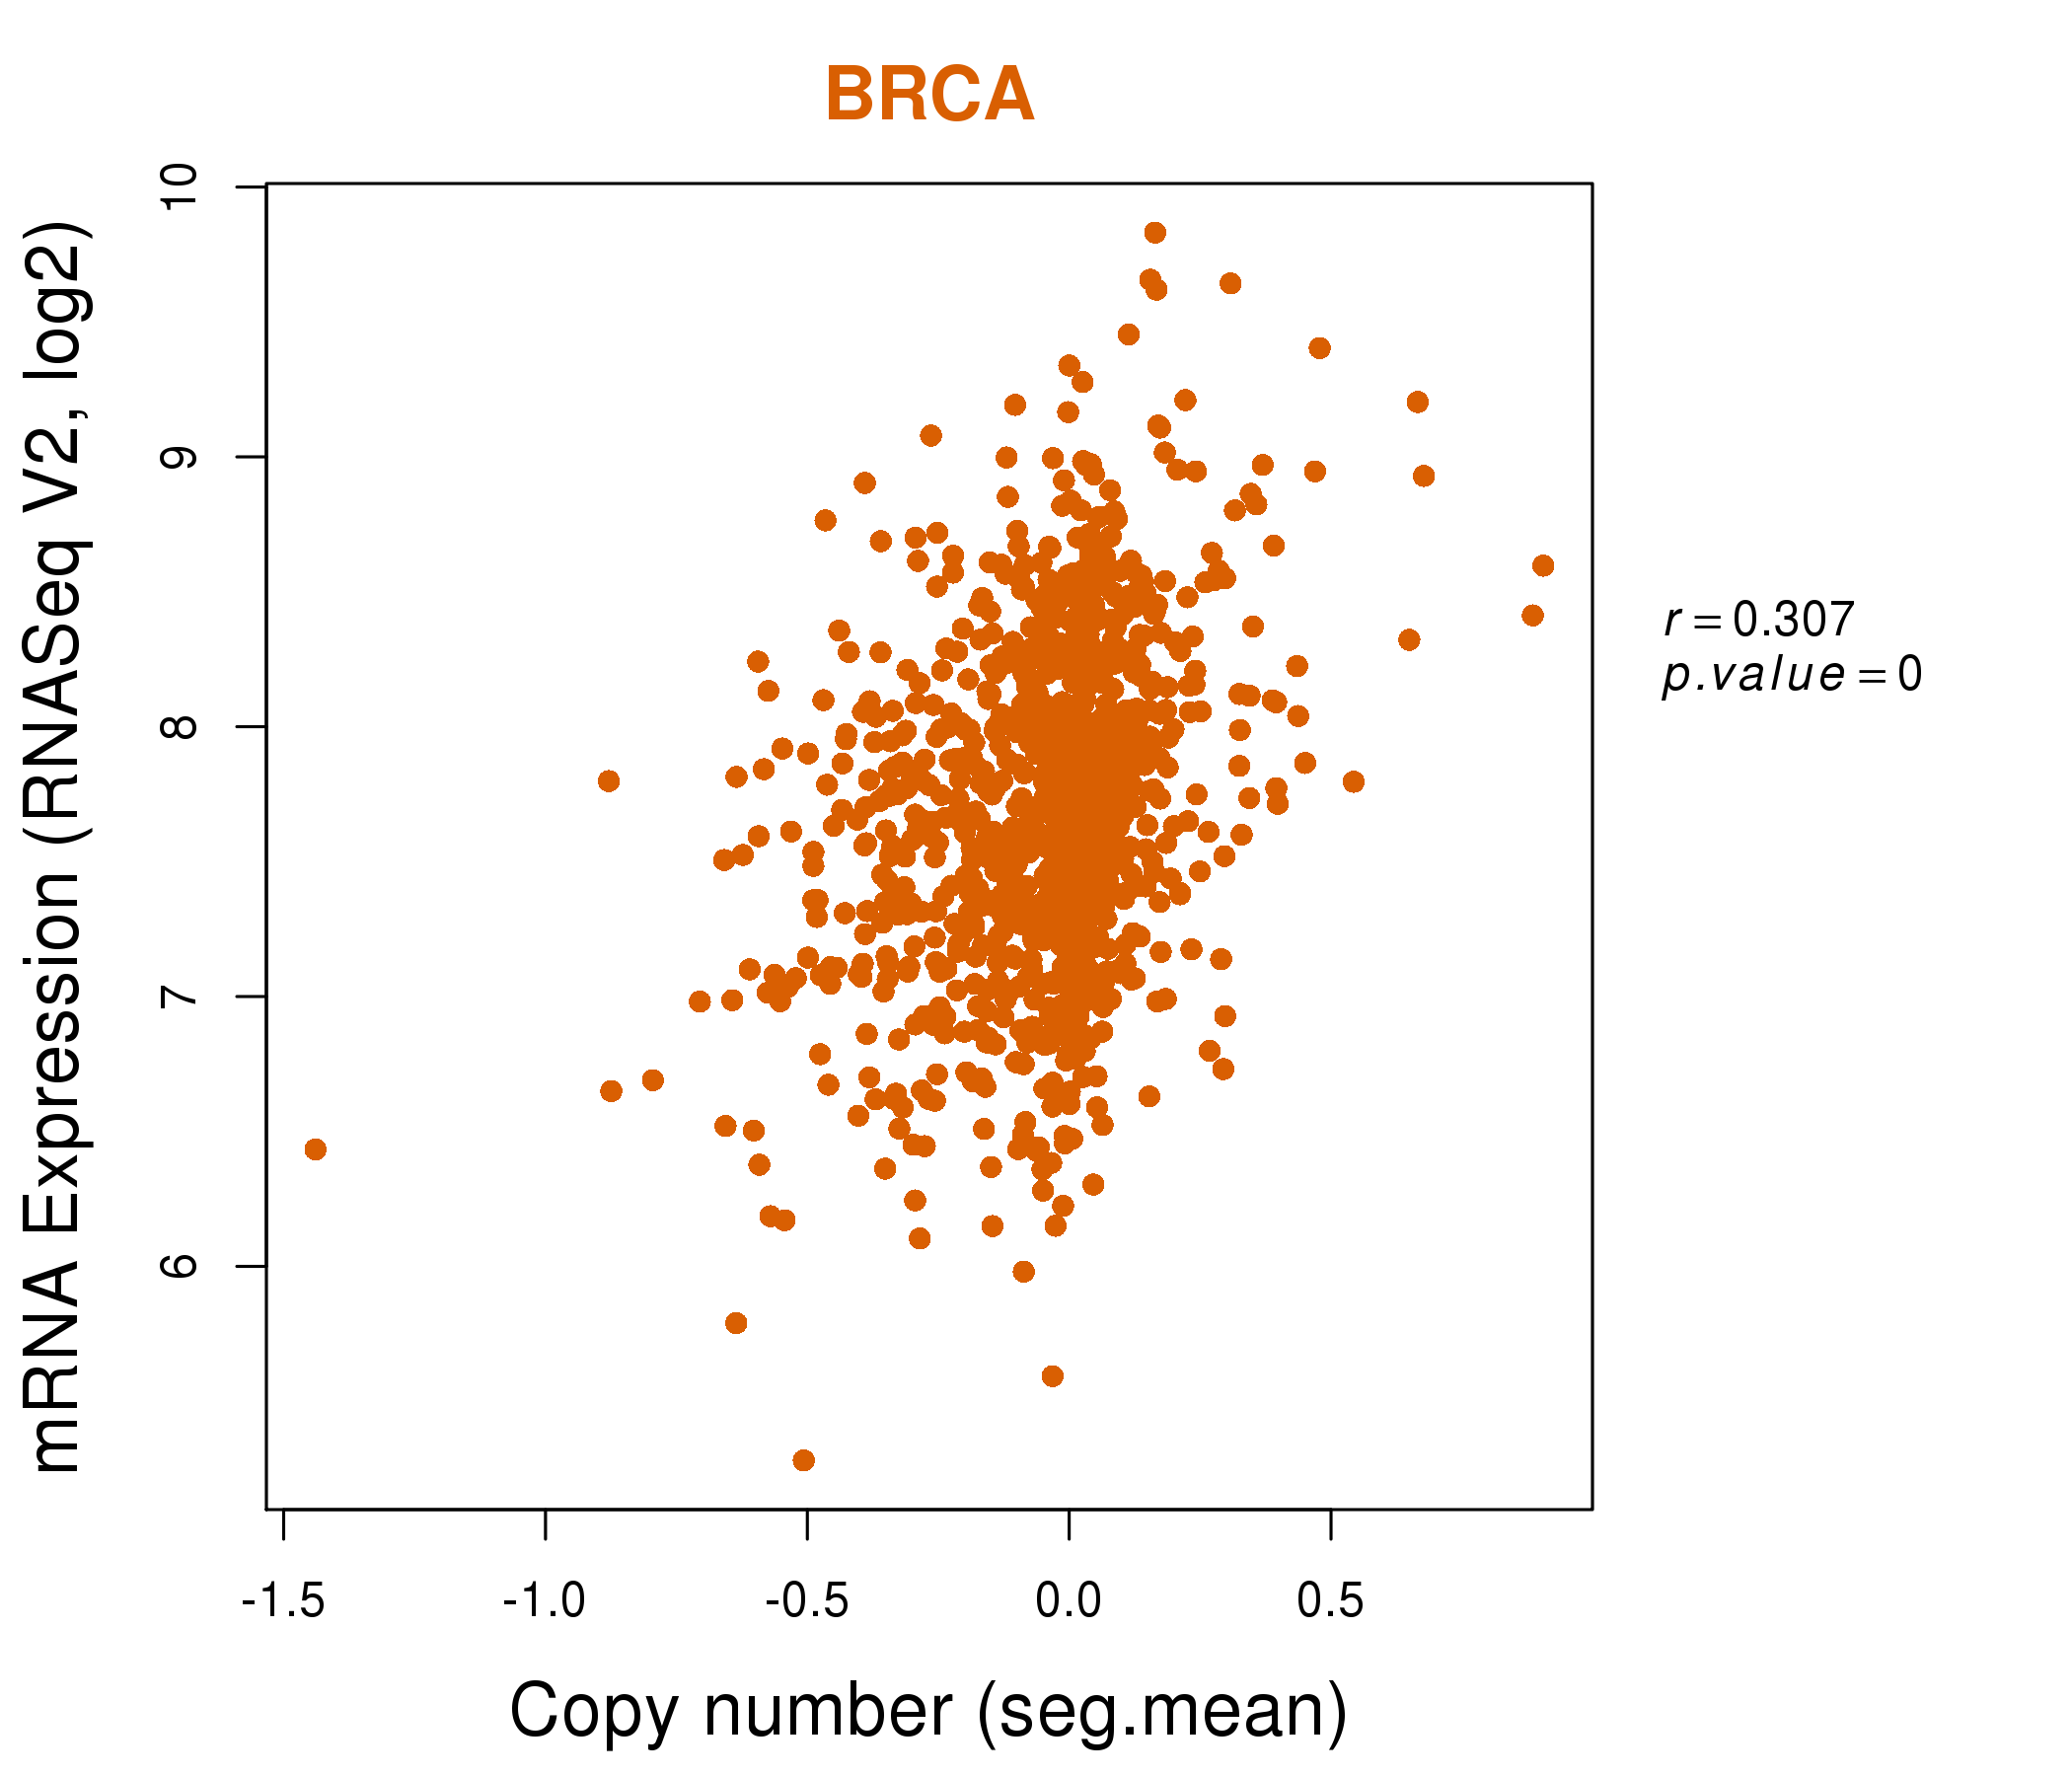
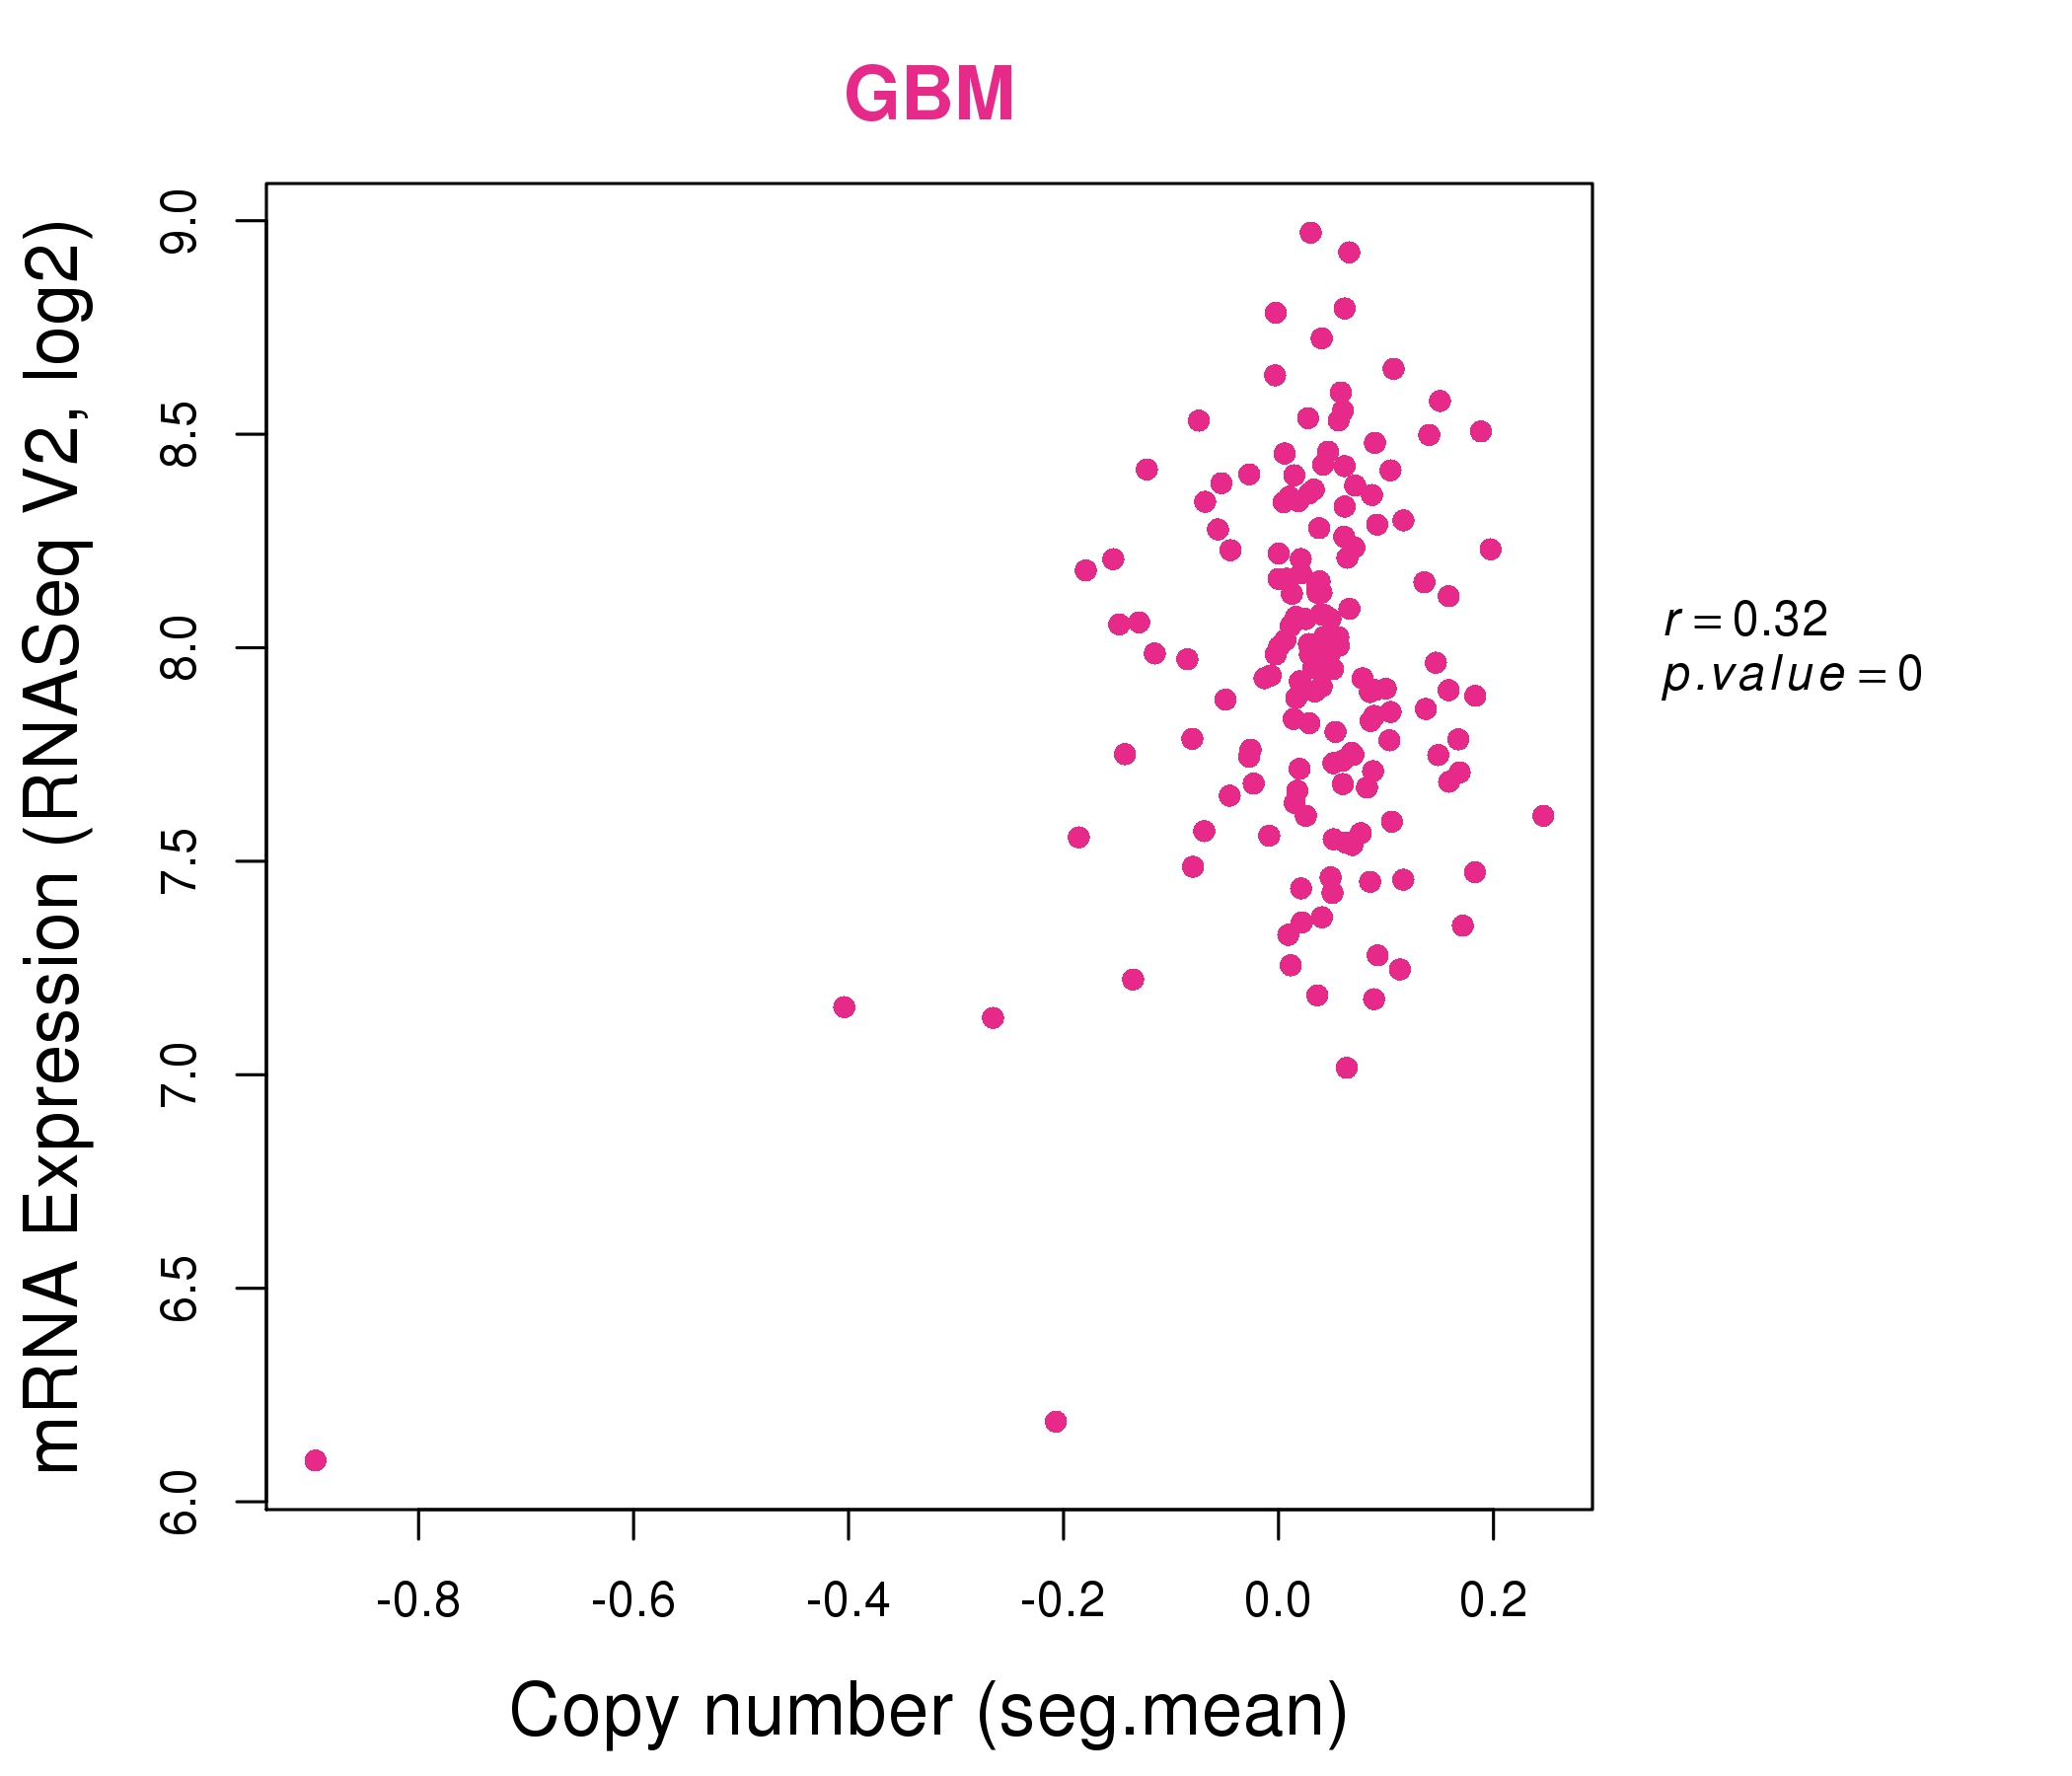
| * Normalized gene expression data of RNASeqV2 was extracted from TCGA using R package TCGA-Assembler. The URLs of all public data files on TCGA DCC data server were gathered at Jan-05-2015. Only eight cancer types have enough normal control samples for differential expression analysis. (t test, adjusted p<0.05 (using Benjamini-Hochberg FDR)) |
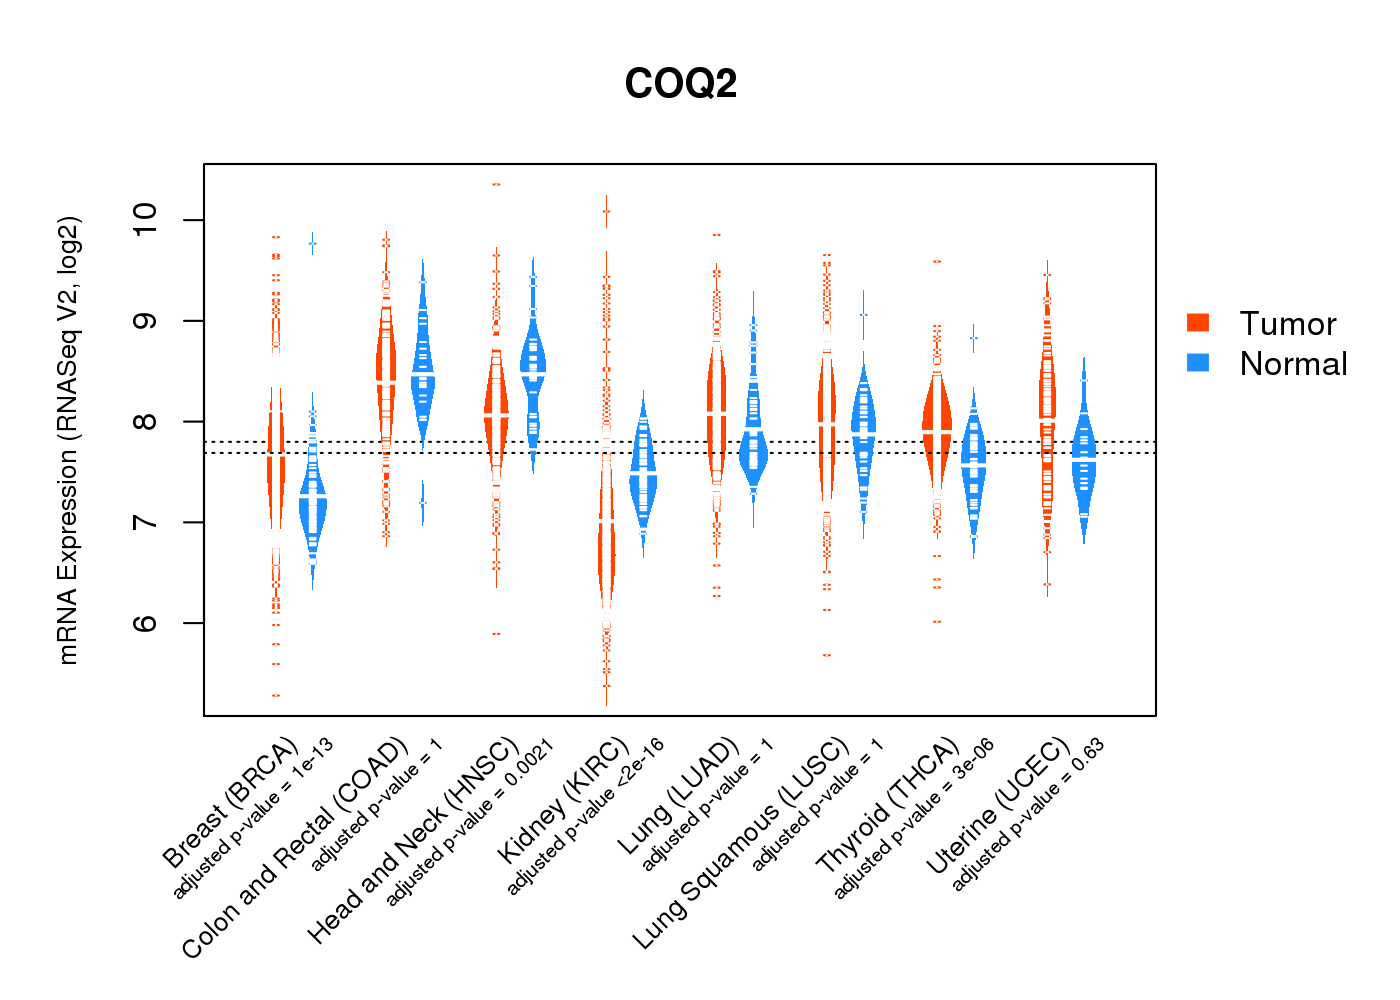 |
| Top |
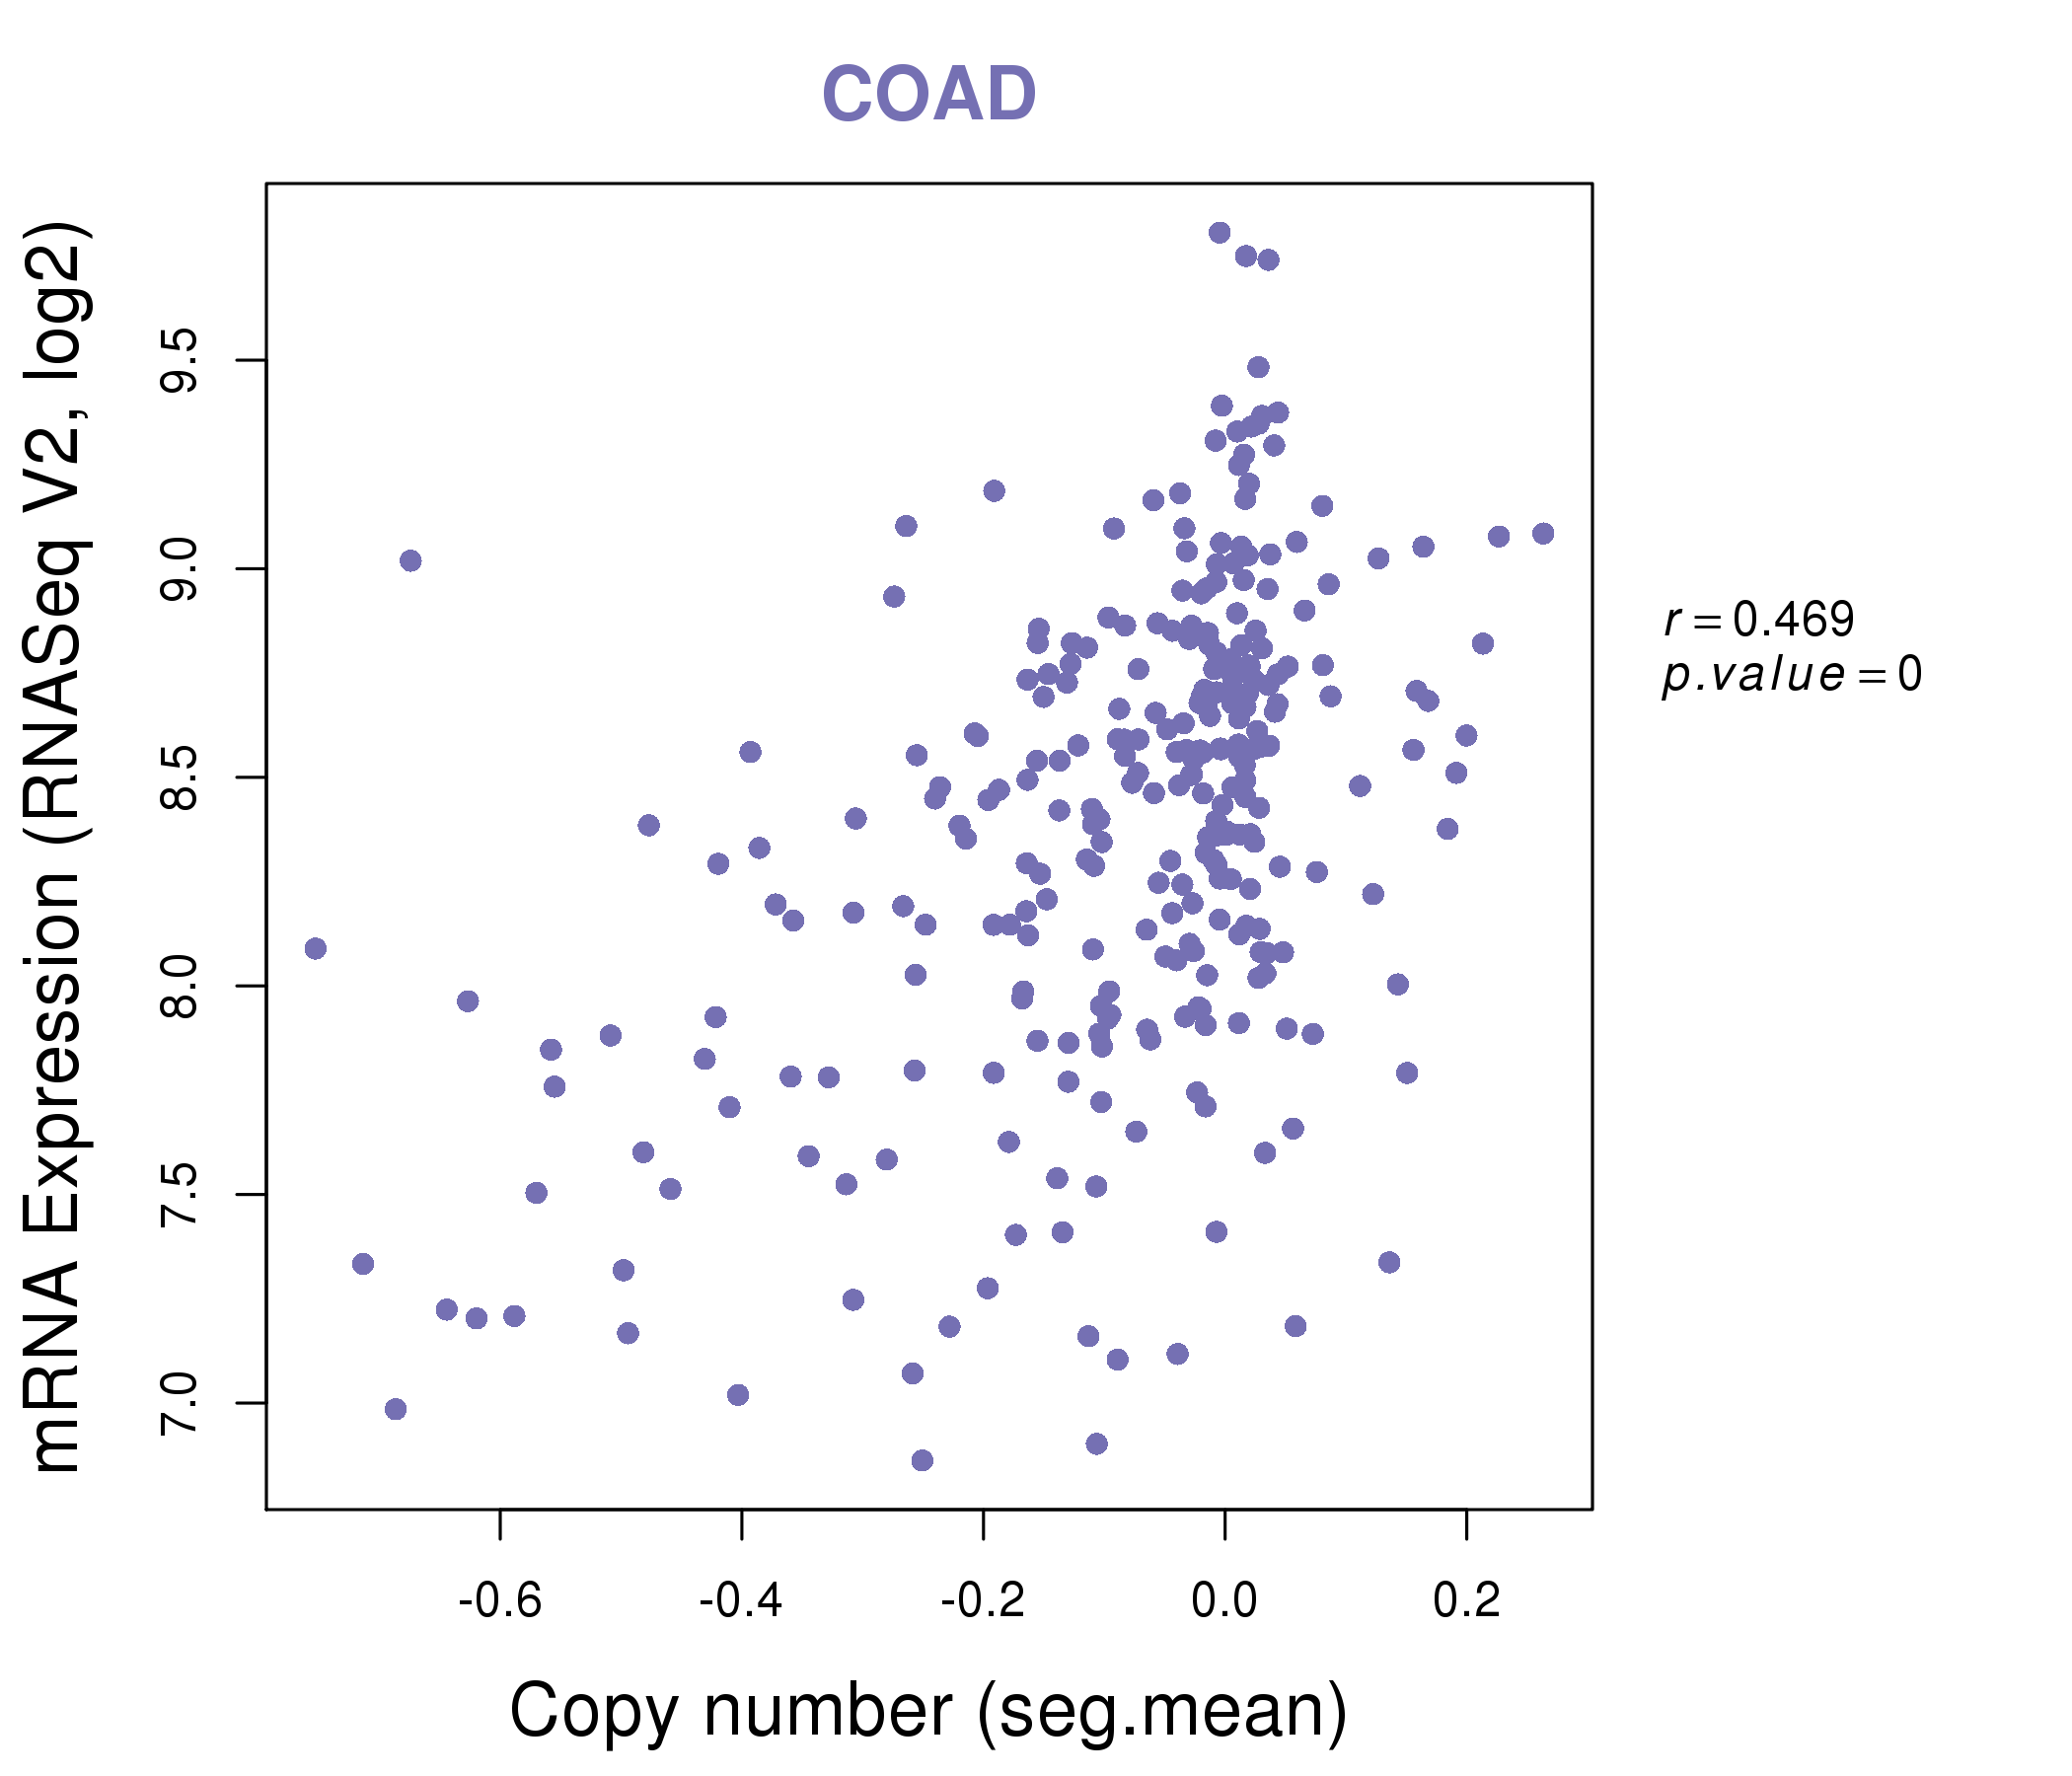
| * This plots show the correlation between CNV and gene expression. |
: Open all plots for all cancer types
 |
|
 |
|
| Top |
| Gene-Gene Network Information |
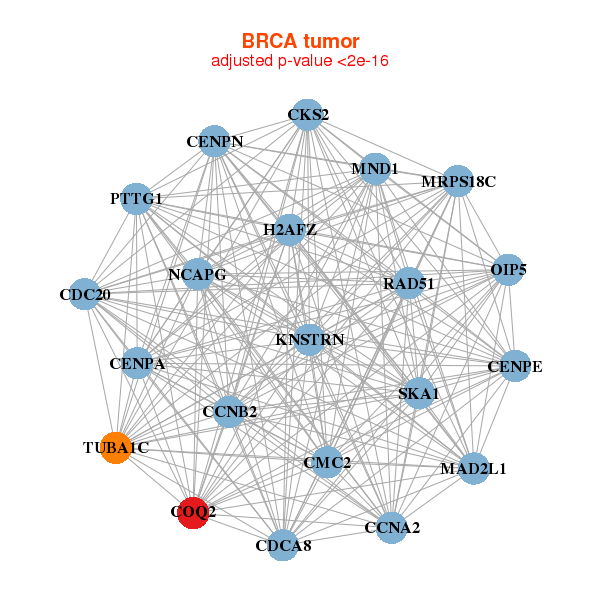
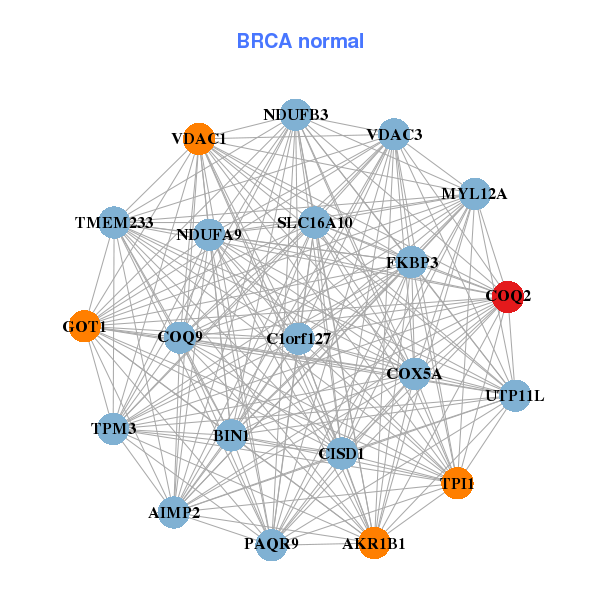
| * Co-Expression network figures were drawn using R package igraph. Only the top 20 genes with the highest correlations were shown. Red circle: input gene, orange circle: cell metabolism gene, sky circle: other gene |
: Open all plots for all cancer types
 |
|
| KNSTRN,CMC2,CCNA2,CCNB2,CDC20,CDCA8,CENPA, CENPE,CENPN,CKS2,COQ2,H2AFZ,MAD2L1,MND1, MRPS18C,NCAPG,OIP5,PTTG1,RAD51,SKA1,TUBA1C | AIMP2,AKR1B1,BIN1,C1orf127,CISD1,COQ2,COQ9, COX5A,FKBP3,GOT1,MYL12A,NDUFA9,NDUFB3,PAQR9, SLC16A10,TMEM233,TPI1,TPM3,UTP11L,VDAC1,VDAC3 |
 |
|
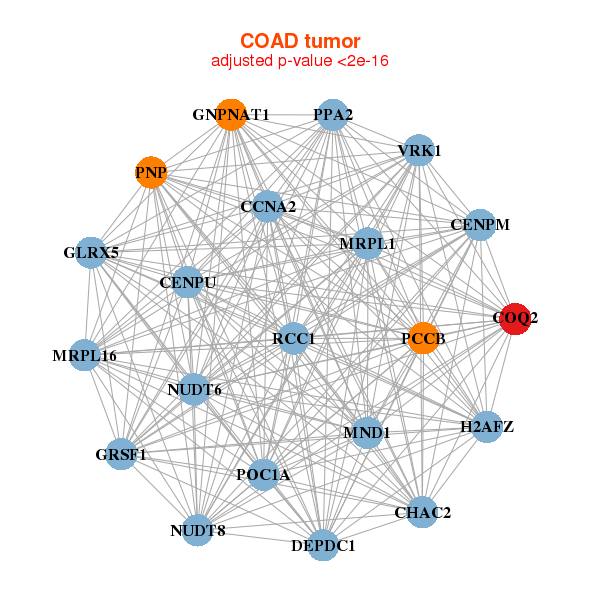
| CCNA2,CENPM,CHAC2,COQ2,DEPDC1,GLRX5,GNPNAT1, GRSF1,H2AFZ,CENPU,MND1,MRPL1,MRPL16,NUDT6, NUDT8,PCCB,PNP,POC1A,PPA2,RCC1,VRK1 | PARPBP,CCT5,CENPN,CHEK2,COQ2,DBF4,GGCT, GINS1,GINS2,HNRNPF,HPRT1,KIAA0101,MIPEP,NDUFA9, PLEK2,POC1A,POLE2,RPN1,RTN4IP1,ALYREF,VRK1 |

| * Co-Expression network figures were drawn using R package igraph. Only the top 20 genes with the highest correlations were shown. Red circle: input gene, orange circle: cell metabolism gene, sky circle: other gene |
: Open all plots for all cancer types
| Top |
: Open all interacting genes' information including KEGG pathway for all interacting genes from DAVID
| Top |
| Pharmacological Information for COQ2 |
| There's no related Drug. |
| Top |
| Cross referenced IDs for COQ2 |
| * We obtained these cross-references from Uniprot database. It covers 150 different DBs, 18 categories. http://www.uniprot.org/help/cross_references_section |
: Open all cross reference information
|
Copyright © 2016-Present - The Univsersity of Texas Health Science Center at Houston @ |