|
||||||||||||||||||||
| |
| Phenotypic Information (metabolism pathway, cancer, disease, phenome) |
| |
| |
| Gene-Gene Network Information: Co-Expression Network, Interacting Genes & KEGG |
| |
|


| Gene Summary for LSM3 |
| Basic gene info. | Gene symbol | LSM3 |
| Gene name | LSM3 homolog, U6 small nuclear RNA associated (S. cerevisiae) | |
| Synonyms | SMX4|USS2|YLR438C | |
| Cytomap | UCSC genome browser: 3p25.1 | |
| Genomic location | chr3 :14220227-14239869 | |
| Type of gene | protein-coding | |
| RefGenes | NM_014463.2, | |
| Ensembl id | ENSG00000170860 | |
| Description | U6 snRNA-associated Sm-like protein LSm3 | |
| Modification date | 20141207 | |
| dbXrefs | MIM : 607283 | |
| HGNC : HGNC | ||
| HPRD : 06283 | ||
| Protein | UniProt: go to UniProt's Cross Reference DB Table | |
| Expression | CleanEX: HS_LSM3 | |
| BioGPS: 27258 | ||
| Gene Expression Atlas: ENSG00000170860 | ||
| The Human Protein Atlas: ENSG00000170860 | ||
| Pathway | NCI Pathway Interaction Database: LSM3 | |
| KEGG: LSM3 | ||
| REACTOME: LSM3 | ||
| ConsensusPathDB | ||
| Pathway Commons: LSM3 | ||
| Metabolism | MetaCyc: LSM3 | |
| HUMANCyc: LSM3 | ||
| Regulation | Ensembl's Regulation: ENSG00000170860 | |
| miRBase: chr3 :14,220,227-14,239,869 | ||
| TargetScan: NM_014463 | ||
| cisRED: ENSG00000170860 | ||
| Context | iHOP: LSM3 | |
| cancer metabolism search in PubMed: LSM3 | ||
| UCL Cancer Institute: LSM3 | ||
| Assigned class in ccmGDB | C | |
| Top |
| Phenotypic Information for LSM3(metabolism pathway, cancer, disease, phenome) |
| Cancer | CGAP: LSM3 |
| Familial Cancer Database: LSM3 | |
| * This gene is included in those cancer gene databases. |
|
|
|
|
|
| . | ||||||||||||||
Oncogene 1 | Significant driver gene in | |||||||||||||||||||
| cf) number; DB name 1 Oncogene; http://nar.oxfordjournals.org/content/35/suppl_1/D721.long, 2 Tumor Suppressor gene; https://bioinfo.uth.edu/TSGene/, 3 Cancer Gene Census; http://www.nature.com/nrc/journal/v4/n3/abs/nrc1299.html, 4 CancerGenes; http://nar.oxfordjournals.org/content/35/suppl_1/D721.long, 5 Network of Cancer Gene; http://ncg.kcl.ac.uk/index.php, 1Therapeutic Vulnerabilities in Cancer; http://cbio.mskcc.org/cancergenomics/statius/ |
| REACTOME_METABOLISM_OF_MRNA REACTOME_METABOLISM_OF_RNA | |
| OMIM | |
| Orphanet | |
| Disease | KEGG Disease: LSM3 |
| MedGen: LSM3 (Human Medical Genetics with Condition) | |
| ClinVar: LSM3 | |
| Phenotype | MGI: LSM3 (International Mouse Phenotyping Consortium) |
| PhenomicDB: LSM3 | |
| Mutations for LSM3 |
| * Under tables are showing count per each tissue to give us broad intuition about tissue specific mutation patterns.You can go to the detailed page for each mutation database's web site. |
| There's no structural variation information in COSMIC data for this gene. |
| * From mRNA Sanger sequences, Chitars2.0 arranged chimeric transcripts. This table shows LSM3 related fusion information. |
| ID | Head Gene | Tail Gene | Accession | Gene_a | qStart_a | qEnd_a | Chromosome_a | tStart_a | tEnd_a | Gene_a | qStart_a | qEnd_a | Chromosome_a | tStart_a | tEnd_a |
| BG034592 | ZACN | 1 | 111 | 17 | 74077842 | 74077952 | LSM3 | 100 | 658 | 3 | 14220341 | 14239843 | |
| Top |
| There's no copy number variation information in COSMIC data for this gene. |
| Top |
|
 |
| Top |
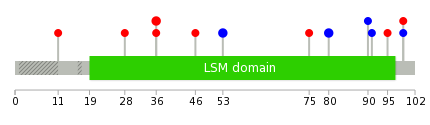
| Stat. for Non-Synonymous SNVs (# total SNVs=10) | (# total SNVs=2) |
 |  |
(# total SNVs=0) | (# total SNVs=0) |
| Top |
| * When you move the cursor on each content, you can see more deailed mutation information on the Tooltip. Those are primary_site,primary_histology,mutation(aa),pubmedID. |
| GRCh37 position | Mutation(aa) | Unique sampleID count |
| chr3:14223156-14223156 | p.R40* | 4 |
| chr3:14239547-14239547 | p.R80R | 2 |
| chr3:14223144-14223144 | p.D36N | 2 |
| chr3:14225463-14225463 | p.I53I | 2 |
| chr3:14225528-14225528 | p.Y75C | 1 |
| chr3:14239577-14239577 | p.D90D | 1 |
| chr3:14223069-14223069 | p.T11A | 1 |
| chr3:14239580-14239580 | p.G91G | 1 |
| chr3:14223121-14223121 | p.R28Q | 1 |
| chr3:14239590-14239590 | p.V95I | 1 |
| Top |
|
 |
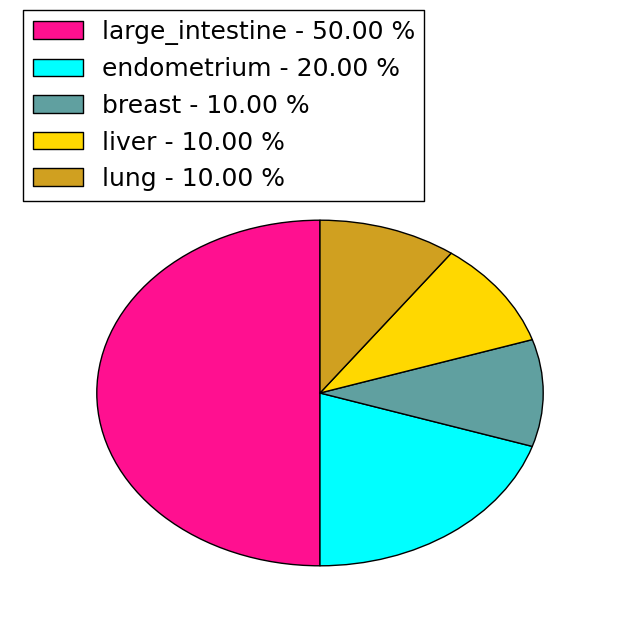
| Point Mutation/ Tissue ID | 1 | 2 | 3 | 4 | 5 | 6 | 7 | 8 | 9 | 10 | 11 | 12 | 13 | 14 | 15 | 16 | 17 | 18 | 19 | 20 |
| # sample | 1 | 1 | 1 | 3 | 2 | 1 | ||||||||||||||
| # mutation | 1 | 1 | 1 | 3 | 2 | 1 | ||||||||||||||
| nonsynonymous SNV | 1 | 1 | 1 | 1 | 1 | |||||||||||||||
| synonymous SNV | 1 | 2 | 1 |
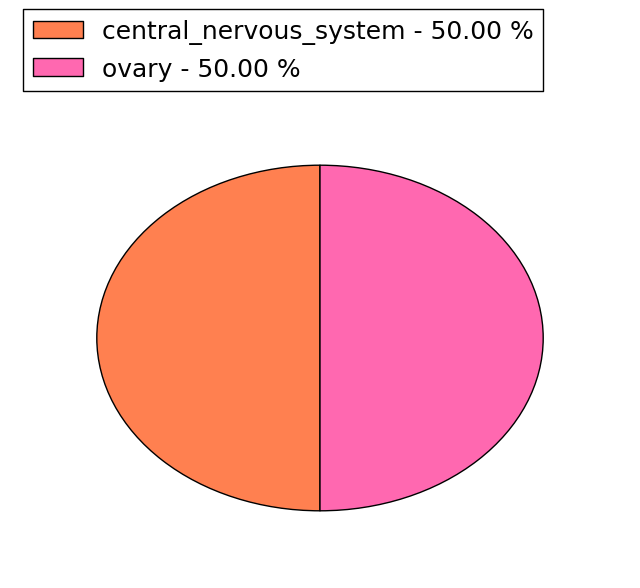
| cf) Tissue ID; Tissue type (1; BLCA[Bladder Urothelial Carcinoma], 2; BRCA[Breast invasive carcinoma], 3; CESC[Cervical squamous cell carcinoma and endocervical adenocarcinoma], 4; COAD[Colon adenocarcinoma], 5; GBM[Glioblastoma multiforme], 6; Glioma Low Grade, 7; HNSC[Head and Neck squamous cell carcinoma], 8; KICH[Kidney Chromophobe], 9; KIRC[Kidney renal clear cell carcinoma], 10; KIRP[Kidney renal papillary cell carcinoma], 11; LAML[Acute Myeloid Leukemia], 12; LUAD[Lung adenocarcinoma], 13; LUSC[Lung squamous cell carcinoma], 14; OV[Ovarian serous cystadenocarcinoma ], 15; PAAD[Pancreatic adenocarcinoma], 16; PRAD[Prostate adenocarcinoma], 17; SKCM[Skin Cutaneous Melanoma], 18:STAD[Stomach adenocarcinoma], 19:THCA[Thyroid carcinoma], 20:UCEC[Uterine Corpus Endometrial Carcinoma]) |
| Top |
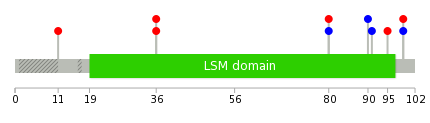
| * We represented just top 10 SNVs. When you move the cursor on each content, you can see more deailed mutation information on the Tooltip. Those are primary_site, primary_histology, mutation(aa), pubmedID. |
| Genomic Position | Mutation(aa) | Unique sampleID count |
| chr3:14239603 | p.T11A | 1 |
| chr3:14239604 | p.D36N | 1 |
| chr3:14223069 | p.D36V | 1 |
| chr3:14223144 | p.R80Q | 1 |
| chr3:14223145 | p.R80R | 1 |
| chr3:14239546 | p.D90D | 1 |
| chr3:14239547 | p.G91G | 1 |
| chr3:14239577 | p.V95I | 1 |
| chr3:14239580 | p.L99P | 1 |
| chr3:14239590 | p.L99L | 1 |
| * Copy number data were extracted from TCGA using R package TCGA-Assembler. The URLs of all public data files on TCGA DCC data server were gathered on Jan-05-2015. Function ProcessCNAData in TCGA-Assembler package was used to obtain gene-level copy number value which is calculated as the average copy number of the genomic region of a gene. |
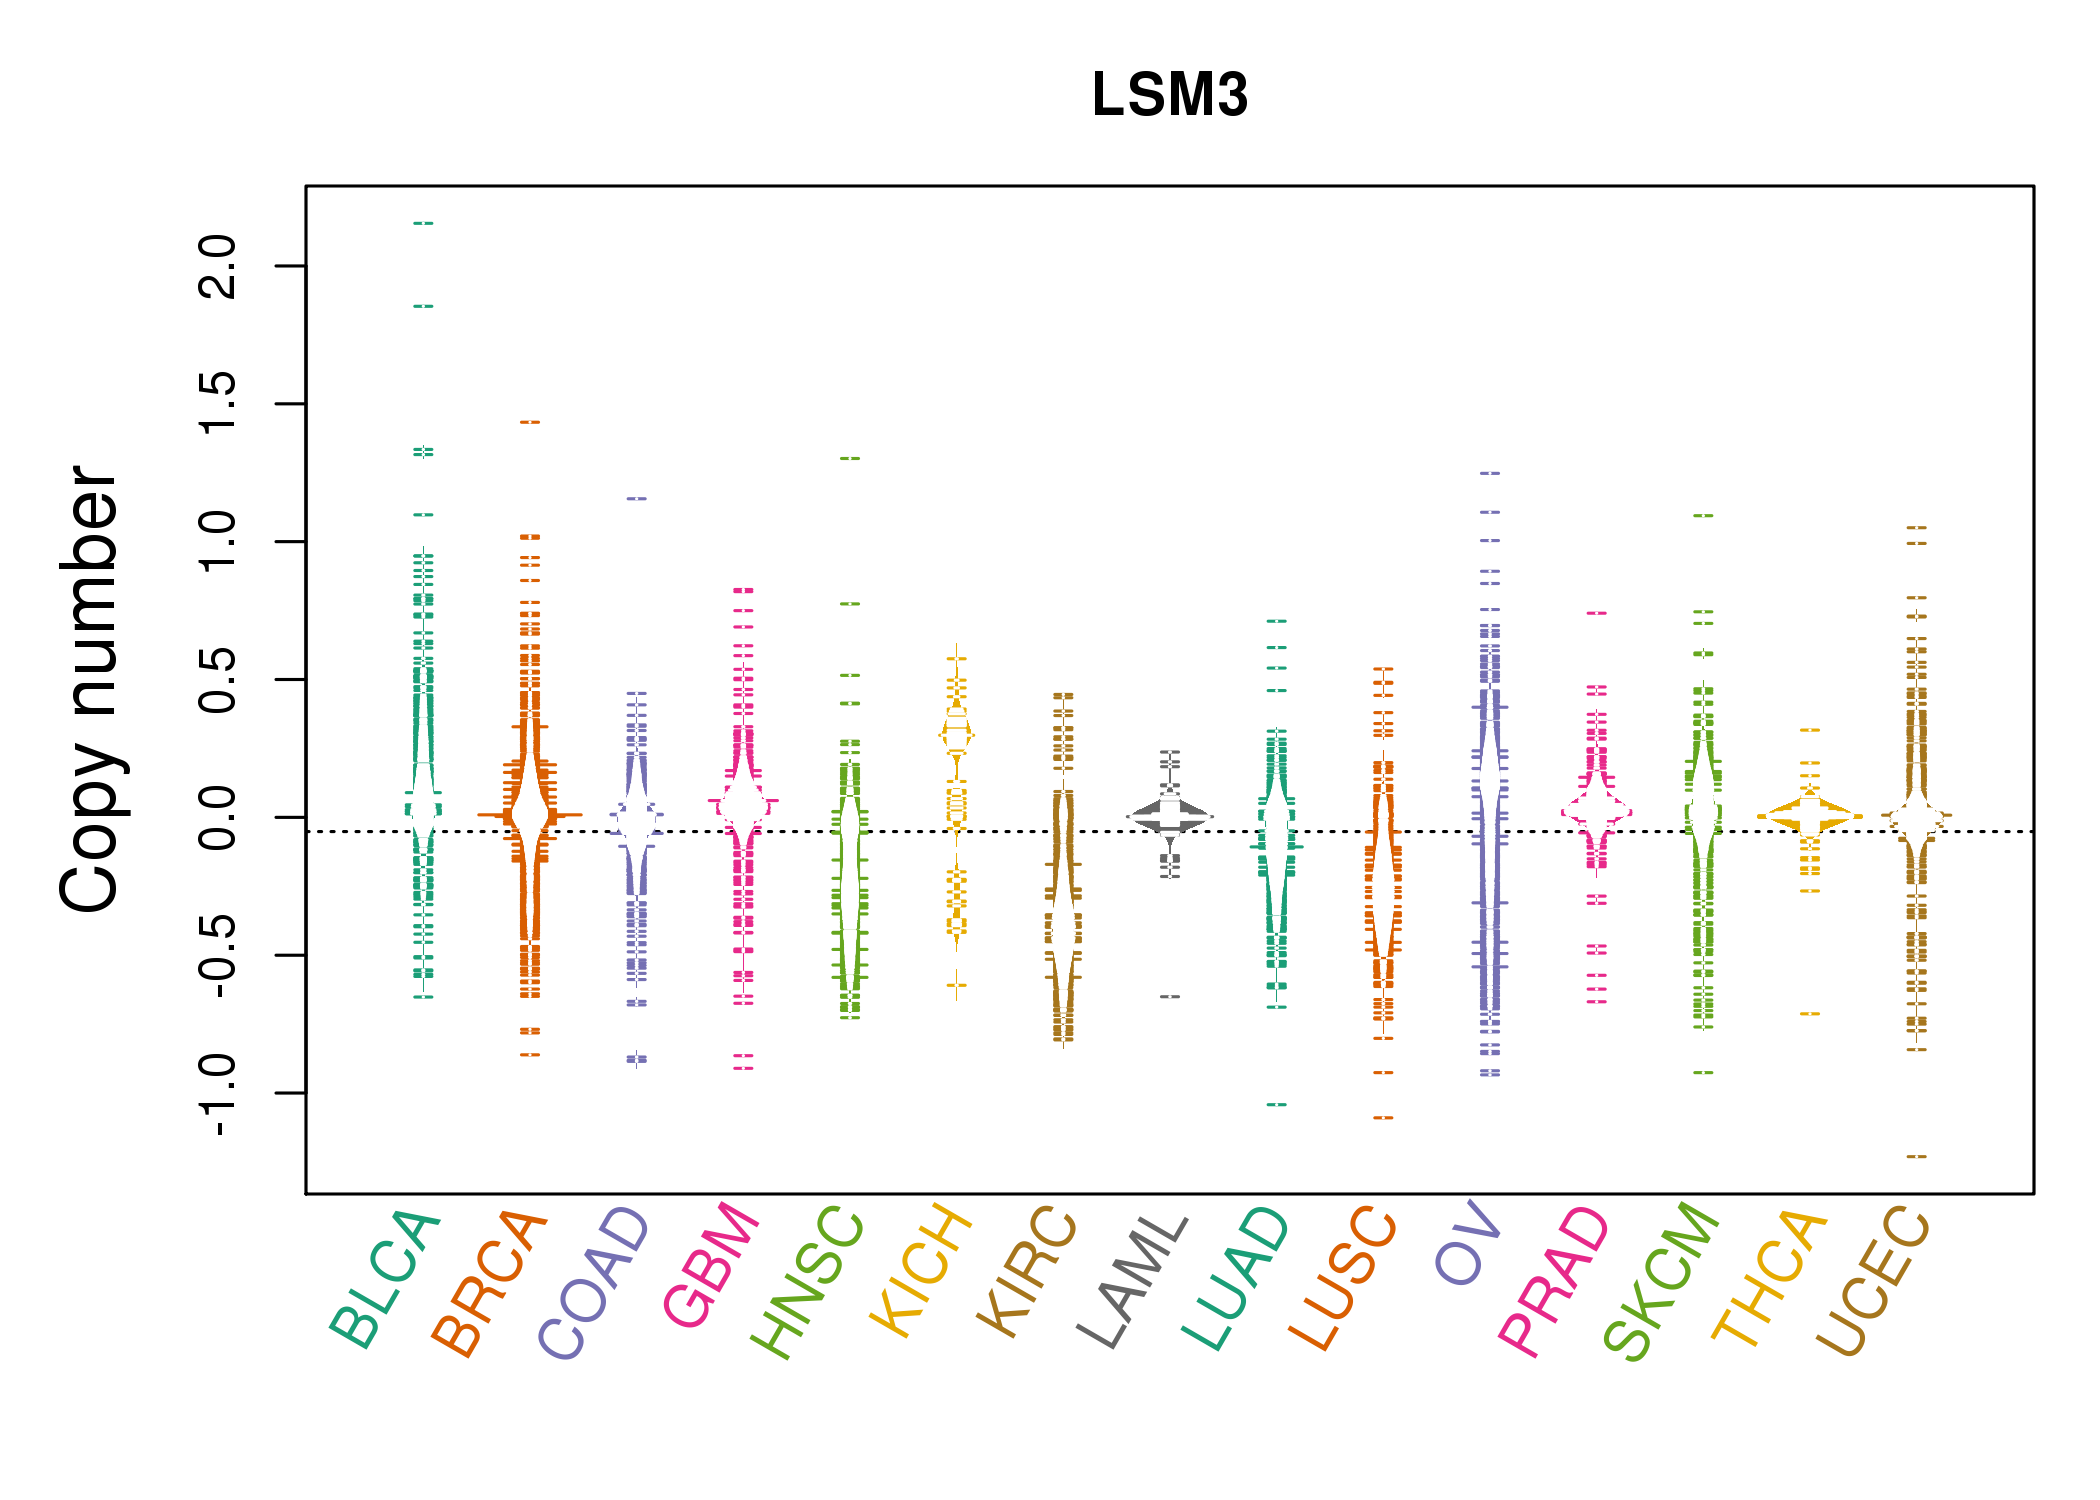 |
| cf) Tissue ID[Tissue type]: BLCA[Bladder Urothelial Carcinoma], BRCA[Breast invasive carcinoma], CESC[Cervical squamous cell carcinoma and endocervical adenocarcinoma], COAD[Colon adenocarcinoma], GBM[Glioblastoma multiforme], Glioma Low Grade, HNSC[Head and Neck squamous cell carcinoma], KICH[Kidney Chromophobe], KIRC[Kidney renal clear cell carcinoma], KIRP[Kidney renal papillary cell carcinoma], LAML[Acute Myeloid Leukemia], LUAD[Lung adenocarcinoma], LUSC[Lung squamous cell carcinoma], OV[Ovarian serous cystadenocarcinoma ], PAAD[Pancreatic adenocarcinoma], PRAD[Prostate adenocarcinoma], SKCM[Skin Cutaneous Melanoma], STAD[Stomach adenocarcinoma], THCA[Thyroid carcinoma], UCEC[Uterine Corpus Endometrial Carcinoma] |
| Top |
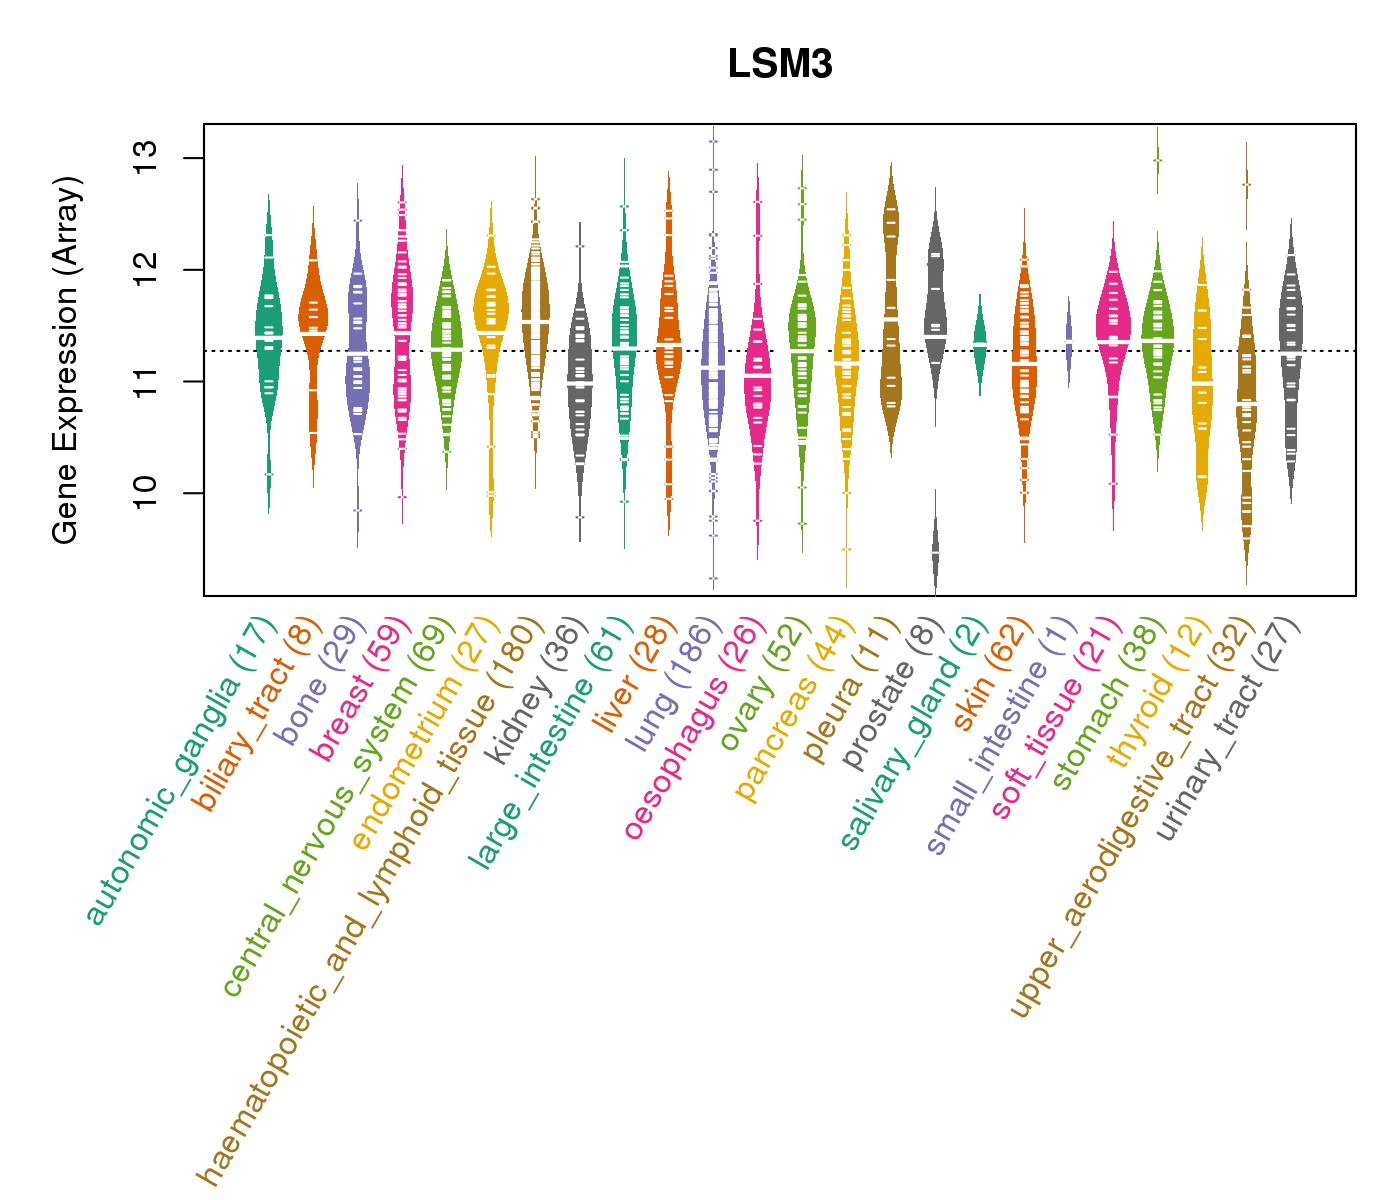
| Gene Expression for LSM3 |
| * CCLE gene expression data were extracted from CCLE_Expression_Entrez_2012-10-18.res: Gene-centric RMA-normalized mRNA expression data. |
 |
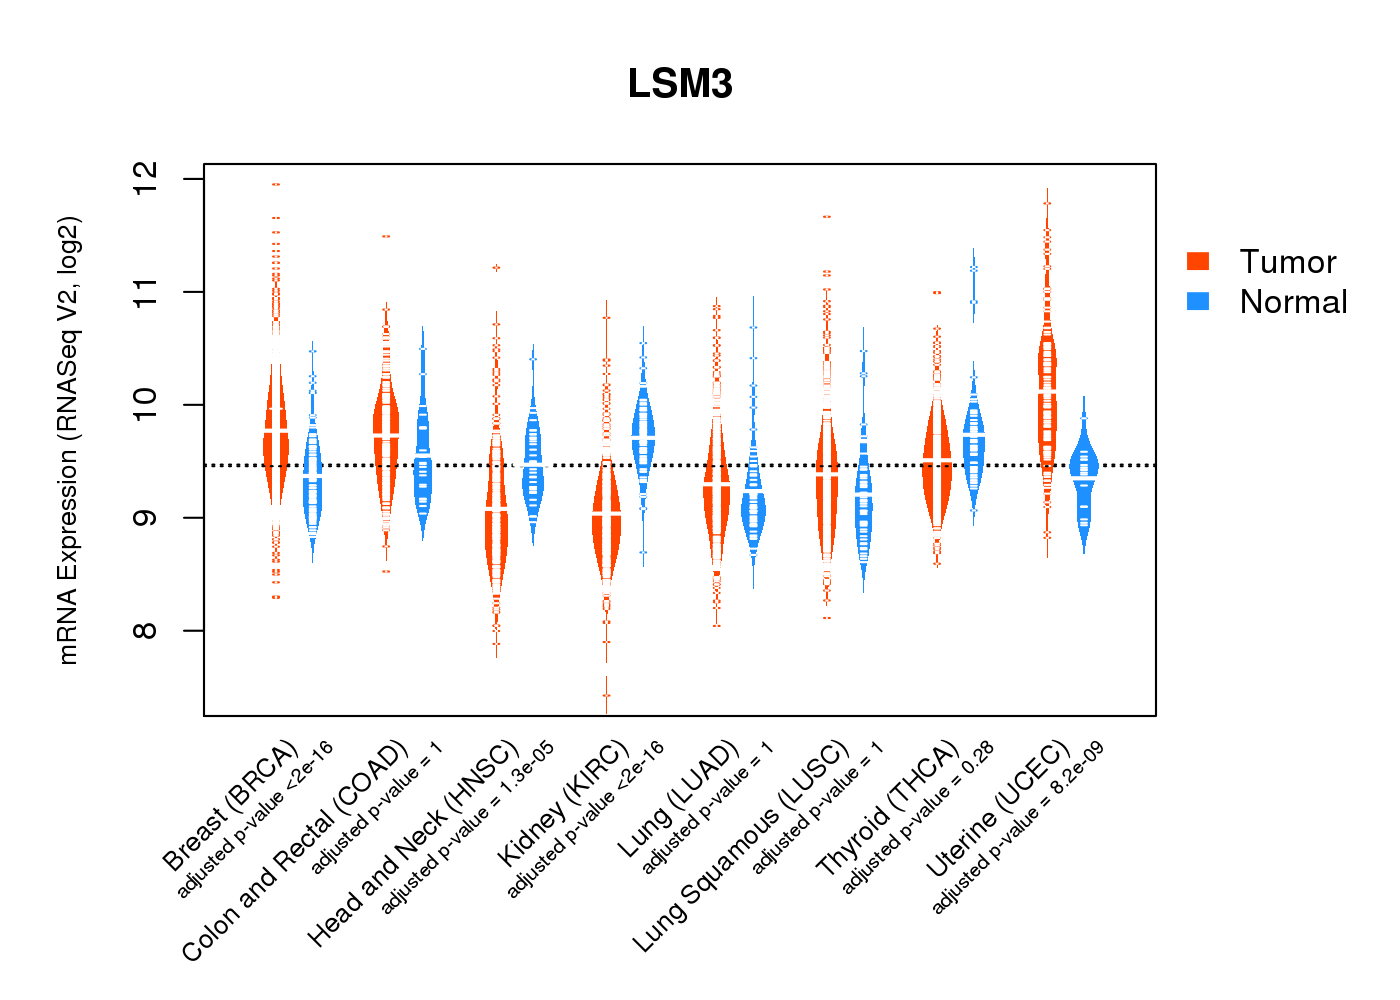
| * Normalized gene expression data of RNASeqV2 was extracted from TCGA using R package TCGA-Assembler. The URLs of all public data files on TCGA DCC data server were gathered at Jan-05-2015. Only eight cancer types have enough normal control samples for differential expression analysis. (t test, adjusted p<0.05 (using Benjamini-Hochberg FDR)) |
 |
| Top |
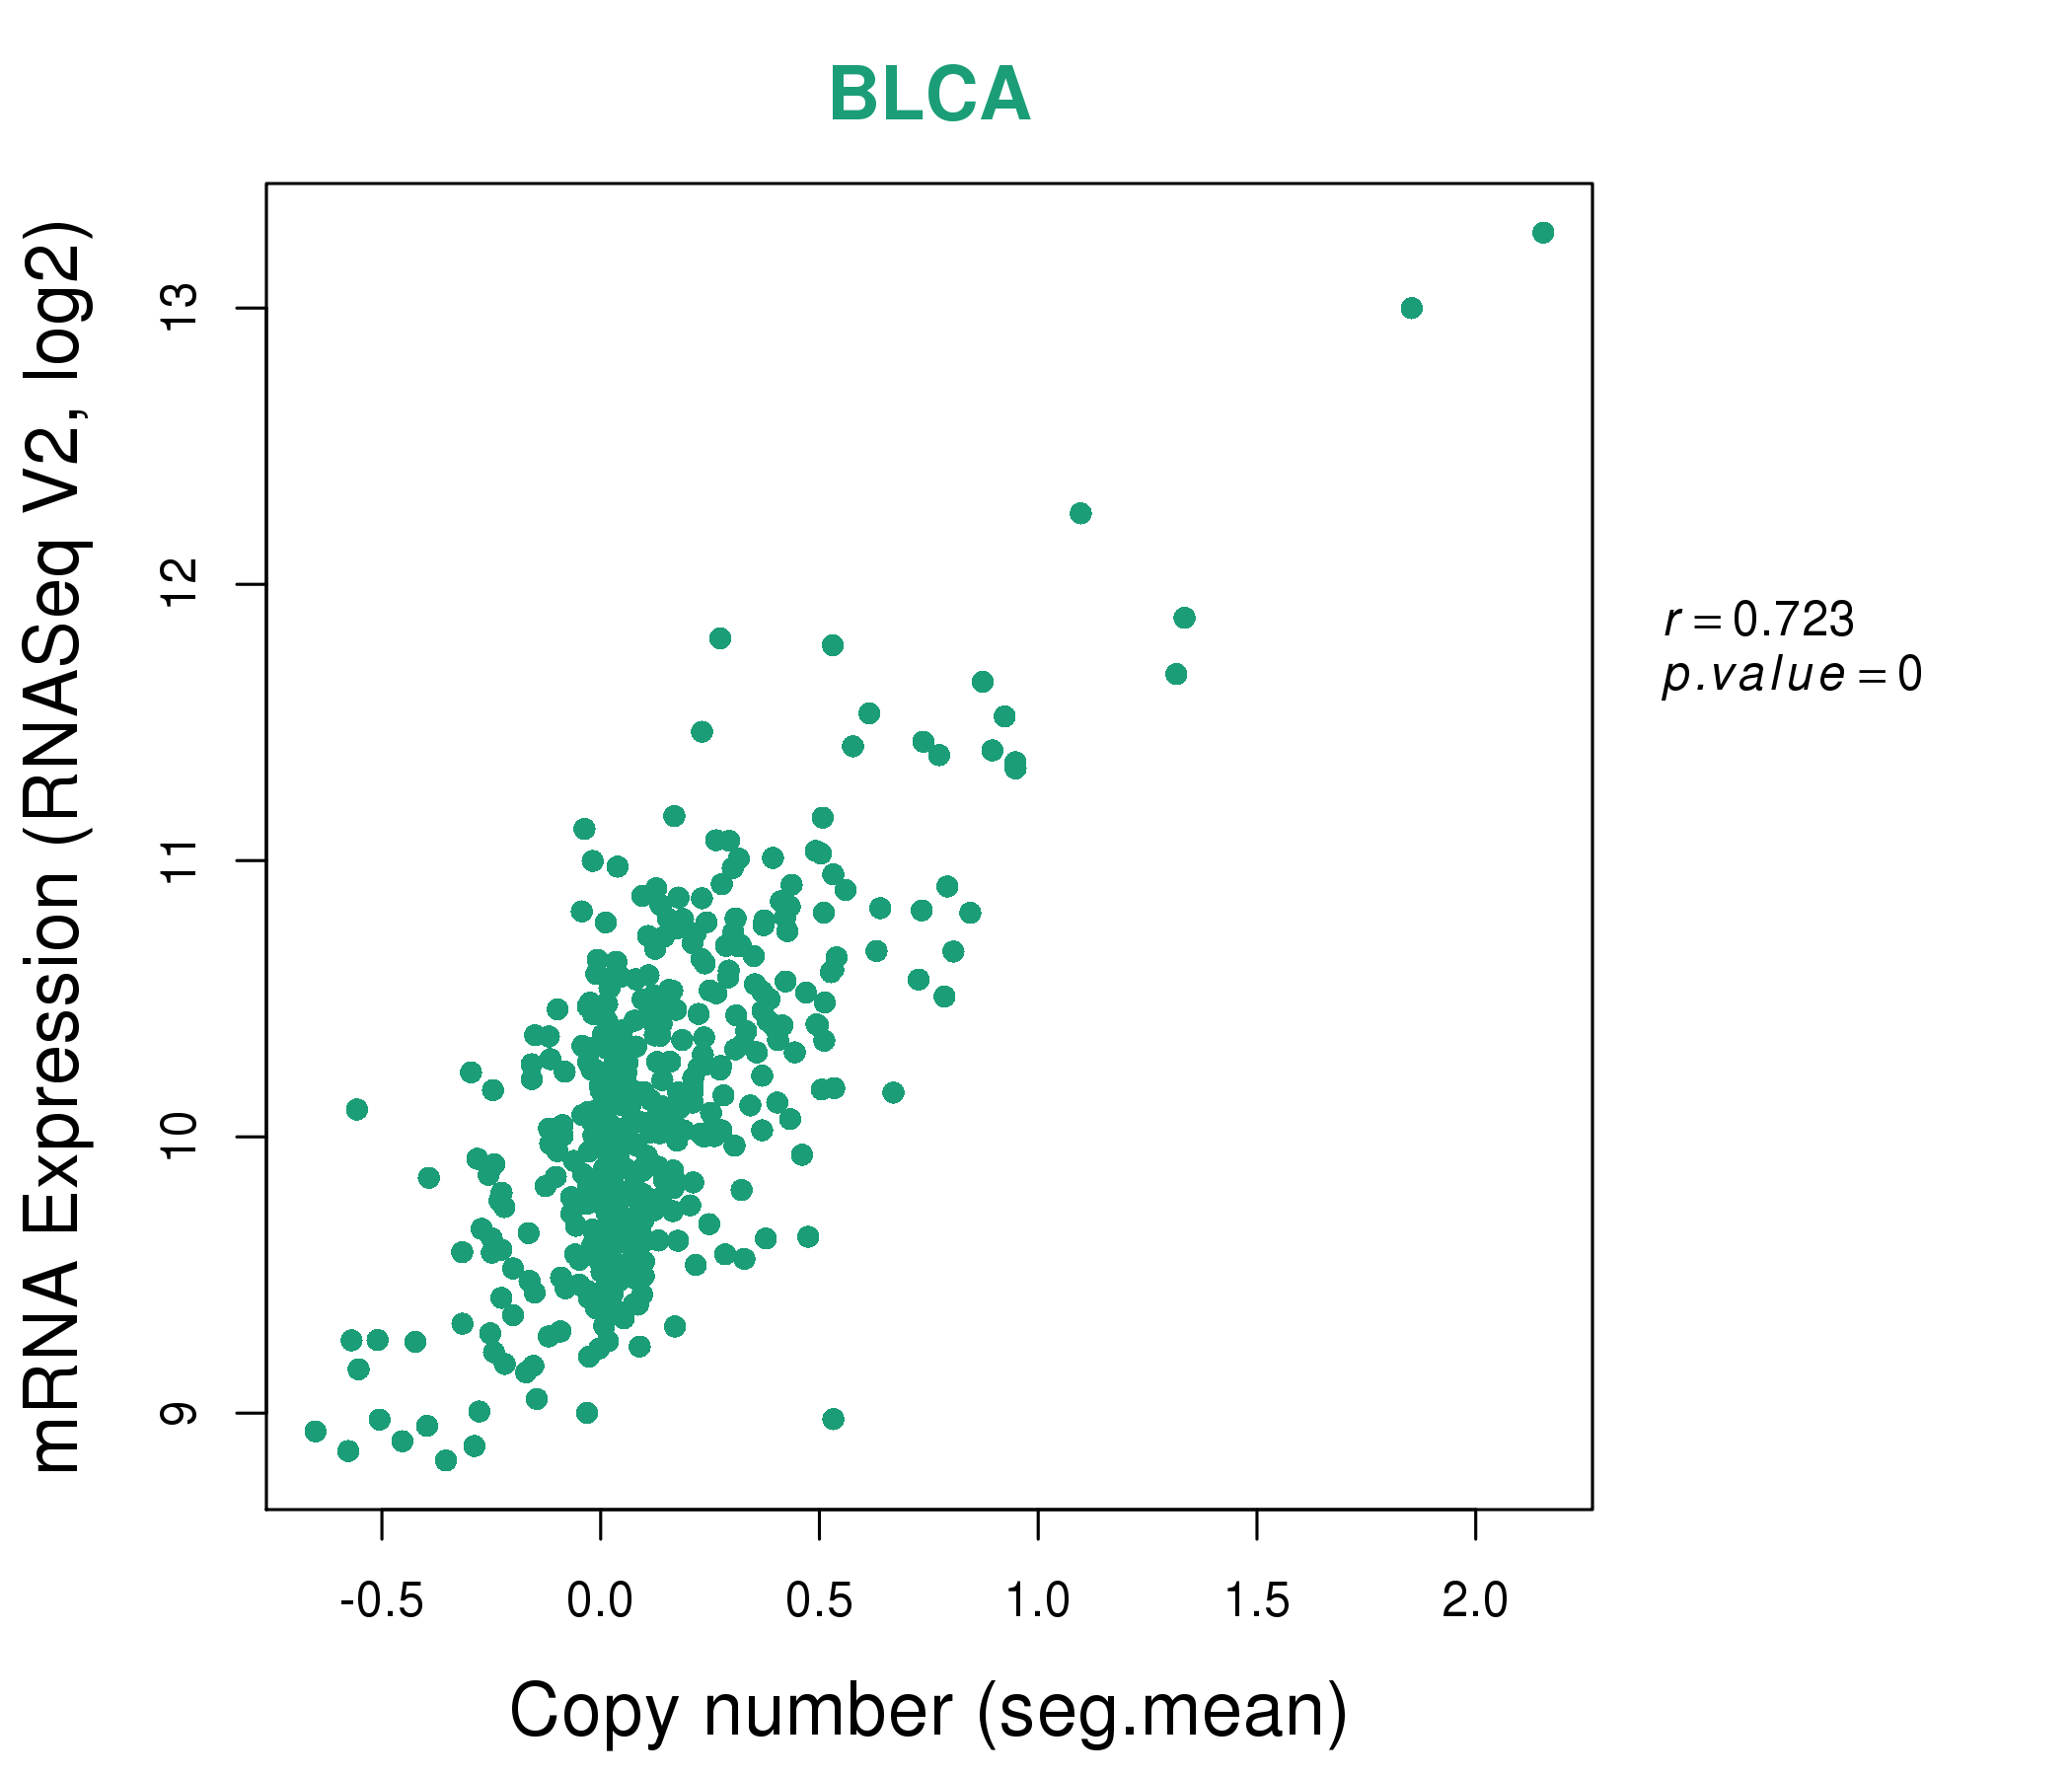
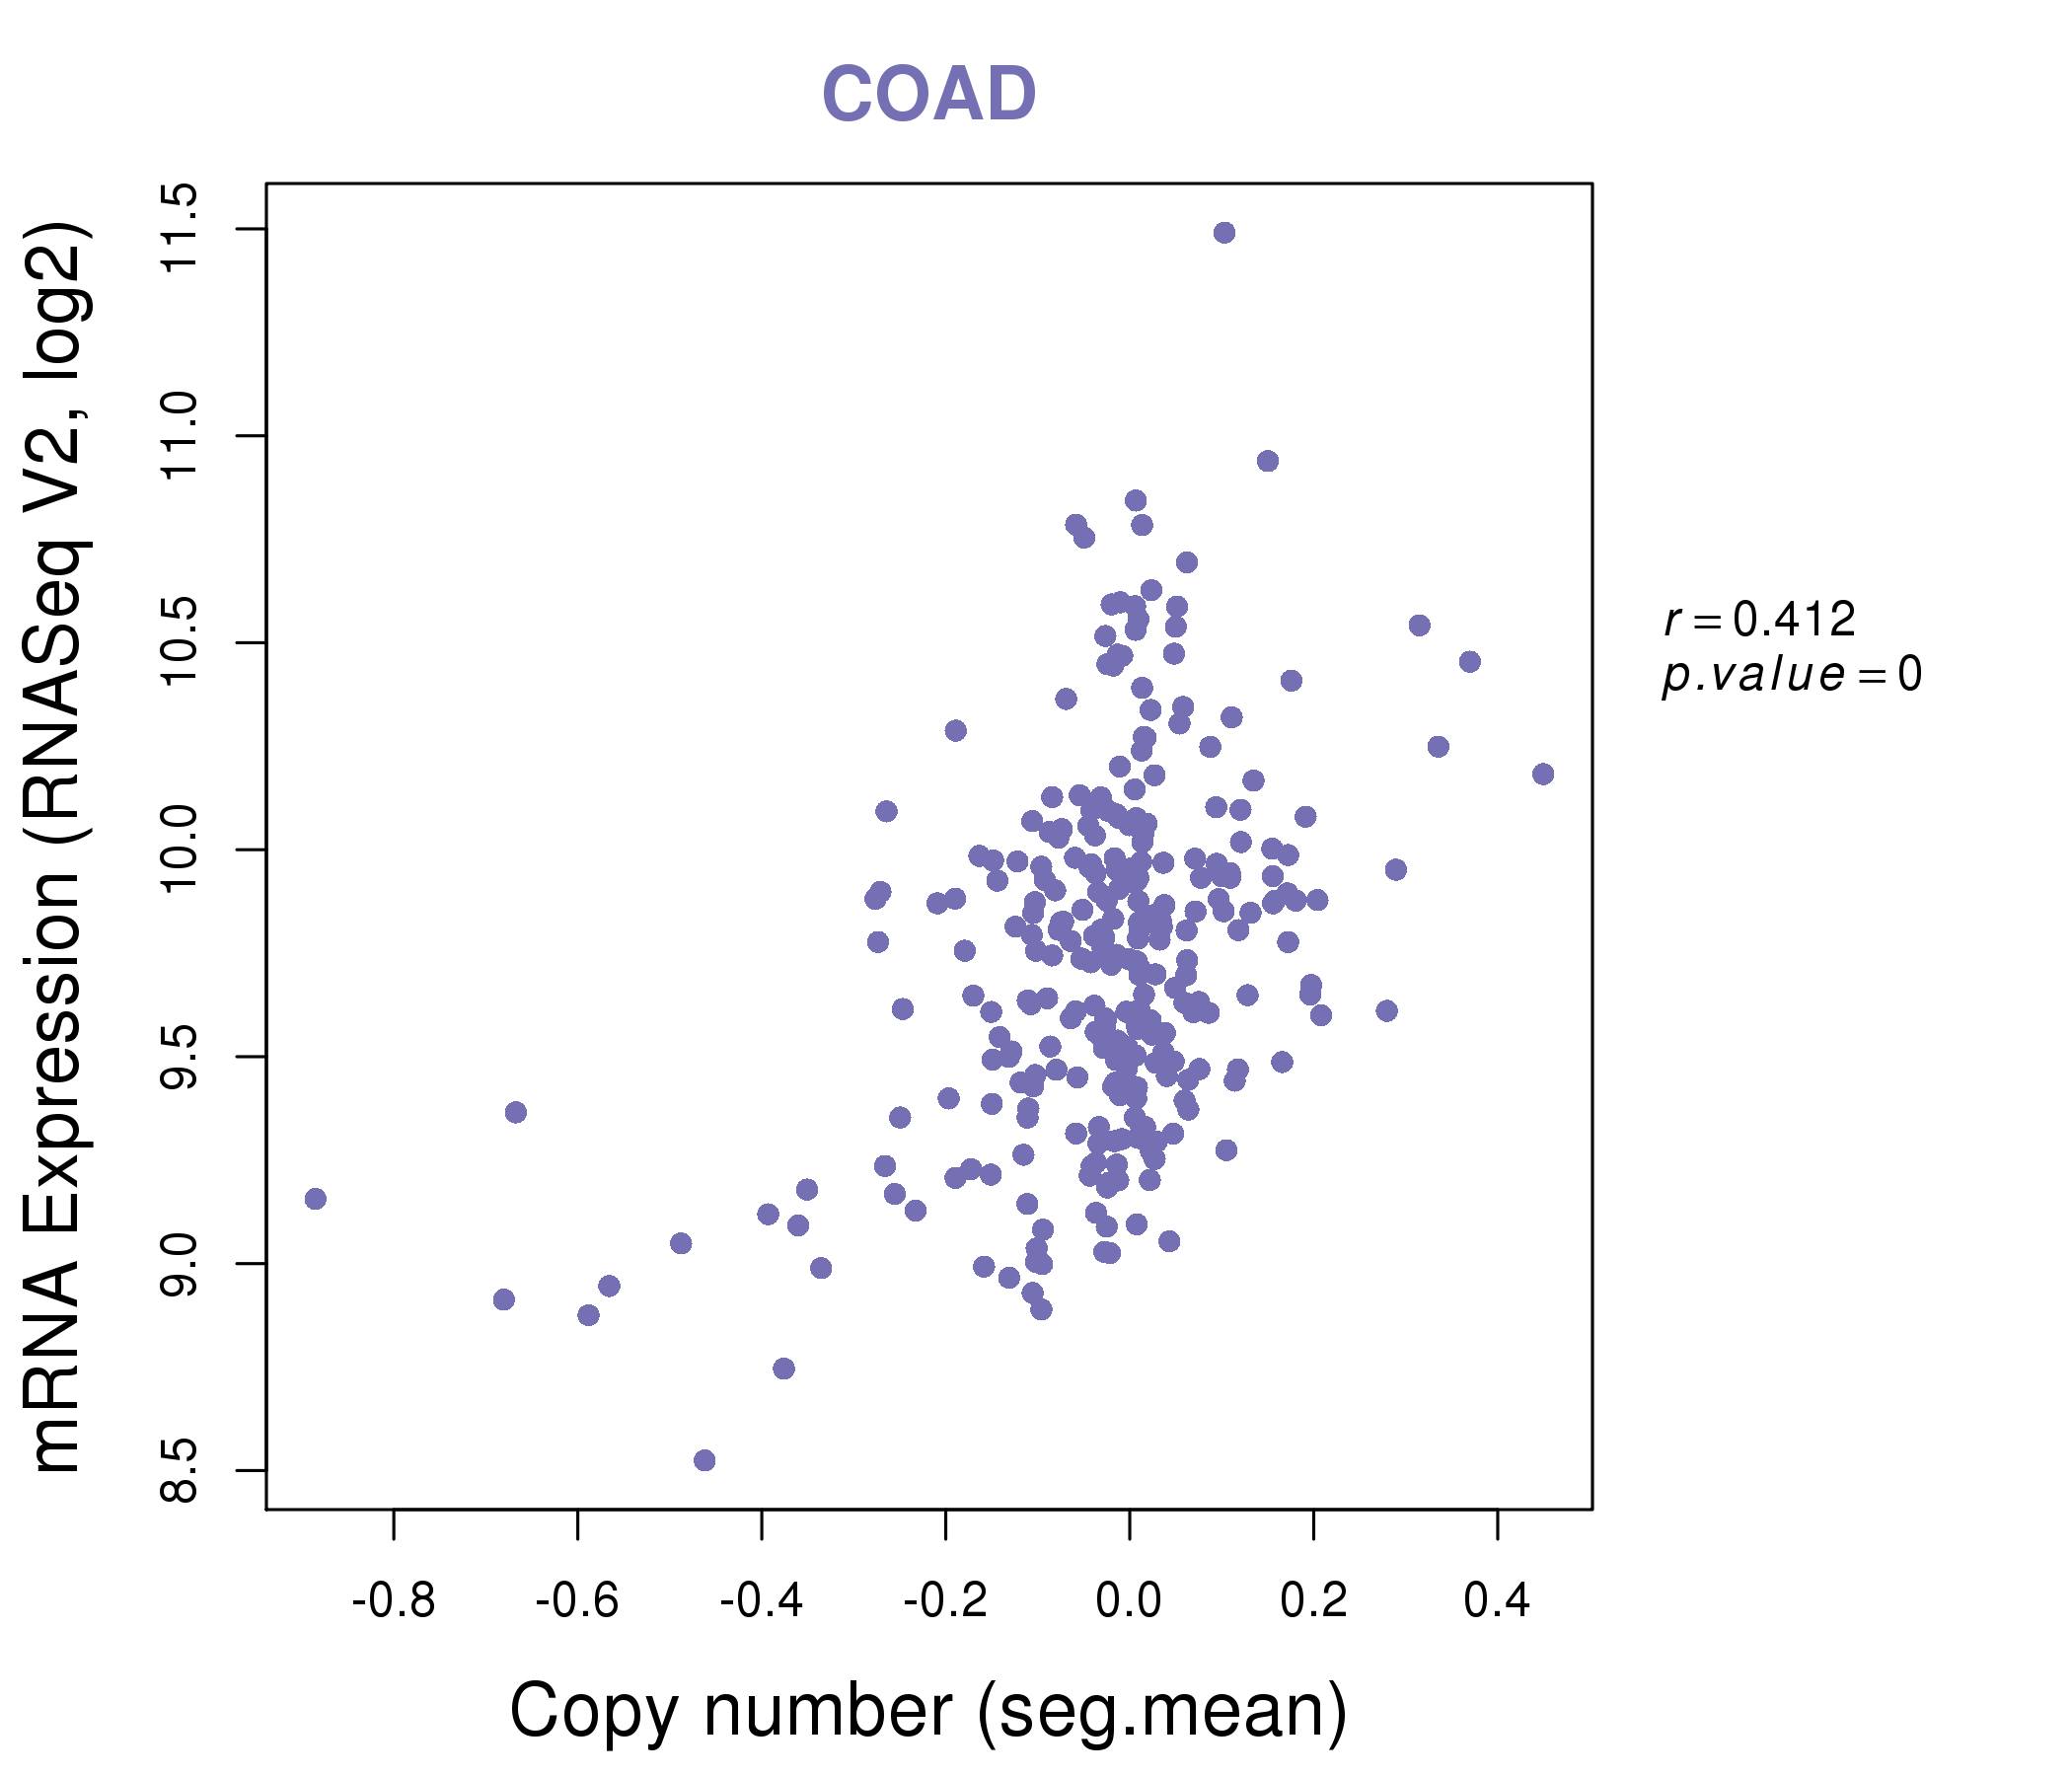
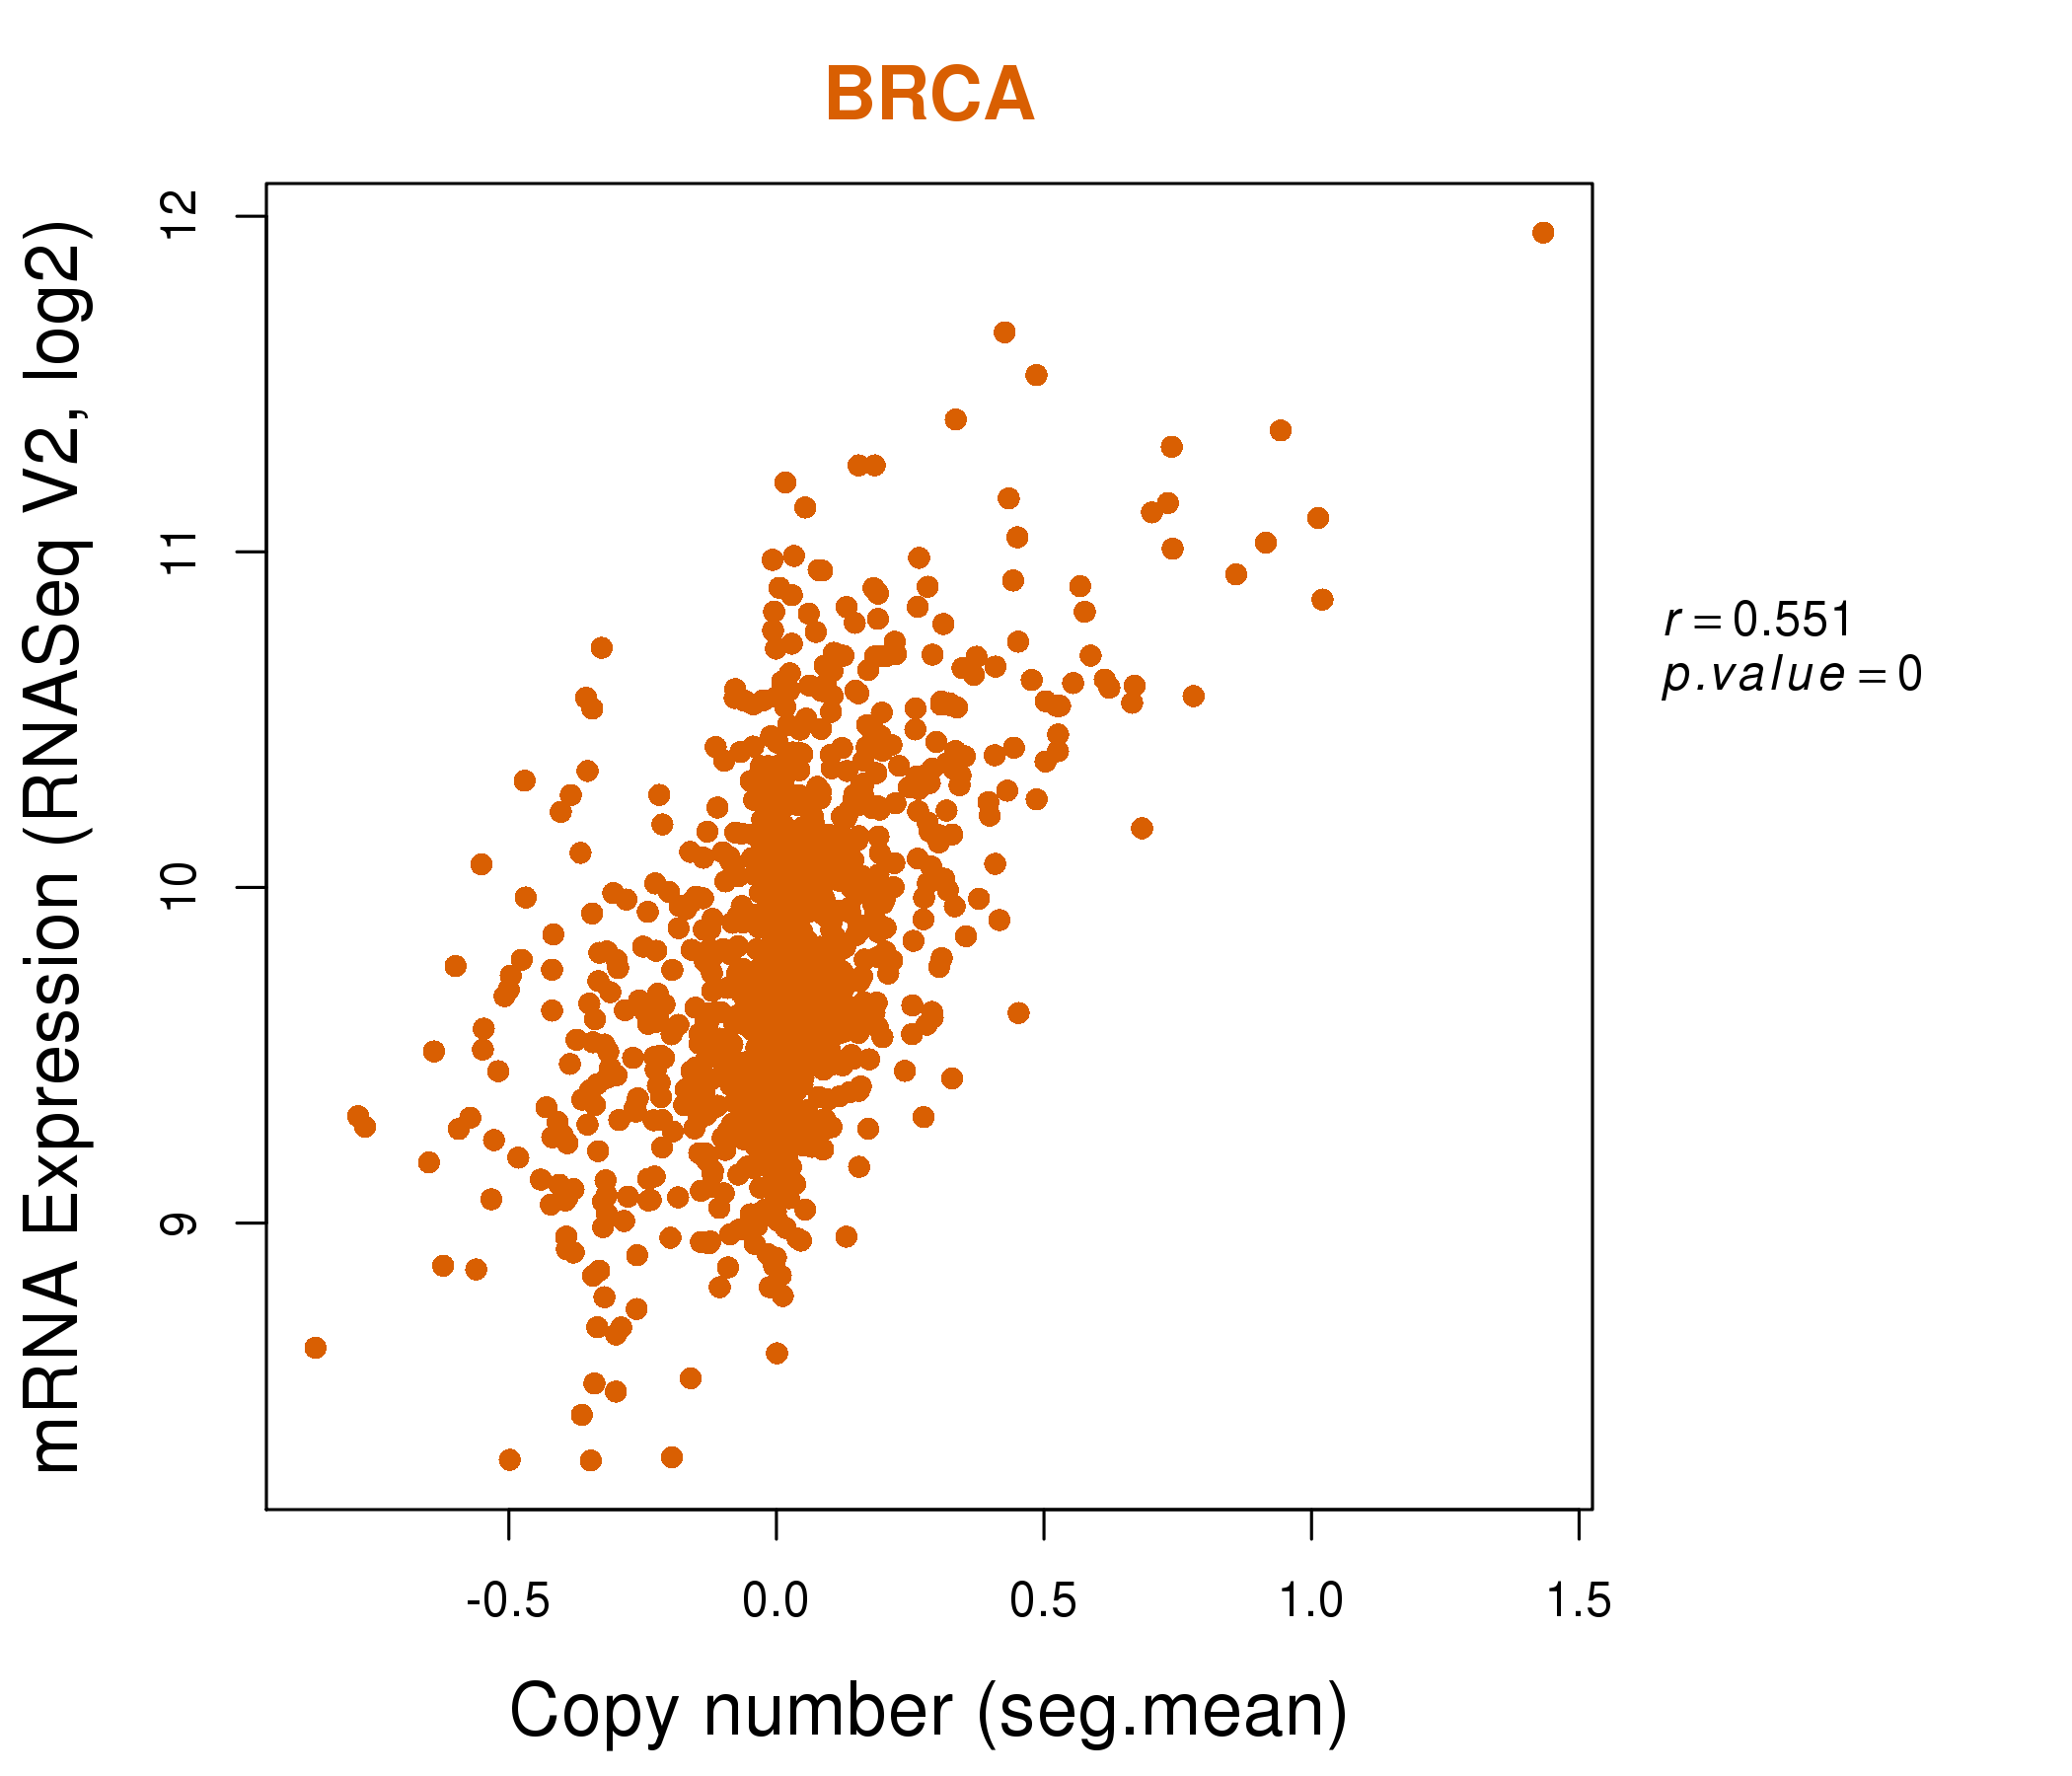
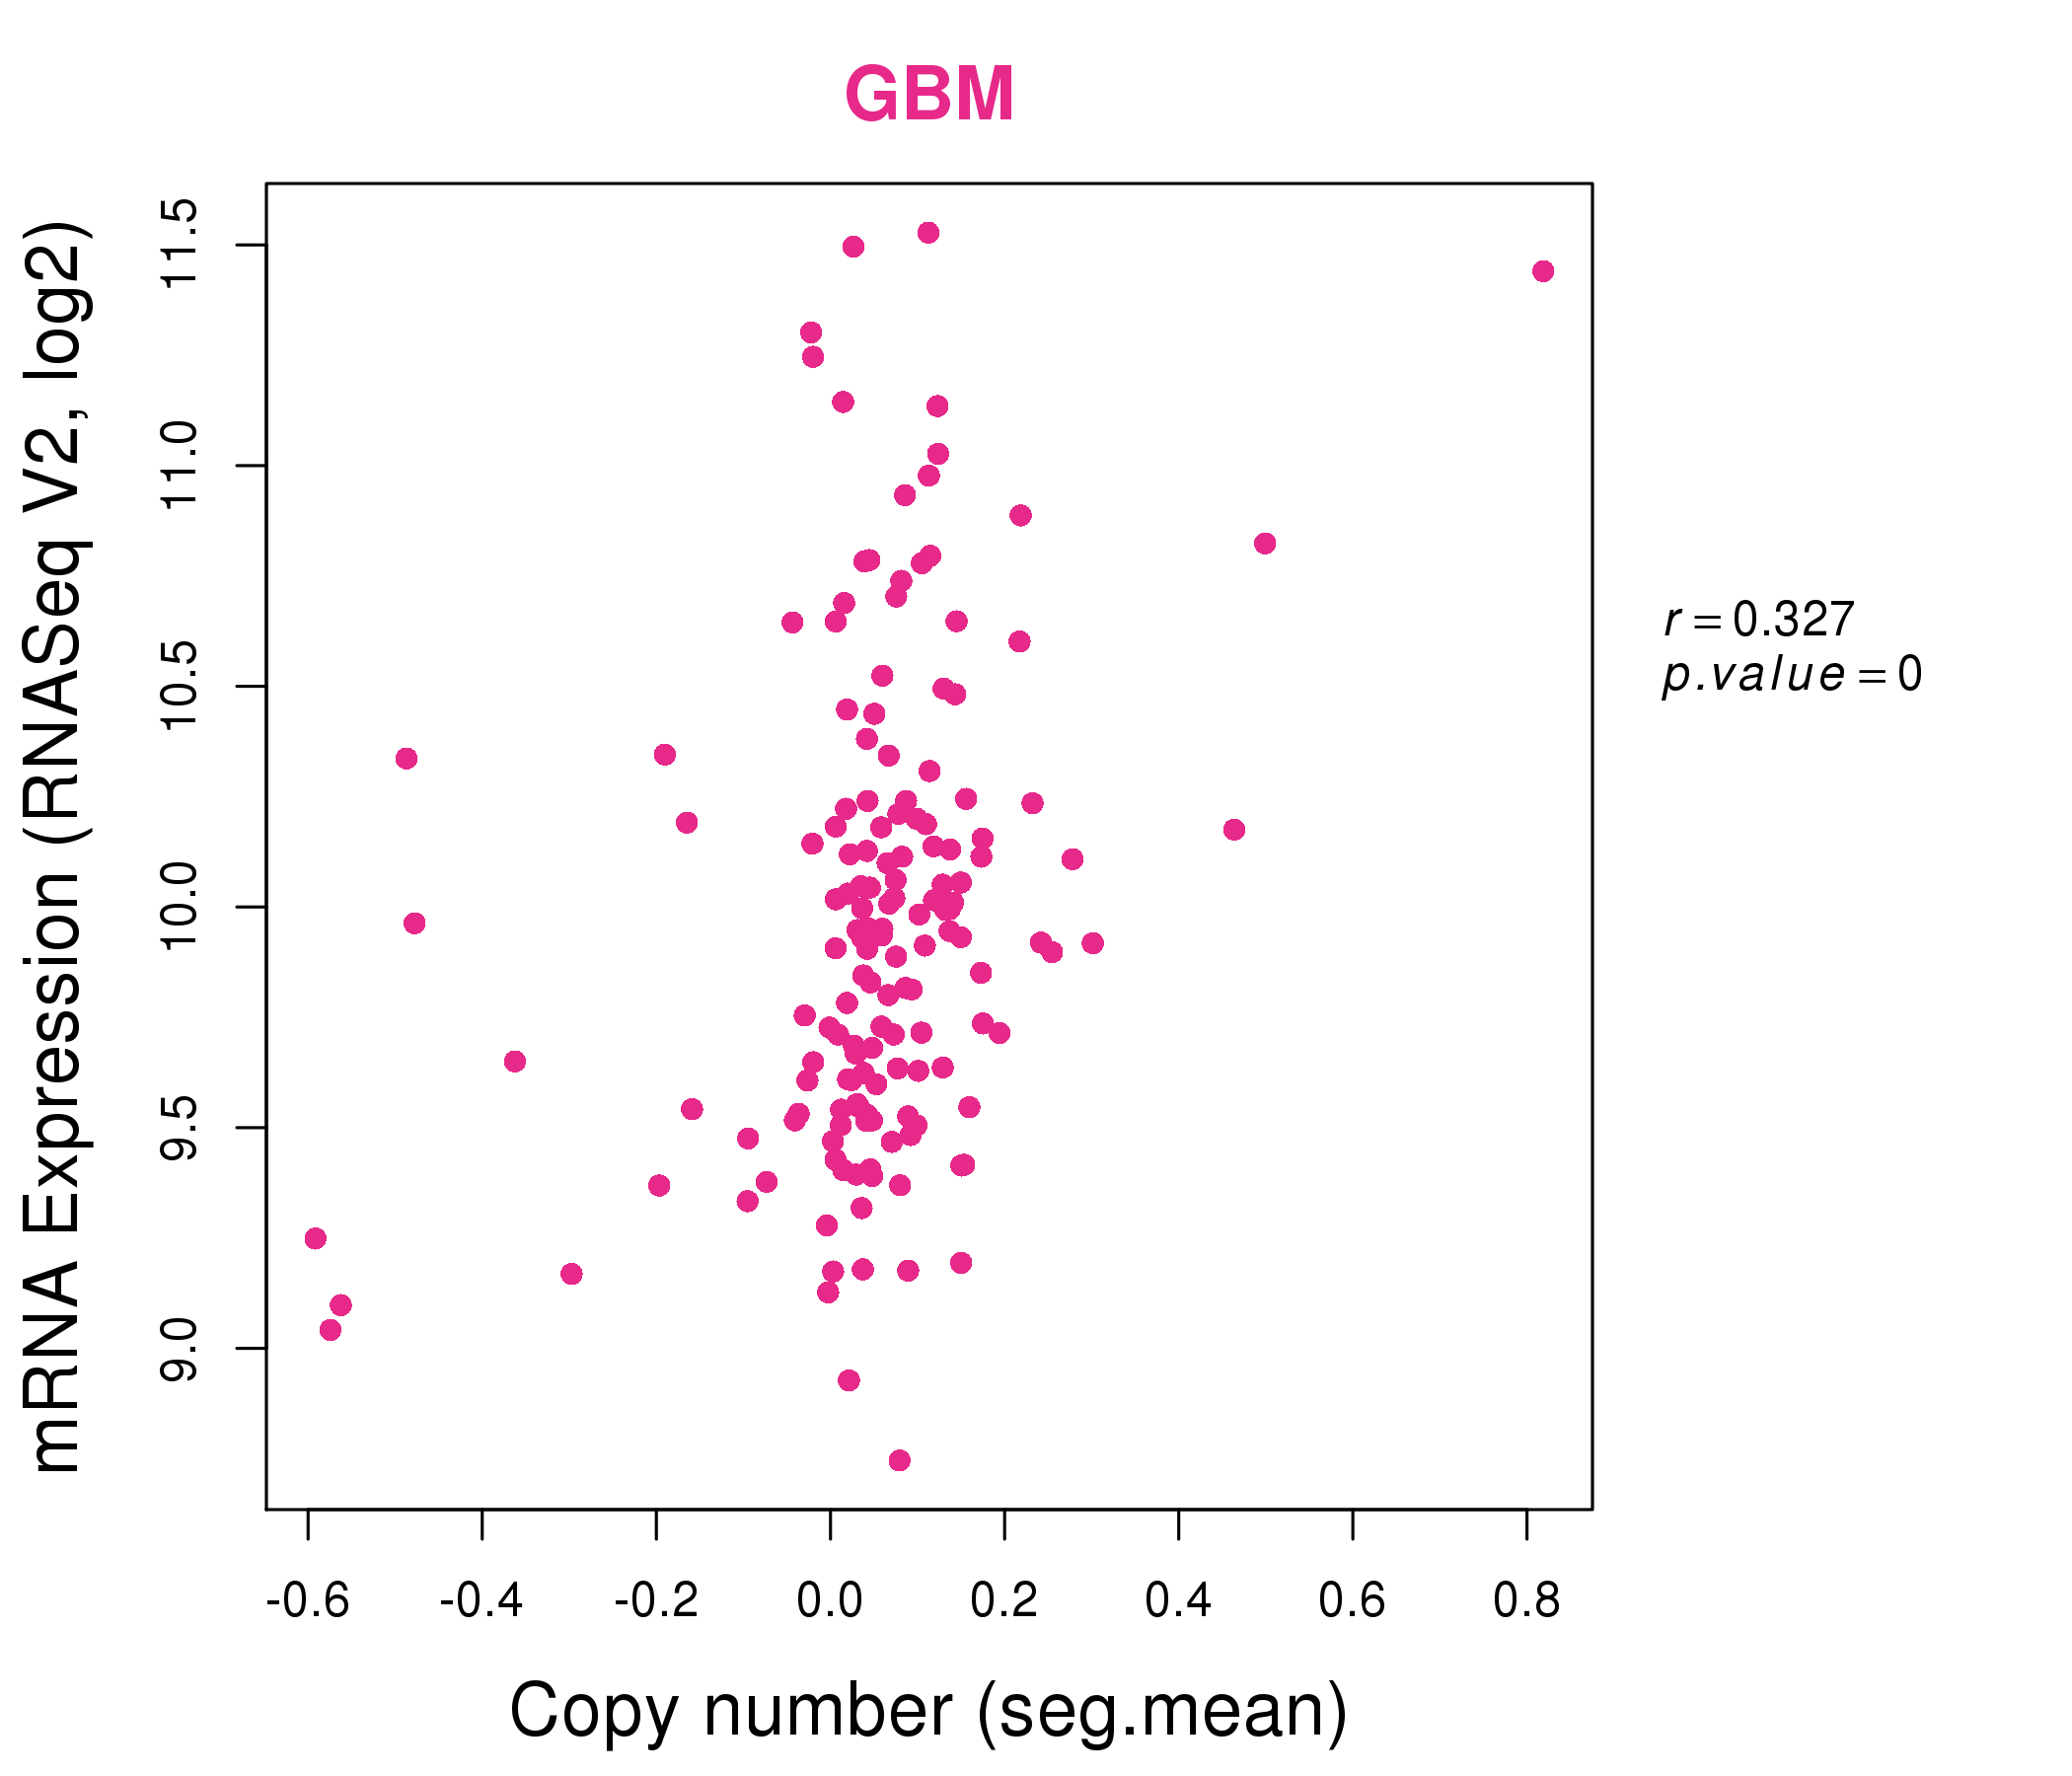
| * This plots show the correlation between CNV and gene expression. |
: Open all plots for all cancer types
 |
|
 |
|
| Top |
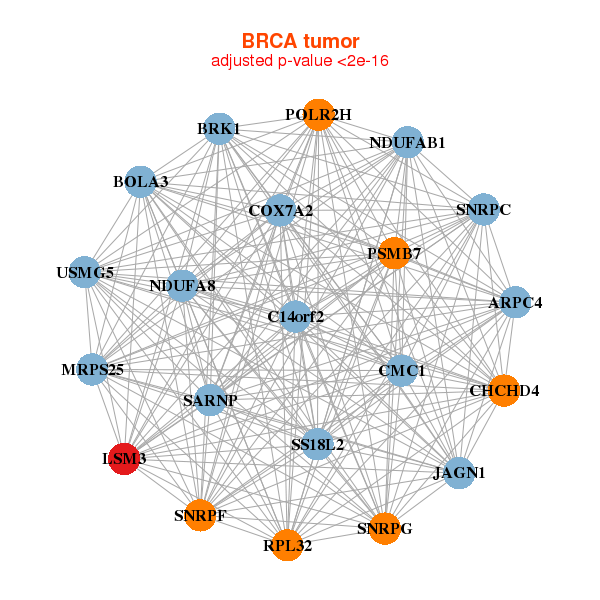
| Gene-Gene Network Information |
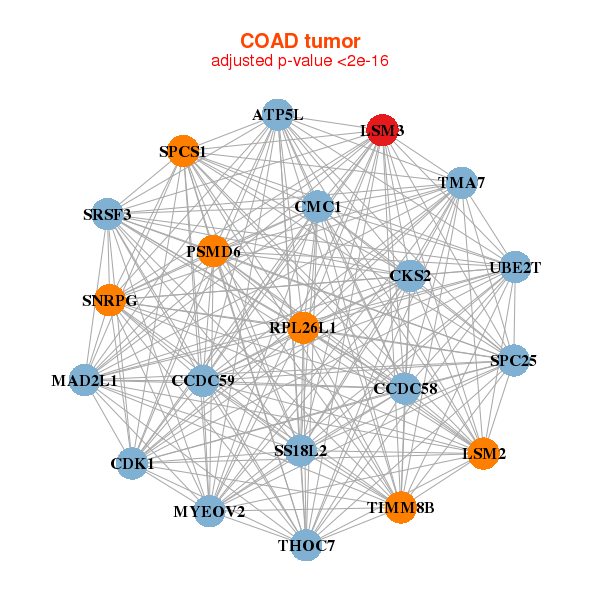
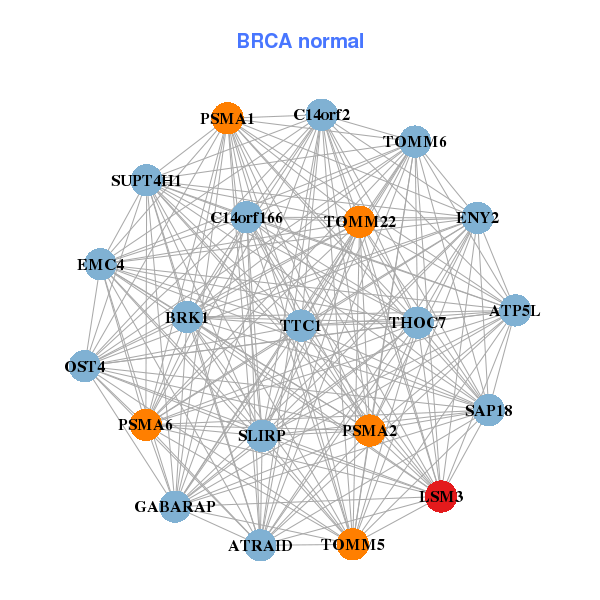
| * Co-Expression network figures were drawn using R package igraph. Only the top 20 genes with the highest correlations were shown. Red circle: input gene, orange circle: cell metabolism gene, sky circle: other gene |
: Open all plots for all cancer types
 |
|
| ARPC4,BOLA3,C14orf2,BRK1,CHCHD4,CMC1,COX7A2, JAGN1,LSM3,MRPS25,NDUFA8,NDUFAB1,POLR2H,PSMB7, RPL32,SARNP,SNRPC,SNRPF,SNRPG,SS18L2,USMG5 | ATP5L,SLIRP,C14orf166,C14orf2,ATRAID,BRK1,ENY2, GABARAP,LSM3,OST4,PSMA1,PSMA2,PSMA6,SAP18, SUPT4H1,THOC7,EMC4,TOMM22,TOMM5,TOMM6,TTC1 |
 |
|
| ATP5L,CCDC58,CCDC59,TMA7,CDK1,CKS2,CMC1, LSM2,LSM3,MAD2L1,MYEOV2,PSMD6,RPL26L1,SRSF3, SNRPG,SPC25,SPCS1,SS18L2,THOC7,TIMM8B,UBE2T | SLIRP,C14orf166,EMC7,DYNLT1,ENSA,FKBP3,LSM3, MRPL51,NDUFB4,NDUFB6,NEDD8,POMP,PSMA1,PSMA2, PSMB1,PSMB7,PSMD13,RBX1,SAP18,SARNP,SSBP1 |
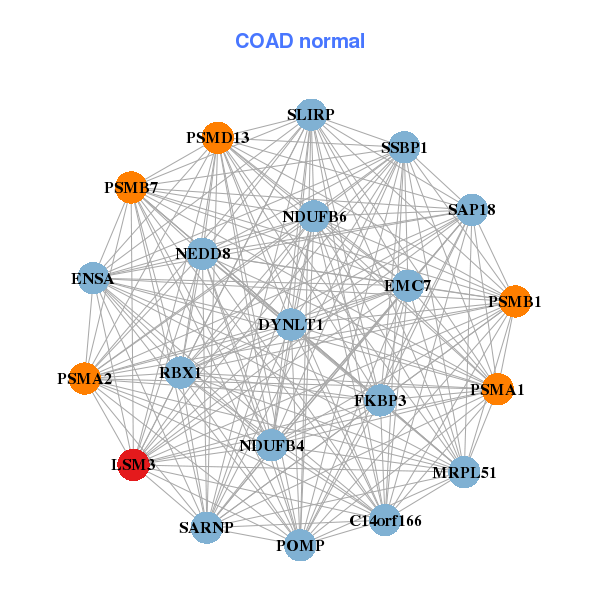
| * Co-Expression network figures were drawn using R package igraph. Only the top 20 genes with the highest correlations were shown. Red circle: input gene, orange circle: cell metabolism gene, sky circle: other gene |
: Open all plots for all cancer types
| Top |
: Open all interacting genes' information including KEGG pathway for all interacting genes from DAVID
| Top |
| Pharmacological Information for LSM3 |
| There's no related Drug. |
| Top |
| Cross referenced IDs for LSM3 |
| * We obtained these cross-references from Uniprot database. It covers 150 different DBs, 18 categories. http://www.uniprot.org/help/cross_references_section |
: Open all cross reference information
|
Copyright © 2016-Present - The Univsersity of Texas Health Science Center at Houston @ |