|
|||||||||||||||||||||||||||||||||||||||||||||||||||||||||||||||||||||||||||||||||||||||||||||||||||||||||||||||||||||||||||||||||||||||||||||||||||||||||||||||||||||||||||||||||||||||||||||||||||||||||||||||||||||||||||||||||||||||||||||||||||||||||||||||||||||||||||||||||||||||||||||||||||||||||||||||||||||||||||||||||||||||||||||||||||||||||||||||
| |
| Phenotypic Information (metabolism pathway, cancer, disease, phenome) |
| |
| |
| Gene-Gene Network Information: Co-Expression Network, Interacting Genes & KEGG |
| |
|


| Gene Summary for GCLC |
| Top |
| Phenotypic Information for GCLC(metabolism pathway, cancer, disease, phenome) |
| Cancer | CGAP: GCLC |
| Familial Cancer Database: GCLC | |
| * This gene is included in those cancer gene databases. |
|
|
|
|
|
|
| |||||||||||||||||||||||||||||||||||||||||||||||||||||||||||||||||||||||||||||||||||||||||||||||||||||||||||||||||||||||||||||||||||||||||||||||||||||||||||||||||||||||||||||||||||||||||||||||||||||||||||||||||||||||||||||||||||||||||||||||||||||||||||||||||||||||||||||||||||||||||||||||||||||||||||||||||||||||||||||||||||||||||||||||||||||||||
Oncogene 1 | Significant driver gene in | ||||||||||||||||||||||||||||||||||||||||||||||||||||||||||||||||||||||||||||||||||||||||||||||||||||||||||||||||||||||||||||||||||||||||||||||||||||||||||||||||||||||||||||||||||||||||||||||||||||||||||||||||||||||||||||||||||||||||||||||||||||||||||||||||||||||||||||||||||||||||||||||||||||||||||||||||||||||||||||||||||||||||||||||||||||||||||||||
| cf) number; DB name 1 Oncogene; http://nar.oxfordjournals.org/content/35/suppl_1/D721.long, 2 Tumor Suppressor gene; https://bioinfo.uth.edu/TSGene/, 3 Cancer Gene Census; http://www.nature.com/nrc/journal/v4/n3/abs/nrc1299.html, 4 CancerGenes; http://nar.oxfordjournals.org/content/35/suppl_1/D721.long, 5 Network of Cancer Gene; http://ncg.kcl.ac.uk/index.php, 1Therapeutic Vulnerabilities in Cancer; http://cbio.mskcc.org/cancergenomics/statius/ |
| KEGG_GLUTATHIONE_METABOLISM REACTOME_SULFUR_AMINO_ACID_METABOLISM REACTOME_METABOLISM_OF_AMINO_ACIDS_AND_DERIVATIVES | |
| OMIM | |
| Orphanet | |
| Disease | KEGG Disease: GCLC |
| MedGen: GCLC (Human Medical Genetics with Condition) | |
| ClinVar: GCLC | |
| Phenotype | MGI: GCLC (International Mouse Phenotyping Consortium) |
| PhenomicDB: GCLC | |
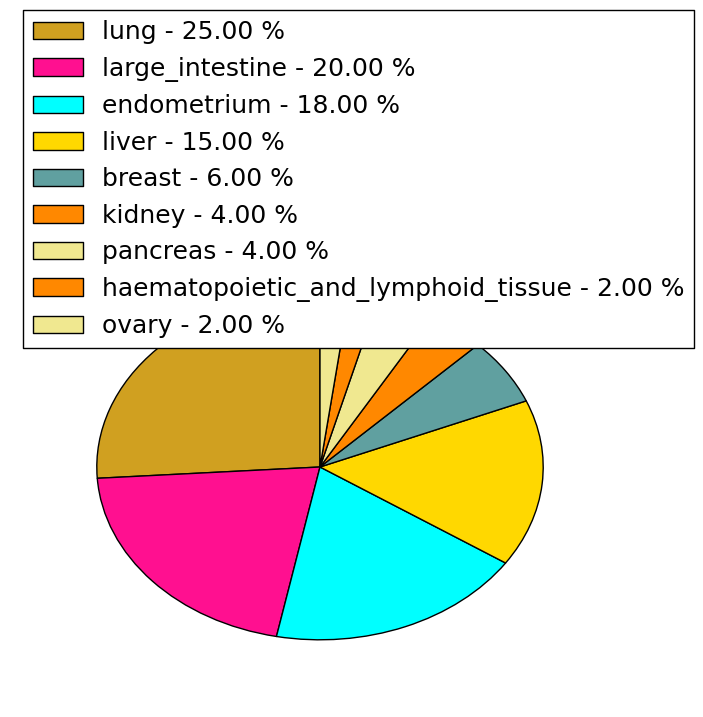
| Mutations for GCLC |
| * Under tables are showing count per each tissue to give us broad intuition about tissue specific mutation patterns.You can go to the detailed page for each mutation database's web site. |
| - Statistics for Tissue and Mutation type | Top |
 |
| - For Inter-chromosomal Variations |
| There's no inter-chromosomal structural variation. |
| - For Intra-chromosomal Variations |
| * Intra-chromosomal variantions includes 'intrachromosomal amplicon to amplicon', 'intrachromosomal amplicon to non-amplified dna', 'intrachromosomal deletion', 'intrachromosomal fold-back inversion', 'intrachromosomal inversion', 'intrachromosomal tandem duplication', 'Intrachromosomal unknown type', 'intrachromosomal with inverted orientation', 'intrachromosomal with non-inverted orientation'. |
 |
| Sample | Symbol_a | Chr_a | Start_a | End_a | Symbol_b | Chr_b | Start_b | End_b |
| ovary | GCLC | chr6 | 53365935 | 53365955 | chr6 | 53347178 | 53347198 | |
| ovary | GCLC | chr6 | 53374139 | 53374159 | chr6 | 53349214 | 53349234 |
| cf) Tissue number; Tissue name (1;Breast, 2;Central_nervous_system, 3;Haematopoietic_and_lymphoid_tissue, 4;Large_intestine, 5;Liver, 6;Lung, 7;Ovary, 8;Pancreas, 9;Prostate, 10;Skin, 11;Soft_tissue, 12;Upper_aerodigestive_tract) |
| * From mRNA Sanger sequences, Chitars2.0 arranged chimeric transcripts. This table shows GCLC related fusion information. |
| ID | Head Gene | Tail Gene | Accession | Gene_a | qStart_a | qEnd_a | Chromosome_a | tStart_a | tEnd_a | Gene_a | qStart_a | qEnd_a | Chromosome_a | tStart_a | tEnd_a |
| AA010005 | ATP11B | 1 | 141 | 3 | 182639276 | 182639415 | GCLC | 137 | 214 | 6 | 53363169 | 53363246 | |
| DB542246 | GCLC | 1 | 152 | 6 | 53374761 | 53374912 | PDSS1 | 151 | 481 | 10 | 27034195 | 27034523 | |
| Top |
| Mutation type/ Tissue ID | brca | cns | cerv | endome | haematopo | kidn | Lintest | liver | lung | ns | ovary | pancre | prost | skin | stoma | thyro | urina | |||
| Total # sample | 2 | 1 | ||||||||||||||||||
| GAIN (# sample) | 2 | |||||||||||||||||||
| LOSS (# sample) | 1 |
| cf) Tissue ID; Tissue type (1; Breast, 2; Central_nervous_system, 3; Cervix, 4; Endometrium, 5; Haematopoietic_and_lymphoid_tissue, 6; Kidney, 7; Large_intestine, 8; Liver, 9; Lung, 10; NS, 11; Ovary, 12; Pancreas, 13; Prostate, 14; Skin, 15; Stomach, 16; Thyroid, 17; Urinary_tract) |
| Top |
|
 |
| Top |
| Stat. for Non-Synonymous SNVs (# total SNVs=44) | (# total SNVs=13) |
 |  |
(# total SNVs=0) | (# total SNVs=0) |
| Top |
| * When you move the cursor on each content, you can see more deailed mutation information on the Tooltip. Those are primary_site,primary_histology,mutation(aa),pubmedID. |
| GRCh37 position | Mutation(aa) | Unique sampleID count |
| chr6:53379056-53379056 | p.P233P | 3 |
| chr6:53385601-53385601 | p.L141V | 3 |
| chr6:53379057-53379057 | p.P233L | 2 |
| chr6:53371755-53371755 | p.E385K | 2 |
| chr6:53365257-53365257 | p.F484L | 2 |
| chr6:53365299-53365299 | p.M470V | 2 |
| chr6:53363579-53363579 | p.G630E | 2 |
| chr6:53365093-53365093 | p.A511A | 1 |
| chr6:53370601-53370601 | p.E430D | 1 |
| chr6:53385580-53385580 | p.P148S | 1 |
| Top |
|
 |
| Point Mutation/ Tissue ID | 1 | 2 | 3 | 4 | 5 | 6 | 7 | 8 | 9 | 10 | 11 | 12 | 13 | 14 | 15 | 16 | 17 | 18 | 19 | 20 |
| # sample | 1 | 2 | 9 | 1 | 1 | 1 | 13 | 2 | 1 | 9 | 4 | 6 | ||||||||
| # mutation | 1 | 2 | 9 | 1 | 1 | 1 | 14 | 2 | 1 | 9 | 4 | 9 | ||||||||
| nonsynonymous SNV | 1 | 2 | 7 | 12 | 2 | 5 | 1 | 7 | ||||||||||||
| synonymous SNV | 2 | 1 | 1 | 1 | 2 | 1 | 4 | 3 | 2 |
| cf) Tissue ID; Tissue type (1; BLCA[Bladder Urothelial Carcinoma], 2; BRCA[Breast invasive carcinoma], 3; CESC[Cervical squamous cell carcinoma and endocervical adenocarcinoma], 4; COAD[Colon adenocarcinoma], 5; GBM[Glioblastoma multiforme], 6; Glioma Low Grade, 7; HNSC[Head and Neck squamous cell carcinoma], 8; KICH[Kidney Chromophobe], 9; KIRC[Kidney renal clear cell carcinoma], 10; KIRP[Kidney renal papillary cell carcinoma], 11; LAML[Acute Myeloid Leukemia], 12; LUAD[Lung adenocarcinoma], 13; LUSC[Lung squamous cell carcinoma], 14; OV[Ovarian serous cystadenocarcinoma ], 15; PAAD[Pancreatic adenocarcinoma], 16; PRAD[Prostate adenocarcinoma], 17; SKCM[Skin Cutaneous Melanoma], 18:STAD[Stomach adenocarcinoma], 19:THCA[Thyroid carcinoma], 20:UCEC[Uterine Corpus Endometrial Carcinoma]) |
| Top |
| * We represented just top 10 SNVs. When you move the cursor on each content, you can see more deailed mutation information on the Tooltip. Those are primary_site, primary_histology, mutation(aa), pubmedID. |
| Genomic Position | Mutation(aa) | Unique sampleID count |
| chr6:53379056 | p.P195P,GCLC | 3 |
| chr6:53373486 | p.F446L,GCLC | 2 |
| chr6:53365257 | p.P246P,GCLC | 2 |
| chr6:53379057 | p.P195Q,GCLC | 2 |
| chr6:53370685 | p.R269R,GCLC | 1 |
| chr6:53387280 | p.A140A,GCLC | 1 |
| chr6:53364951 | p.L415L,GCLC | 1 |
| chr6:53380938 | p.S265Y,GCLC | 1 |
| chr6:53371823 | p.L135L,GCLC | 1 |
| chr6:53387311 | p.T411I,GCLC | 1 |
| * Copy number data were extracted from TCGA using R package TCGA-Assembler. The URLs of all public data files on TCGA DCC data server were gathered on Jan-05-2015. Function ProcessCNAData in TCGA-Assembler package was used to obtain gene-level copy number value which is calculated as the average copy number of the genomic region of a gene. |
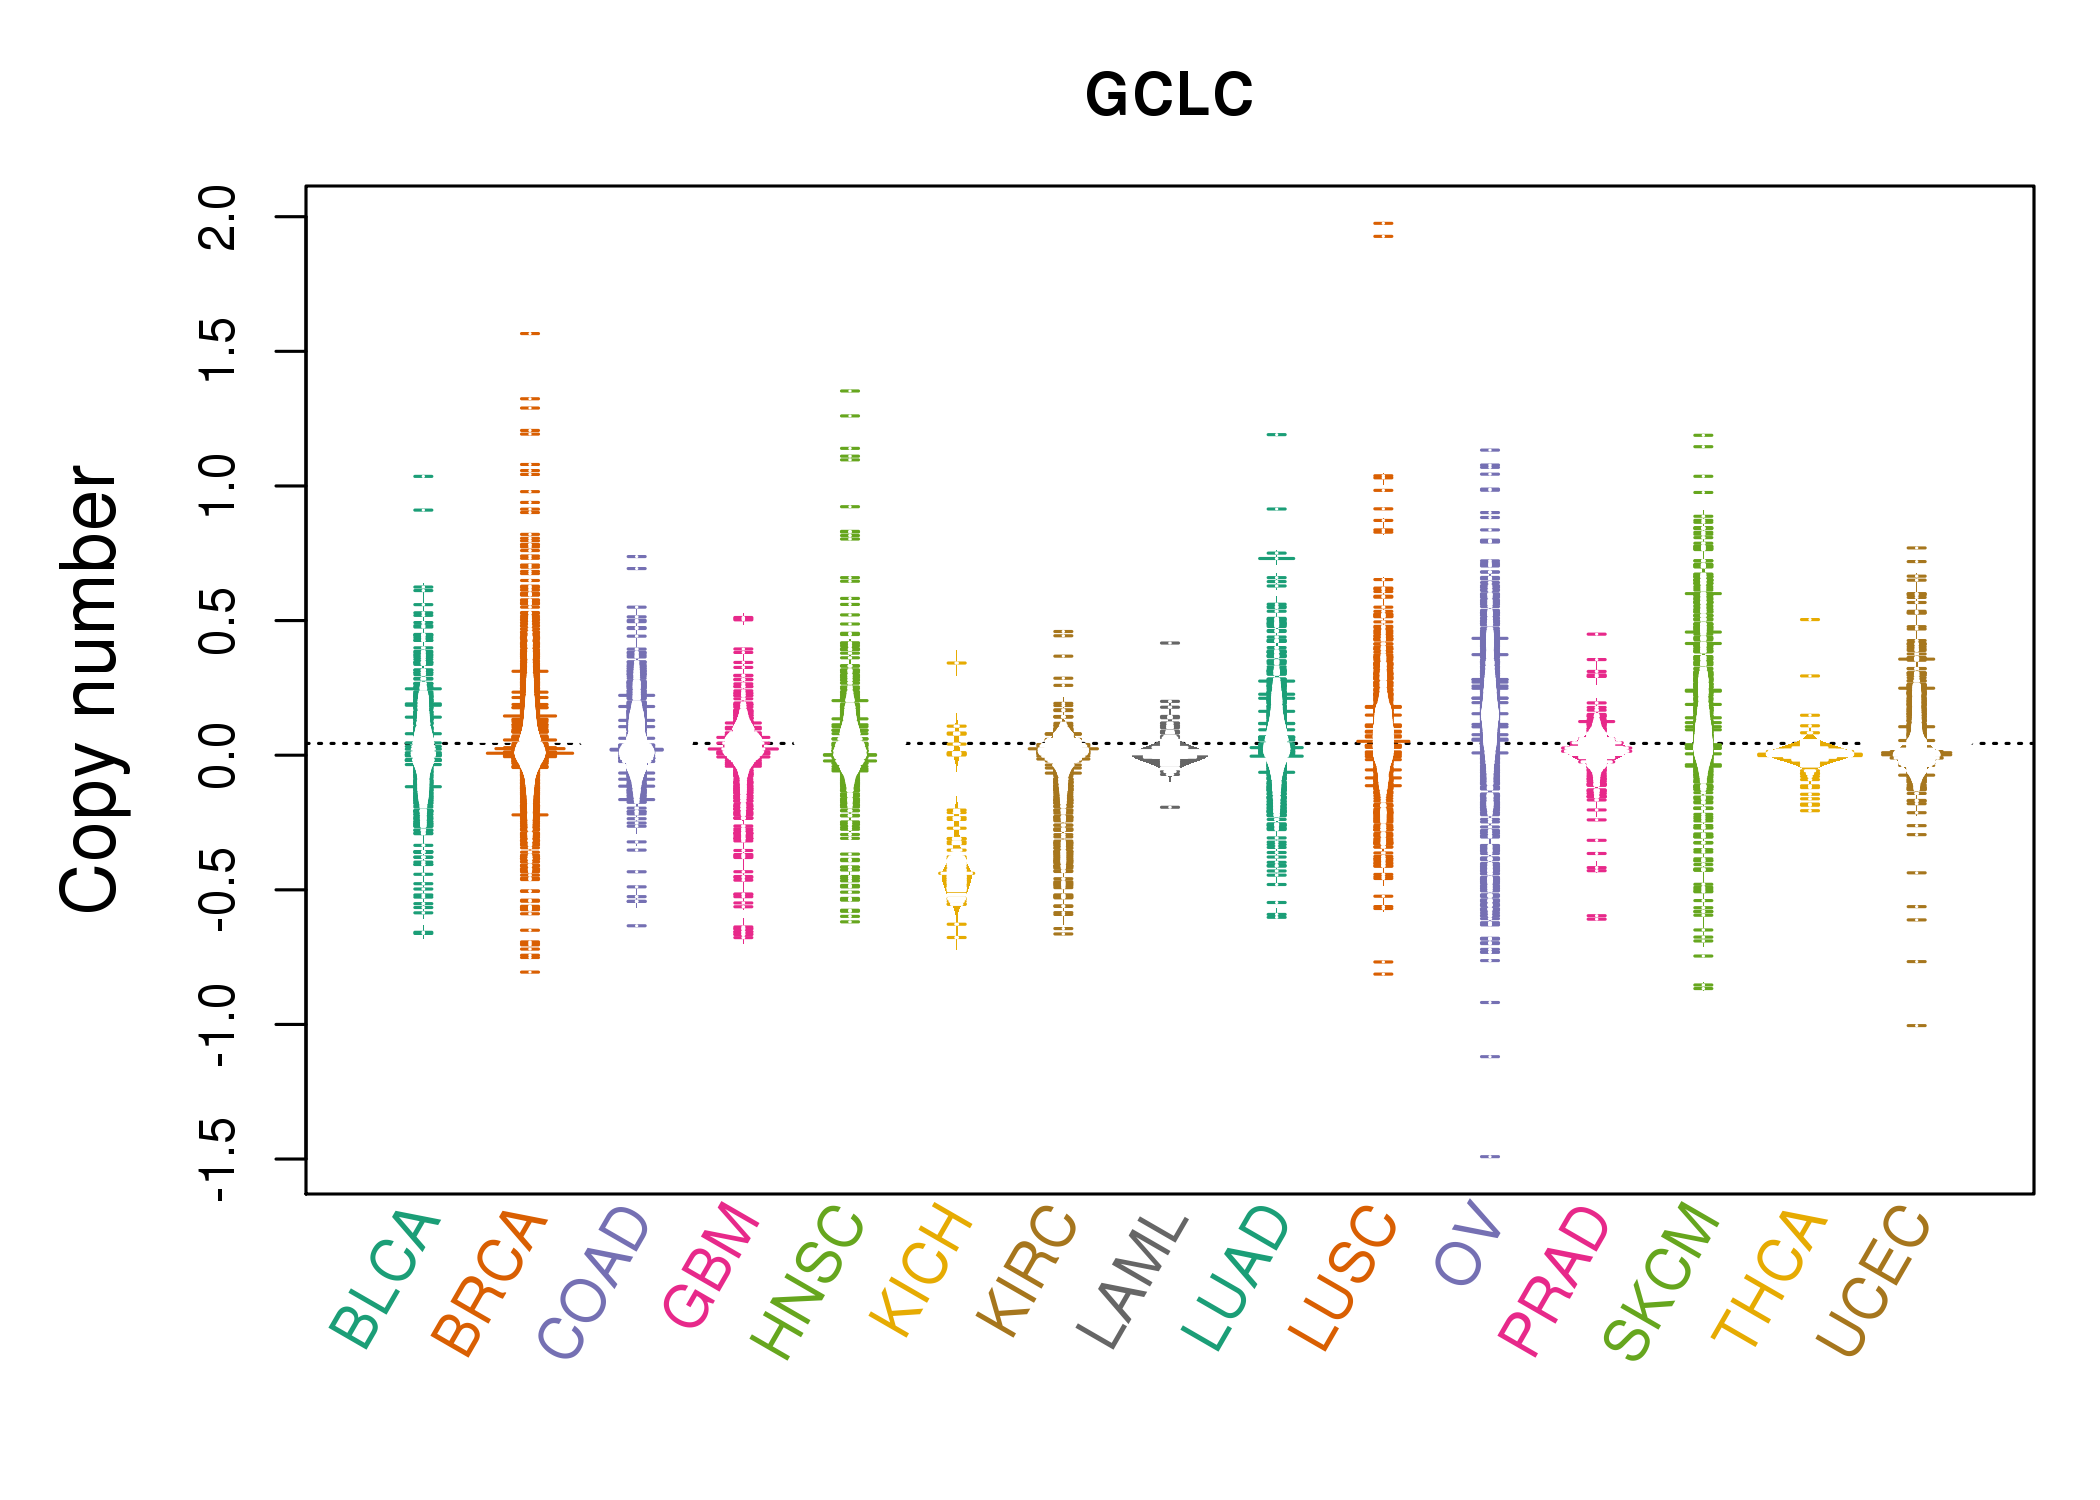 |
| cf) Tissue ID[Tissue type]: BLCA[Bladder Urothelial Carcinoma], BRCA[Breast invasive carcinoma], CESC[Cervical squamous cell carcinoma and endocervical adenocarcinoma], COAD[Colon adenocarcinoma], GBM[Glioblastoma multiforme], Glioma Low Grade, HNSC[Head and Neck squamous cell carcinoma], KICH[Kidney Chromophobe], KIRC[Kidney renal clear cell carcinoma], KIRP[Kidney renal papillary cell carcinoma], LAML[Acute Myeloid Leukemia], LUAD[Lung adenocarcinoma], LUSC[Lung squamous cell carcinoma], OV[Ovarian serous cystadenocarcinoma ], PAAD[Pancreatic adenocarcinoma], PRAD[Prostate adenocarcinoma], SKCM[Skin Cutaneous Melanoma], STAD[Stomach adenocarcinoma], THCA[Thyroid carcinoma], UCEC[Uterine Corpus Endometrial Carcinoma] |
| Top |
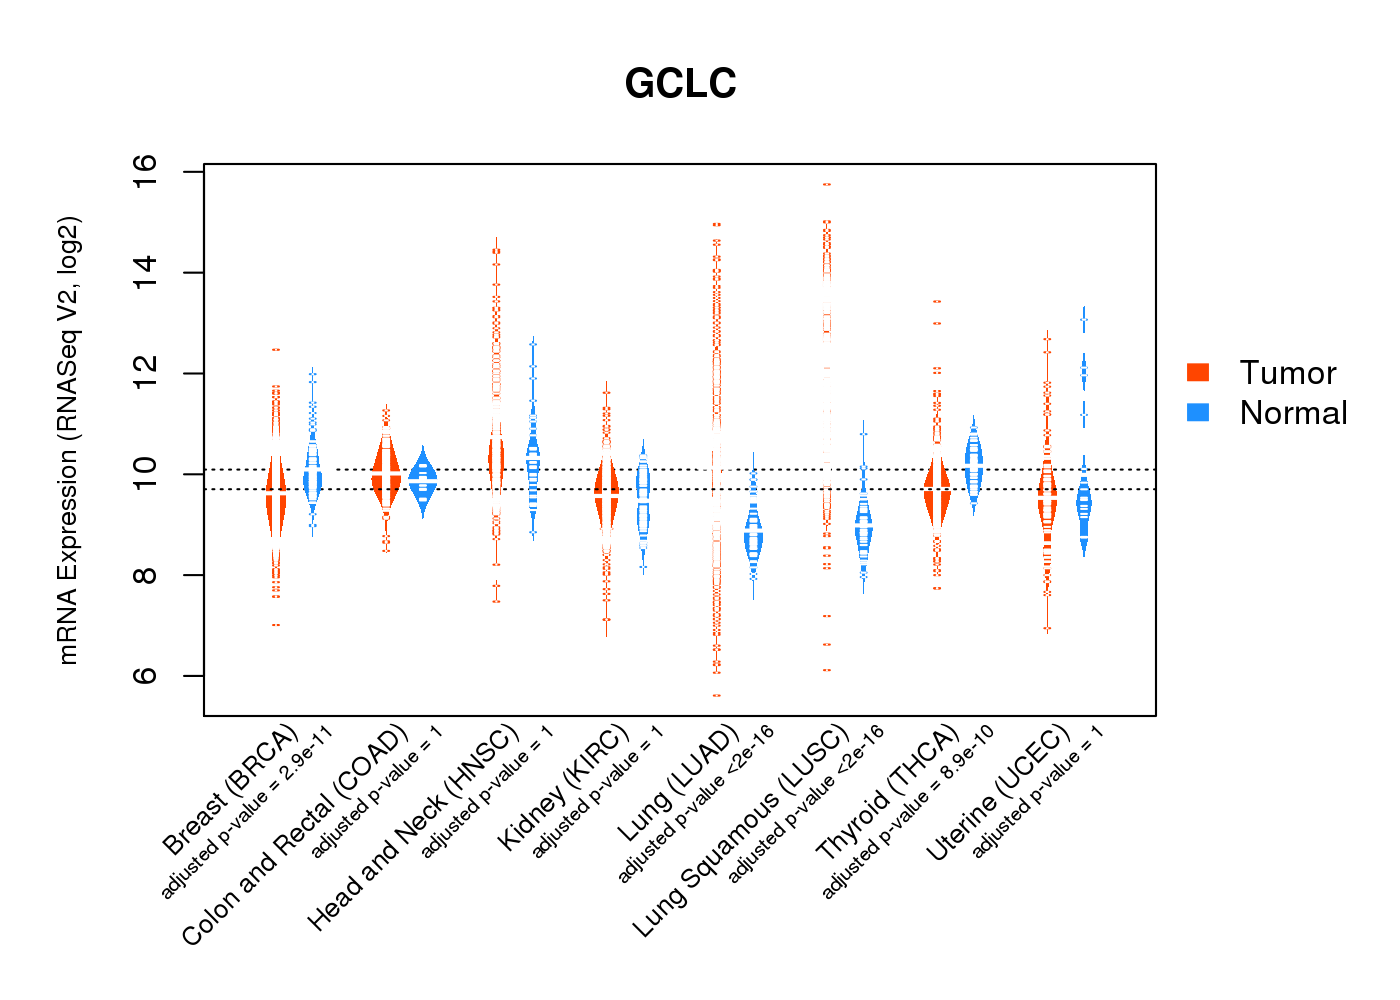
| Gene Expression for GCLC |
| * CCLE gene expression data were extracted from CCLE_Expression_Entrez_2012-10-18.res: Gene-centric RMA-normalized mRNA expression data. |
 |
| * Normalized gene expression data of RNASeqV2 was extracted from TCGA using R package TCGA-Assembler. The URLs of all public data files on TCGA DCC data server were gathered at Jan-05-2015. Only eight cancer types have enough normal control samples for differential expression analysis. (t test, adjusted p<0.05 (using Benjamini-Hochberg FDR)) |
 |
| Top |
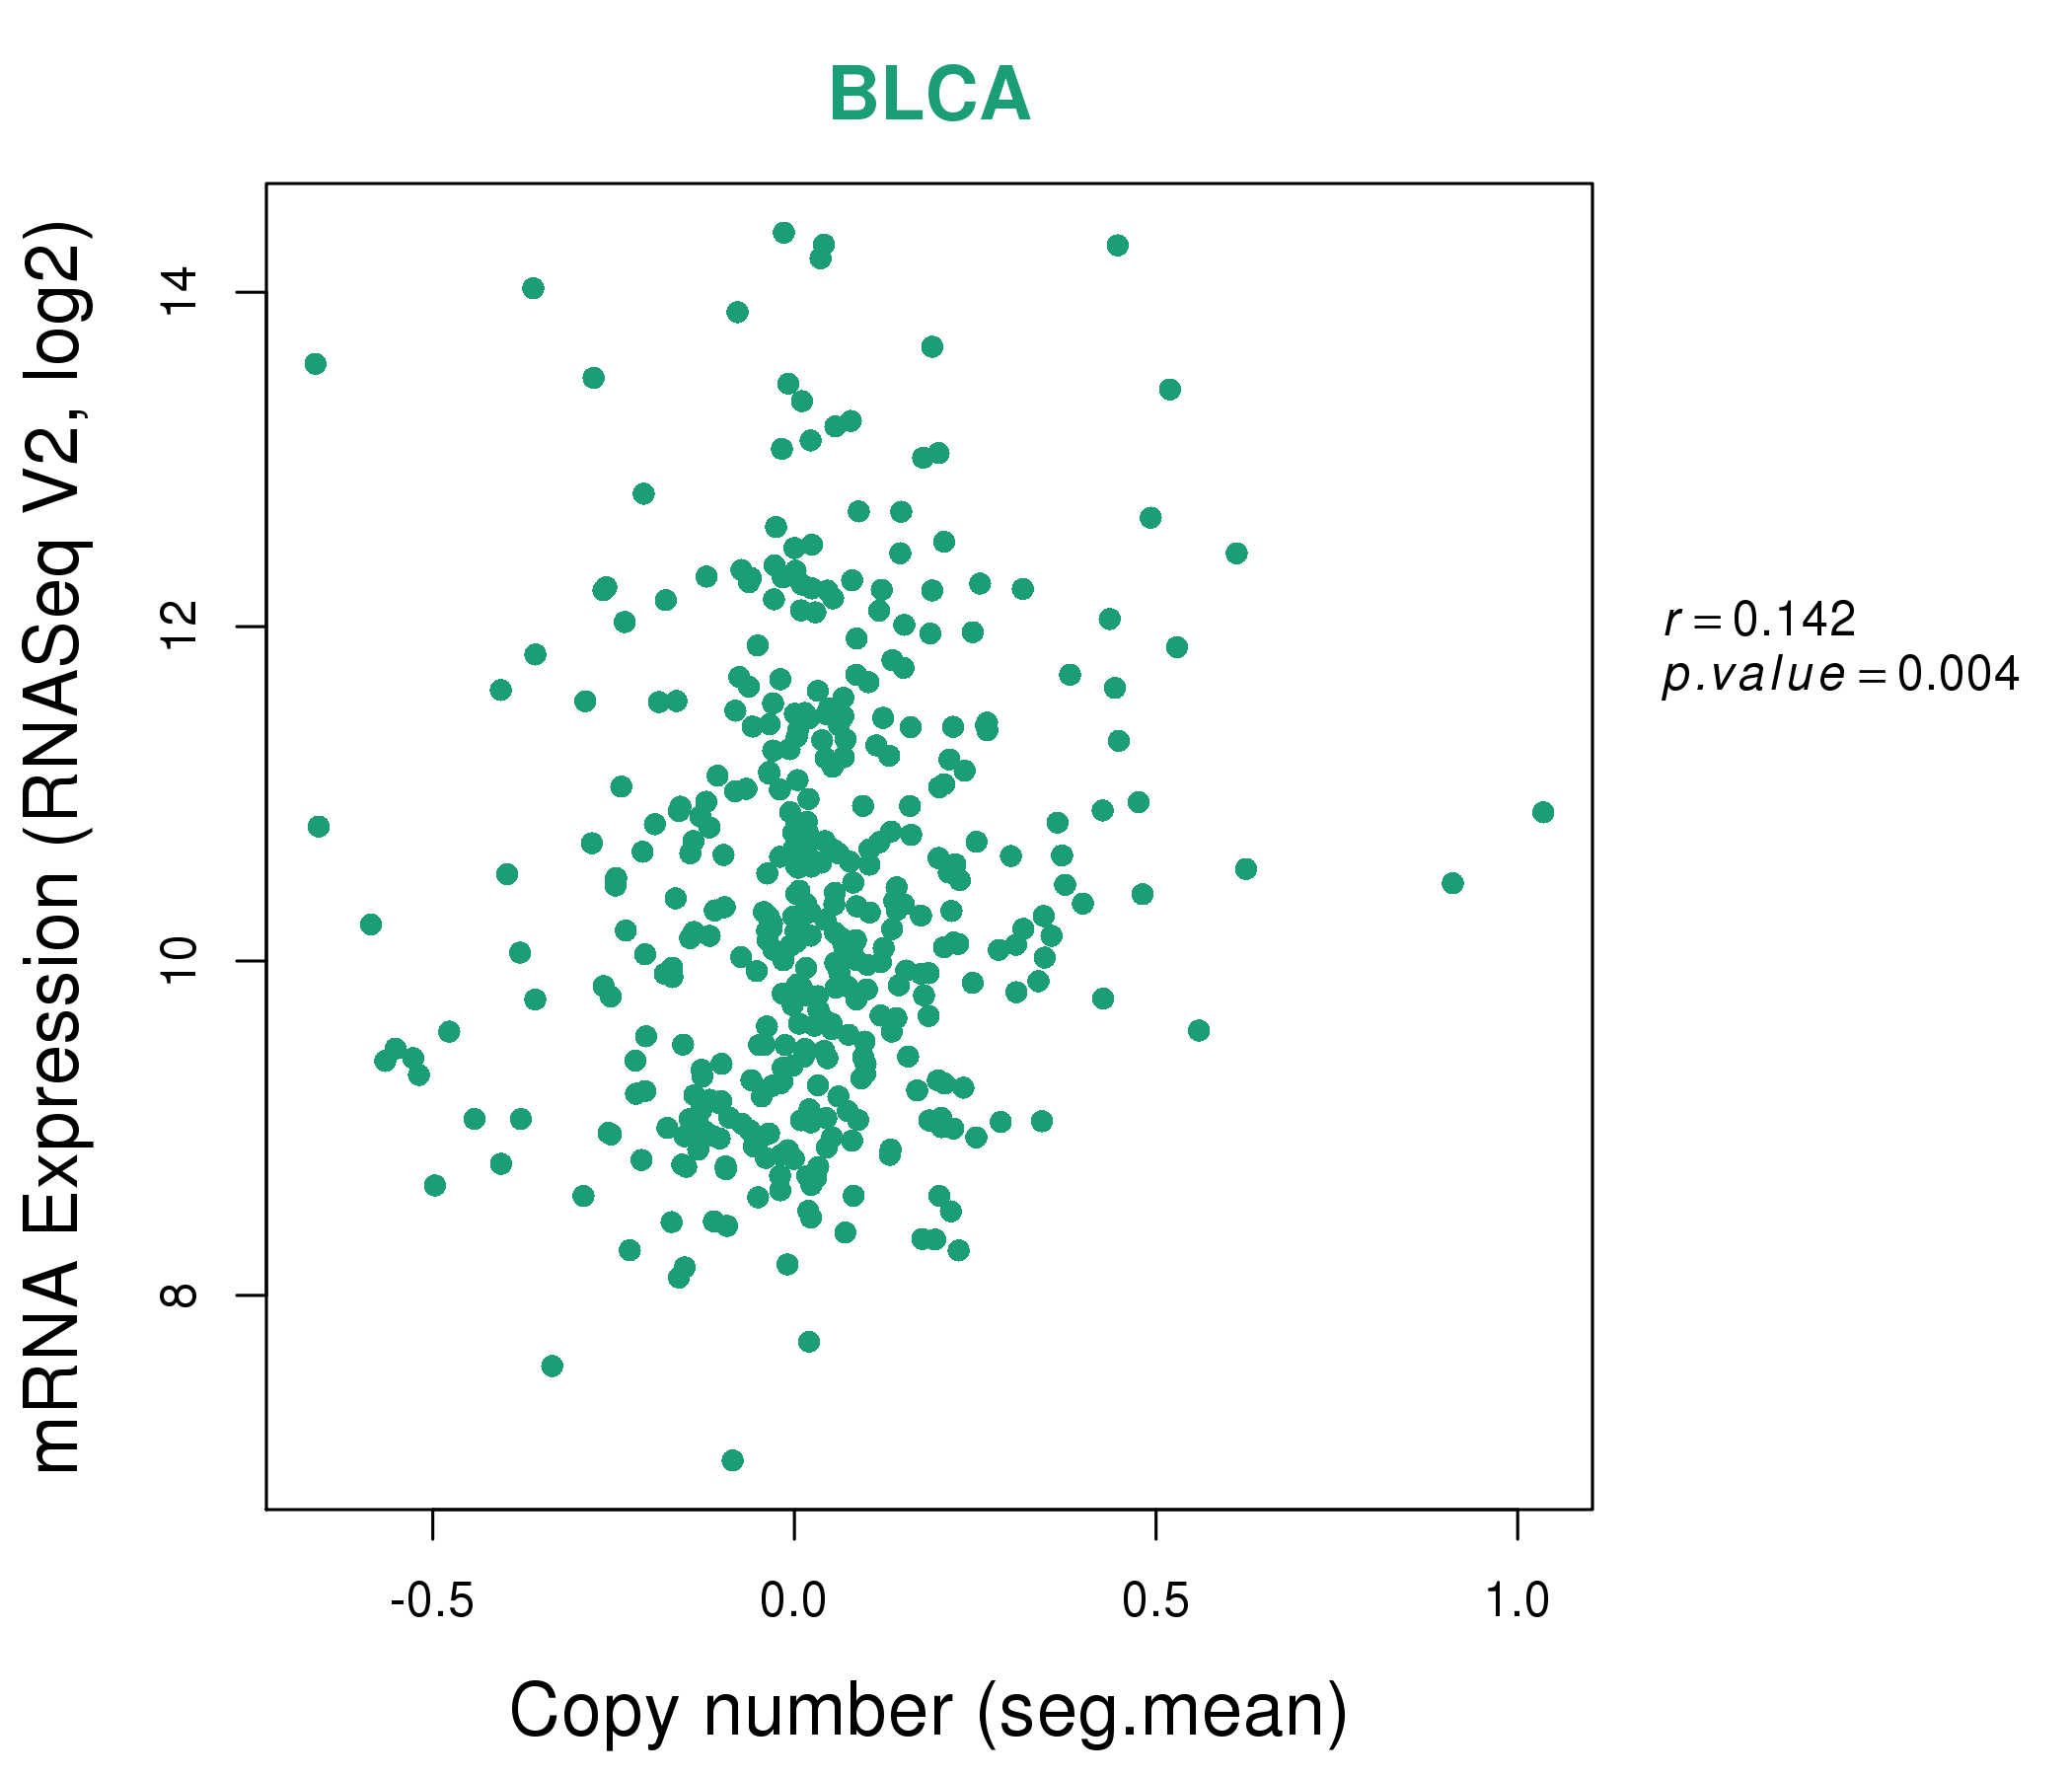
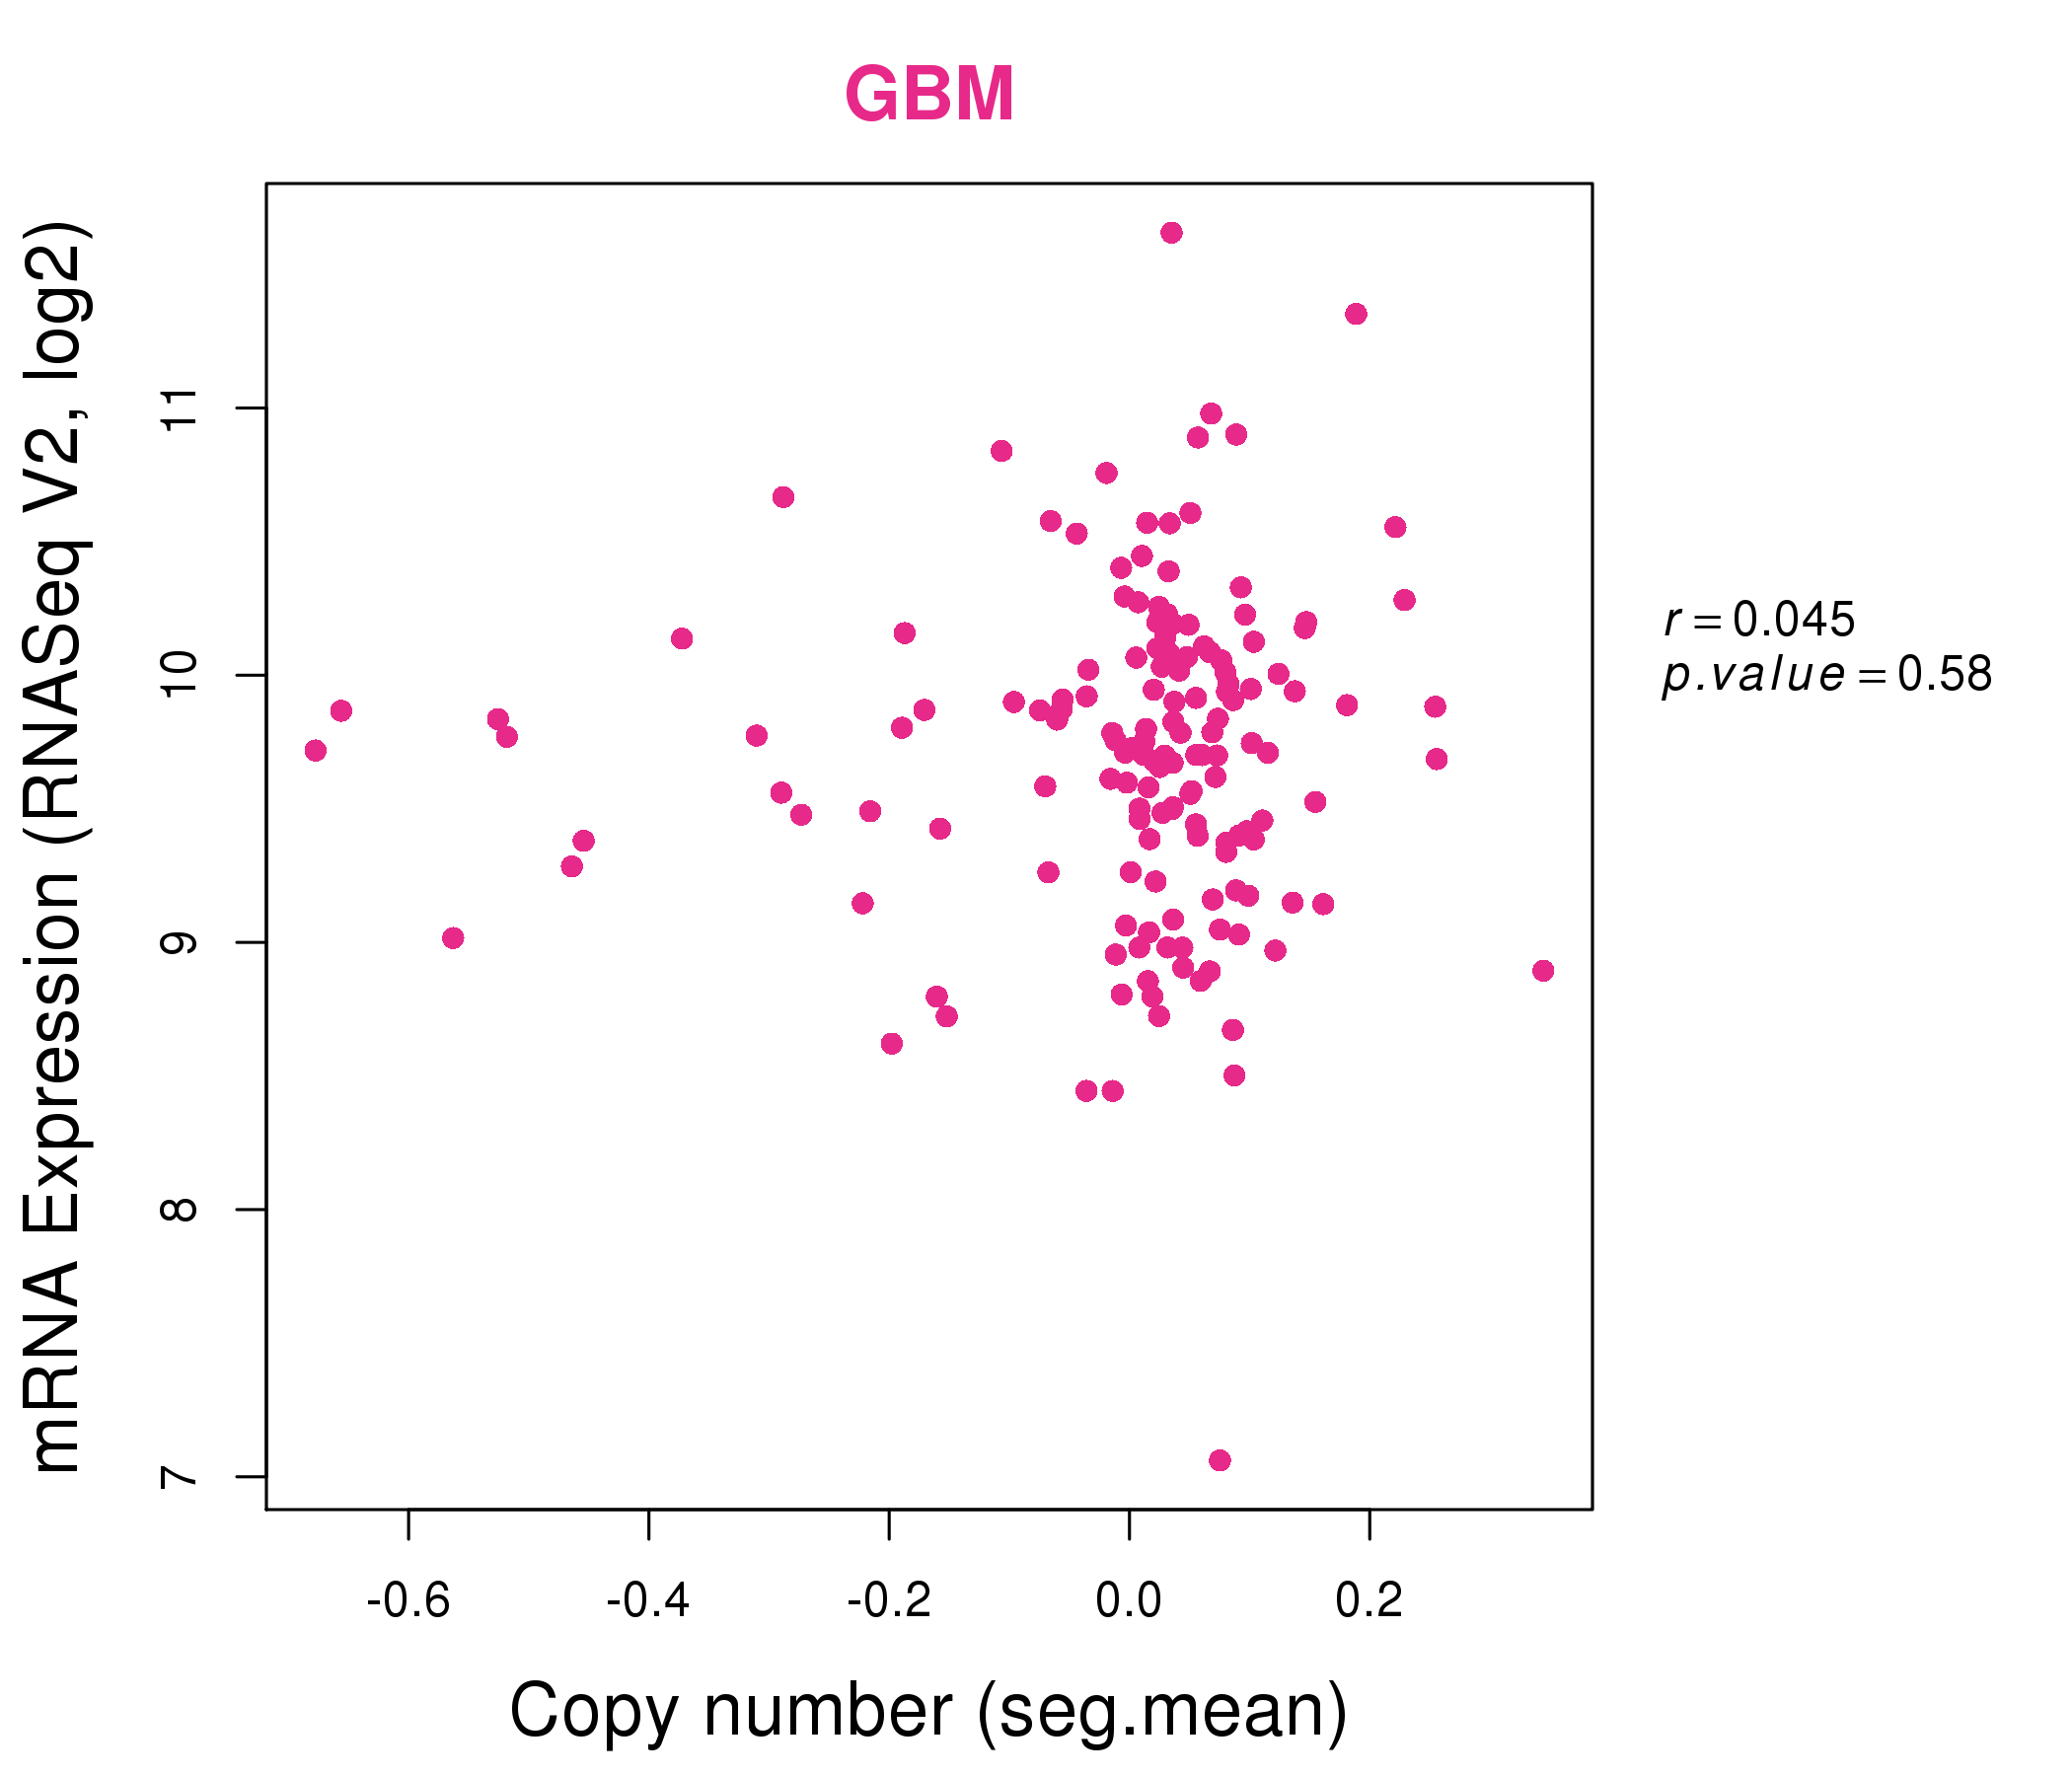
| * This plots show the correlation between CNV and gene expression. |
: Open all plots for all cancer types
 |
|
 |
|

| Top |
| Gene-Gene Network Information |
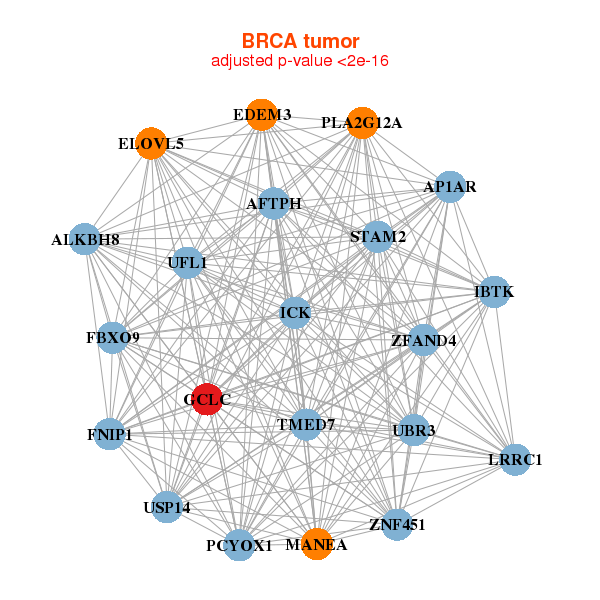
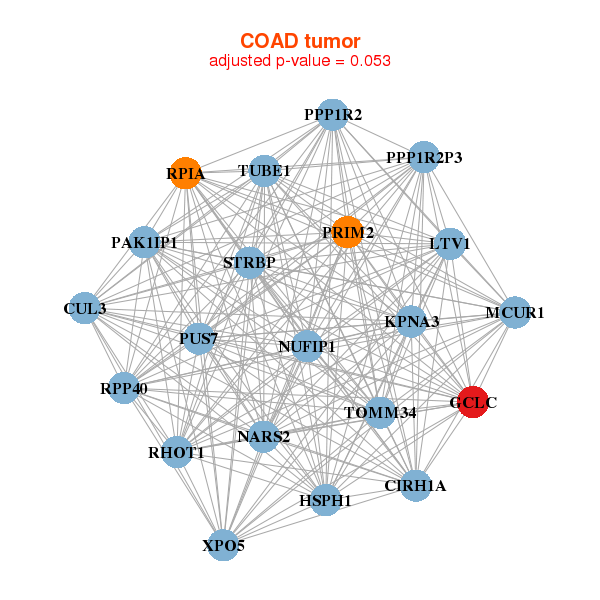
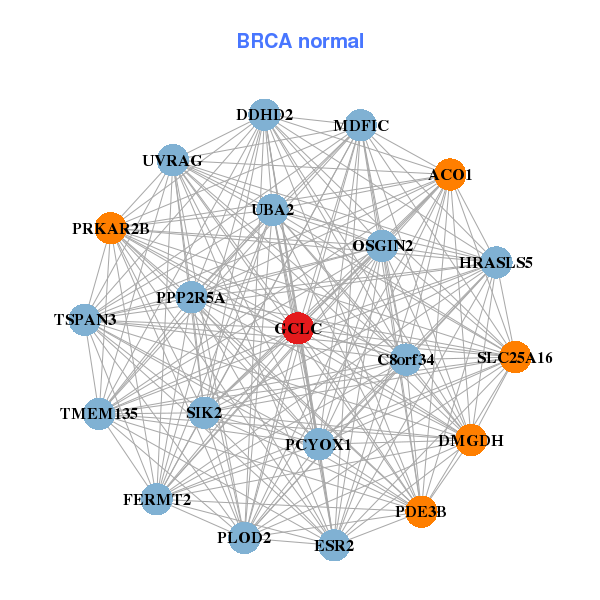
| * Co-Expression network figures were drawn using R package igraph. Only the top 20 genes with the highest correlations were shown. Red circle: input gene, orange circle: cell metabolism gene, sky circle: other gene |
: Open all plots for all cancer types
 |
| ||||
| AFTPH,ALKBH8,ZFAND4,AP1AR,EDEM3,ELOVL5,FBXO9, FNIP1,GCLC,IBTK,ICK,UFL1,LRRC1,MANEA, PCYOX1,PLA2G12A,STAM2,TMED7,UBR3,USP14,ZNF451 | ACO1,C8orf34,DDHD2,DMGDH,ESR2,FERMT2,GCLC, HRASLS5,MDFIC,OSGIN2,PCYOX1,PDE3B,PLOD2,PPP2R5A, PRKAR2B,SIK2,SLC25A16,TMEM135,TSPAN3,UBA2,UVRAG | ||||
 |
| ||||
| MCUR1,CIRH1A,CUL3,GCLC,HSPH1,KPNA3,LTV1, NARS2,NUFIP1,PAK1IP1,PPP1R2,PPP1R2P3,PRIM2,PUS7, RHOT1,RPIA,RPP40,STRBP,TOMM34,TUBE1,XPO5 | ALOX15,CREBRF,CAPN7,CDK20,CENPC,CXorf57,DLEU7, FNDC7,GCLC,GSG1L,RIC1,KLHL24,MYLK3,PAPD5, PIK3R1,PRTN3,RB1CC1,SENP6,SMAD4,ZNF518B,ZNF549 |
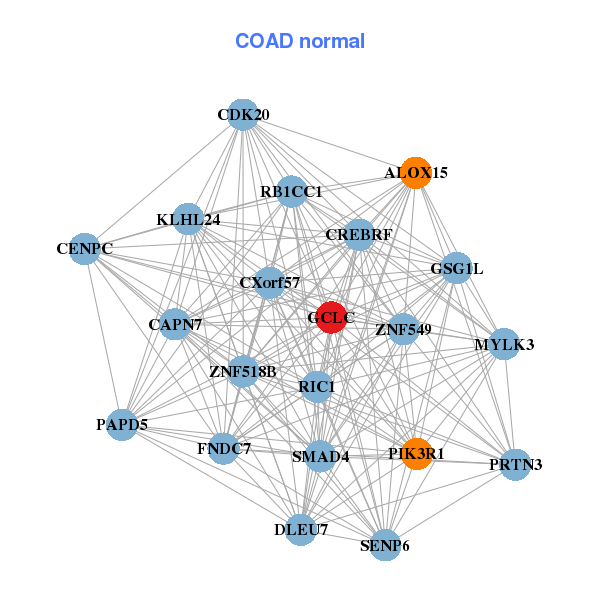
| * Co-Expression network figures were drawn using R package igraph. Only the top 20 genes with the highest correlations were shown. Red circle: input gene, orange circle: cell metabolism gene, sky circle: other gene |
: Open all plots for all cancer types
| Top |
: Open all interacting genes' information including KEGG pathway for all interacting genes from DAVID
| Top |
| Pharmacological Information for GCLC |
| DB Category | DB Name | DB's ID and Url link |
| * Gene Centered Interaction Network. |
 |
| * Drug Centered Interaction Network. |
| DrugBank ID | Target Name | Drug Groups | Generic Name | Drug Centered Network | Drug Structure |
| DB00142 | glutamate-cysteine ligase, catalytic subunit | approved; nutraceutical | L-Glutamic Acid | 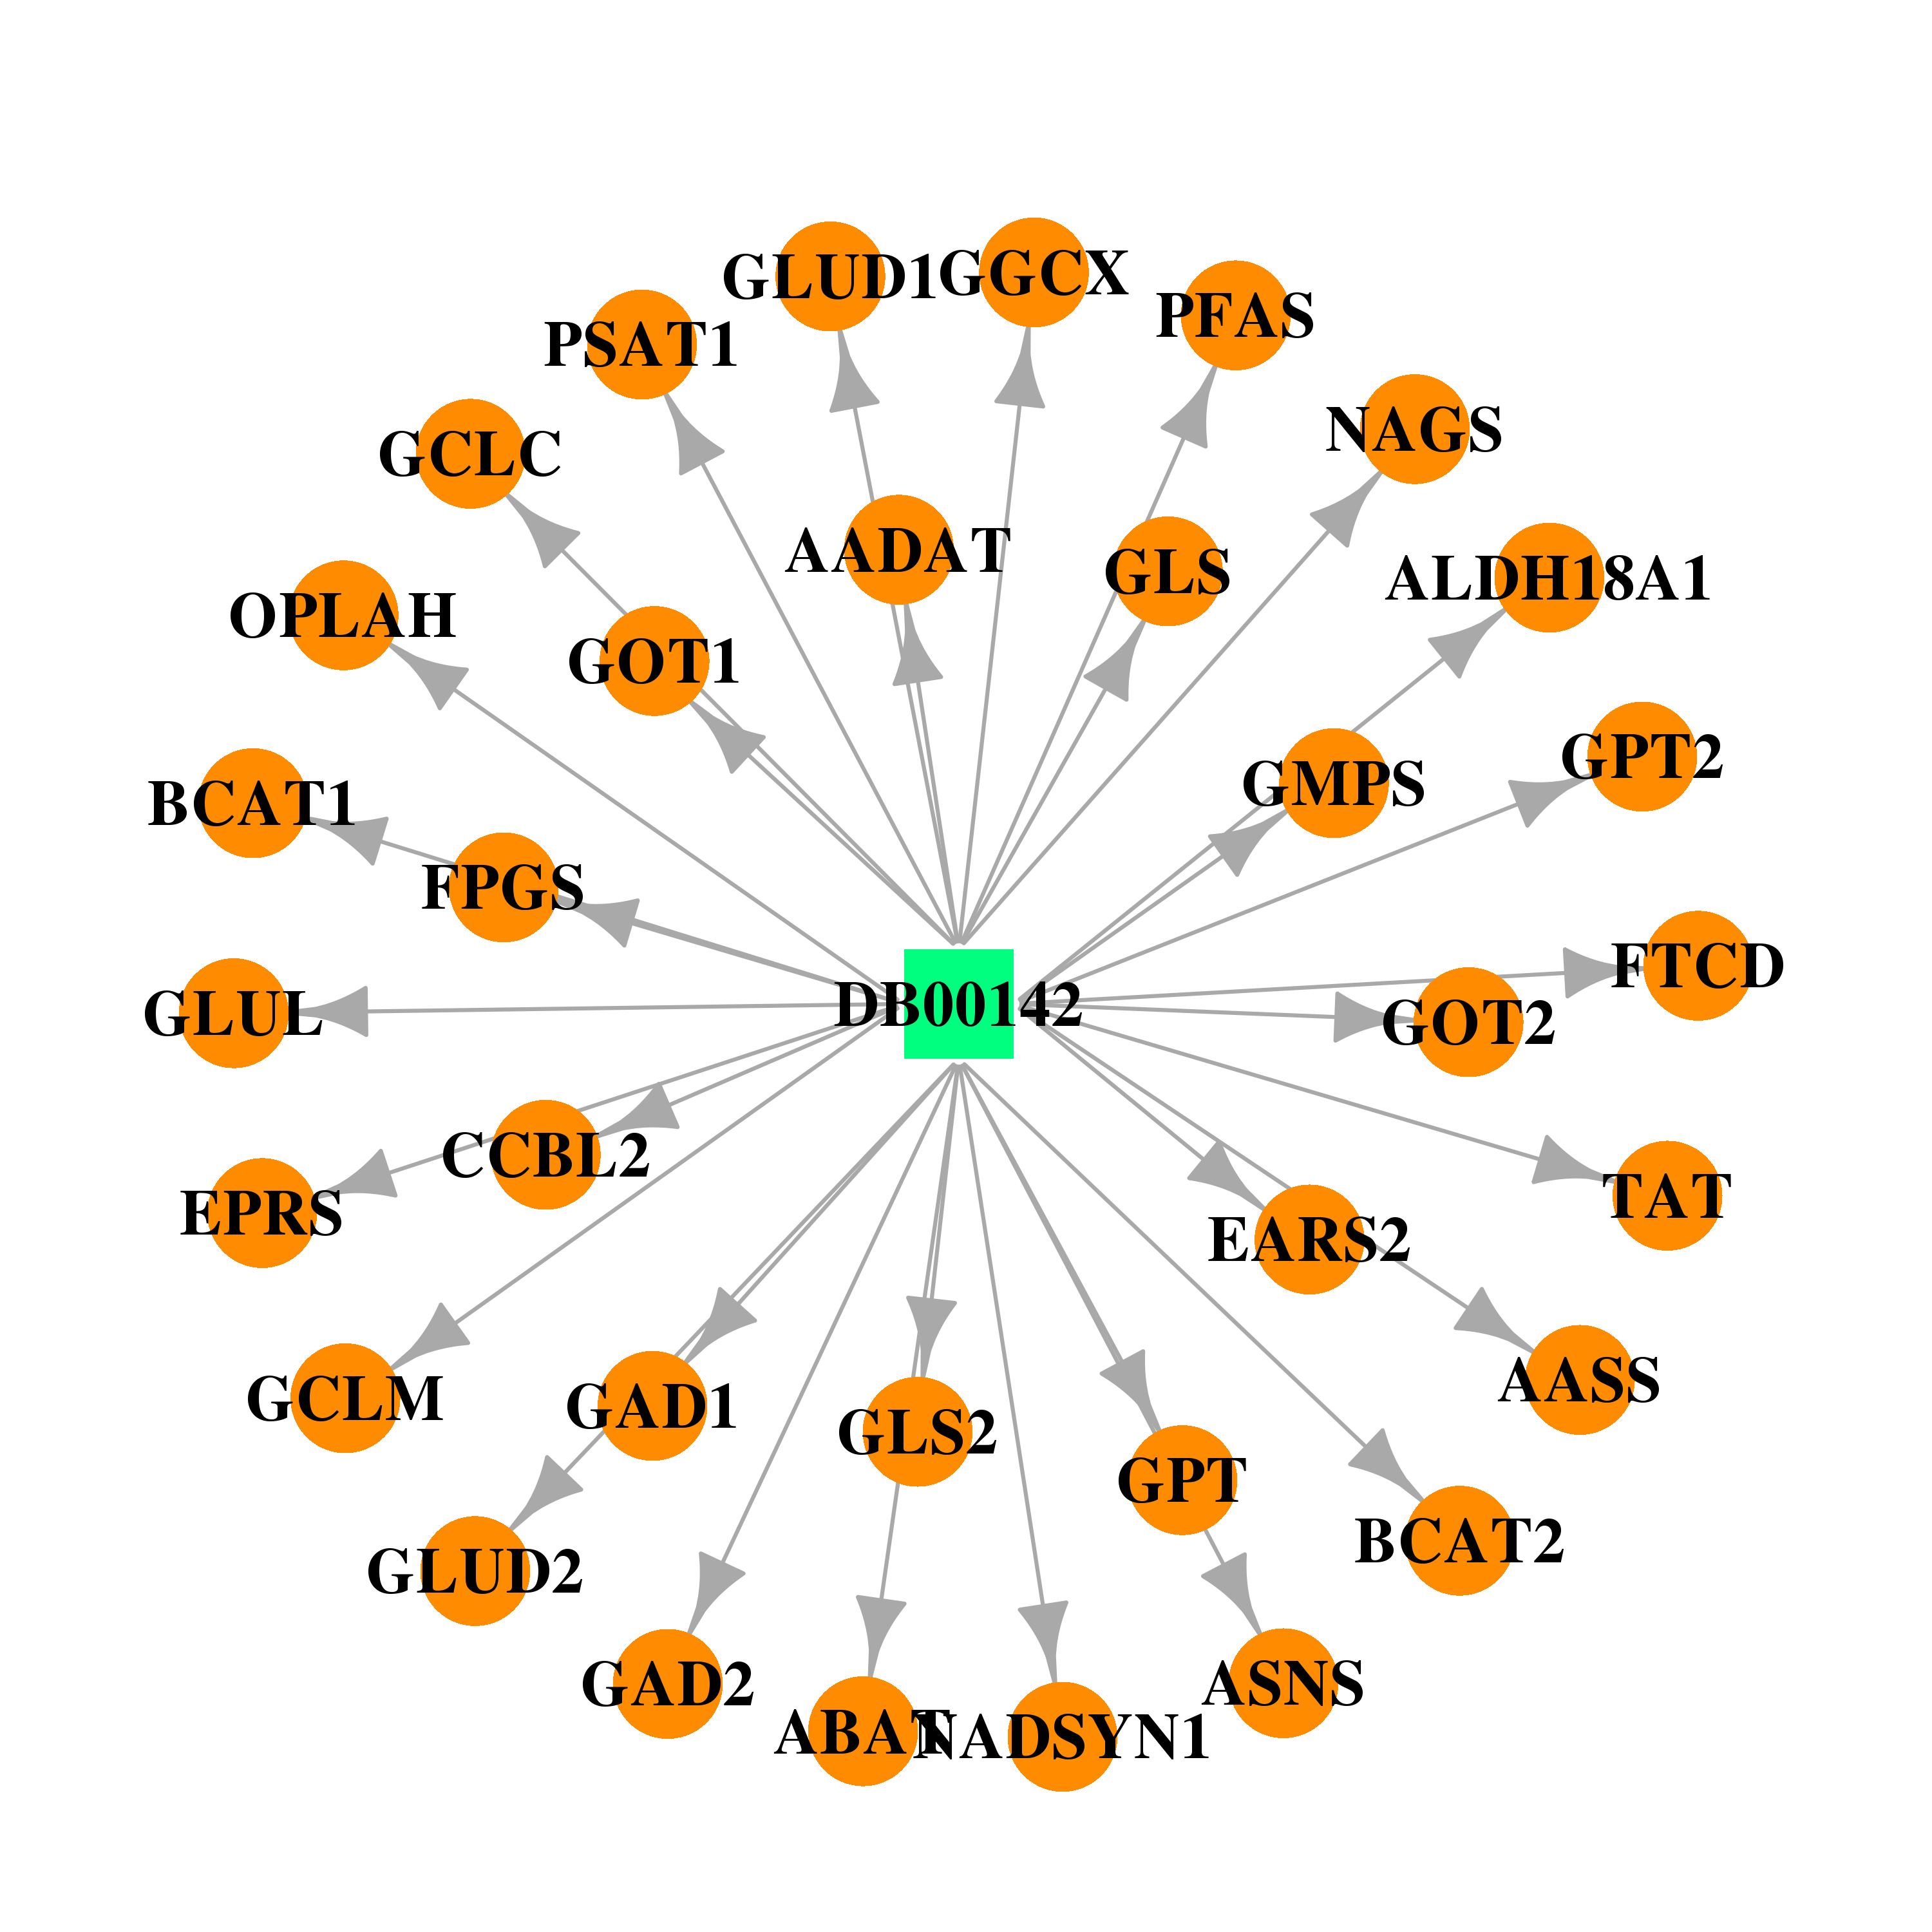 |  |
| DB00151 | glutamate-cysteine ligase, catalytic subunit | approved; nutraceutical | L-Cysteine | 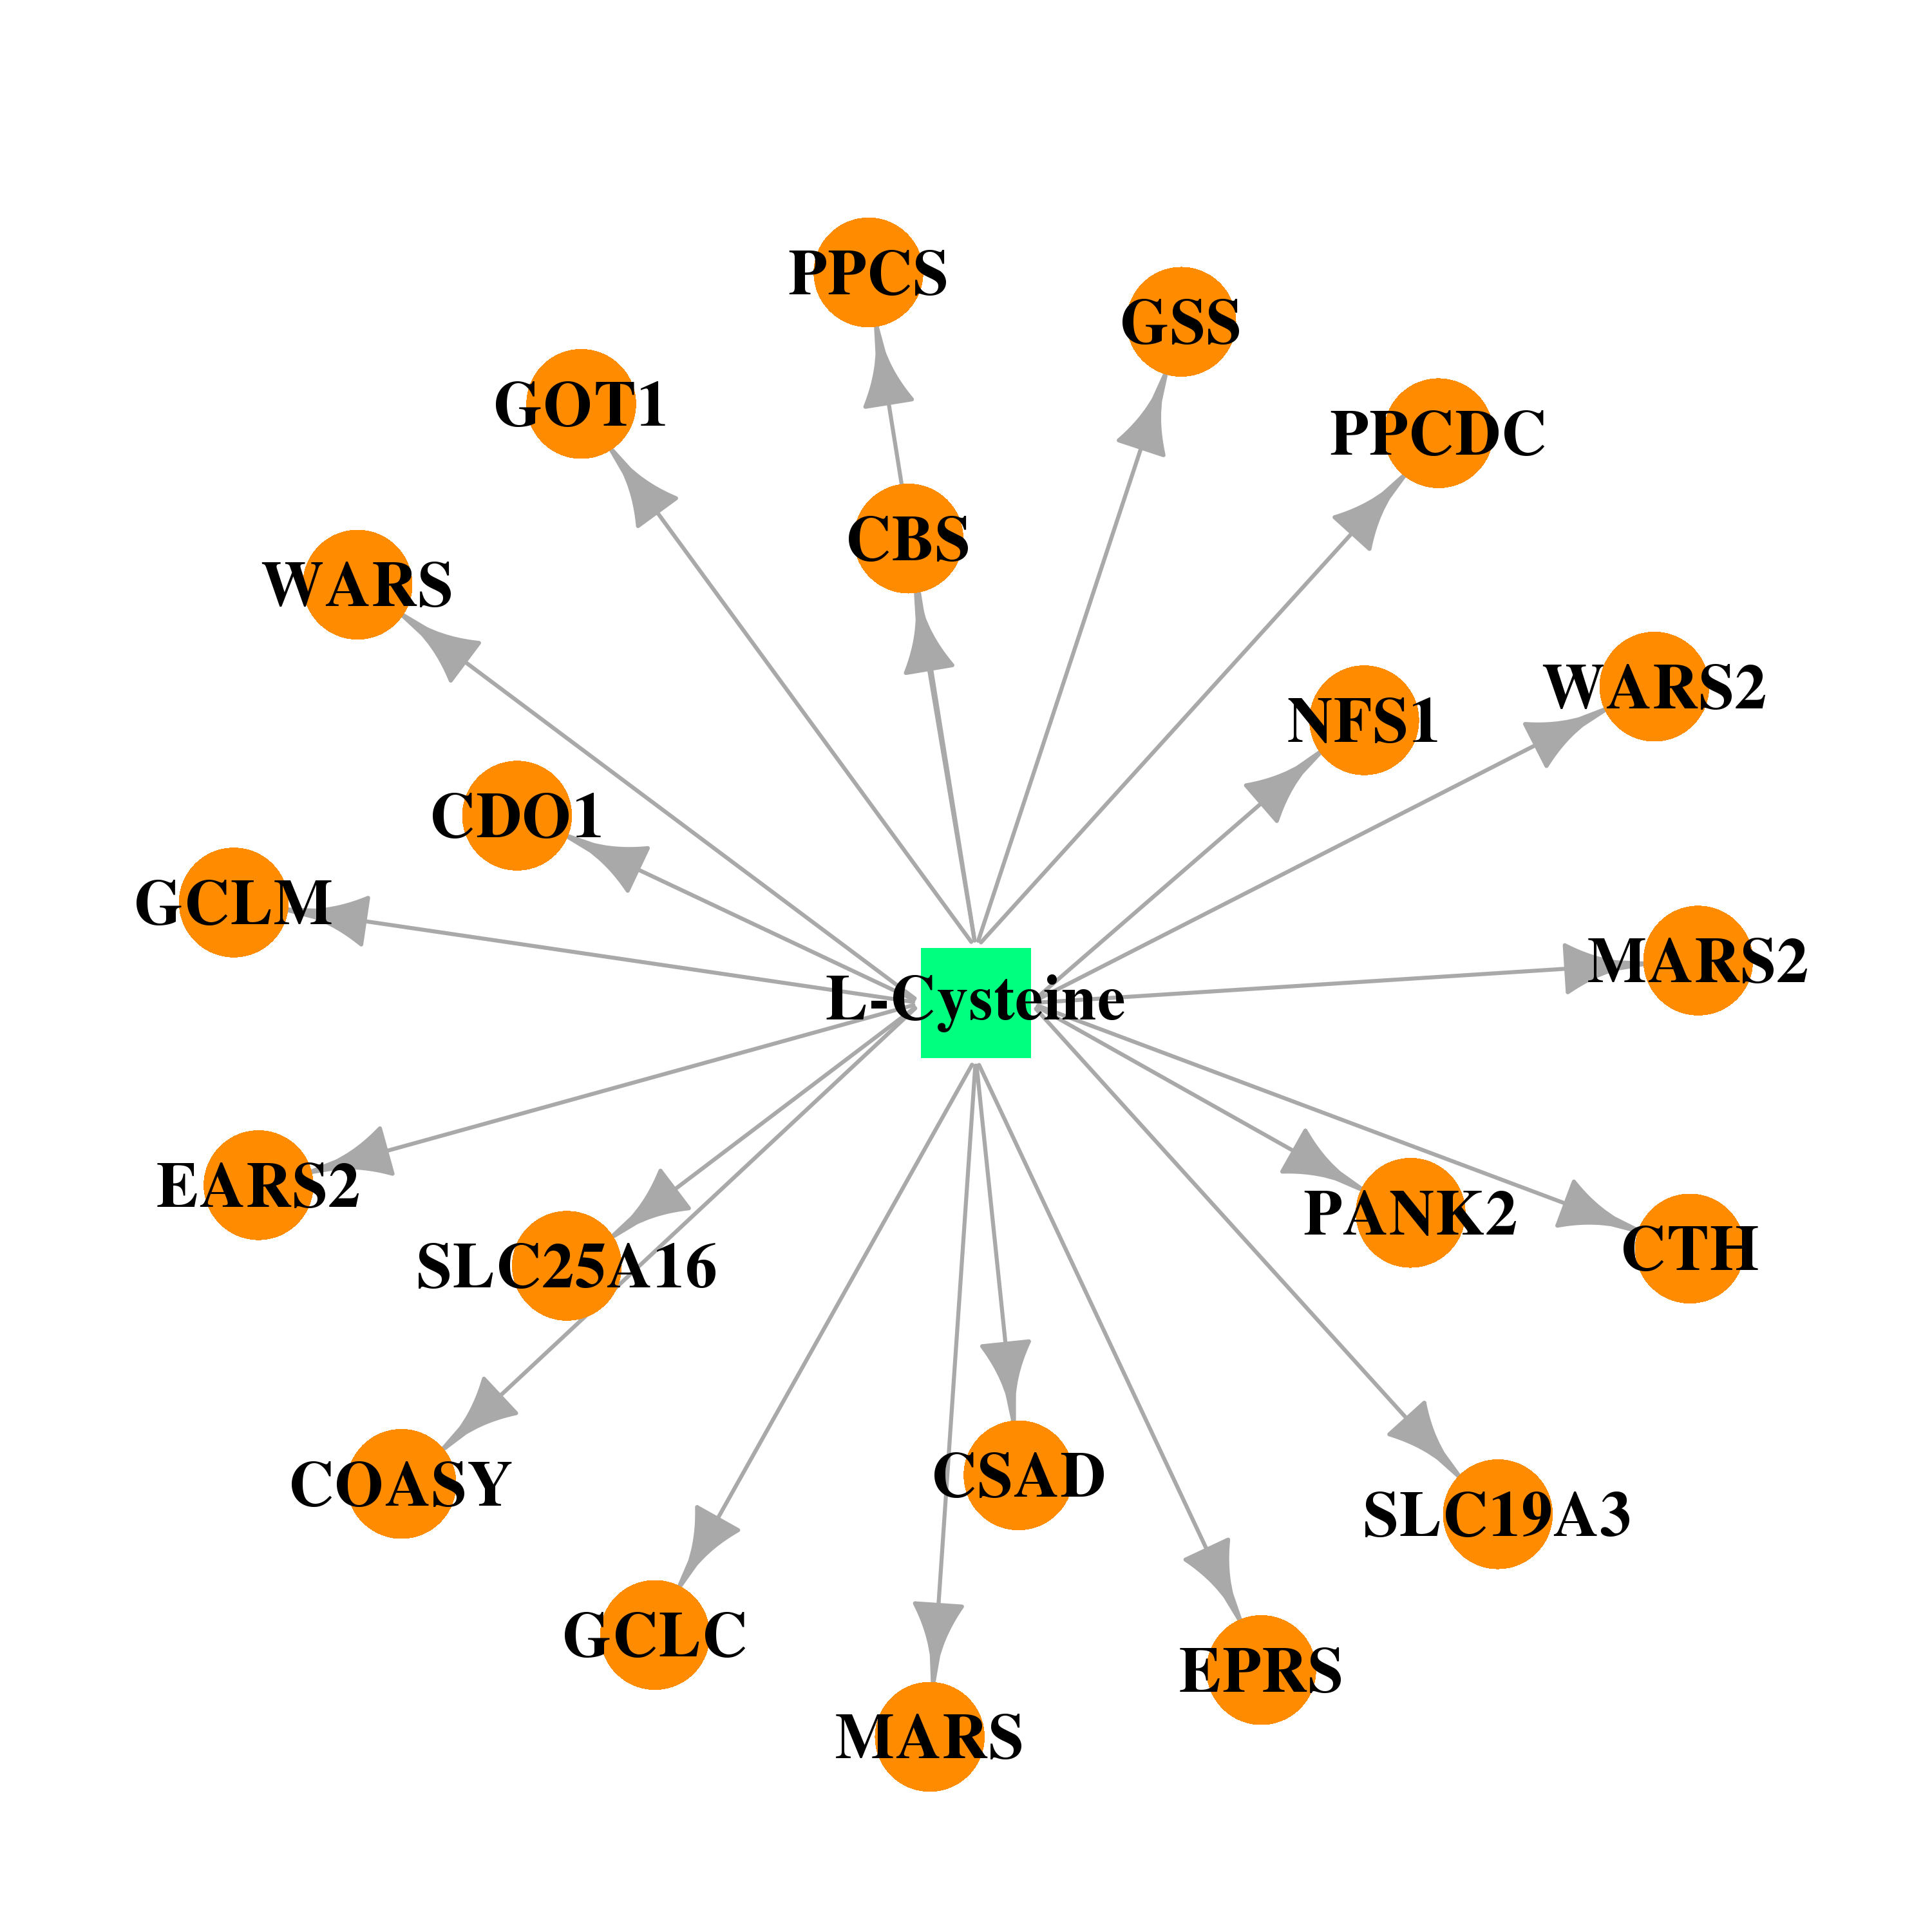 | 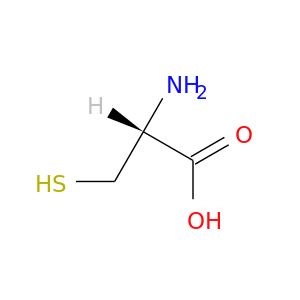 |
| DB00515 | glutamate-cysteine ligase, catalytic subunit | approved | Cisplatin |  |  |
| DB00143 | glutamate-cysteine ligase, catalytic subunit | approved; nutraceutical | Glutathione |  |  |
| Top |
| Cross referenced IDs for GCLC |
| * We obtained these cross-references from Uniprot database. It covers 150 different DBs, 18 categories. http://www.uniprot.org/help/cross_references_section |
: Open all cross reference information
|
Copyright © 2016-Present - The Univsersity of Texas Health Science Center at Houston @ |