|
||||||||||||||||||||
| |
| Phenotypic Information (metabolism pathway, cancer, disease, phenome) |
| |
| |
| Gene-Gene Network Information: Co-Expression Network, Interacting Genes & KEGG |
| |
|


| Gene Summary for MOCS3 |
| Basic gene info. | Gene symbol | MOCS3 |
| Gene name | molybdenum cofactor synthesis 3 | |
| Synonyms | UBA4 | |
| Cytomap | UCSC genome browser: 20q13.13 | |
| Genomic location | chr20 :49575362-49577820 | |
| Type of gene | protein-coding | |
| RefGenes | NM_014484.4, | |
| Ensembl id | ENSG00000124217 | |
| Description | MPT synthase sulfurylaseUBA4, ubiquitin-activating enzyme E1 homologadenylyltransferase and sulfurtransferase MOCS3molybdenum cofactor synthesis protein 3molybdopterin synthase sulfurylaseubiquitin-like modifier activating enzyme 4 | |
| Modification date | 20141207 | |
| dbXrefs | MIM : 609277 | |
| HGNC : HGNC | ||
| HPRD : 10092 | ||
| Protein | UniProt: go to UniProt's Cross Reference DB Table | |
| Expression | CleanEX: HS_MOCS3 | |
| BioGPS: 27304 | ||
| Gene Expression Atlas: ENSG00000124217 | ||
| The Human Protein Atlas: ENSG00000124217 | ||
| Pathway | NCI Pathway Interaction Database: MOCS3 | |
| KEGG: MOCS3 | ||
| REACTOME: MOCS3 | ||
| ConsensusPathDB | ||
| Pathway Commons: MOCS3 | ||
| Metabolism | MetaCyc: MOCS3 | |
| HUMANCyc: MOCS3 | ||
| Regulation | Ensembl's Regulation: ENSG00000124217 | |
| miRBase: chr20 :49,575,362-49,577,820 | ||
| TargetScan: NM_014484 | ||
| cisRED: ENSG00000124217 | ||
| Context | iHOP: MOCS3 | |
| cancer metabolism search in PubMed: MOCS3 | ||
| UCL Cancer Institute: MOCS3 | ||
| Assigned class in ccmGDB | C | |
| Top |
| Phenotypic Information for MOCS3(metabolism pathway, cancer, disease, phenome) |
| Cancer | CGAP: MOCS3 |
| Familial Cancer Database: MOCS3 | |
| * This gene is included in those cancer gene databases. |
|
|
|
|
|
| . | ||||||||||||||
Oncogene 1 | Significant driver gene in | |||||||||||||||||||
| cf) number; DB name 1 Oncogene; http://nar.oxfordjournals.org/content/35/suppl_1/D721.long, 2 Tumor Suppressor gene; https://bioinfo.uth.edu/TSGene/, 3 Cancer Gene Census; http://www.nature.com/nrc/journal/v4/n3/abs/nrc1299.html, 4 CancerGenes; http://nar.oxfordjournals.org/content/35/suppl_1/D721.long, 5 Network of Cancer Gene; http://ncg.kcl.ac.uk/index.php, 1Therapeutic Vulnerabilities in Cancer; http://cbio.mskcc.org/cancergenomics/statius/ |
| REACTOME_METABOLISM_OF_VITAMINS_AND_COFACTORS | |
| OMIM | |
| Orphanet | |
| Disease | KEGG Disease: MOCS3 |
| MedGen: MOCS3 (Human Medical Genetics with Condition) | |
| ClinVar: MOCS3 | |
| Phenotype | MGI: MOCS3 (International Mouse Phenotyping Consortium) |
| PhenomicDB: MOCS3 | |
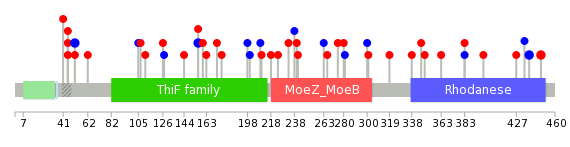
| Mutations for MOCS3 |
| * Under tables are showing count per each tissue to give us broad intuition about tissue specific mutation patterns.You can go to the detailed page for each mutation database's web site. |
| There's no structural variation information in COSMIC data for this gene. |
| * From mRNA Sanger sequences, Chitars2.0 arranged chimeric transcripts. This table shows MOCS3 related fusion information. |
| ID | Head Gene | Tail Gene | Accession | Gene_a | qStart_a | qEnd_a | Chromosome_a | tStart_a | tEnd_a | Gene_a | qStart_a | qEnd_a | Chromosome_a | tStart_a | tEnd_a |
| Top |
| There's no copy number variation information in COSMIC data for this gene. |
| Top |
|
 |
| Top |
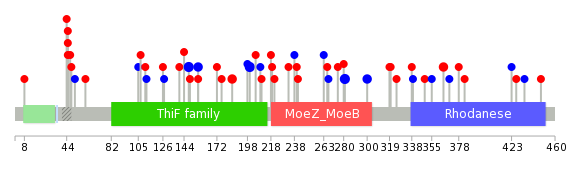
| Stat. for Non-Synonymous SNVs (# total SNVs=28) | (# total SNVs=10) |
 |  |
(# total SNVs=1) | (# total SNVs=0) |
 |
| Top |
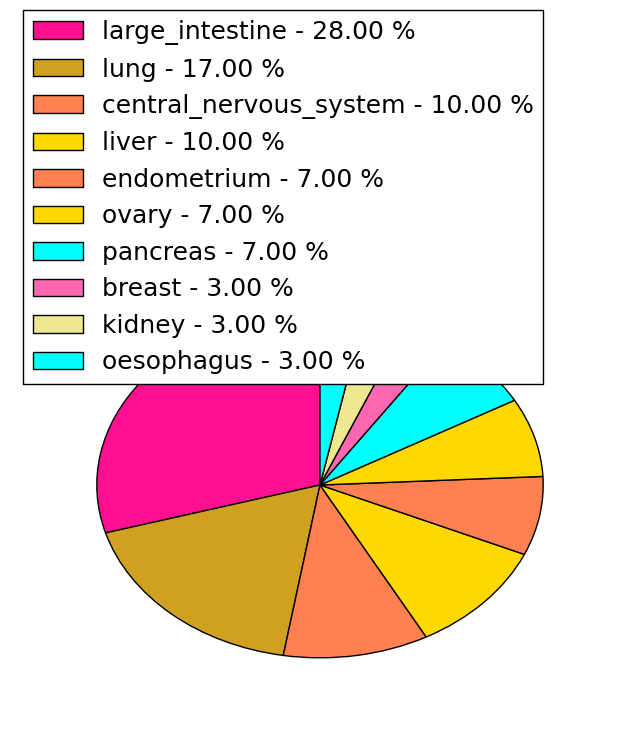
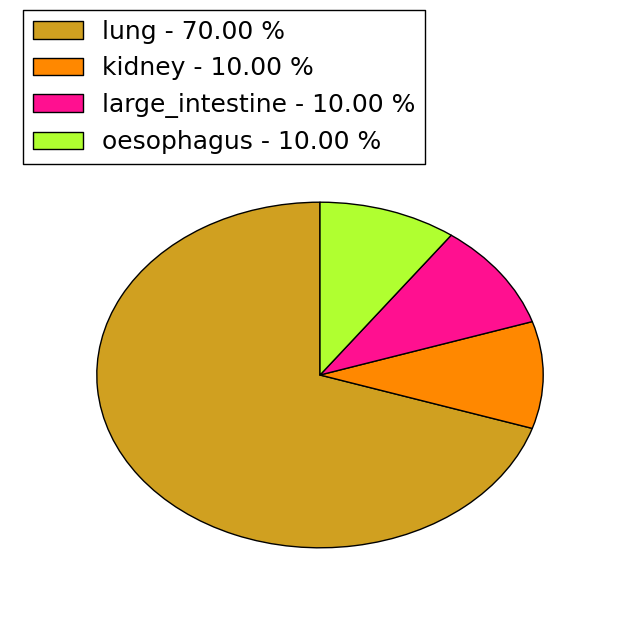
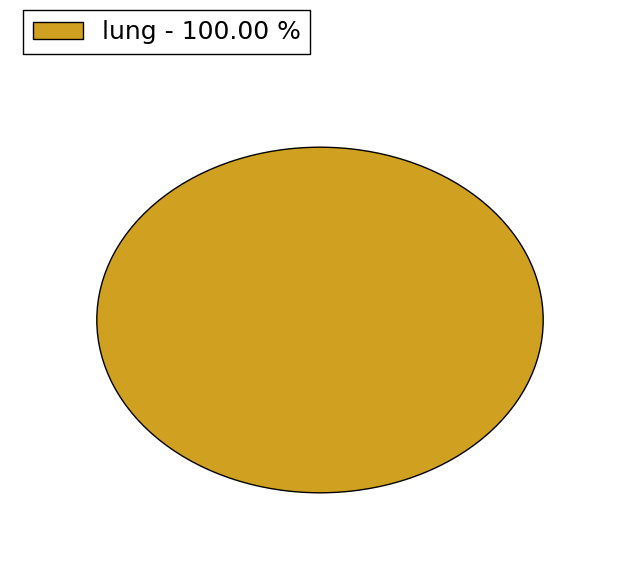
| * When you move the cursor on each content, you can see more deailed mutation information on the Tooltip. Those are primary_site,primary_histology,mutation(aa),pubmedID. |
| GRCh37 position | Mutation(aa) | Unique sampleID count |
| chr20:49575823-49575823 | p.L148L | 3 |
| chr20:49576222-49576222 | p.L281L | 3 |
| chr20:49575979-49575979 | p.L200L | 3 |
| chr20:49576473-49576473 | p.C365F | 2 |
| chr20:49575847-49575847 | p.P156P | 2 |
| chr20:49576279-49576279 | p.C300C | 2 |
| chr20:49576335-49576335 | p.S319* | 2 |
| chr20:49575933-49575933 | p.T185I | 2 |
| chr20:49575512-49575512 | p.P45S | 2 |
| chr20:49576424-49576424 | p.A349P | 1 |
| Top |
|
 |
| Point Mutation/ Tissue ID | 1 | 2 | 3 | 4 | 5 | 6 | 7 | 8 | 9 | 10 | 11 | 12 | 13 | 14 | 15 | 16 | 17 | 18 | 19 | 20 |
| # sample | 2 | 6 | 3 | 2 | 2 | 14 | 1 | 2 | 5 | 9 | 1 | 2 | ||||||||
| # mutation | 2 | 6 | 3 | 2 | 2 | 14 | 1 | 2 | 5 | 11 | 1 | 2 | ||||||||
| nonsynonymous SNV | 1 | 5 | 3 | 1 | 1 | 9 | 2 | 4 | 7 | 2 | ||||||||||
| synonymous SNV | 1 | 1 | 1 | 1 | 5 | 1 | 1 | 4 | 1 |
| cf) Tissue ID; Tissue type (1; BLCA[Bladder Urothelial Carcinoma], 2; BRCA[Breast invasive carcinoma], 3; CESC[Cervical squamous cell carcinoma and endocervical adenocarcinoma], 4; COAD[Colon adenocarcinoma], 5; GBM[Glioblastoma multiforme], 6; Glioma Low Grade, 7; HNSC[Head and Neck squamous cell carcinoma], 8; KICH[Kidney Chromophobe], 9; KIRC[Kidney renal clear cell carcinoma], 10; KIRP[Kidney renal papillary cell carcinoma], 11; LAML[Acute Myeloid Leukemia], 12; LUAD[Lung adenocarcinoma], 13; LUSC[Lung squamous cell carcinoma], 14; OV[Ovarian serous cystadenocarcinoma ], 15; PAAD[Pancreatic adenocarcinoma], 16; PRAD[Prostate adenocarcinoma], 17; SKCM[Skin Cutaneous Melanoma], 18:STAD[Stomach adenocarcinoma], 19:THCA[Thyroid carcinoma], 20:UCEC[Uterine Corpus Endometrial Carcinoma]) |
| Top |
| * We represented just top 10 SNVs. When you move the cursor on each content, you can see more deailed mutation information on the Tooltip. Those are primary_site, primary_histology, mutation(aa), pubmedID. |
| Genomic Position | Mutation(aa) | Unique sampleID count |
| chr20:49575512 | p.P156P | 2 |
| chr20:49575847 | p.T438T | 2 |
| chr20:49576693 | p.A448T | 2 |
| chr20:49576721 | p.P45T | 2 |
| chr20:49575532 | p.P51P | 2 |
| chr20:49575894 | p.V126A | 1 |
| chr20:49576100 | p.N238N | 1 |
| chr20:49575694 | p.A383A | 1 |
| chr20:49576424 | p.L127L | 1 |
| chr20:49575905 | p.A240T | 1 |
| * Copy number data were extracted from TCGA using R package TCGA-Assembler. The URLs of all public data files on TCGA DCC data server were gathered on Jan-05-2015. Function ProcessCNAData in TCGA-Assembler package was used to obtain gene-level copy number value which is calculated as the average copy number of the genomic region of a gene. |
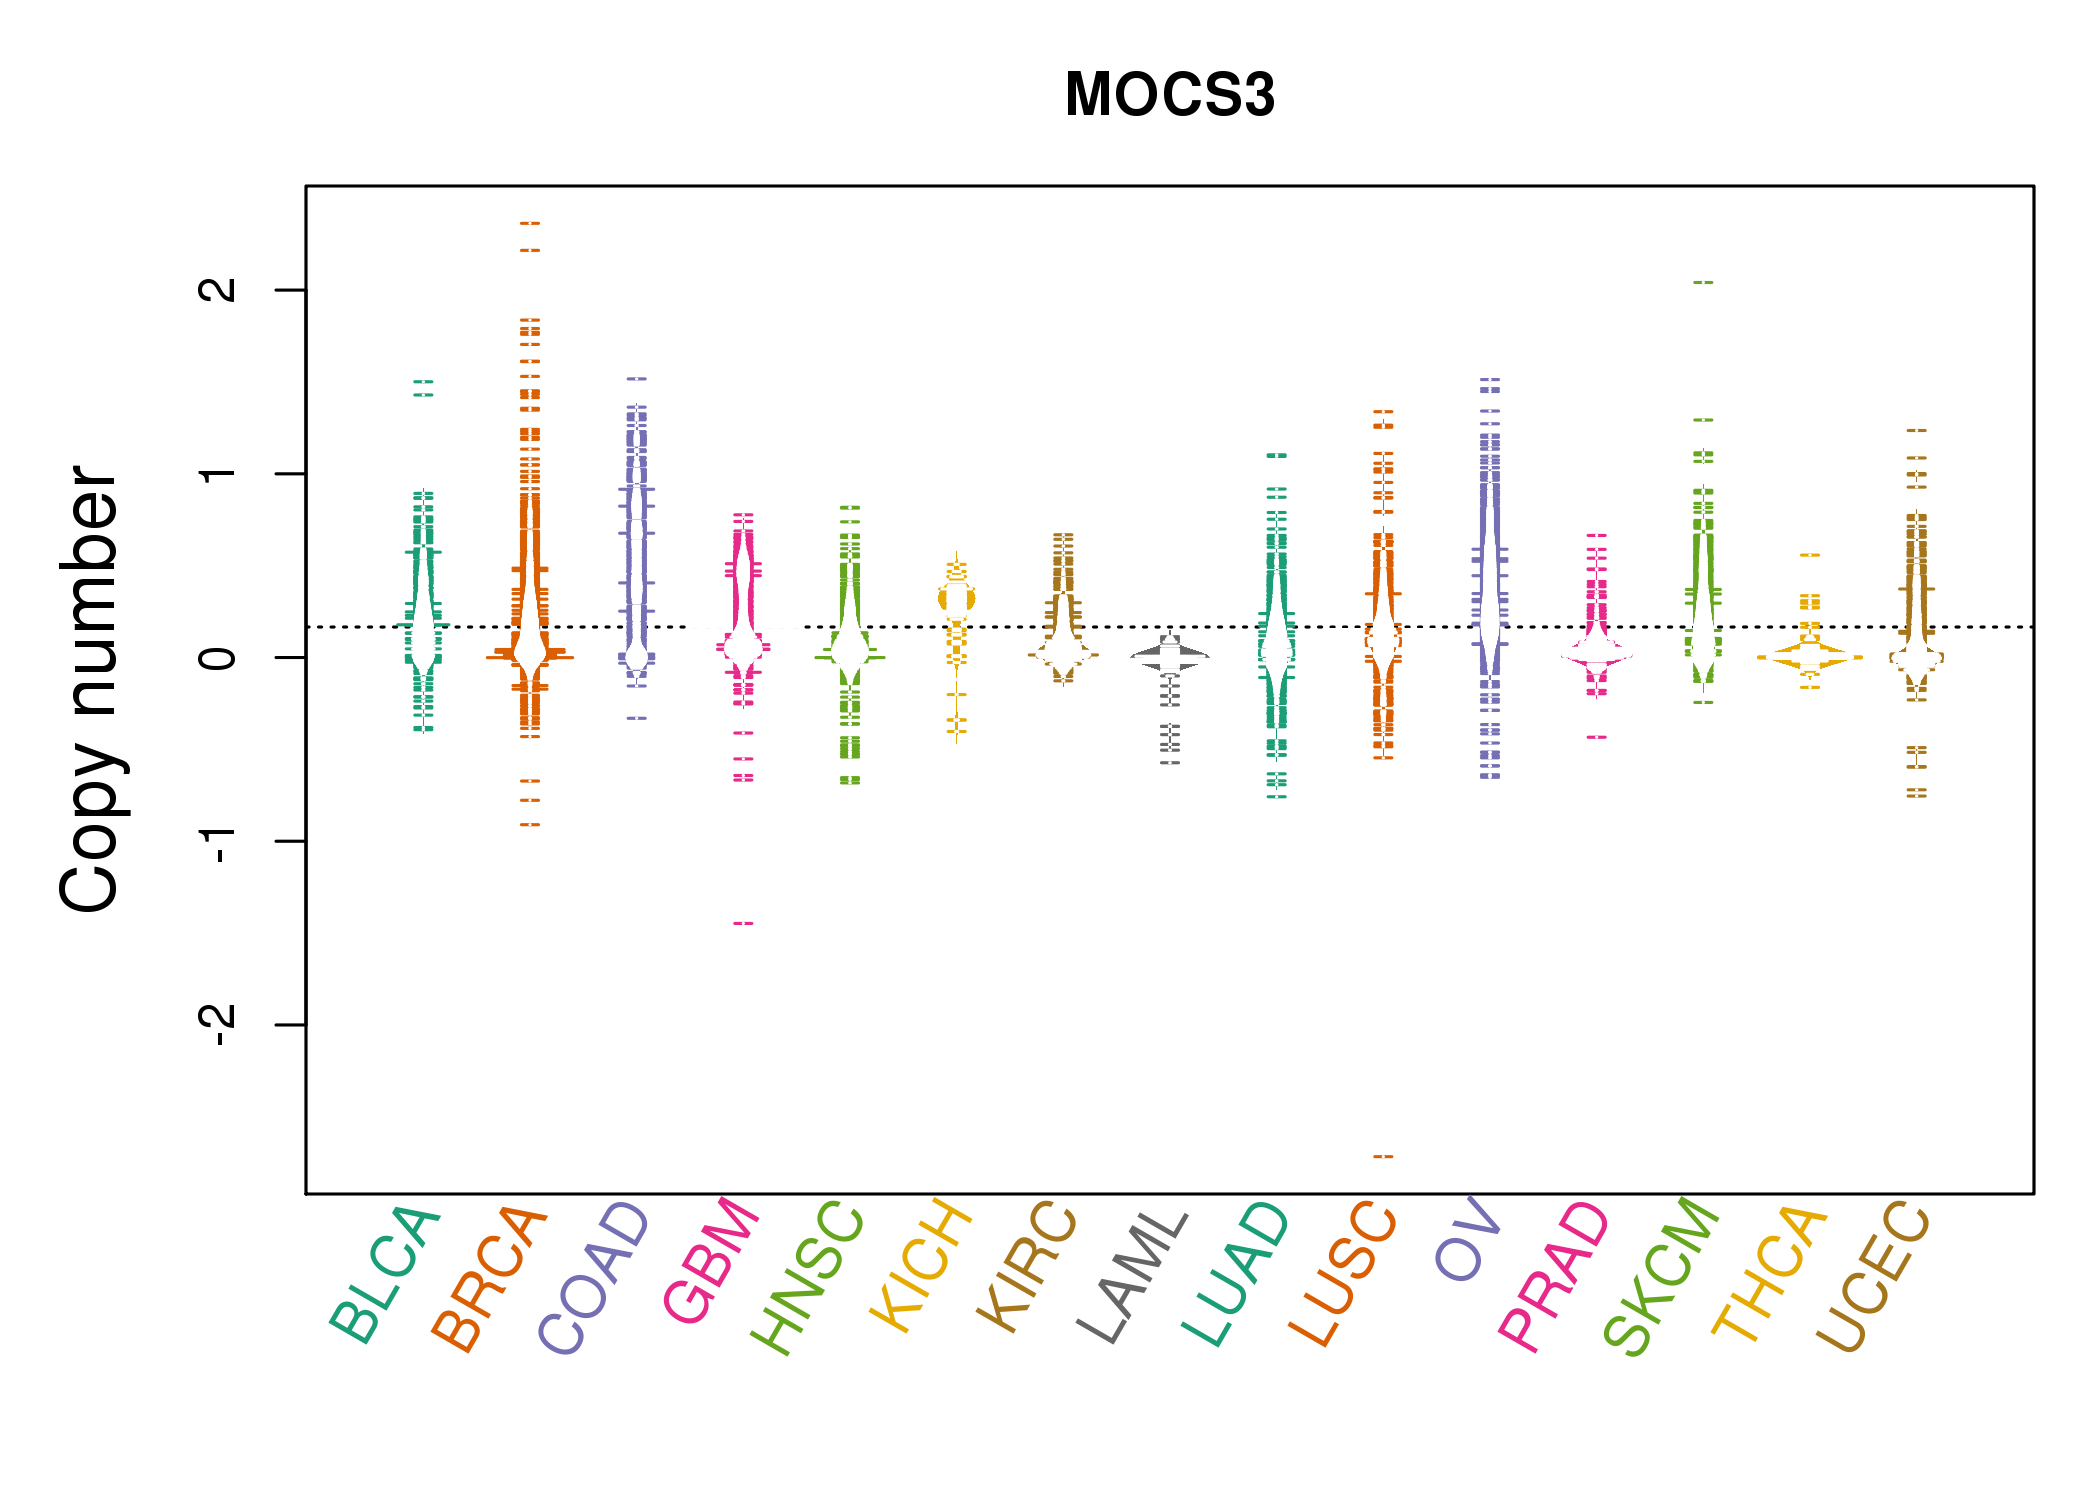 |
| cf) Tissue ID[Tissue type]: BLCA[Bladder Urothelial Carcinoma], BRCA[Breast invasive carcinoma], CESC[Cervical squamous cell carcinoma and endocervical adenocarcinoma], COAD[Colon adenocarcinoma], GBM[Glioblastoma multiforme], Glioma Low Grade, HNSC[Head and Neck squamous cell carcinoma], KICH[Kidney Chromophobe], KIRC[Kidney renal clear cell carcinoma], KIRP[Kidney renal papillary cell carcinoma], LAML[Acute Myeloid Leukemia], LUAD[Lung adenocarcinoma], LUSC[Lung squamous cell carcinoma], OV[Ovarian serous cystadenocarcinoma ], PAAD[Pancreatic adenocarcinoma], PRAD[Prostate adenocarcinoma], SKCM[Skin Cutaneous Melanoma], STAD[Stomach adenocarcinoma], THCA[Thyroid carcinoma], UCEC[Uterine Corpus Endometrial Carcinoma] |
| Top |
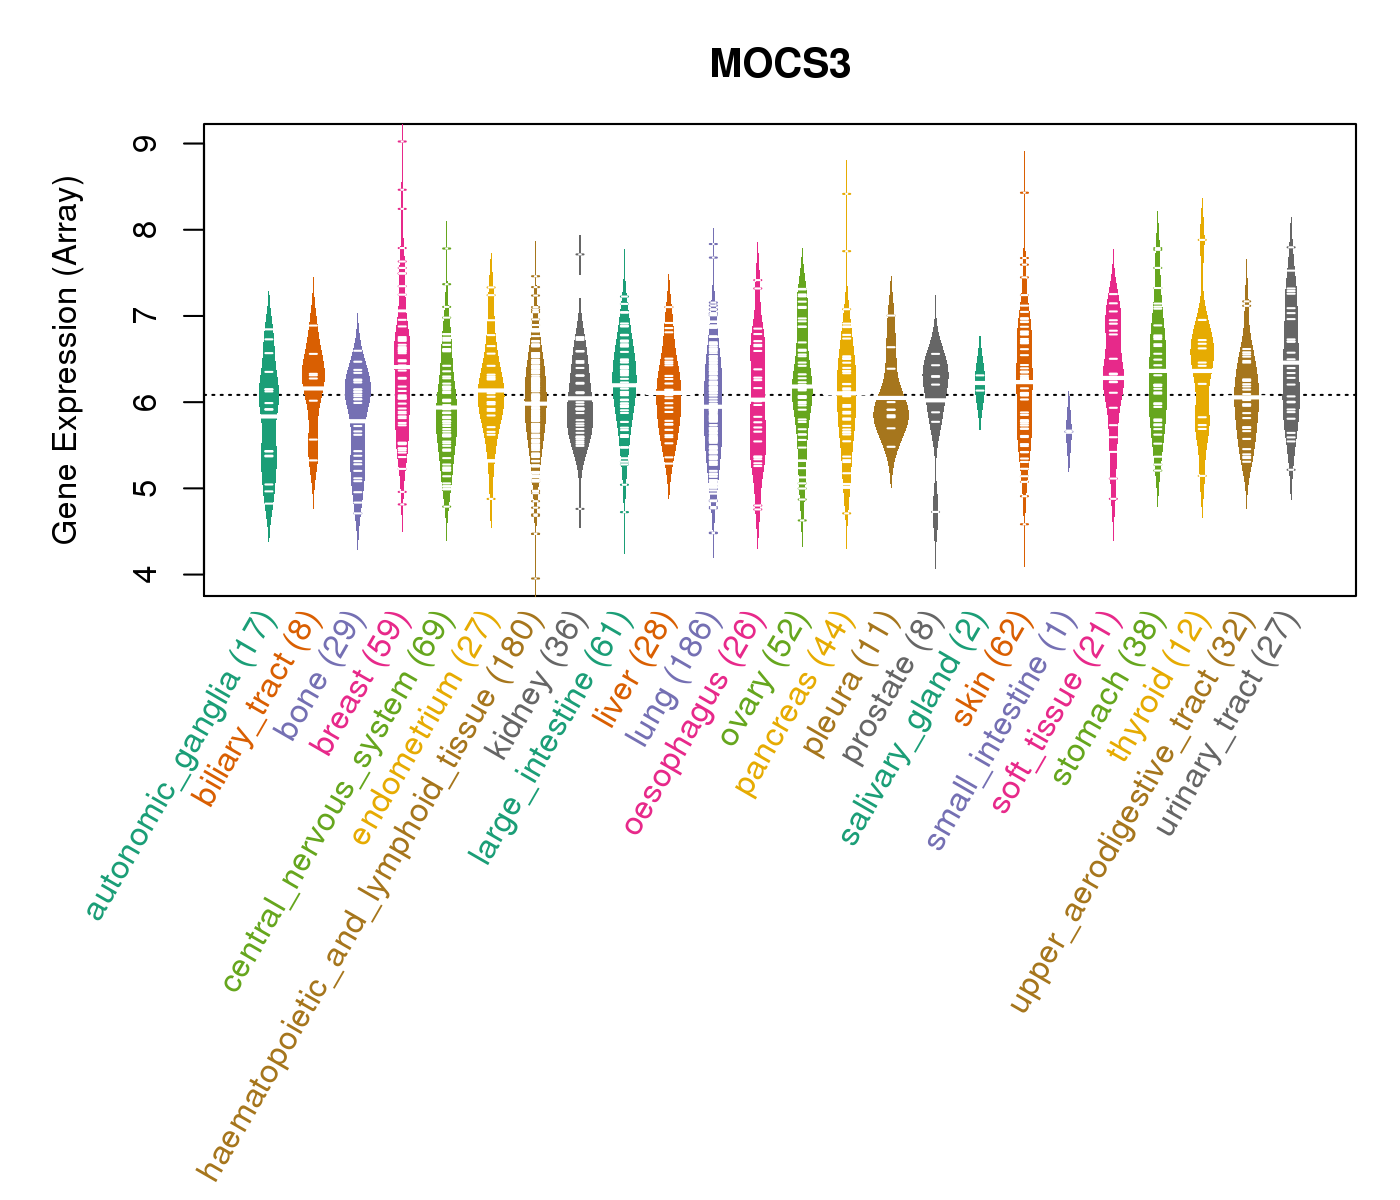
| Gene Expression for MOCS3 |
| * CCLE gene expression data were extracted from CCLE_Expression_Entrez_2012-10-18.res: Gene-centric RMA-normalized mRNA expression data. |
 |
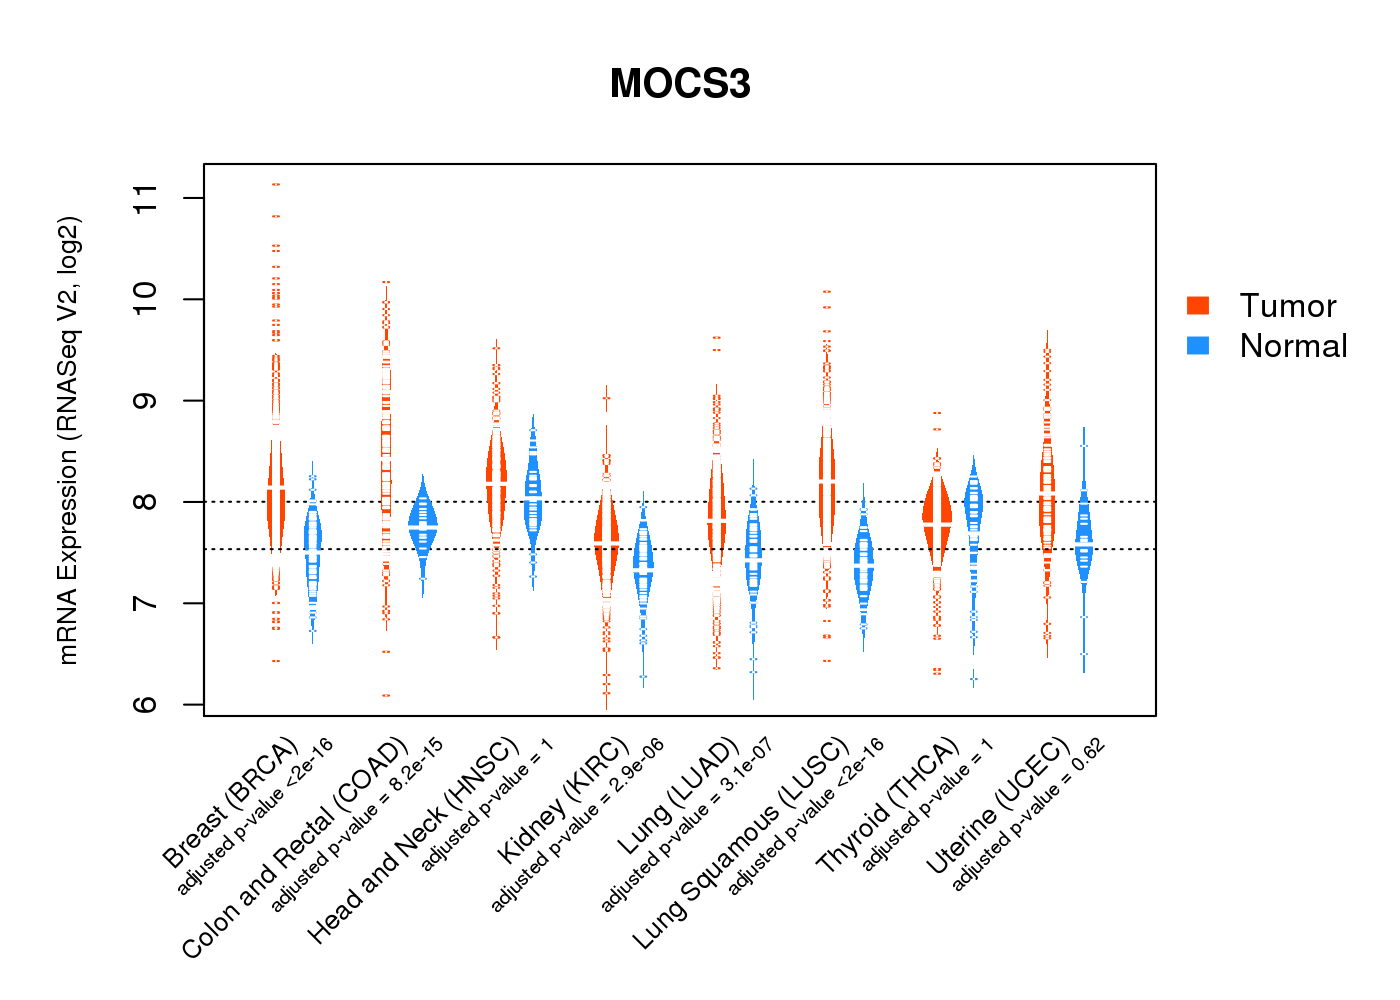
| * Normalized gene expression data of RNASeqV2 was extracted from TCGA using R package TCGA-Assembler. The URLs of all public data files on TCGA DCC data server were gathered at Jan-05-2015. Only eight cancer types have enough normal control samples for differential expression analysis. (t test, adjusted p<0.05 (using Benjamini-Hochberg FDR)) |
 |
| Top |
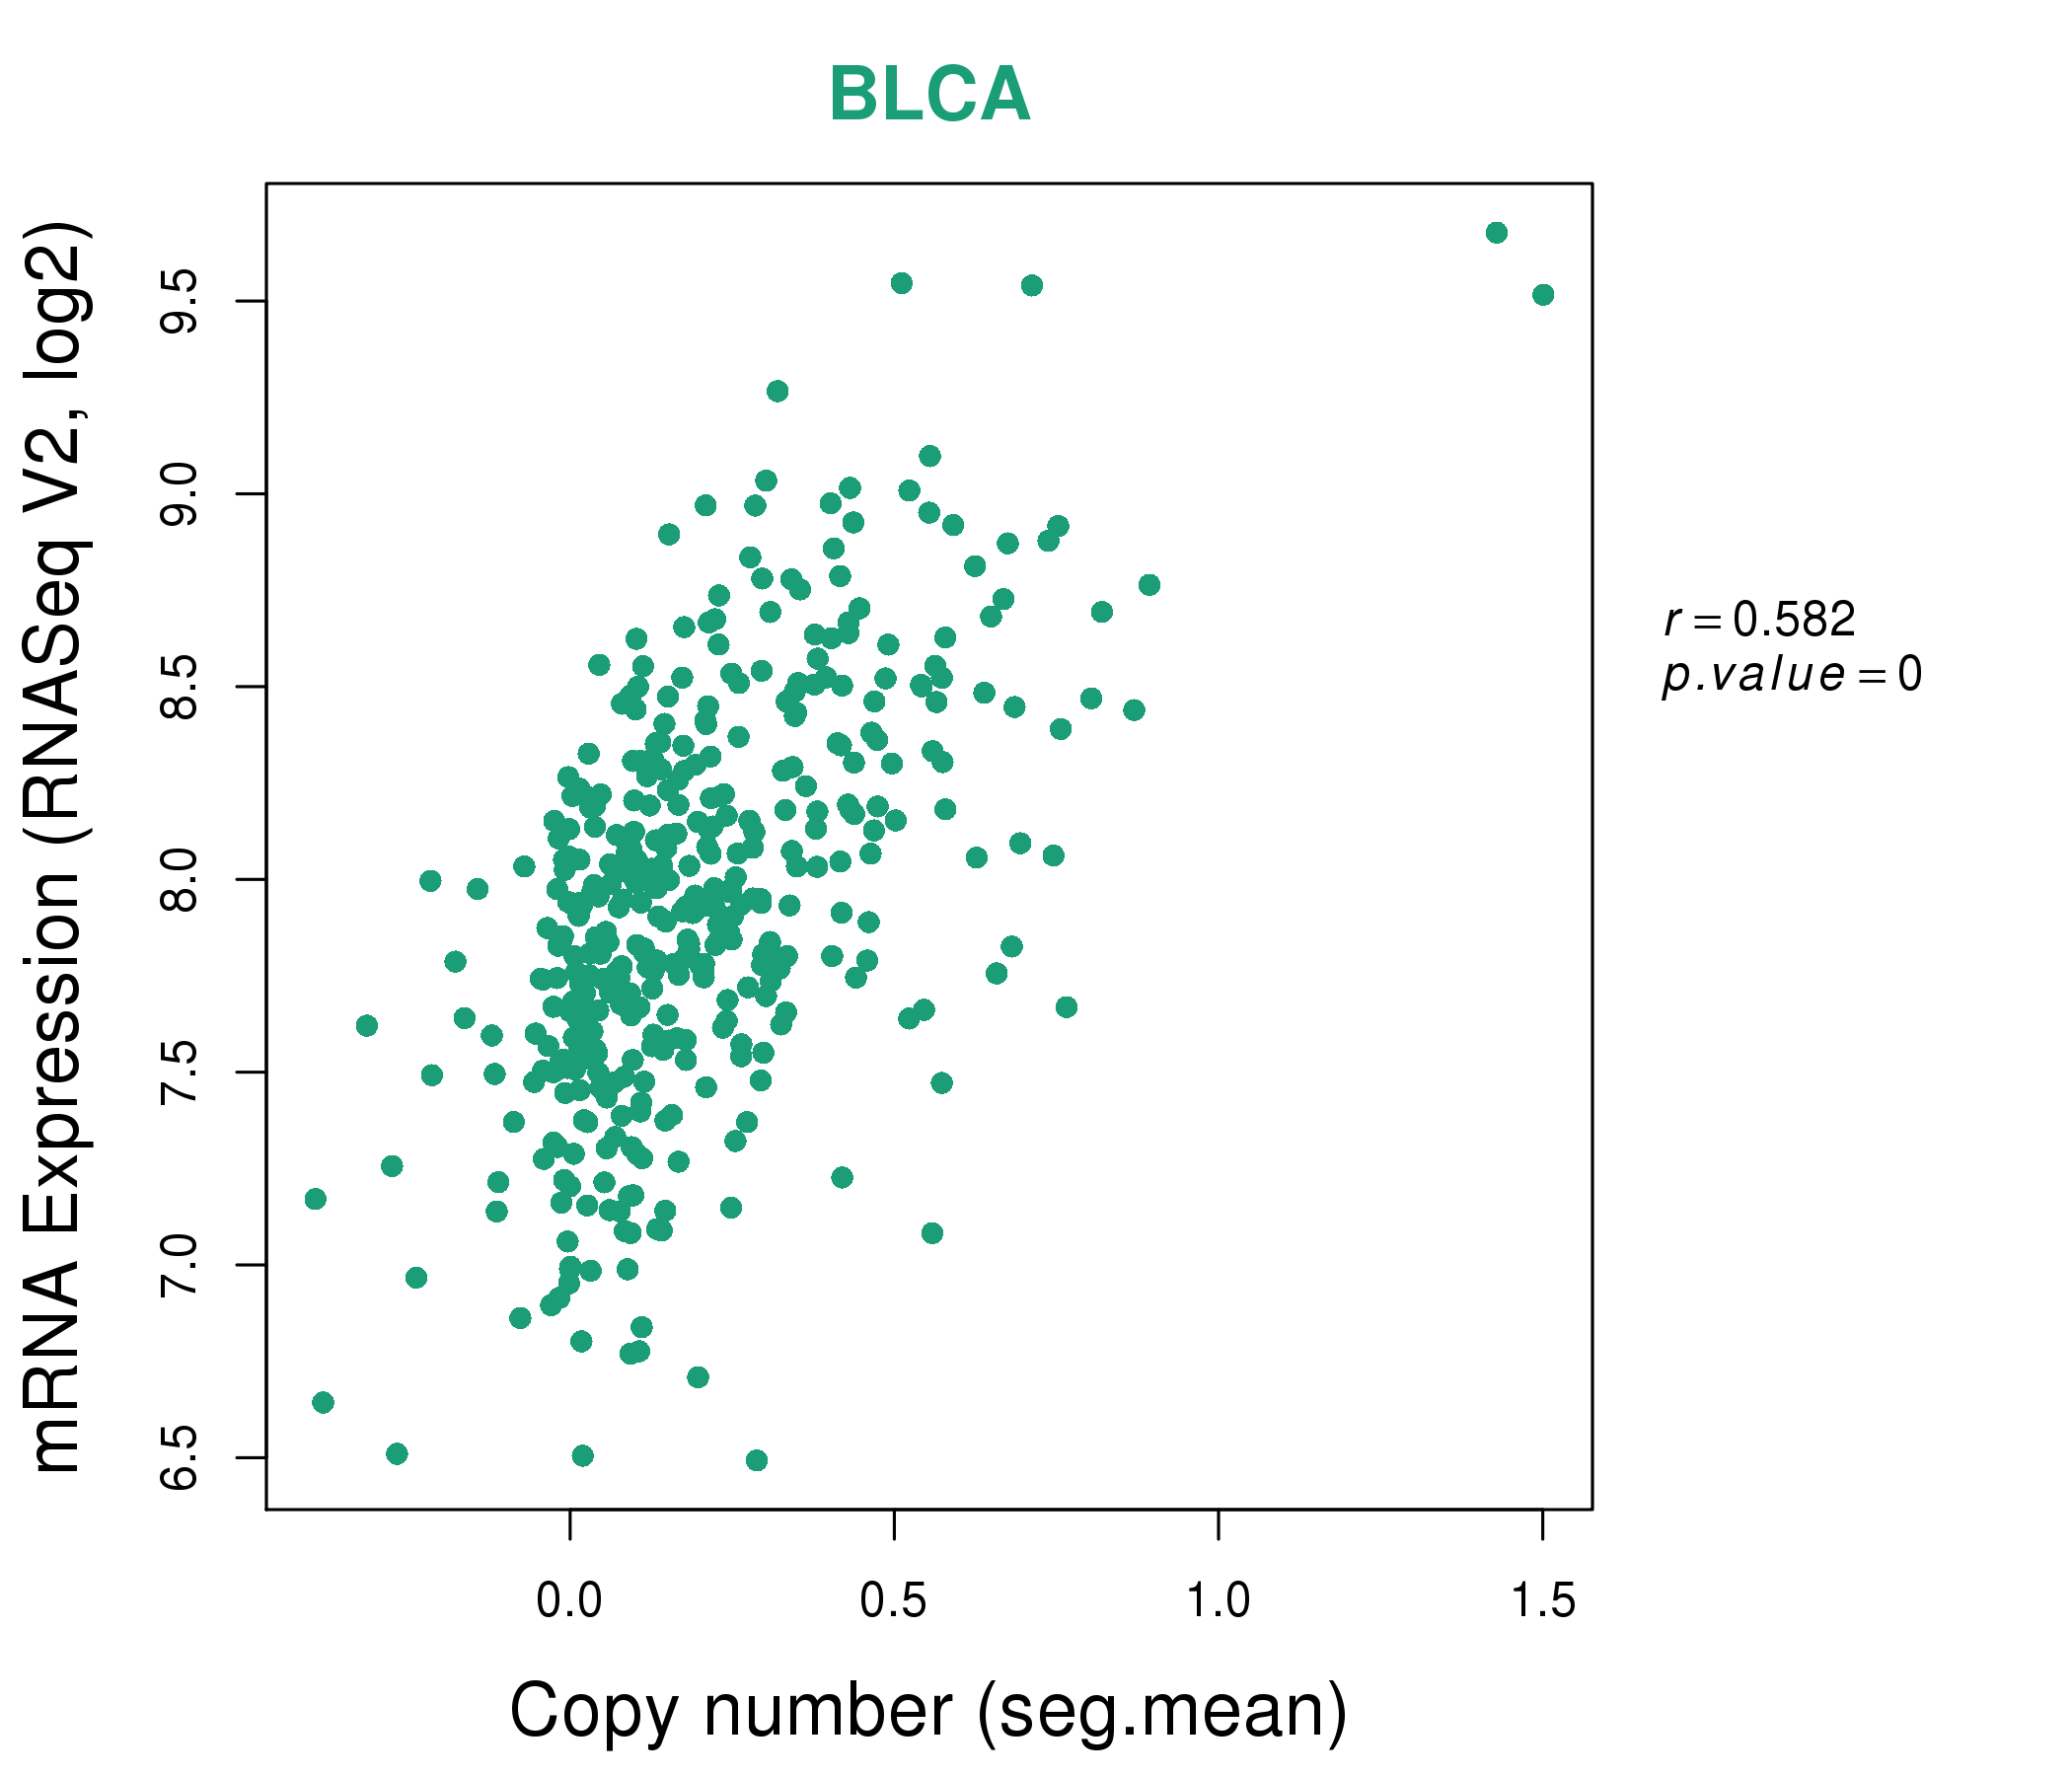
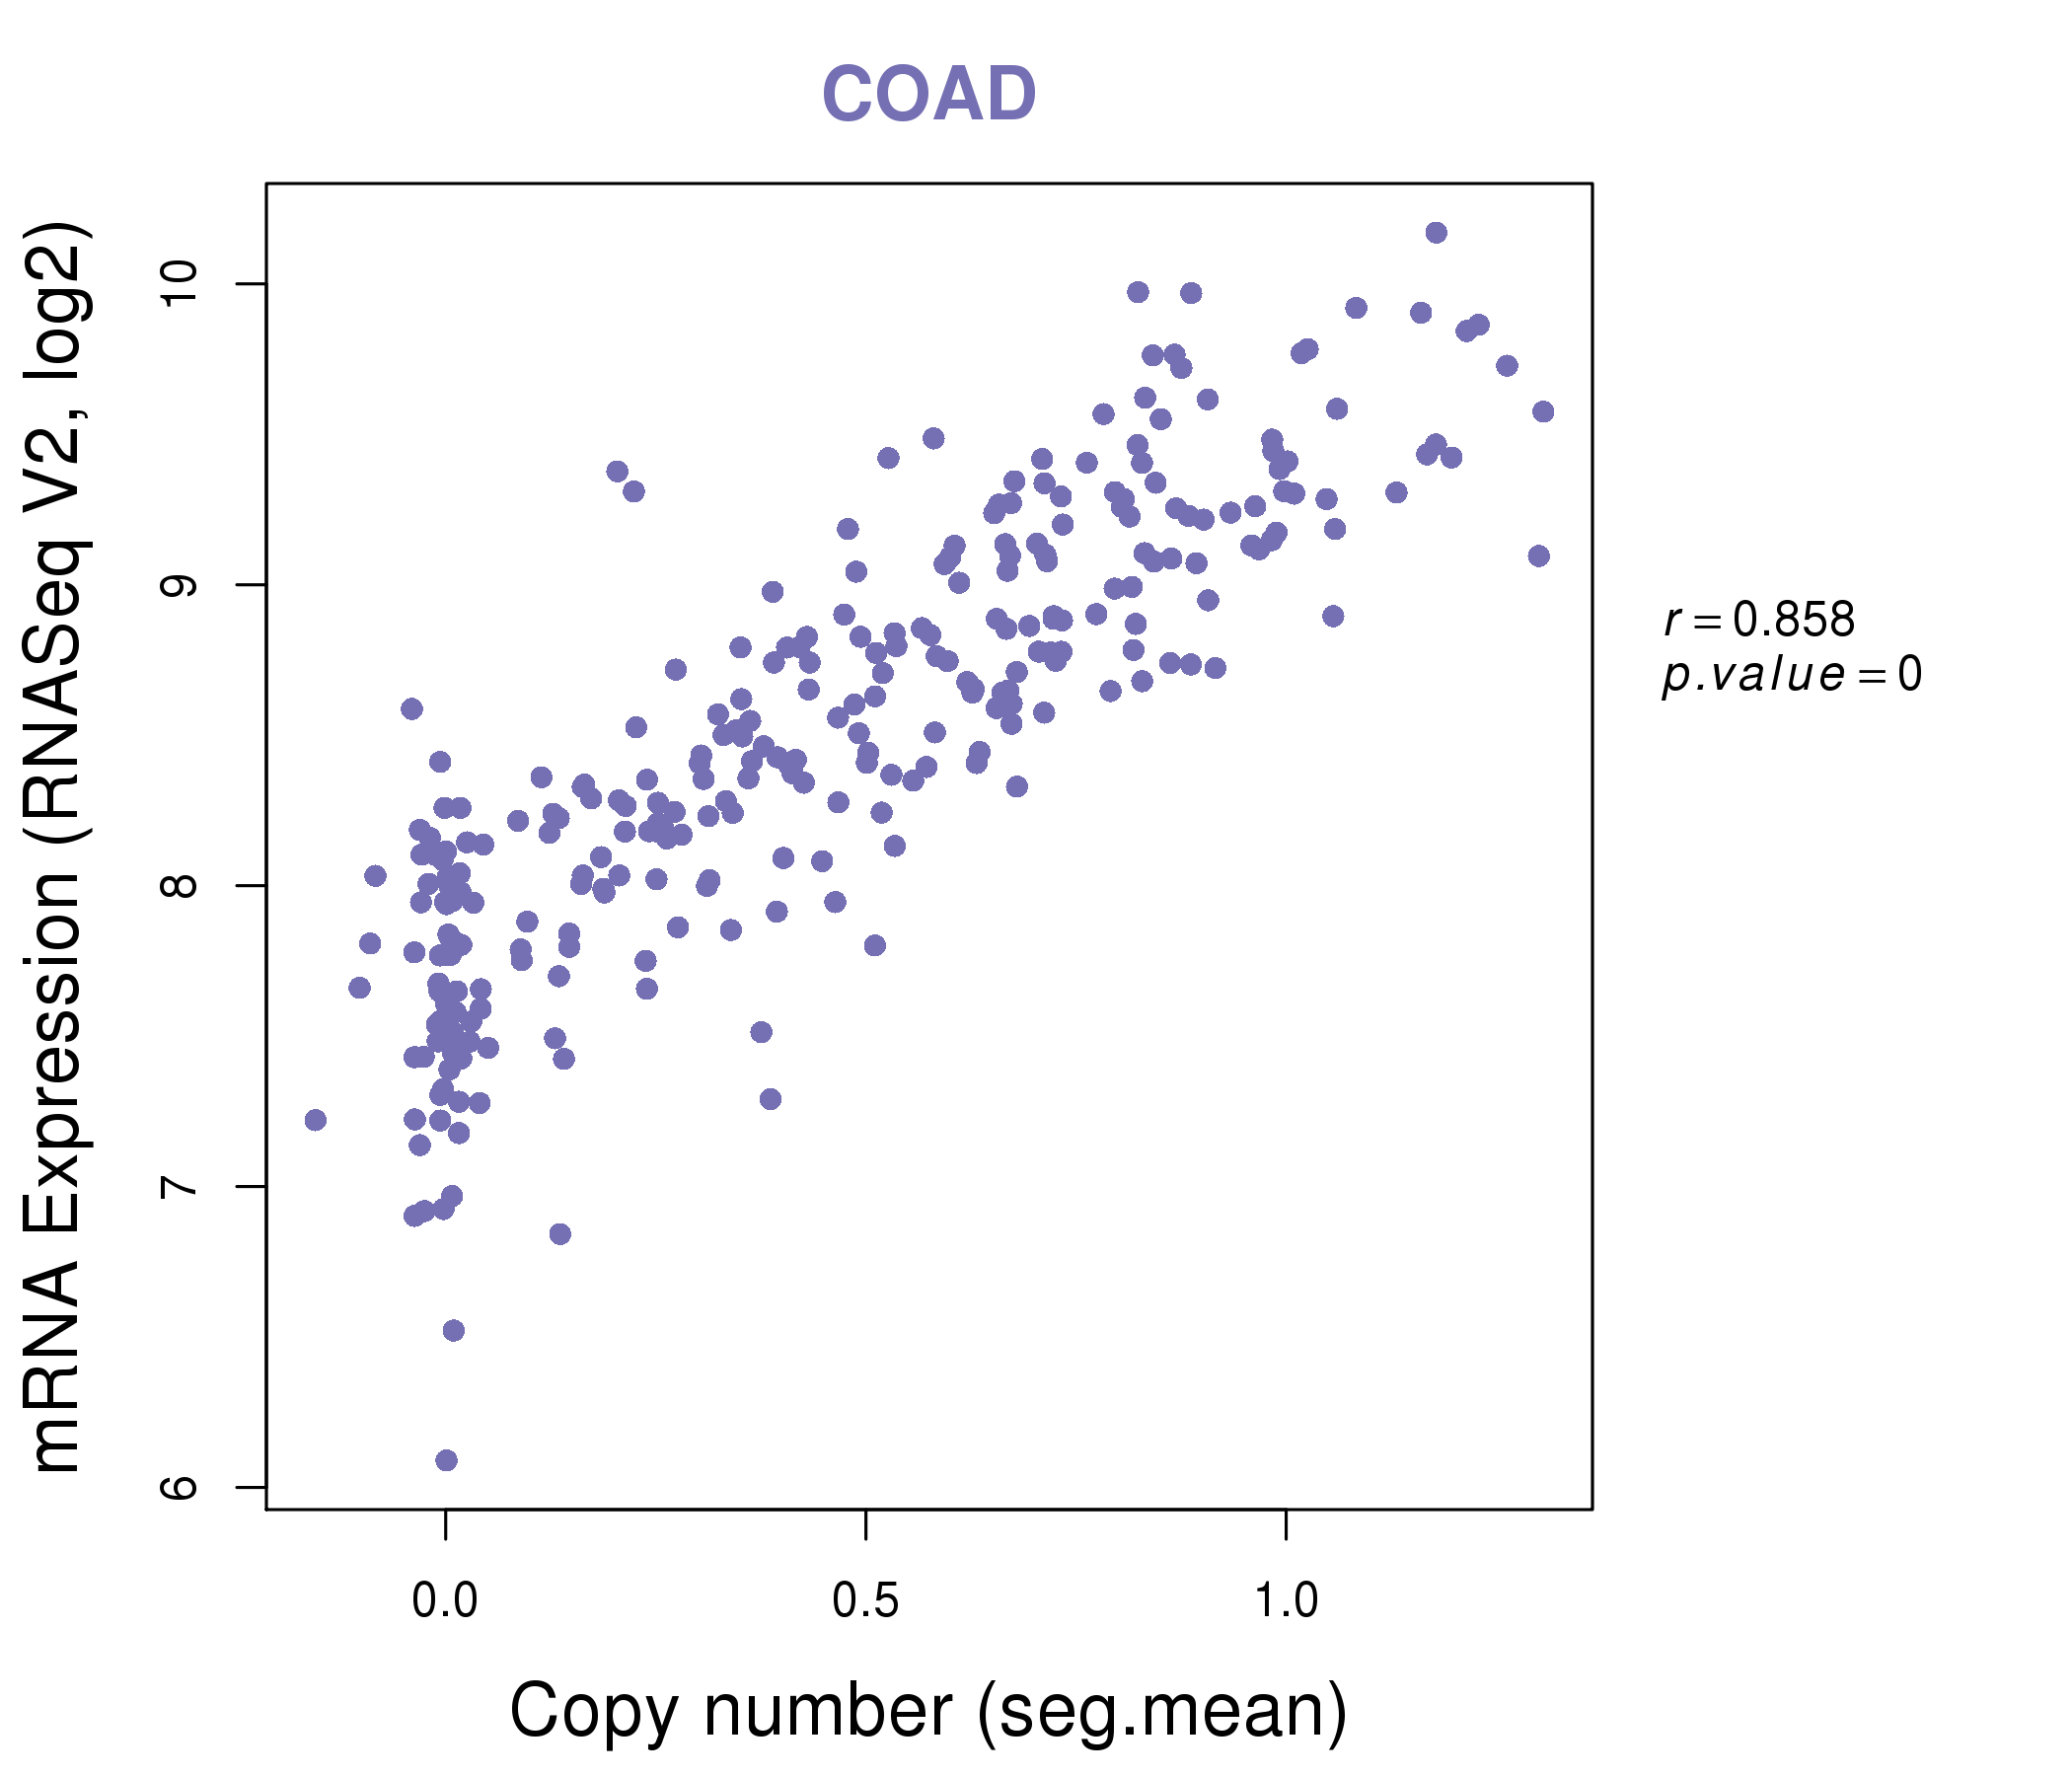
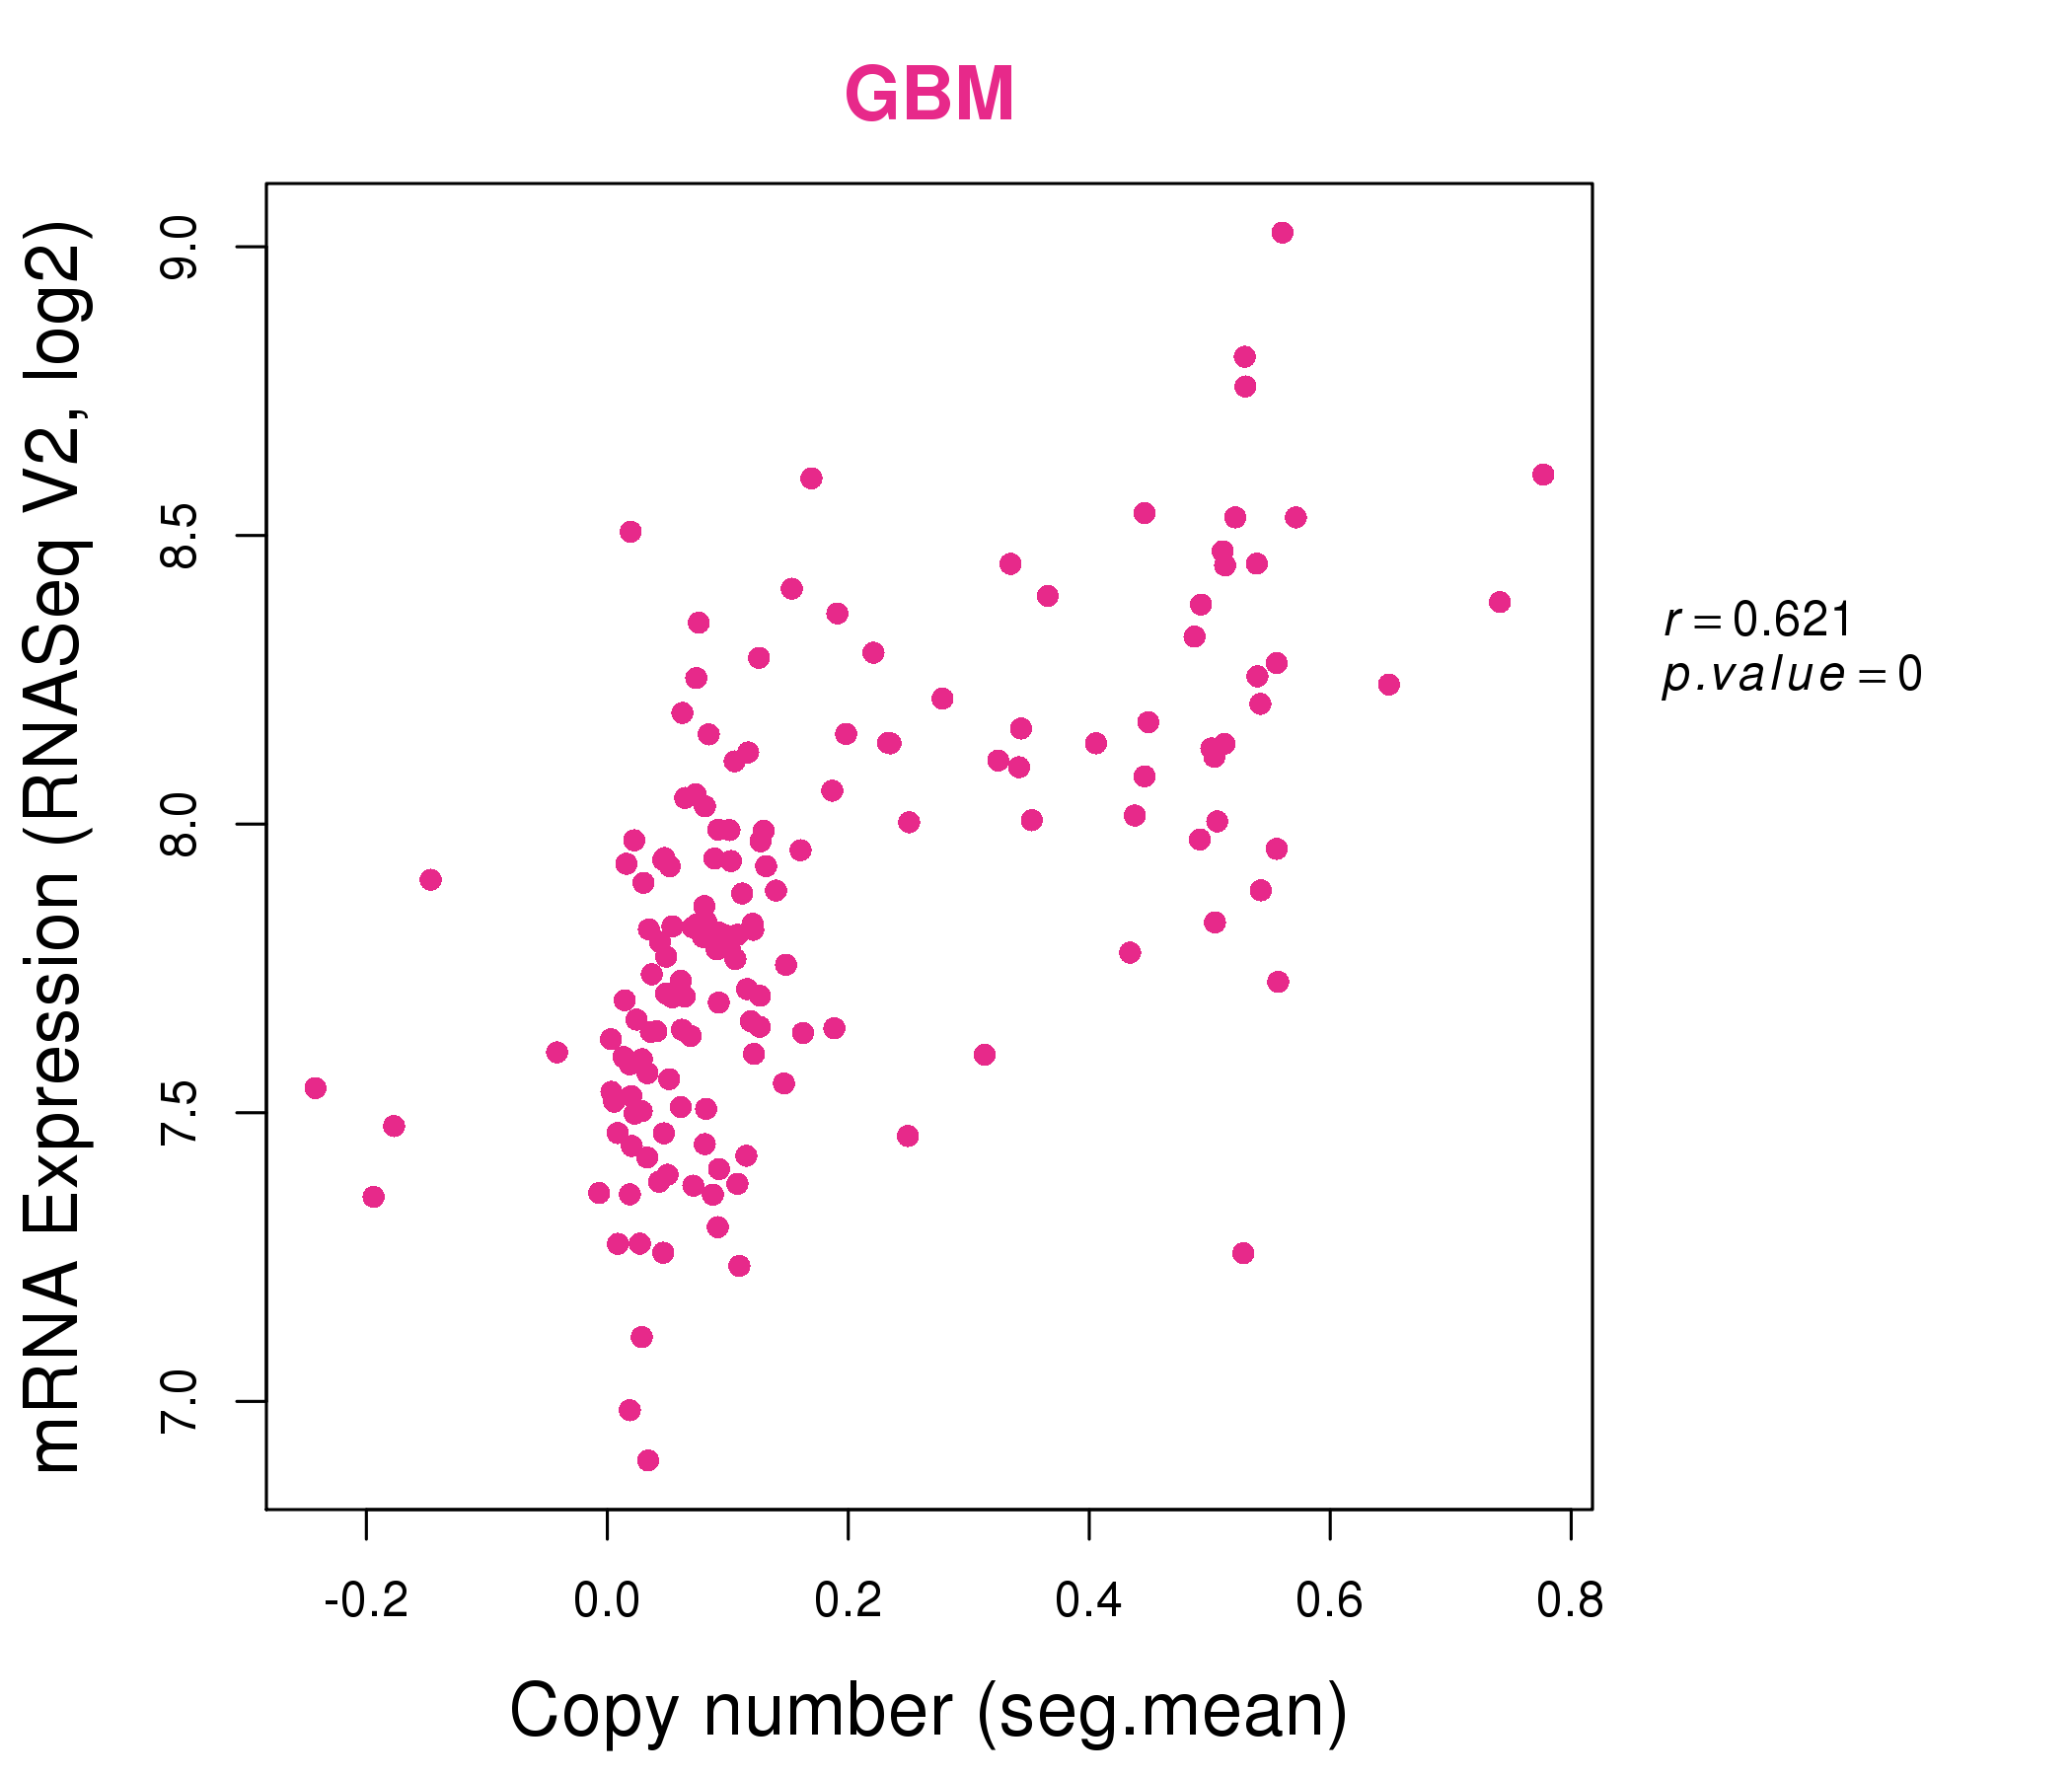
| * This plots show the correlation between CNV and gene expression. |
: Open all plots for all cancer types
 |
|
 |
|

| Top |
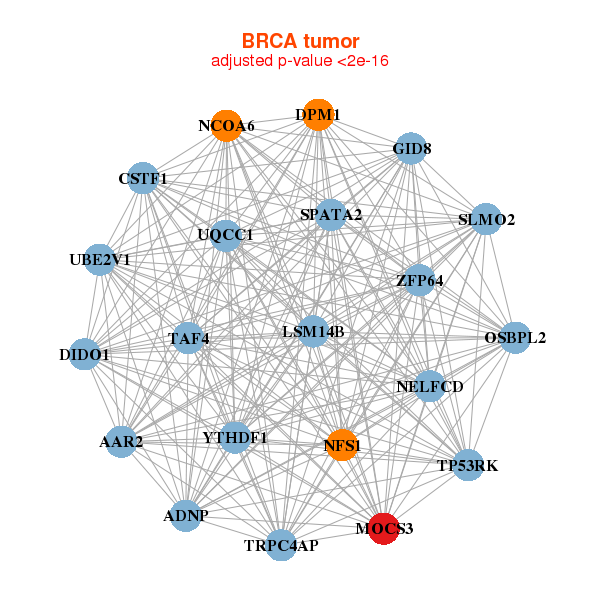
| Gene-Gene Network Information |
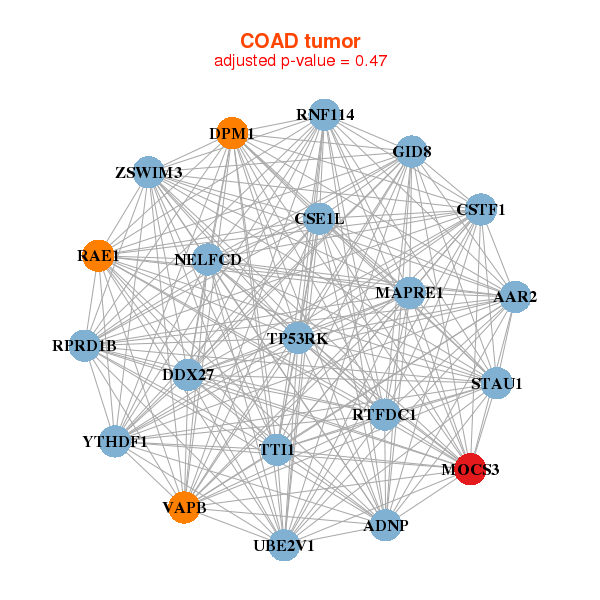
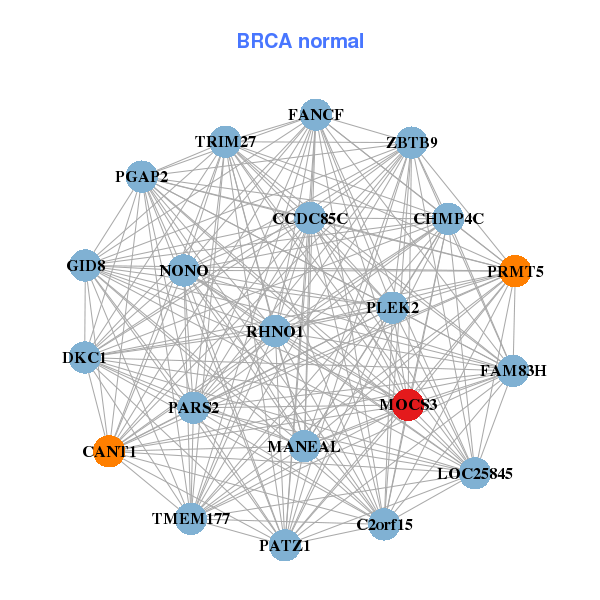
| * Co-Expression network figures were drawn using R package igraph. Only the top 20 genes with the highest correlations were shown. Red circle: input gene, orange circle: cell metabolism gene, sky circle: other gene |
: Open all plots for all cancer types
 |
|
| ADNP,GID8,AAR2,CSTF1,DIDO1,DPM1,LSM14B, MOCS3,NCOA6,NFS1,OSBPL2,SLMO2,SPATA2,TAF4, NELFCD,TP53RK,TRPC4AP,UBE2V1,UQCC1,YTHDF1,ZFP64 | RHNO1,GID8,C2orf15,CANT1,CCDC85C,CHMP4C,DKC1, FAM83H,FANCF,LOC25845,MANEAL,MOCS3,NONO,PARS2, PATZ1,PGAP2,PLEK2,PRMT5,TMEM177,TRIM27,ZBTB9 |
 |
|
| ADNP,GID8,AAR2,RTFDC1,CSE1L,CSTF1,DDX27, DPM1,TTI1,MAPRE1,MOCS3,RAE1,RNF114,RPRD1B, STAU1,NELFCD,TP53RK,UBE2V1,VAPB,YTHDF1,ZSWIM3 | ALKBH7,CCDC71,COX5B,DUSP23,ABHD17A,GRK6,HPS6, MAN1B1,MOCS3,MRPL41,NDUFAF3,PGLS,PXMP2,RPL28, SCAND1,SFT2D3,THAP4,TMEM160,TRAPPC1,TRAPPC5,ZNF524 |
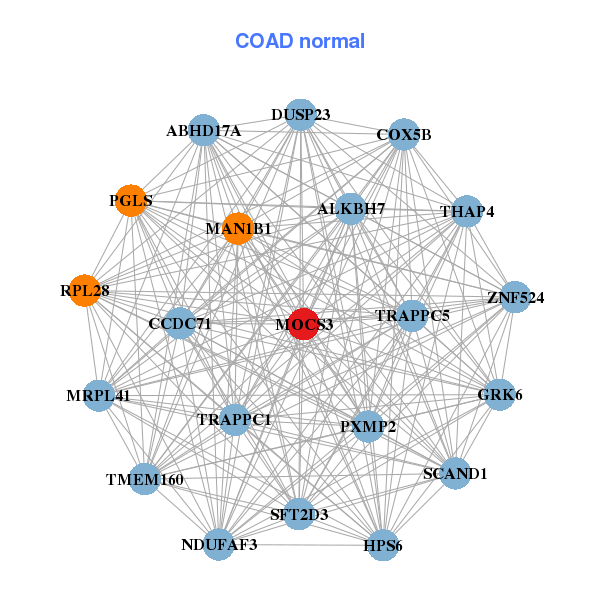
| * Co-Expression network figures were drawn using R package igraph. Only the top 20 genes with the highest correlations were shown. Red circle: input gene, orange circle: cell metabolism gene, sky circle: other gene |
: Open all plots for all cancer types
| Top |
: Open all interacting genes' information including KEGG pathway for all interacting genes from DAVID
| Top |
| Pharmacological Information for MOCS3 |
| There's no related Drug. |
| Top |
| Cross referenced IDs for MOCS3 |
| * We obtained these cross-references from Uniprot database. It covers 150 different DBs, 18 categories. http://www.uniprot.org/help/cross_references_section |
: Open all cross reference information
|
Copyright © 2016-Present - The Univsersity of Texas Health Science Center at Houston @ |