|
||||||||||||||||||||||||||||||||||||||||||||||||||||||||||||||||||||||||||||||||||||||||||||||||||||||||||||||||||||||||||||||||||||||||||||||||||||||||||||||||||||||||||||||||||||||||||||||||||||||||||||||||||||||||||||||||||||||||||||||||||||||||||||||||||||||||||||||||||||||||||||||||||||||||||||||||||||||||||
| |
| Phenotypic Information (metabolism pathway, cancer, disease, phenome) |
| |
| |
| Gene-Gene Network Information: Co-Expression Network, Interacting Genes & KEGG |
| |
|


| Gene Summary for EIF3K |
| Basic gene info. | Gene symbol | EIF3K |
| Gene name | eukaryotic translation initiation factor 3, subunit K | |
| Synonyms | EIF3-p28|EIF3S12|HSPC029|M9|MSTP001|PLAC-24|PLAC24|PRO1474|PTD001 | |
| Cytomap | UCSC genome browser: 19q13.2 | |
| Genomic location | chr19 :39109721-39127595 | |
| Type of gene | protein-coding | |
| RefGenes | NM_001300992.1, NM_013234.3, | |
| Ensembl id | ENSG00000178982 | |
| Description | eIF-3 p28eukaryotic translation initiation factor 3 subunit Keukaryotic translation initiation factor 3, subunit 12muscle specificmuscle-specific gene M9 protein | |
| Modification date | 20141207 | |
| dbXrefs | MIM : 609596 | |
| HGNC : HGNC | ||
| Ensembl : ENSG00000178982 | ||
| HPRD : 11740 | ||
| Vega : OTTHUMG00000180865 | ||
| Protein | UniProt: go to UniProt's Cross Reference DB Table | |
| Expression | CleanEX: HS_EIF3K | |
| BioGPS: 27335 | ||
| Gene Expression Atlas: ENSG00000178982 | ||
| The Human Protein Atlas: ENSG00000178982 | ||
| Pathway | NCI Pathway Interaction Database: EIF3K | |
| KEGG: EIF3K | ||
| REACTOME: EIF3K | ||
| ConsensusPathDB | ||
| Pathway Commons: EIF3K | ||
| Metabolism | MetaCyc: EIF3K | |
| HUMANCyc: EIF3K | ||
| Regulation | Ensembl's Regulation: ENSG00000178982 | |
| miRBase: chr19 :39,109,721-39,127,595 | ||
| TargetScan: NM_001300992 | ||
| cisRED: ENSG00000178982 | ||
| Context | iHOP: EIF3K | |
| cancer metabolism search in PubMed: EIF3K | ||
| UCL Cancer Institute: EIF3K | ||
| Assigned class in ccmGDB | C | |
| Top |
| Phenotypic Information for EIF3K(metabolism pathway, cancer, disease, phenome) |
| Cancer | CGAP: EIF3K |
| Familial Cancer Database: EIF3K | |
| * This gene is included in those cancer gene databases. |
|
|
|
|
|
| . | ||||||||||||||||||||||||||||||||||||||||||||||||||||||||||||||||||||||||||||||||||||||||||||||||||||||||||||||||||||||||||||||||||||||||||||||||||||||||||||||||||||||||||||||||||||||||||||||||||||||||||||||||||||||||||||||||||||||||||||||||||||||||||||||||||||||||||||||||||||||||||||||||||||||||||||||||||||
Oncogene 1 | Significant driver gene in | |||||||||||||||||||||||||||||||||||||||||||||||||||||||||||||||||||||||||||||||||||||||||||||||||||||||||||||||||||||||||||||||||||||||||||||||||||||||||||||||||||||||||||||||||||||||||||||||||||||||||||||||||||||||||||||||||||||||||||||||||||||||||||||||||||||||||||||||||||||||||||||||||||||||||||||||||||||||||
| cf) number; DB name 1 Oncogene; http://nar.oxfordjournals.org/content/35/suppl_1/D721.long, 2 Tumor Suppressor gene; https://bioinfo.uth.edu/TSGene/, 3 Cancer Gene Census; http://www.nature.com/nrc/journal/v4/n3/abs/nrc1299.html, 4 CancerGenes; http://nar.oxfordjournals.org/content/35/suppl_1/D721.long, 5 Network of Cancer Gene; http://ncg.kcl.ac.uk/index.php, 1Therapeutic Vulnerabilities in Cancer; http://cbio.mskcc.org/cancergenomics/statius/ |
| REACTOME_METABOLISM_OF_PROTEINS | |
| OMIM | |
| Orphanet | |
| Disease | KEGG Disease: EIF3K |
| MedGen: EIF3K (Human Medical Genetics with Condition) | |
| ClinVar: EIF3K | |
| Phenotype | MGI: EIF3K (International Mouse Phenotyping Consortium) |
| PhenomicDB: EIF3K | |
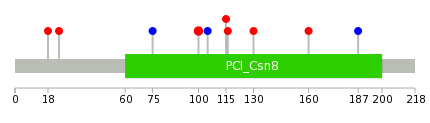
| Mutations for EIF3K |
| * Under tables are showing count per each tissue to give us broad intuition about tissue specific mutation patterns.You can go to the detailed page for each mutation database's web site. |
| - Statistics for Tissue and Mutation type | Top |
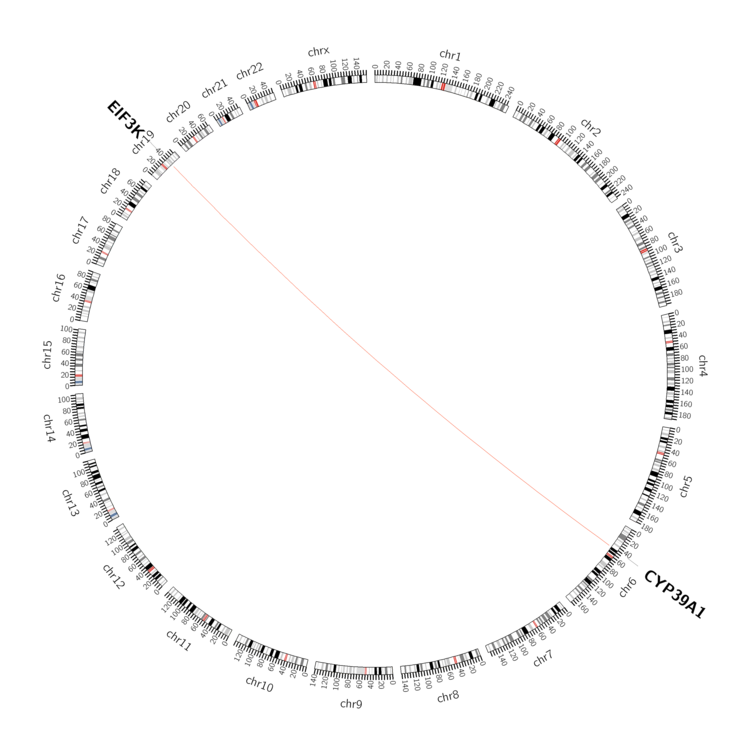 |
| - For Inter-chromosomal Variations |
| There's no inter-chromosomal structural variation. |
| - For Intra-chromosomal Variations |
| There's no intra-chromosomal structural variation. |
| Sample | Symbol_a | Chr_a | Start_a | End_a | Symbol_b | Chr_b | Start_b | End_b |
| cf) Tissue number; Tissue name (1;Breast, 2;Central_nervous_system, 3;Haematopoietic_and_lymphoid_tissue, 4;Large_intestine, 5;Liver, 6;Lung, 7;Ovary, 8;Pancreas, 9;Prostate, 10;Skin, 11;Soft_tissue, 12;Upper_aerodigestive_tract) |
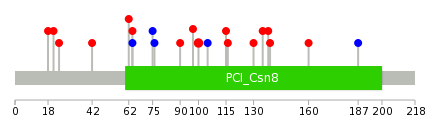
| * From mRNA Sanger sequences, Chitars2.0 arranged chimeric transcripts. This table shows EIF3K related fusion information. |
| ID | Head Gene | Tail Gene | Accession | Gene_a | qStart_a | qEnd_a | Chromosome_a | tStart_a | tEnd_a | Gene_a | qStart_a | qEnd_a | Chromosome_a | tStart_a | tEnd_a |
| AW084209 | EIF3K | 5 | 124 | 19 | 39125704 | 39127593 | PGK1 | 117 | 492 | X | 77372810 | 77378728 | |
| BE909212 | SLC45A1 | 1 | 164 | 1 | 8397948 | 8399611 | EIF3K | 164 | 576 | 19 | 39109846 | 39116742 | |
| AW498858 | EIF3K | 1 | 110 | 19 | 39114799 | 39116738 | STMN3 | 111 | 162 | 20 | 62271158 | 62271209 | |
| Top |
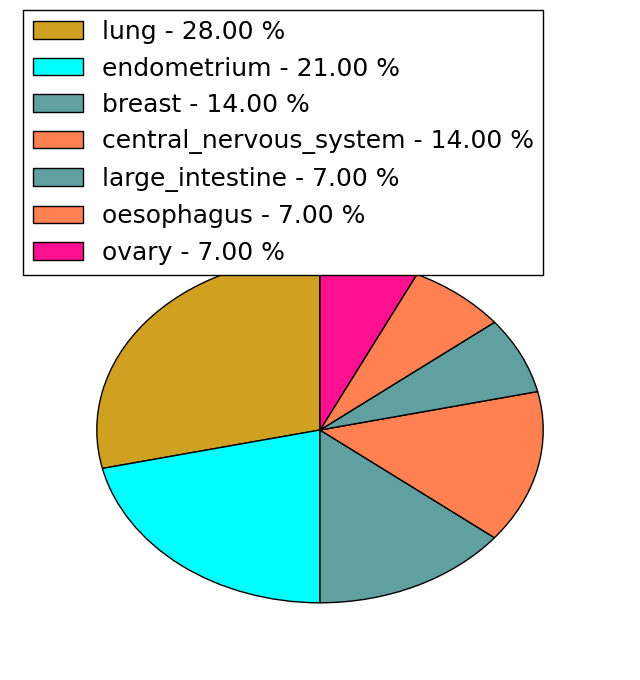
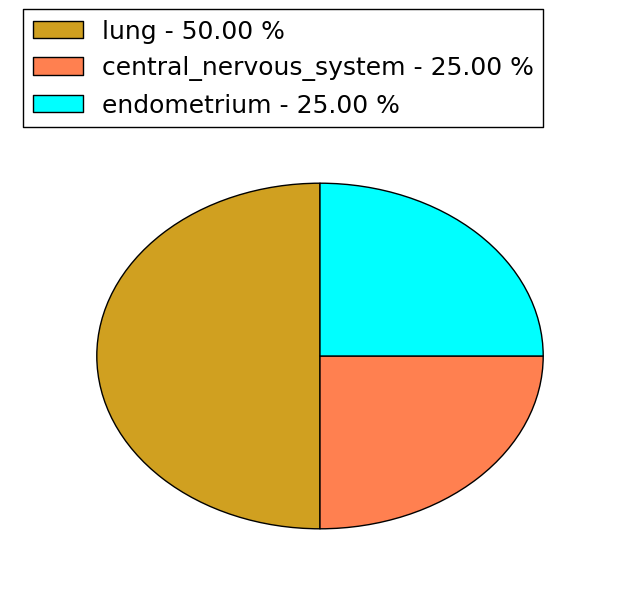
| Mutation type/ Tissue ID | brca | cns | cerv | endome | haematopo | kidn | Lintest | liver | lung | ns | ovary | pancre | prost | skin | stoma | thyro | urina | |||
| Total # sample | 1 | |||||||||||||||||||
| GAIN (# sample) | 1 | |||||||||||||||||||
| LOSS (# sample) |
| cf) Tissue ID; Tissue type (1; Breast, 2; Central_nervous_system, 3; Cervix, 4; Endometrium, 5; Haematopoietic_and_lymphoid_tissue, 6; Kidney, 7; Large_intestine, 8; Liver, 9; Lung, 10; NS, 11; Ovary, 12; Pancreas, 13; Prostate, 14; Skin, 15; Stomach, 16; Thyroid, 17; Urinary_tract) |
| Top |
|
 |
| Top |
| Stat. for Non-Synonymous SNVs (# total SNVs=14) | (# total SNVs=4) |
 |  |
(# total SNVs=2) | (# total SNVs=0) |
 |
| Top |
| * When you move the cursor on each content, you can see more deailed mutation information on the Tooltip. Those are primary_site,primary_histology,mutation(aa),pubmedID. |
| GRCh37 position | Mutation(aa) | Unique sampleID count |
| chr19:39116687-39116687 | p.R100Q | 2 |
| chr19:39114742-39114742 | p.Q62* | 2 |
| chr19:39116677-39116677 | p.R97W | 1 |
| chr19:39123298-39123298 | p.E160G | 1 |
| chr19:39110987-39110987 | p.E24Q | 1 |
| chr19:39125665-39125665 | p.G178fs*>41 | 1 |
| chr19:39111041-39111041 | p.Y42H | 1 |
| chr19:39116703-39116703 | p.L105L | 1 |
| chr19:39125694-39125694 | p.I187I | 1 |
| chr19:39111066-39111074 | p.L51_L53delLKL | 1 |
| Top |
|
 |
| Point Mutation/ Tissue ID | 1 | 2 | 3 | 4 | 5 | 6 | 7 | 8 | 9 | 10 | 11 | 12 | 13 | 14 | 15 | 16 | 17 | 18 | 19 | 20 |
| # sample | 1 | 1 | 3 | 1 | 2 | 3 | ||||||||||||||
| # mutation | 1 | 1 | 3 | 1 | 2 | 3 | ||||||||||||||
| nonsynonymous SNV | 1 | 1 | 2 | 1 | 1 | 2 | ||||||||||||||
| synonymous SNV | 1 | 1 | 1 |
| cf) Tissue ID; Tissue type (1; BLCA[Bladder Urothelial Carcinoma], 2; BRCA[Breast invasive carcinoma], 3; CESC[Cervical squamous cell carcinoma and endocervical adenocarcinoma], 4; COAD[Colon adenocarcinoma], 5; GBM[Glioblastoma multiforme], 6; Glioma Low Grade, 7; HNSC[Head and Neck squamous cell carcinoma], 8; KICH[Kidney Chromophobe], 9; KIRC[Kidney renal clear cell carcinoma], 10; KIRP[Kidney renal papillary cell carcinoma], 11; LAML[Acute Myeloid Leukemia], 12; LUAD[Lung adenocarcinoma], 13; LUSC[Lung squamous cell carcinoma], 14; OV[Ovarian serous cystadenocarcinoma ], 15; PAAD[Pancreatic adenocarcinoma], 16; PRAD[Prostate adenocarcinoma], 17; SKCM[Skin Cutaneous Melanoma], 18:STAD[Stomach adenocarcinoma], 19:THCA[Thyroid carcinoma], 20:UCEC[Uterine Corpus Endometrial Carcinoma]) |
| Top |
| * We represented just top 10 SNVs. When you move the cursor on each content, you can see more deailed mutation information on the Tooltip. Those are primary_site, primary_histology, mutation(aa), pubmedID. |
| Genomic Position | Mutation(aa) | Unique sampleID count |
| chr19:39116687 | p.R100Q | 2 |
| chr19:39114783 | p.T75T | 1 |
| chr19:39116703 | p.L105L | 1 |
| chr19:39116732 | p.Q115R | 1 |
| chr19:39116734 | p.A116S | 1 |
| chr19:39123104 | p.G130A | 1 |
| chr19:39123298 | p.E160G | 1 |
| chr19:39125694 | p.I187I | 1 |
| chr19:39109960 | p.I18V | 1 |
| chr19:39110987 | p.E24Q | 1 |
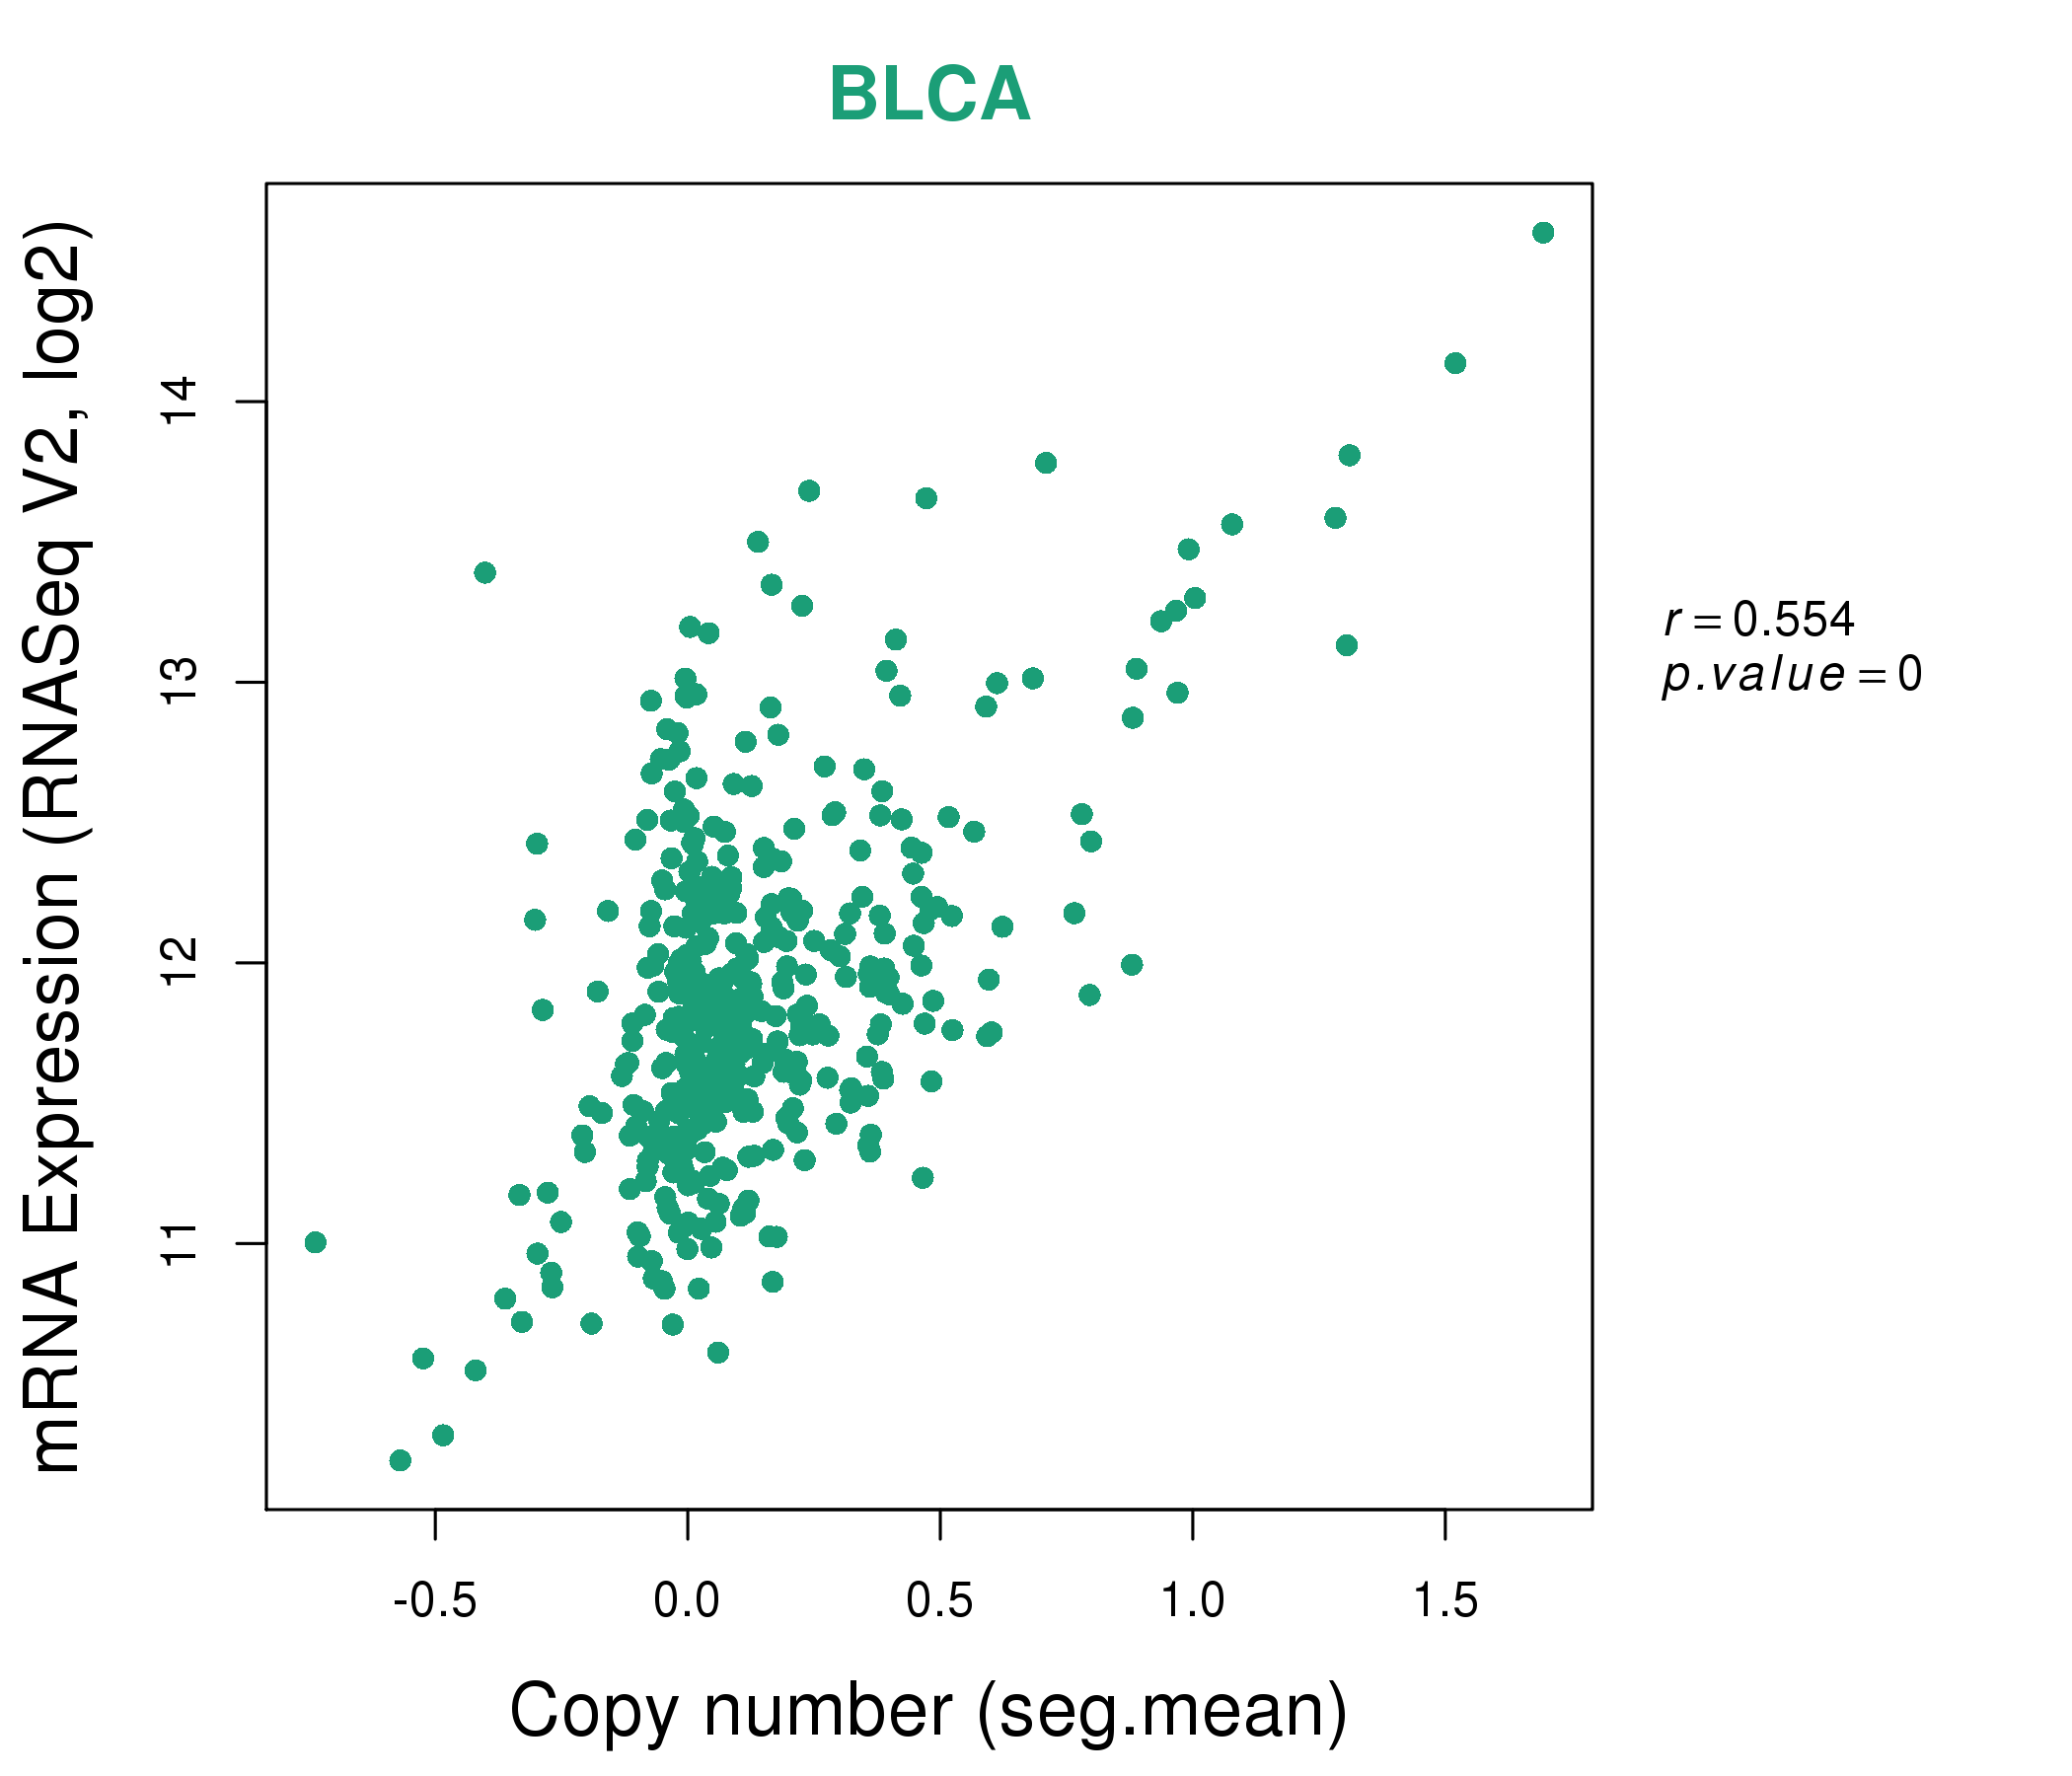
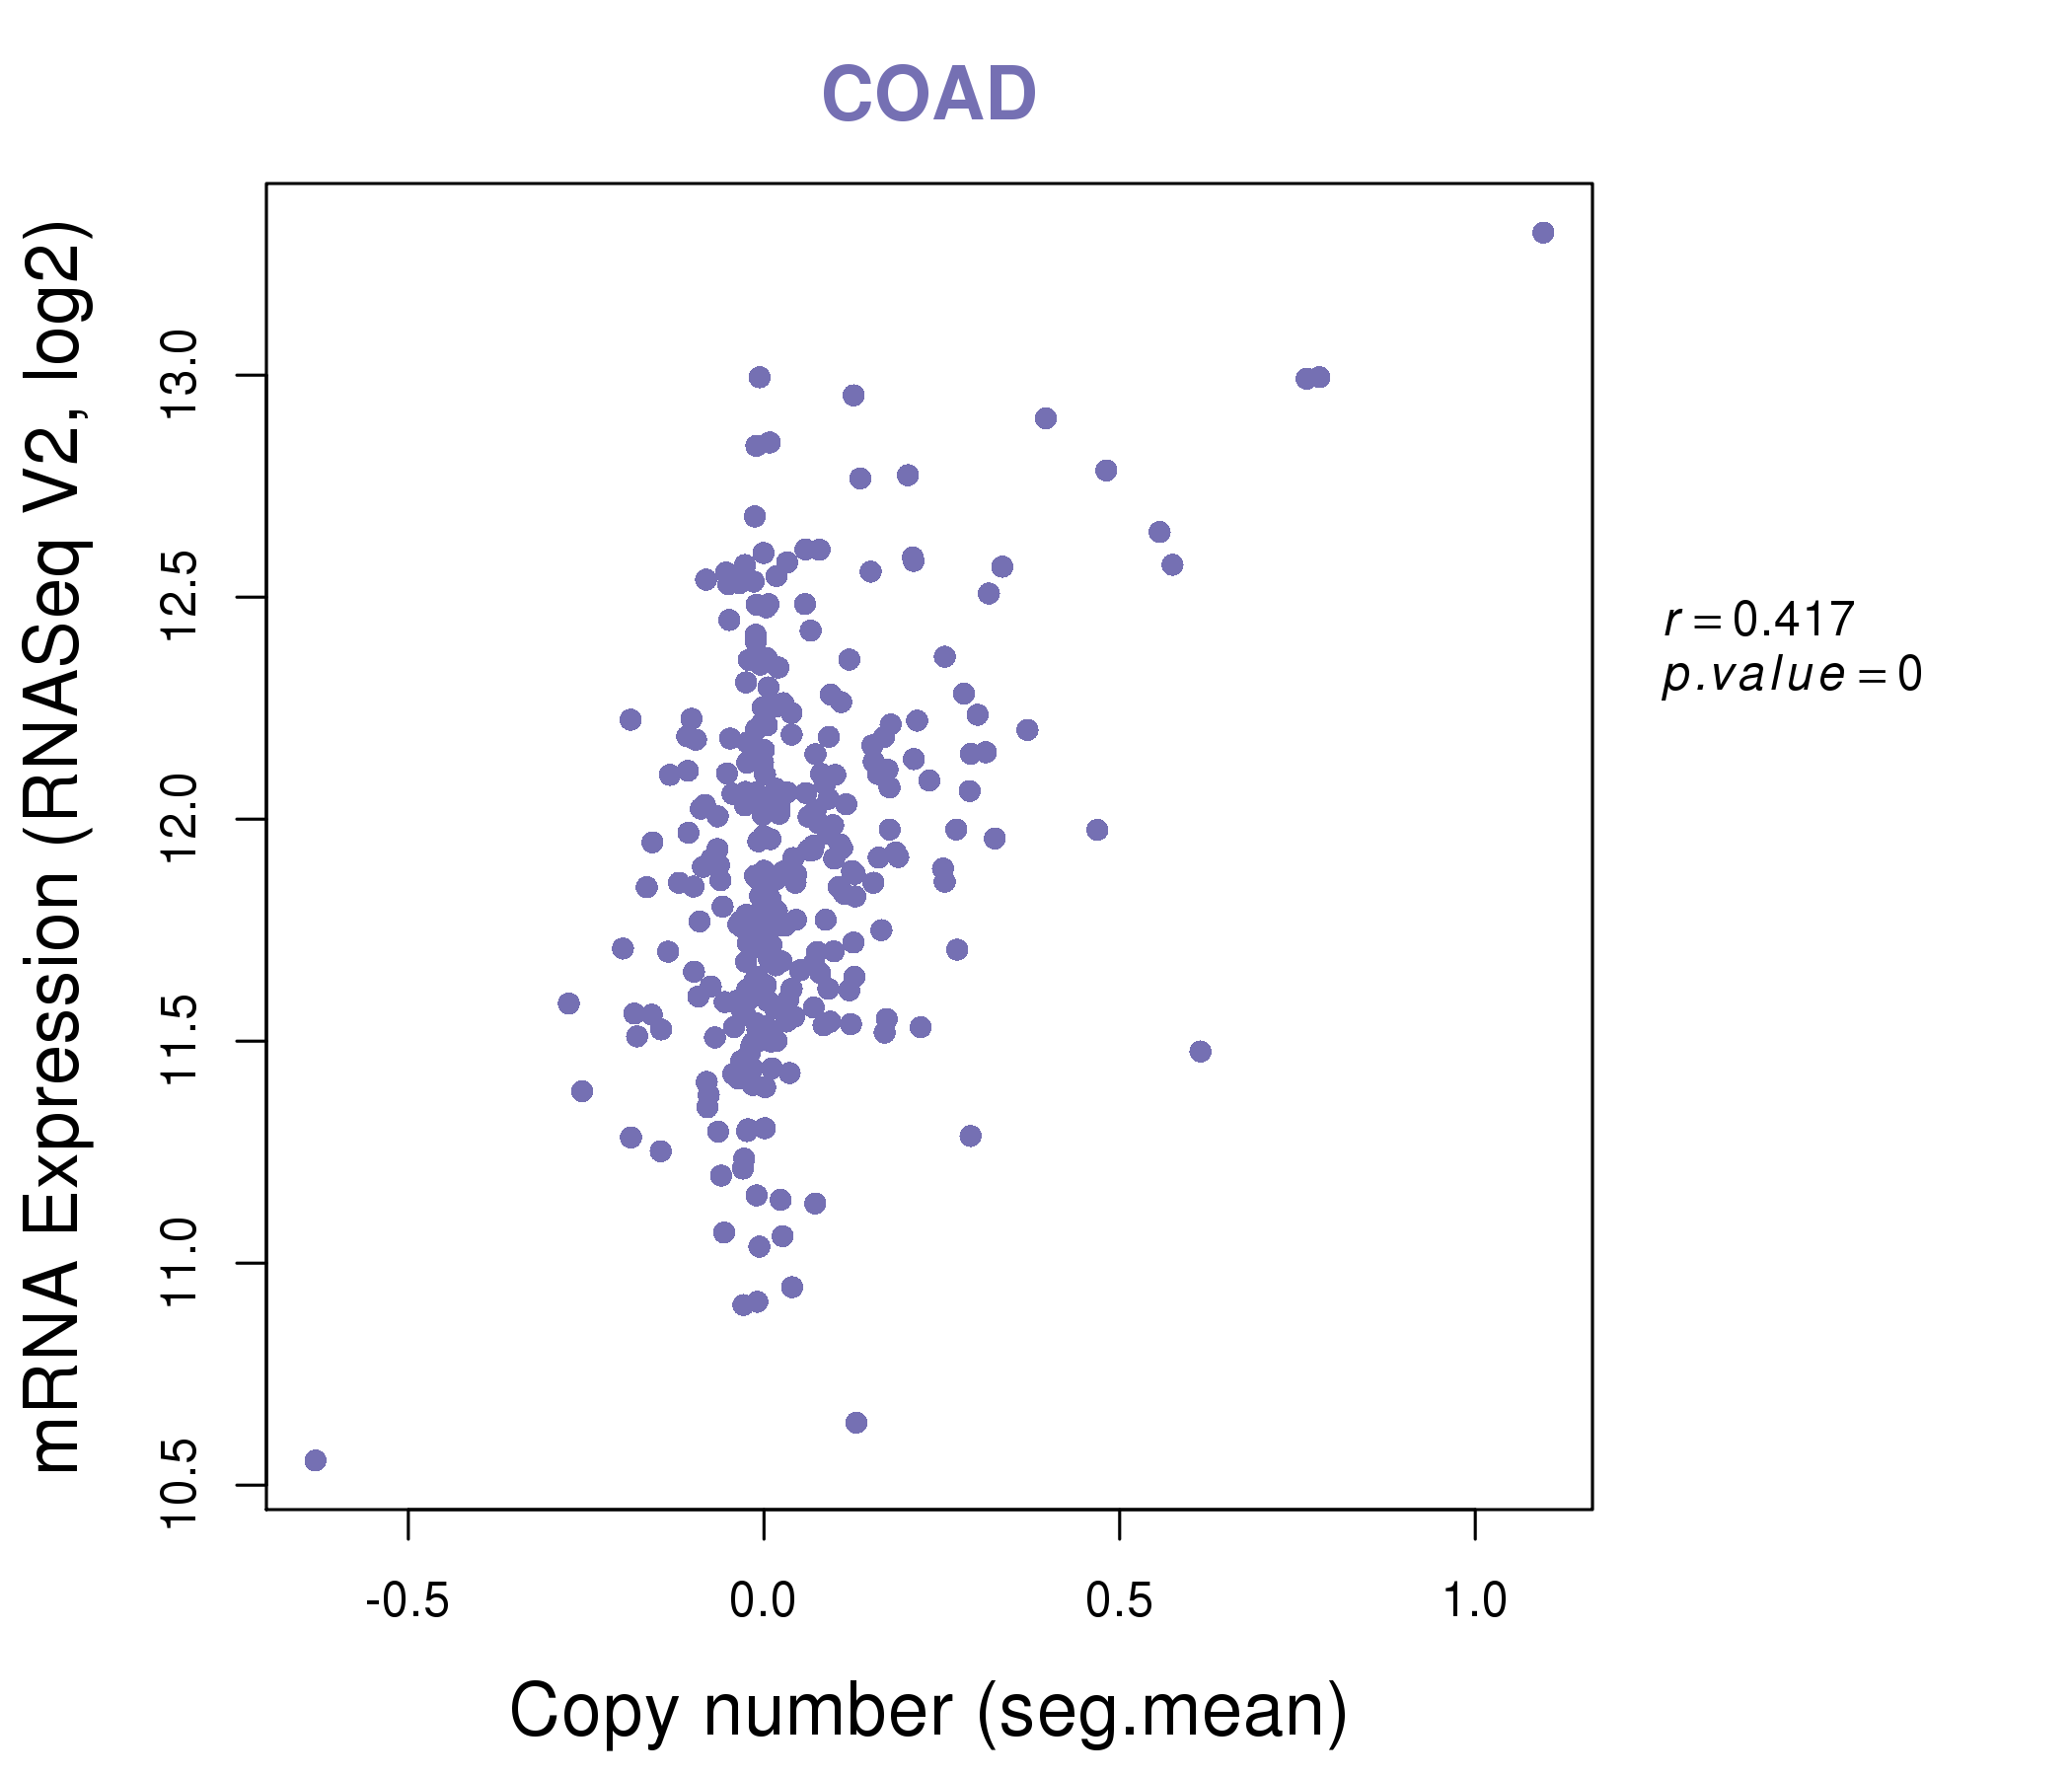
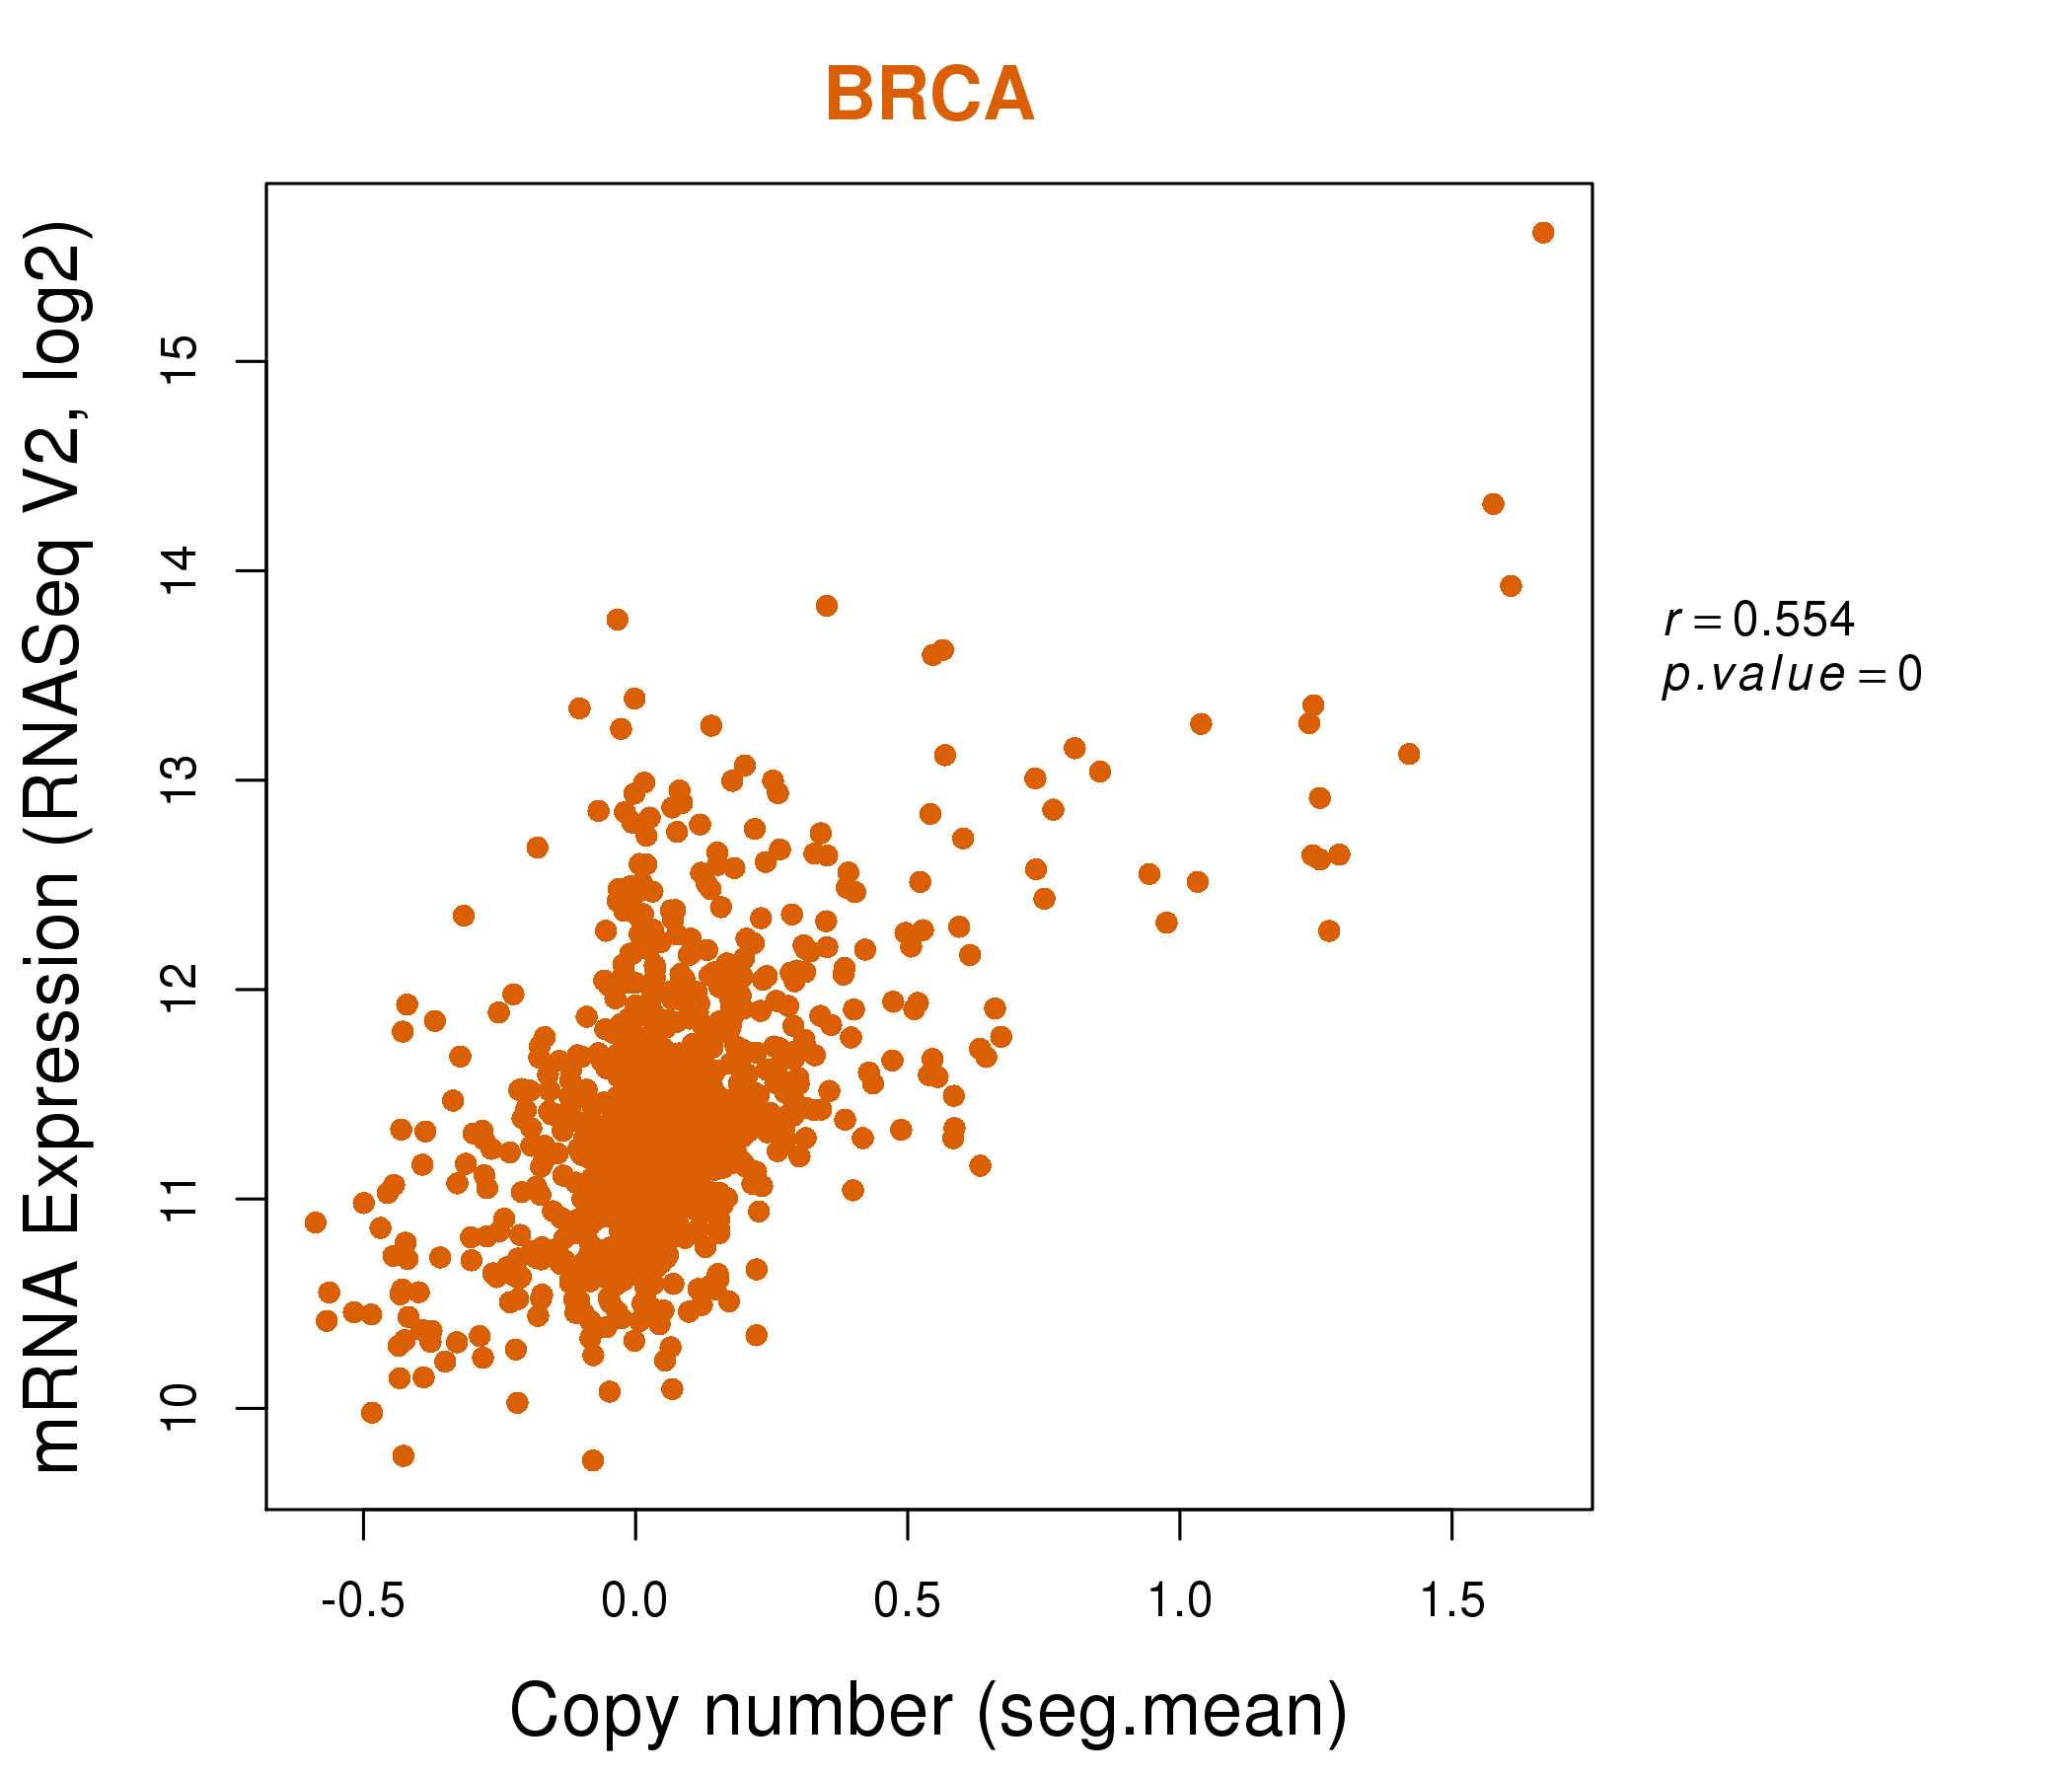
| * Copy number data were extracted from TCGA using R package TCGA-Assembler. The URLs of all public data files on TCGA DCC data server were gathered on Jan-05-2015. Function ProcessCNAData in TCGA-Assembler package was used to obtain gene-level copy number value which is calculated as the average copy number of the genomic region of a gene. |
 |
| cf) Tissue ID[Tissue type]: BLCA[Bladder Urothelial Carcinoma], BRCA[Breast invasive carcinoma], CESC[Cervical squamous cell carcinoma and endocervical adenocarcinoma], COAD[Colon adenocarcinoma], GBM[Glioblastoma multiforme], Glioma Low Grade, HNSC[Head and Neck squamous cell carcinoma], KICH[Kidney Chromophobe], KIRC[Kidney renal clear cell carcinoma], KIRP[Kidney renal papillary cell carcinoma], LAML[Acute Myeloid Leukemia], LUAD[Lung adenocarcinoma], LUSC[Lung squamous cell carcinoma], OV[Ovarian serous cystadenocarcinoma ], PAAD[Pancreatic adenocarcinoma], PRAD[Prostate adenocarcinoma], SKCM[Skin Cutaneous Melanoma], STAD[Stomach adenocarcinoma], THCA[Thyroid carcinoma], UCEC[Uterine Corpus Endometrial Carcinoma] |
| Top |
| Gene Expression for EIF3K |
| * CCLE gene expression data were extracted from CCLE_Expression_Entrez_2012-10-18.res: Gene-centric RMA-normalized mRNA expression data. |
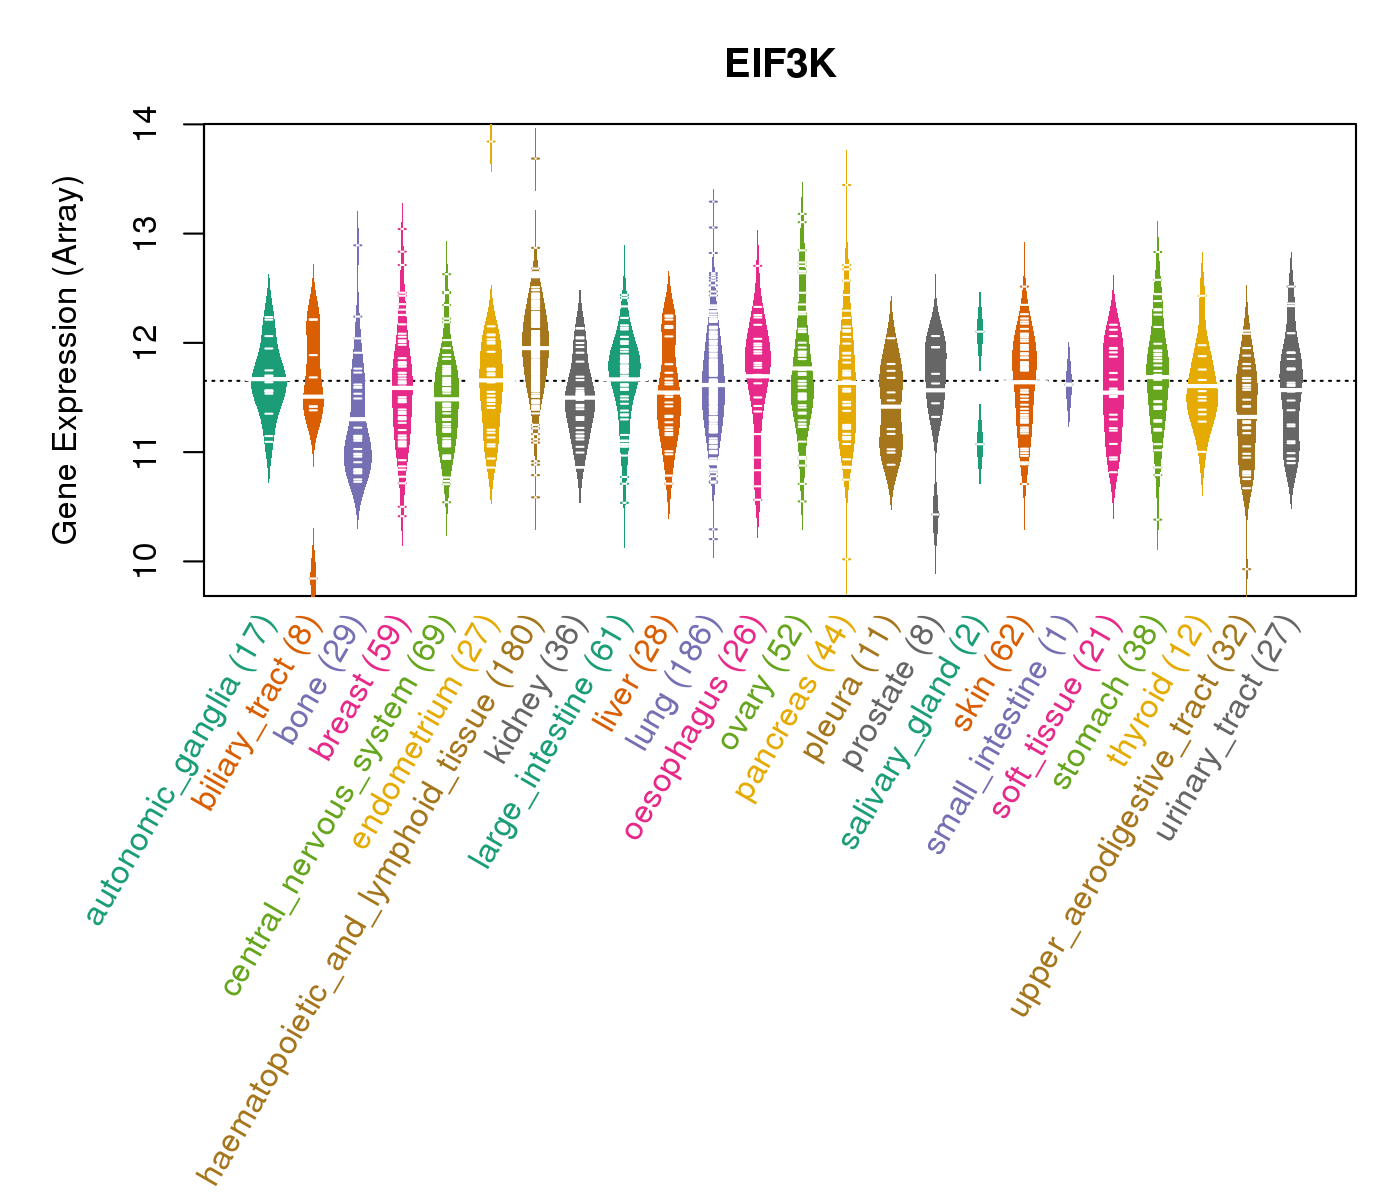 |
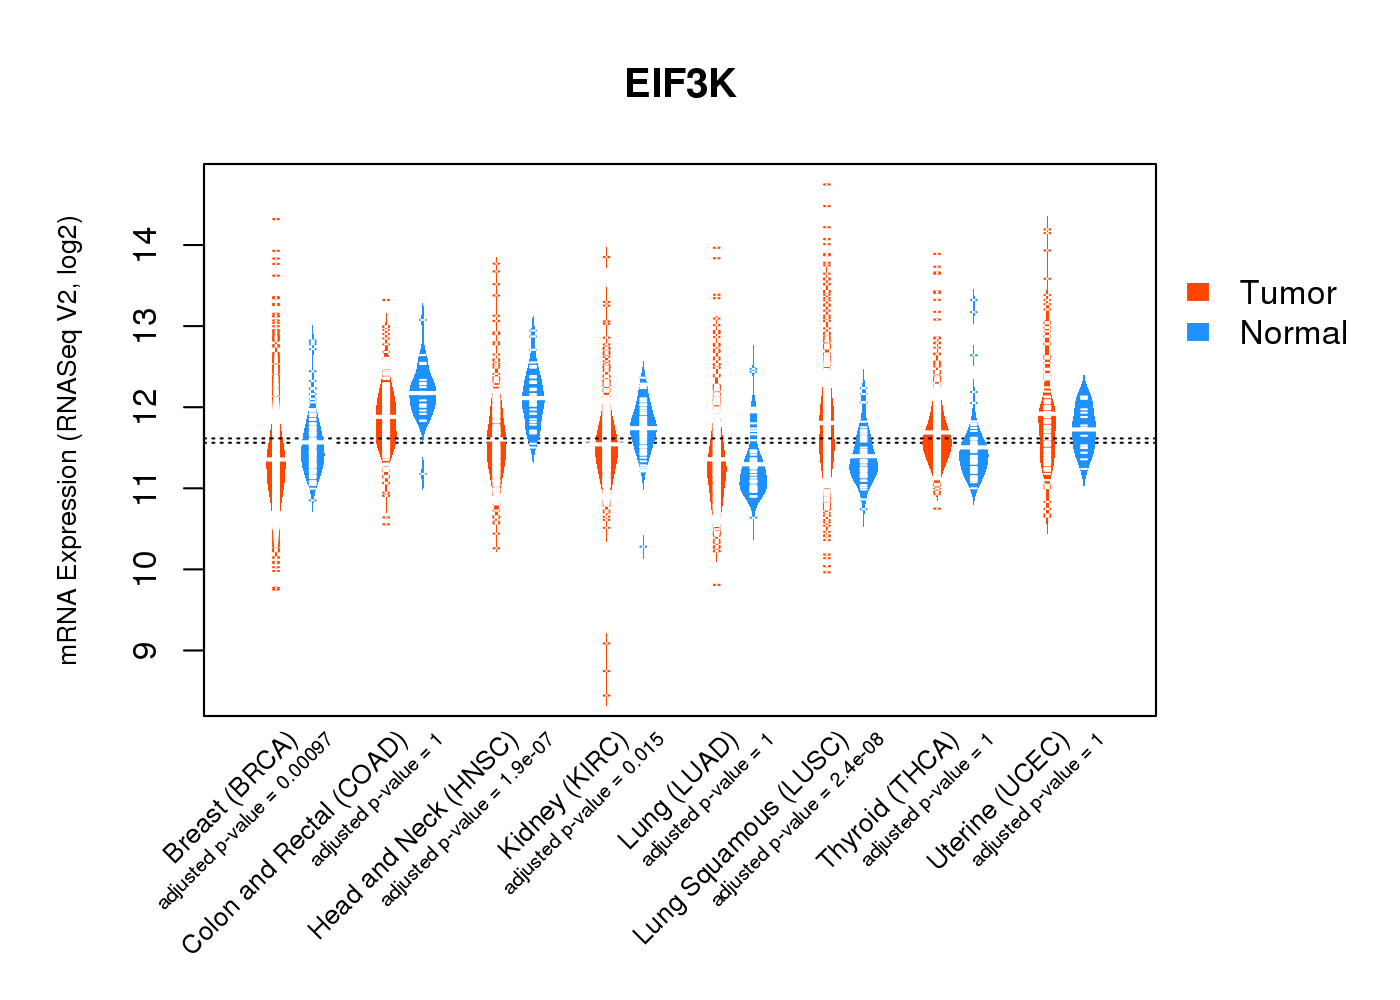
| * Normalized gene expression data of RNASeqV2 was extracted from TCGA using R package TCGA-Assembler. The URLs of all public data files on TCGA DCC data server were gathered at Jan-05-2015. Only eight cancer types have enough normal control samples for differential expression analysis. (t test, adjusted p<0.05 (using Benjamini-Hochberg FDR)) |
 |
| Top |
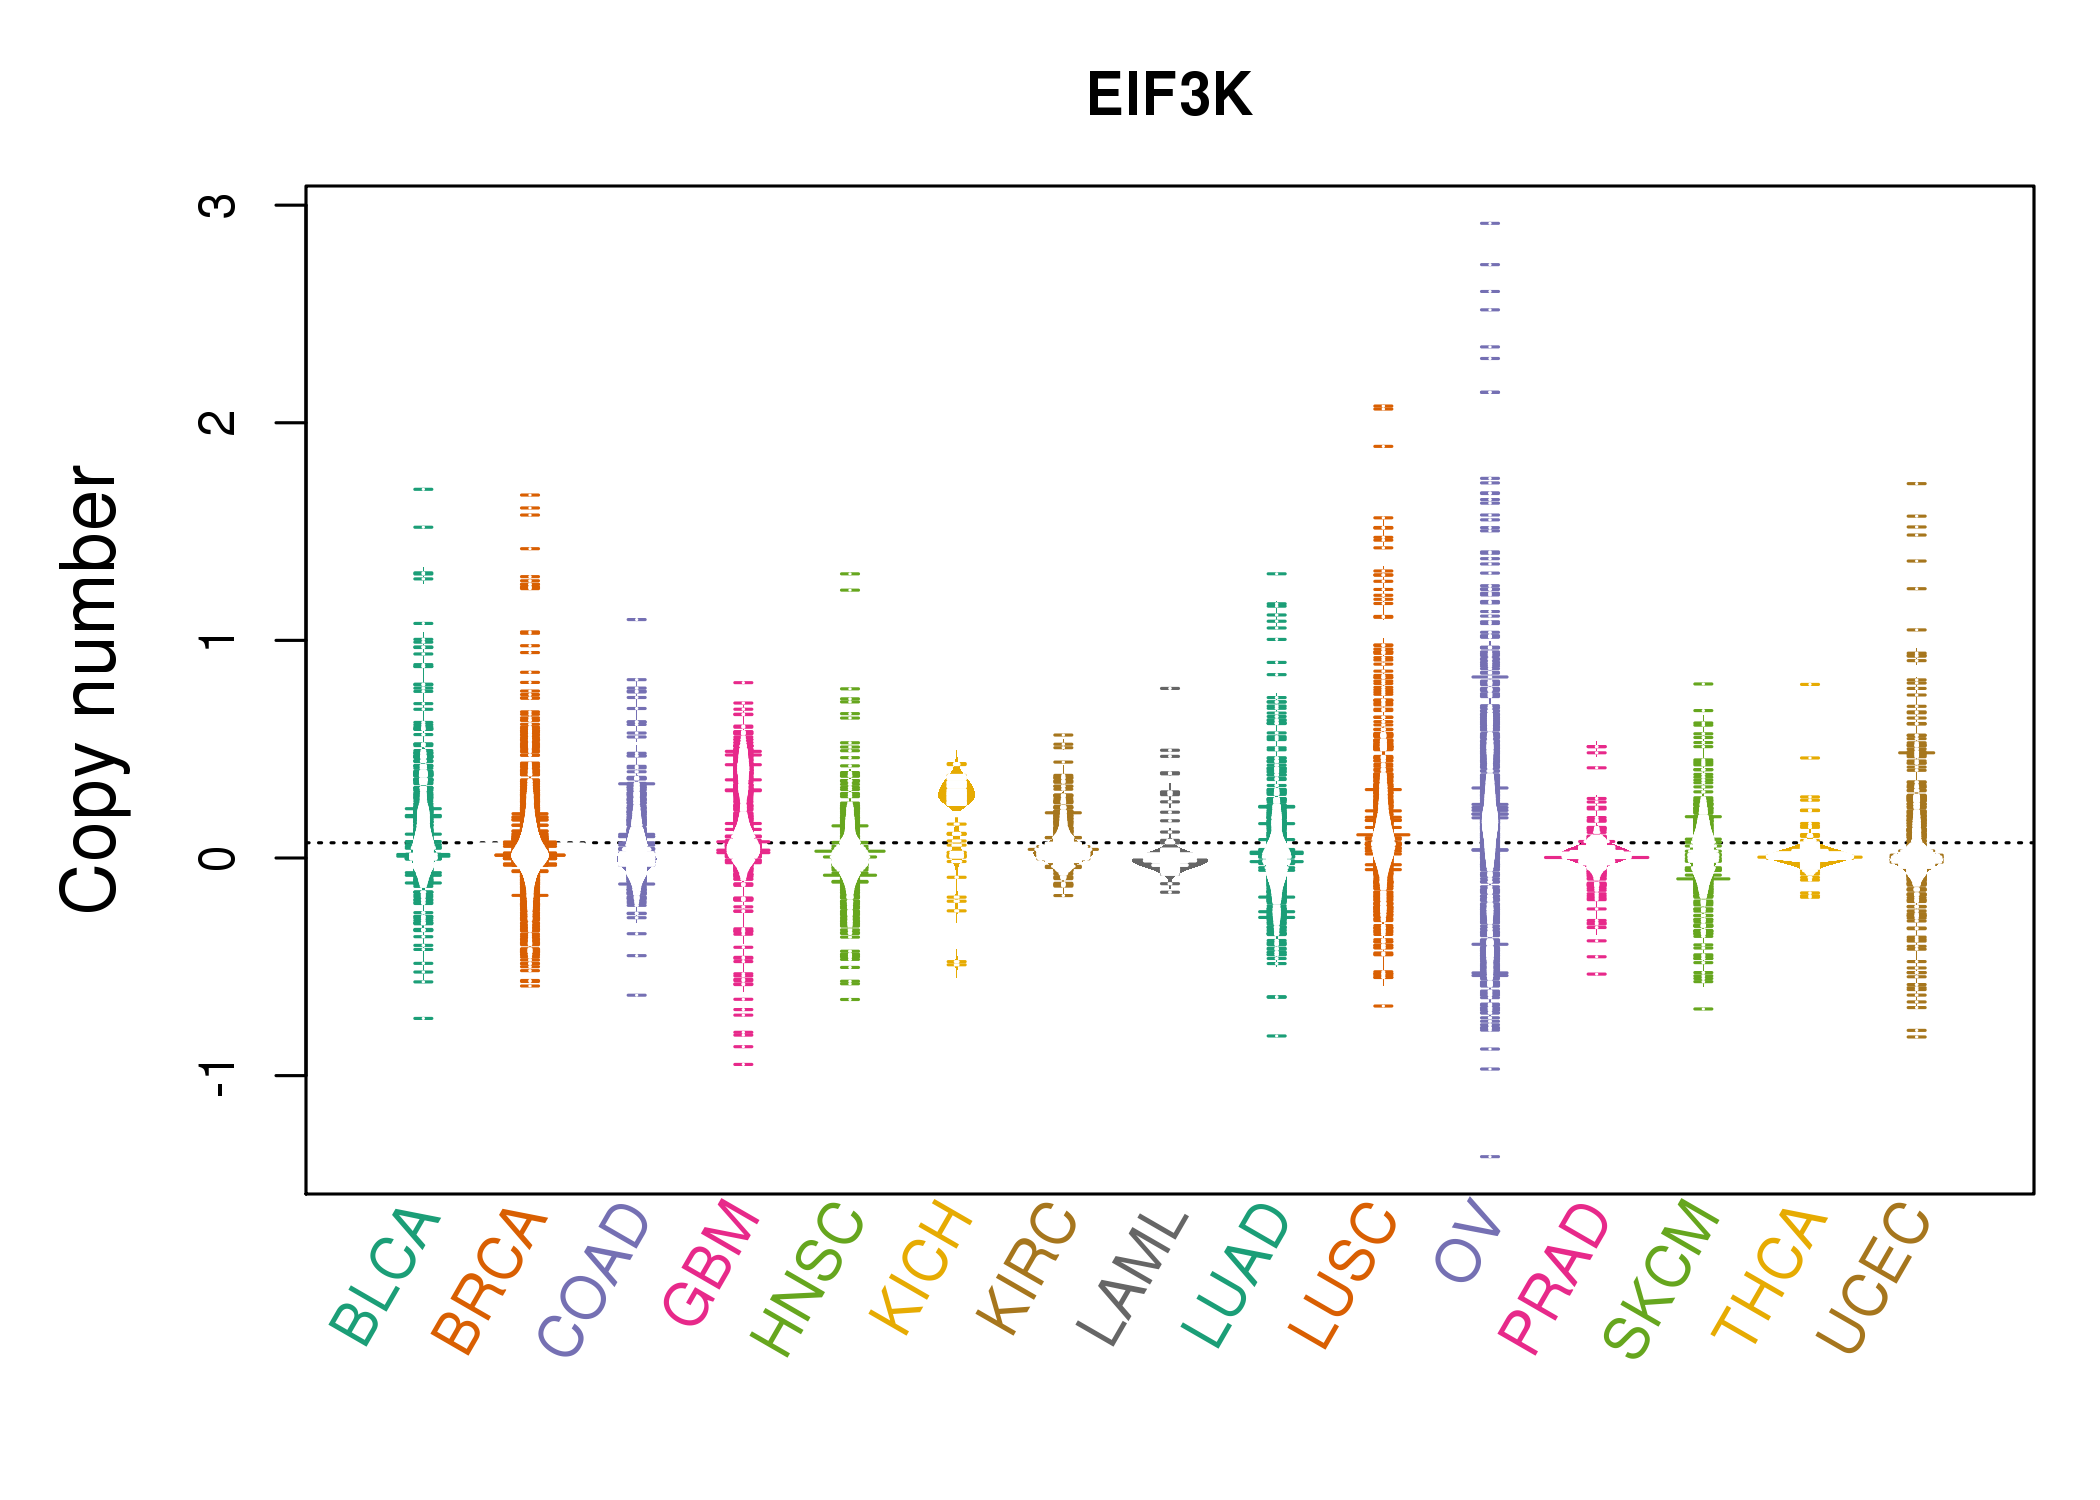
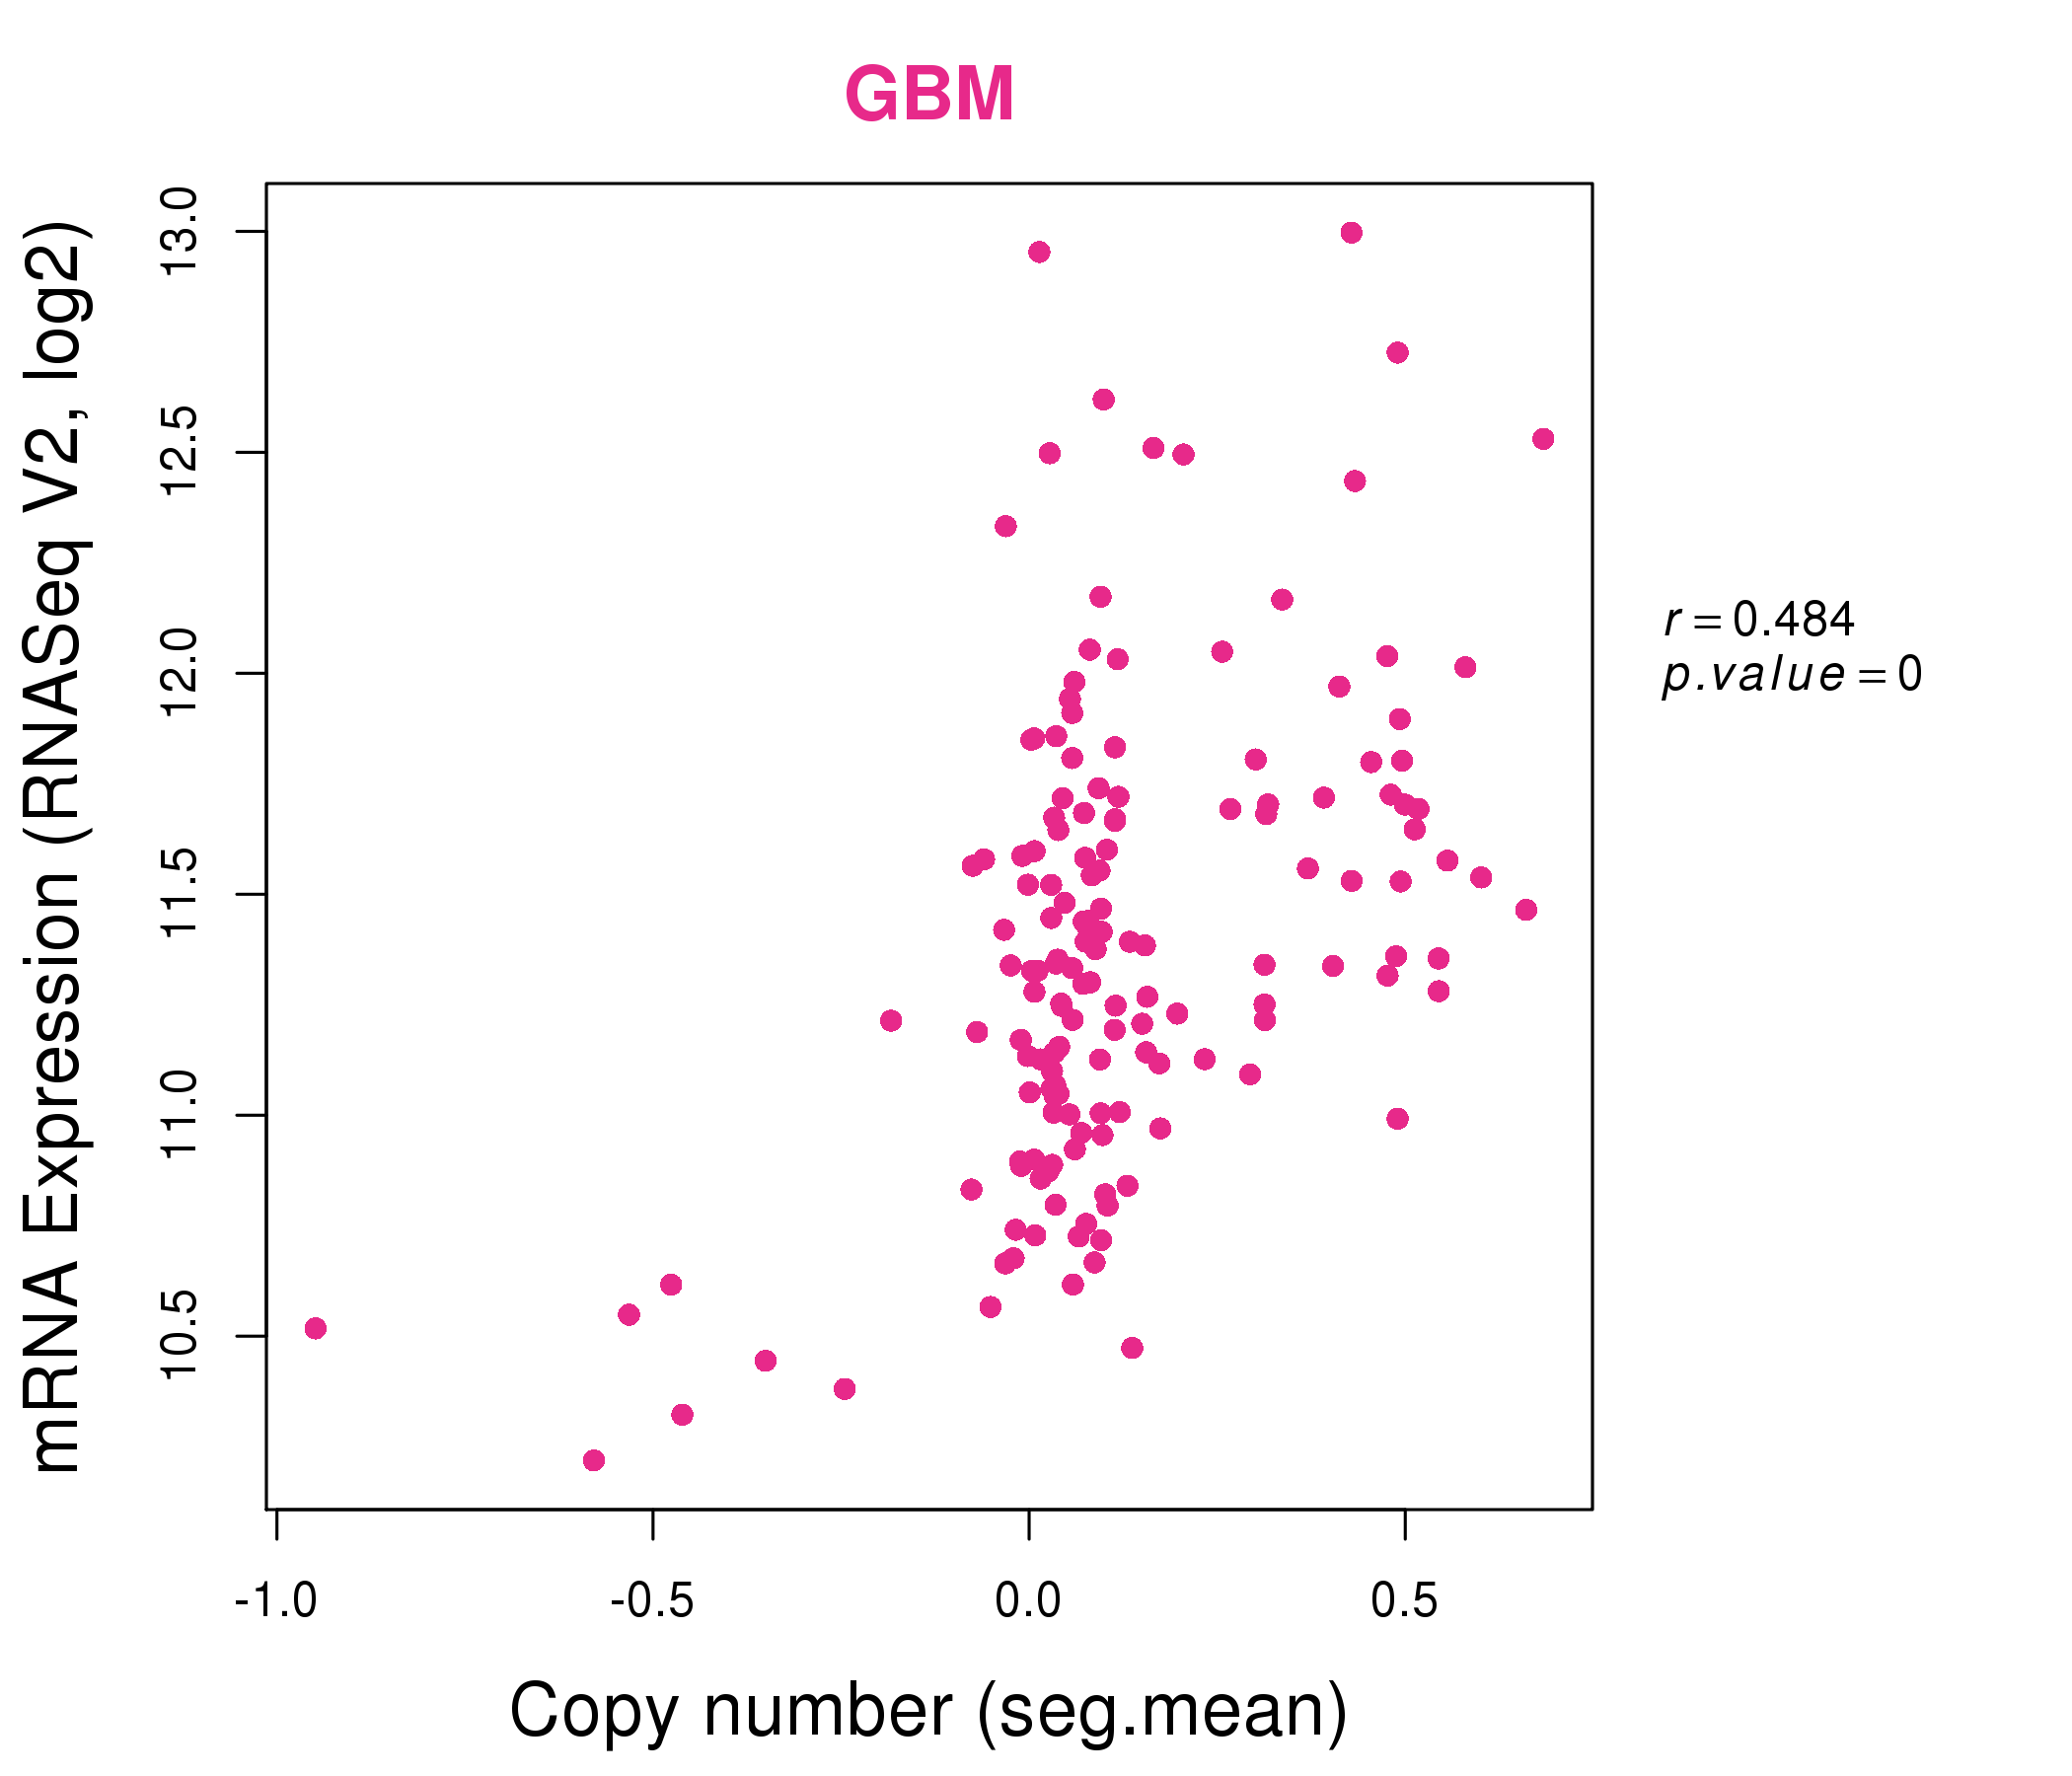
| * This plots show the correlation between CNV and gene expression. |
: Open all plots for all cancer types
 |
|
 |
|
| Top |
| Gene-Gene Network Information |
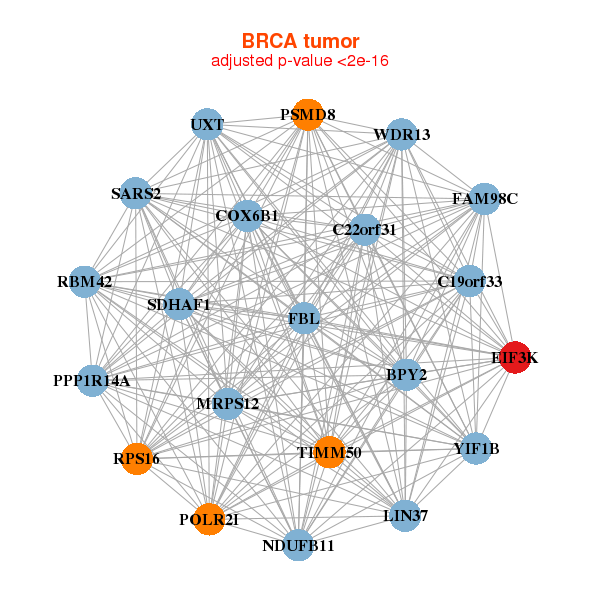
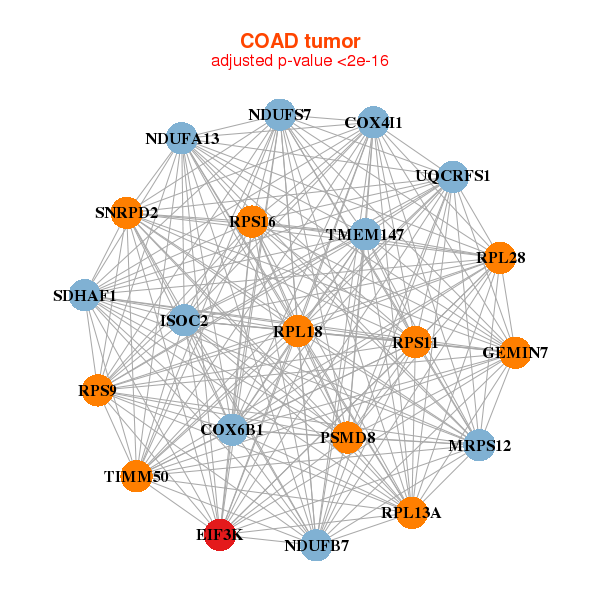
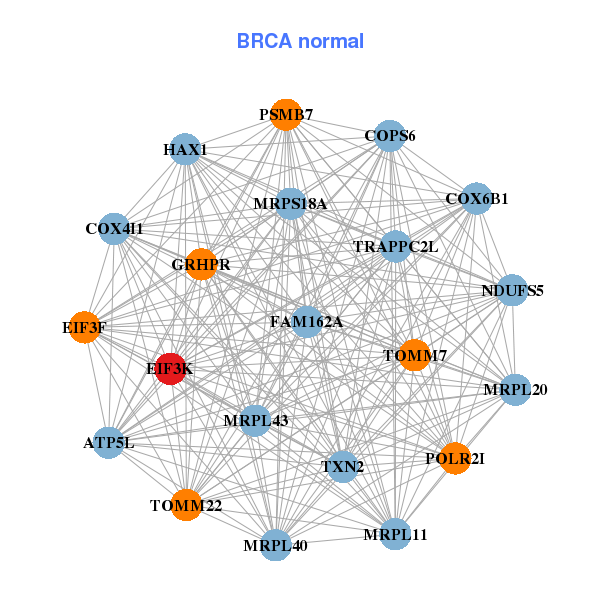
| * Co-Expression network figures were drawn using R package igraph. Only the top 20 genes with the highest correlations were shown. Red circle: input gene, orange circle: cell metabolism gene, sky circle: other gene |
: Open all plots for all cancer types
 |
|
| BPY2,C19orf33,C22orf31,COX6B1,EIF3K,FAM98C,FBL, LIN37,MRPS12,NDUFB11,POLR2I,PPP1R14A,PSMD8,RBM42, RPS16,SARS2,SDHAF1,TIMM50,UXT,WDR13,YIF1B | ATP5L,COPS6,COX4I1,COX6B1,EIF3F,EIF3K,FAM162A, GRHPR,HAX1,MRPL11,MRPL20,MRPL40,MRPL43,MRPS18A, NDUFS5,POLR2I,PSMB7,TOMM22,TOMM7,TRAPPC2L,TXN2 |
 |
|
| COX4I1,COX6B1,EIF3K,GEMIN7,ISOC2,MRPS12,NDUFA13, NDUFB7,NDUFS7,PSMD8,RPL13A,RPL18,RPL28,RPS11, RPS16,RPS9,SDHAF1,SNRPD2,TIMM50,TMEM147,UQCRFS1 | ATP5O,C19orf70,COX4I1,CYC1,DIABLO,EIF3K,MRPL11, MRPL15,MRPL27,NDUFA11,NDUFAB1,NDUFB4,NDUFB7,NDUFB9, NDUFS3,PHB2,NELFE,TXN2,UQCR10,UQCRH,ZNHIT1 |
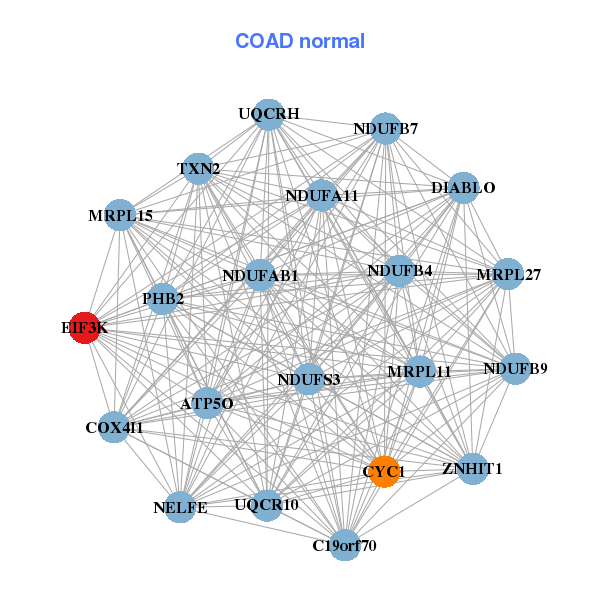
| * Co-Expression network figures were drawn using R package igraph. Only the top 20 genes with the highest correlations were shown. Red circle: input gene, orange circle: cell metabolism gene, sky circle: other gene |
: Open all plots for all cancer types
| Top |
: Open all interacting genes' information including KEGG pathway for all interacting genes from DAVID
| Top |
| Pharmacological Information for EIF3K |
| There's no related Drug. |
| Top |
| Cross referenced IDs for EIF3K |
| * We obtained these cross-references from Uniprot database. It covers 150 different DBs, 18 categories. http://www.uniprot.org/help/cross_references_section |
: Open all cross reference information
|
Copyright © 2016-Present - The Univsersity of Texas Health Science Center at Houston @ |