|
||||||||||||||||||||||||||||||||||||||||||||||||||||||||||||||||||||||||||||||||||||||||||||||||||||||||||||||||||||||||||||||||||||||||||||||||||||||||||||||||||||||||||||||||||||||||||||||||||||||||||||||||||||||||||||||||||||||||||||||||||||||||||||||||||||||||||||||||||||||||||||||||||||||||||||||||||||||||||
| |
| Phenotypic Information (metabolism pathway, cancer, disease, phenome) |
| |
| |
| Gene-Gene Network Information: Co-Expression Network, Interacting Genes & KEGG |
| |
|


| Gene Summary for MAT2B |
| Basic gene info. | Gene symbol | MAT2B |
| Gene name | methionine adenosyltransferase II, beta | |
| Synonyms | MAT-II|MATIIbeta|Nbla02999|SDR23E1|TGR | |
| Cytomap | UCSC genome browser: 5q34-q35 | |
| Genomic location | chr5 :162932584-162946328 | |
| Type of gene | protein-coding | |
| RefGenes | NM_013283.4, NM_182796.2, | |
| Ensembl id | ENSG00000038274 | |
| Description | MAT II betabeta regulatory subunit of methionine adenosyltransferasedTDP-4-keto-6-deoxy-D-glucose 4-reductasemethionine adenosyltransferase 2 subunit betaputative dTDP-4-keto-6-deoxy-D-glucose 4-reductaseputative protein product of Nbla02999short ch | |
| Modification date | 20141207 | |
| dbXrefs | MIM : 605527 | |
| HGNC : HGNC | ||
| Ensembl : ENSG00000038274 | ||
| HPRD : 05701 | ||
| Vega : OTTHUMG00000130379 | ||
| Protein | UniProt: go to UniProt's Cross Reference DB Table | |
| Expression | CleanEX: HS_MAT2B | |
| BioGPS: 27430 | ||
| Gene Expression Atlas: ENSG00000038274 | ||
| The Human Protein Atlas: ENSG00000038274 | ||
| Pathway | NCI Pathway Interaction Database: MAT2B | |
| KEGG: MAT2B | ||
| REACTOME: MAT2B | ||
| ConsensusPathDB | ||
| Pathway Commons: MAT2B | ||
| Metabolism | MetaCyc: MAT2B | |
| HUMANCyc: MAT2B | ||
| Regulation | Ensembl's Regulation: ENSG00000038274 | |
| miRBase: chr5 :162,932,584-162,946,328 | ||
| TargetScan: NM_013283 | ||
| cisRED: ENSG00000038274 | ||
| Context | iHOP: MAT2B | |
| cancer metabolism search in PubMed: MAT2B | ||
| UCL Cancer Institute: MAT2B | ||
| Assigned class in ccmGDB | C | |
| Top |
| Phenotypic Information for MAT2B(metabolism pathway, cancer, disease, phenome) |
| Cancer | CGAP: MAT2B |
| Familial Cancer Database: MAT2B | |
| * This gene is included in those cancer gene databases. |
|
|
|
|
|
|
| ||||||||||||||||||||||||||||||||||||||||||||||||||||||||||||||||||||||||||||||||||||||||||||||||||||||||||||||||||||||||||||||||||||||||||||||||||||||||||||||||||||||||||||||||||||||||||||||||||||||||||||||||||||||||||||||||||||||||||||||||||||||||||||||||||||||||||||||||||||||||||||||||||||||||||||||||||||
Oncogene 1 | Significant driver gene in | |||||||||||||||||||||||||||||||||||||||||||||||||||||||||||||||||||||||||||||||||||||||||||||||||||||||||||||||||||||||||||||||||||||||||||||||||||||||||||||||||||||||||||||||||||||||||||||||||||||||||||||||||||||||||||||||||||||||||||||||||||||||||||||||||||||||||||||||||||||||||||||||||||||||||||||||||||||||||
| cf) number; DB name 1 Oncogene; http://nar.oxfordjournals.org/content/35/suppl_1/D721.long, 2 Tumor Suppressor gene; https://bioinfo.uth.edu/TSGene/, 3 Cancer Gene Census; http://www.nature.com/nrc/journal/v4/n3/abs/nrc1299.html, 4 CancerGenes; http://nar.oxfordjournals.org/content/35/suppl_1/D721.long, 5 Network of Cancer Gene; http://ncg.kcl.ac.uk/index.php, 1Therapeutic Vulnerabilities in Cancer; http://cbio.mskcc.org/cancergenomics/statius/ |
| KEGG_CYSTEINE_AND_METHIONINE_METABOLISM KEGG_SELENOAMINO_ACID_METABOLISM REACTOME_SULFUR_AMINO_ACID_METABOLISM REACTOME_METABOLISM_OF_AMINO_ACIDS_AND_DERIVATIVES | |
| OMIM | |
| Orphanet | |
| Disease | KEGG Disease: MAT2B |
| MedGen: MAT2B (Human Medical Genetics with Condition) | |
| ClinVar: MAT2B | |
| Phenotype | MGI: MAT2B (International Mouse Phenotyping Consortium) |
| PhenomicDB: MAT2B | |
| Mutations for MAT2B |
| * Under tables are showing count per each tissue to give us broad intuition about tissue specific mutation patterns.You can go to the detailed page for each mutation database's web site. |
| There's no structural variation information in COSMIC data for this gene. |
| * From mRNA Sanger sequences, Chitars2.0 arranged chimeric transcripts. This table shows MAT2B related fusion information. |
| ID | Head Gene | Tail Gene | Accession | Gene_a | qStart_a | qEnd_a | Chromosome_a | tStart_a | tEnd_a | Gene_a | qStart_a | qEnd_a | Chromosome_a | tStart_a | tEnd_a |
| BP259408 | S100A13 | 1 | 302 | 1 | 153600914 | 153604262 | MAT2B | 297 | 382 | 5 | 162939116 | 162939201 | |
| Top |
| Mutation type/ Tissue ID | brca | cns | cerv | endome | haematopo | kidn | Lintest | liver | lung | ns | ovary | pancre | prost | skin | stoma | thyro | urina | |||
| Total # sample | 1 | 1 | ||||||||||||||||||
| GAIN (# sample) | 1 | |||||||||||||||||||
| LOSS (# sample) | 1 |
| cf) Tissue ID; Tissue type (1; Breast, 2; Central_nervous_system, 3; Cervix, 4; Endometrium, 5; Haematopoietic_and_lymphoid_tissue, 6; Kidney, 7; Large_intestine, 8; Liver, 9; Lung, 10; NS, 11; Ovary, 12; Pancreas, 13; Prostate, 14; Skin, 15; Stomach, 16; Thyroid, 17; Urinary_tract) |
| Top |
|
 |
| Top |
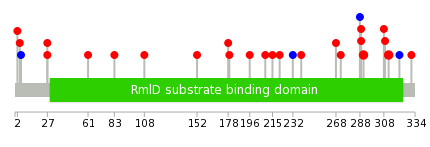
| Stat. for Non-Synonymous SNVs (# total SNVs=34) | (# total SNVs=3) |
 |  |
(# total SNVs=0) | (# total SNVs=0) |
| Top |
| * When you move the cursor on each content, you can see more deailed mutation information on the Tooltip. Those are primary_site,primary_histology,mutation(aa),pubmedID. |
| GRCh37 position | Mutation(aa) | Unique sampleID count |
| chr5:162945299-162945299 | p.R301Q | 4 |
| chr5:162944660-162944660 | p.P261S | 2 |
| chr5:162939192-162939192 | p.H72R | 2 |
| chr5:162940613-162940613 | p.N93I | 2 |
| chr5:162945236-162945236 | p.R280I | 2 |
| chr5:162943705-162943705 | p.E225E | 2 |
| chr5:162943544-162943544 | p.P172S | 1 |
| chr5:162944654-162944654 | p.N259Y | 1 |
| chr5:162945327-162945327 | p.P310P | 1 |
| chr5:162939191-162939191 | p.H72N | 1 |
| Top |
|
 |
| Point Mutation/ Tissue ID | 1 | 2 | 3 | 4 | 5 | 6 | 7 | 8 | 9 | 10 | 11 | 12 | 13 | 14 | 15 | 16 | 17 | 18 | 19 | 20 |
| # sample | 1 | 5 | 2 | 4 | 1 | 3 | 4 | 9 | ||||||||||||
| # mutation | 1 | 5 | 2 | 4 | 1 | 3 | 4 | 10 | ||||||||||||
| nonsynonymous SNV | 1 | 5 | 4 | 1 | 3 | 2 | 10 | |||||||||||||
| synonymous SNV | 2 | 2 |
| cf) Tissue ID; Tissue type (1; BLCA[Bladder Urothelial Carcinoma], 2; BRCA[Breast invasive carcinoma], 3; CESC[Cervical squamous cell carcinoma and endocervical adenocarcinoma], 4; COAD[Colon adenocarcinoma], 5; GBM[Glioblastoma multiforme], 6; Glioma Low Grade, 7; HNSC[Head and Neck squamous cell carcinoma], 8; KICH[Kidney Chromophobe], 9; KIRC[Kidney renal clear cell carcinoma], 10; KIRP[Kidney renal papillary cell carcinoma], 11; LAML[Acute Myeloid Leukemia], 12; LUAD[Lung adenocarcinoma], 13; LUSC[Lung squamous cell carcinoma], 14; OV[Ovarian serous cystadenocarcinoma ], 15; PAAD[Pancreatic adenocarcinoma], 16; PRAD[Prostate adenocarcinoma], 17; SKCM[Skin Cutaneous Melanoma], 18:STAD[Stomach adenocarcinoma], 19:THCA[Thyroid carcinoma], 20:UCEC[Uterine Corpus Endometrial Carcinoma]) |
| Top |
| * We represented just top 10 SNVs. When you move the cursor on each content, you can see more deailed mutation information on the Tooltip. Those are primary_site, primary_histology, mutation(aa), pubmedID. |
| Genomic Position | Mutation(aa) | Unique sampleID count |
| chr5:162945236 | p.R291I,MAT2B | 2 |
| chr5:162945299 | p.R312Q,MAT2B | 2 |
| chr5:162944660 | p.P27H,MAT2B | 1 |
| chr5:162940930 | p.R289C,MAT2B | 1 |
| chr5:162945228 | p.R61I,MAT2B | 1 |
| chr5:162943529 | p.R289H,MAT2B | 1 |
| chr5:162945229 | p.H83N,MAT2B | 1 |
| chr5:162943532 | p.A108S,MAT2B | 1 |
| chr5:162945230 | p.R308Q,MAT2B | 1 |
| chr5:162930404 | p.I152M,MAT2B | 1 |
| * Copy number data were extracted from TCGA using R package TCGA-Assembler. The URLs of all public data files on TCGA DCC data server were gathered on Jan-05-2015. Function ProcessCNAData in TCGA-Assembler package was used to obtain gene-level copy number value which is calculated as the average copy number of the genomic region of a gene. |
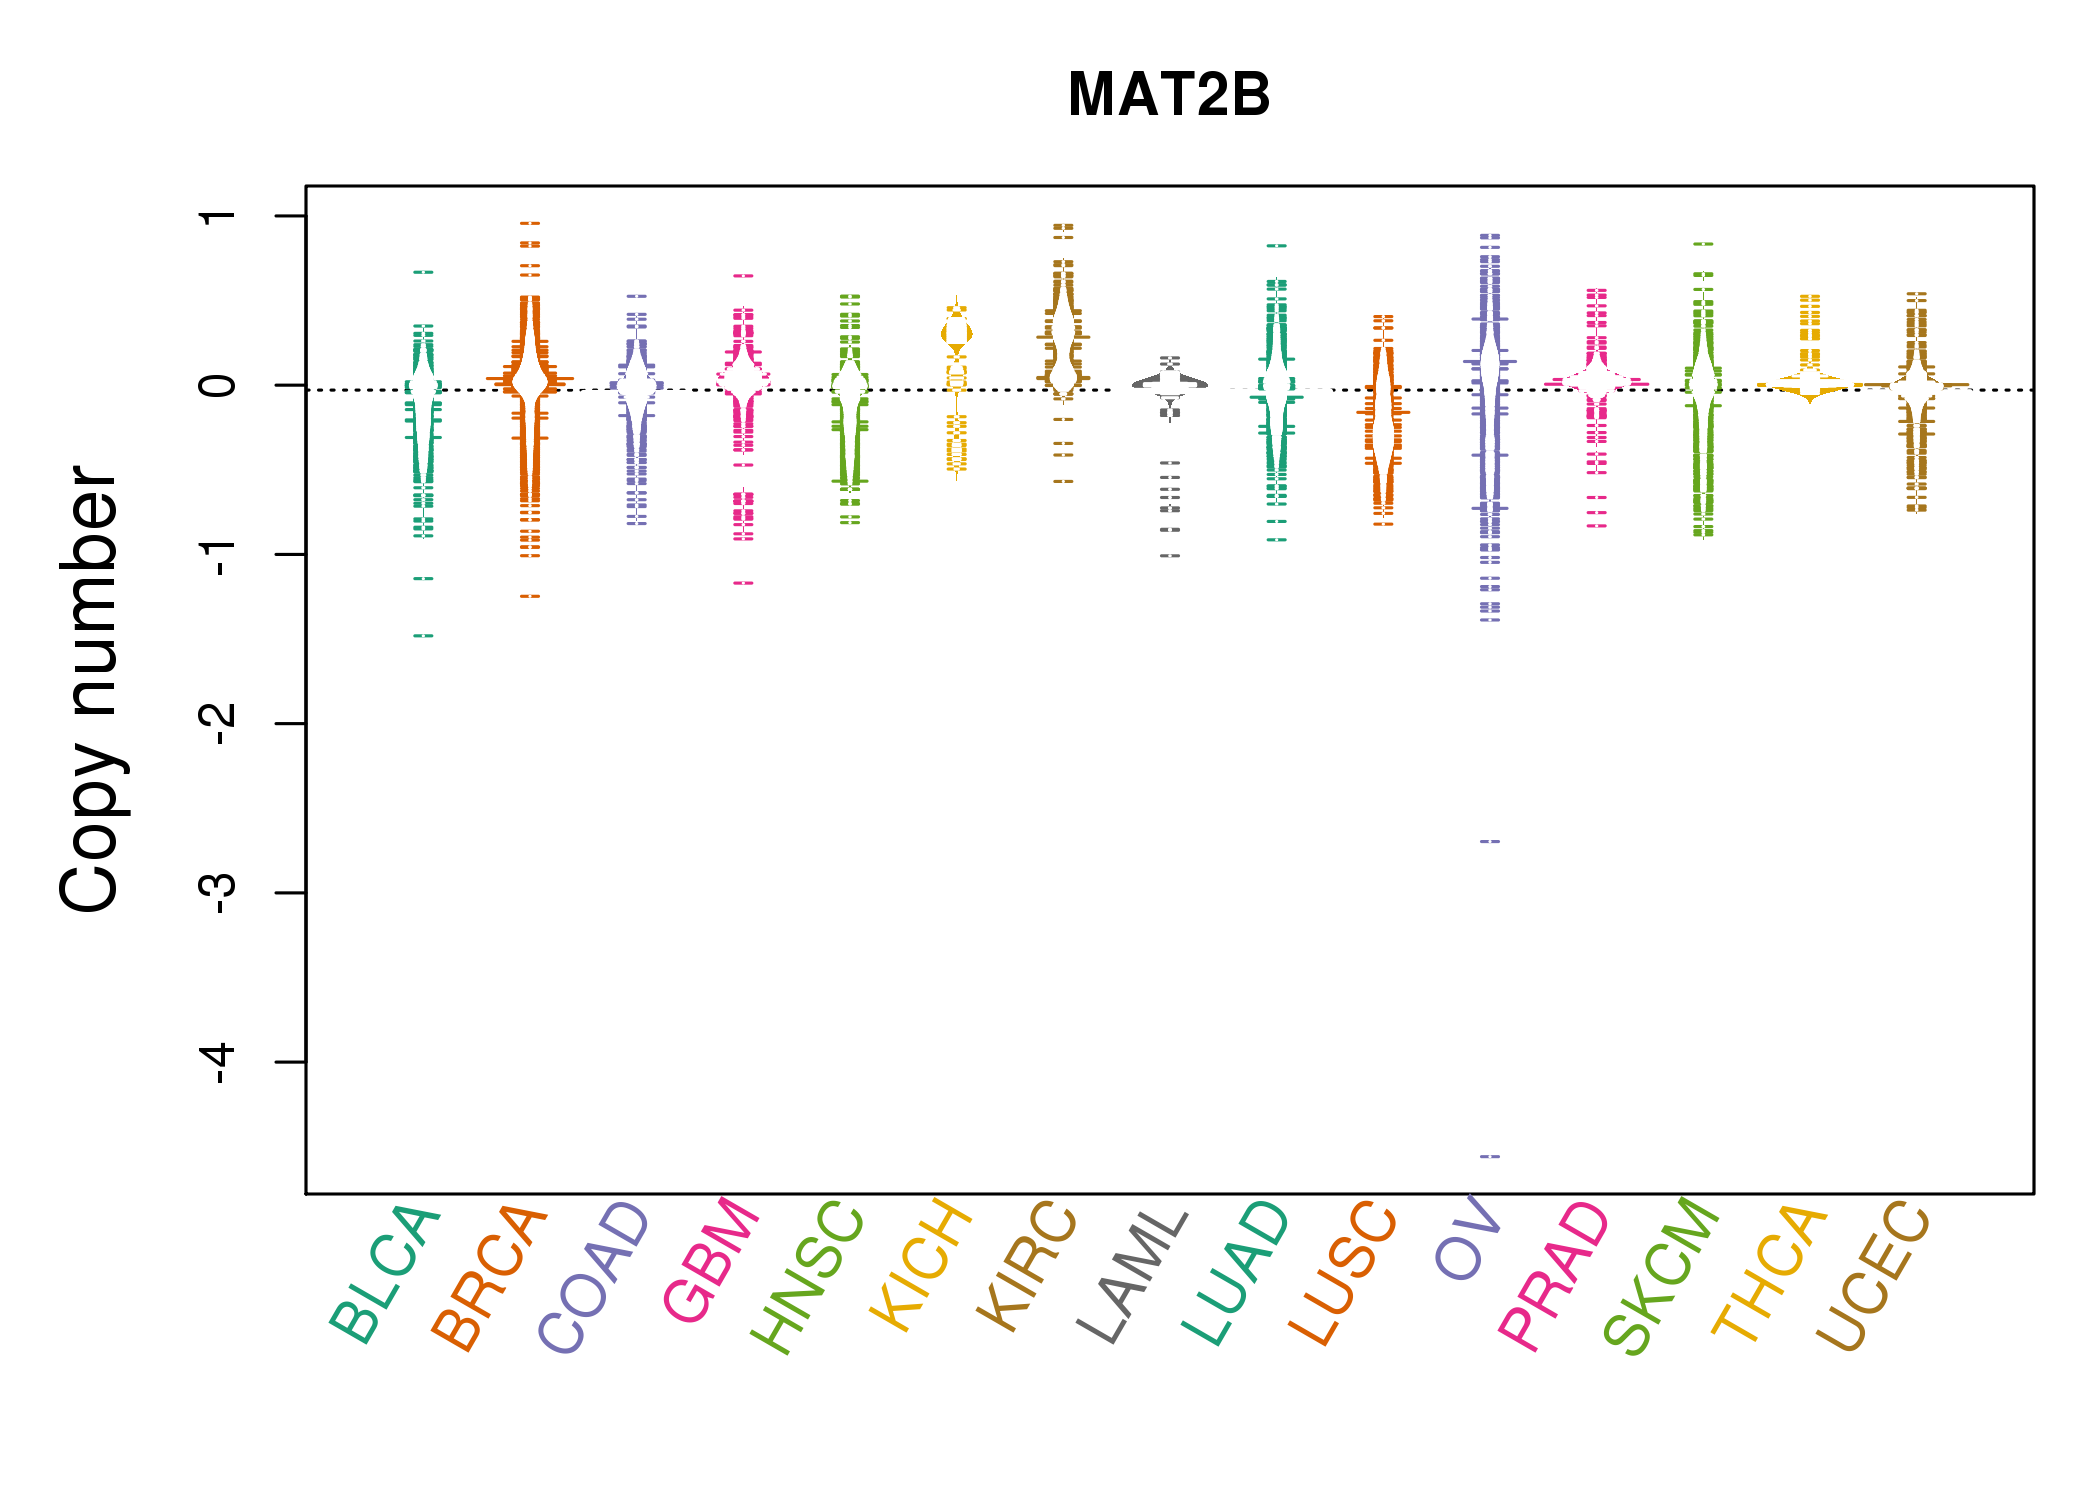 |
| cf) Tissue ID[Tissue type]: BLCA[Bladder Urothelial Carcinoma], BRCA[Breast invasive carcinoma], CESC[Cervical squamous cell carcinoma and endocervical adenocarcinoma], COAD[Colon adenocarcinoma], GBM[Glioblastoma multiforme], Glioma Low Grade, HNSC[Head and Neck squamous cell carcinoma], KICH[Kidney Chromophobe], KIRC[Kidney renal clear cell carcinoma], KIRP[Kidney renal papillary cell carcinoma], LAML[Acute Myeloid Leukemia], LUAD[Lung adenocarcinoma], LUSC[Lung squamous cell carcinoma], OV[Ovarian serous cystadenocarcinoma ], PAAD[Pancreatic adenocarcinoma], PRAD[Prostate adenocarcinoma], SKCM[Skin Cutaneous Melanoma], STAD[Stomach adenocarcinoma], THCA[Thyroid carcinoma], UCEC[Uterine Corpus Endometrial Carcinoma] |
| Top |
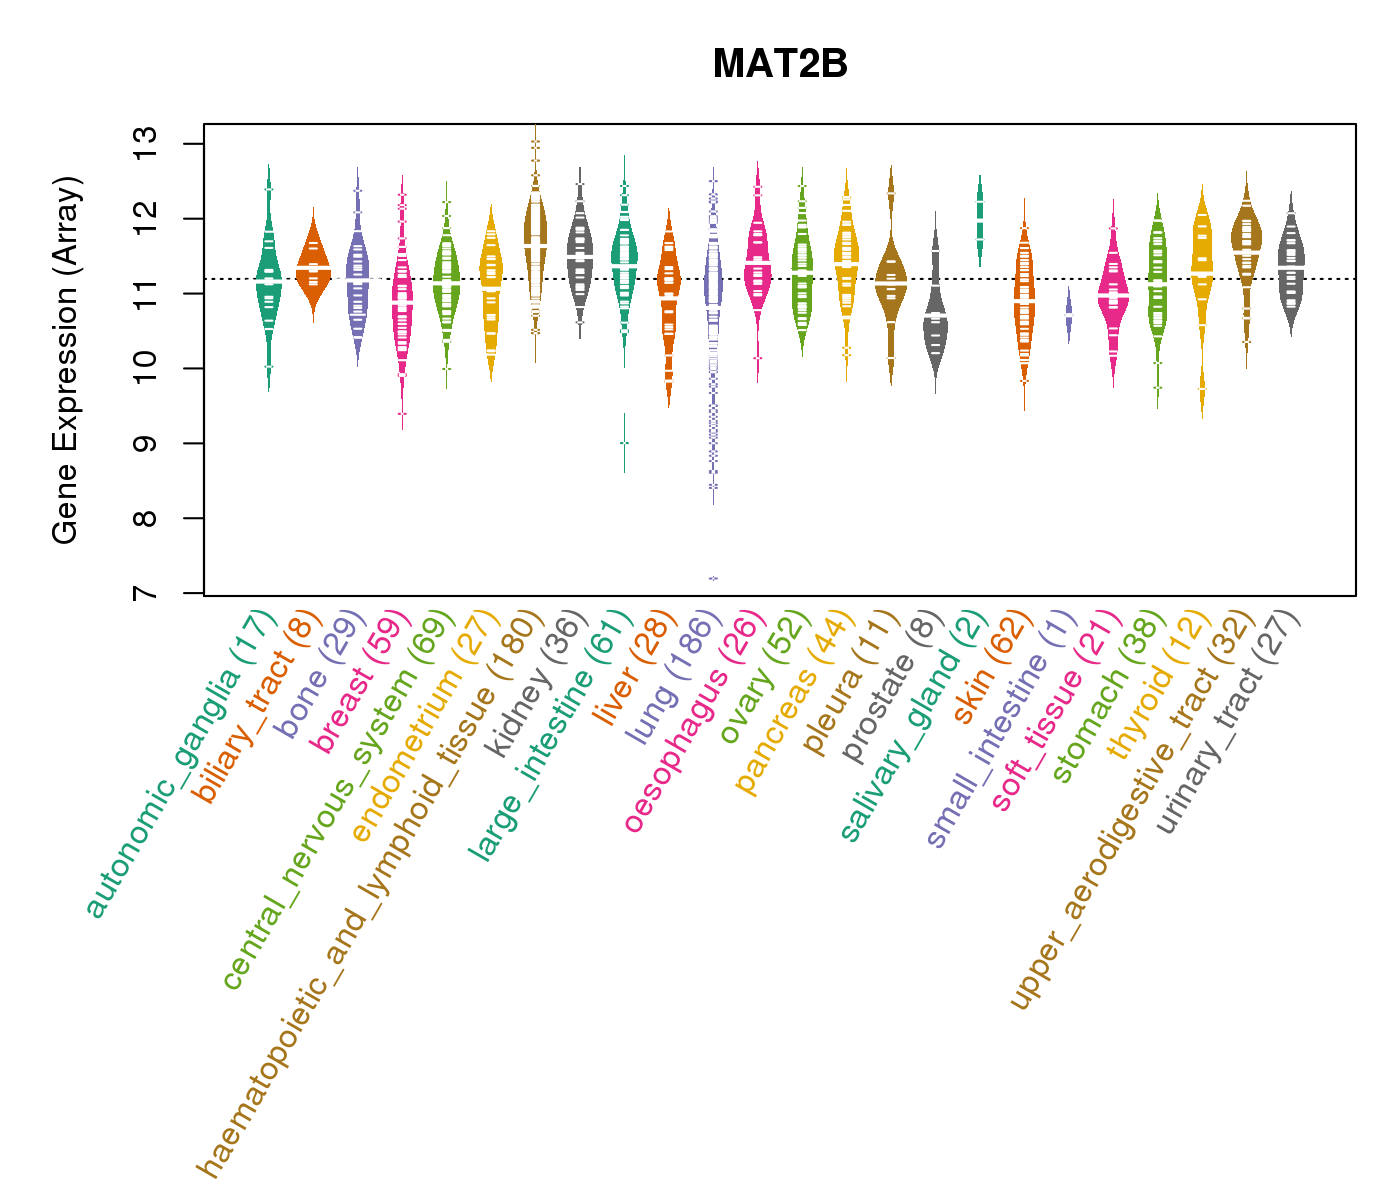
| Gene Expression for MAT2B |
| * CCLE gene expression data were extracted from CCLE_Expression_Entrez_2012-10-18.res: Gene-centric RMA-normalized mRNA expression data. |
 |
| * Normalized gene expression data of RNASeqV2 was extracted from TCGA using R package TCGA-Assembler. The URLs of all public data files on TCGA DCC data server were gathered at Jan-05-2015. Only eight cancer types have enough normal control samples for differential expression analysis. (t test, adjusted p<0.05 (using Benjamini-Hochberg FDR)) |
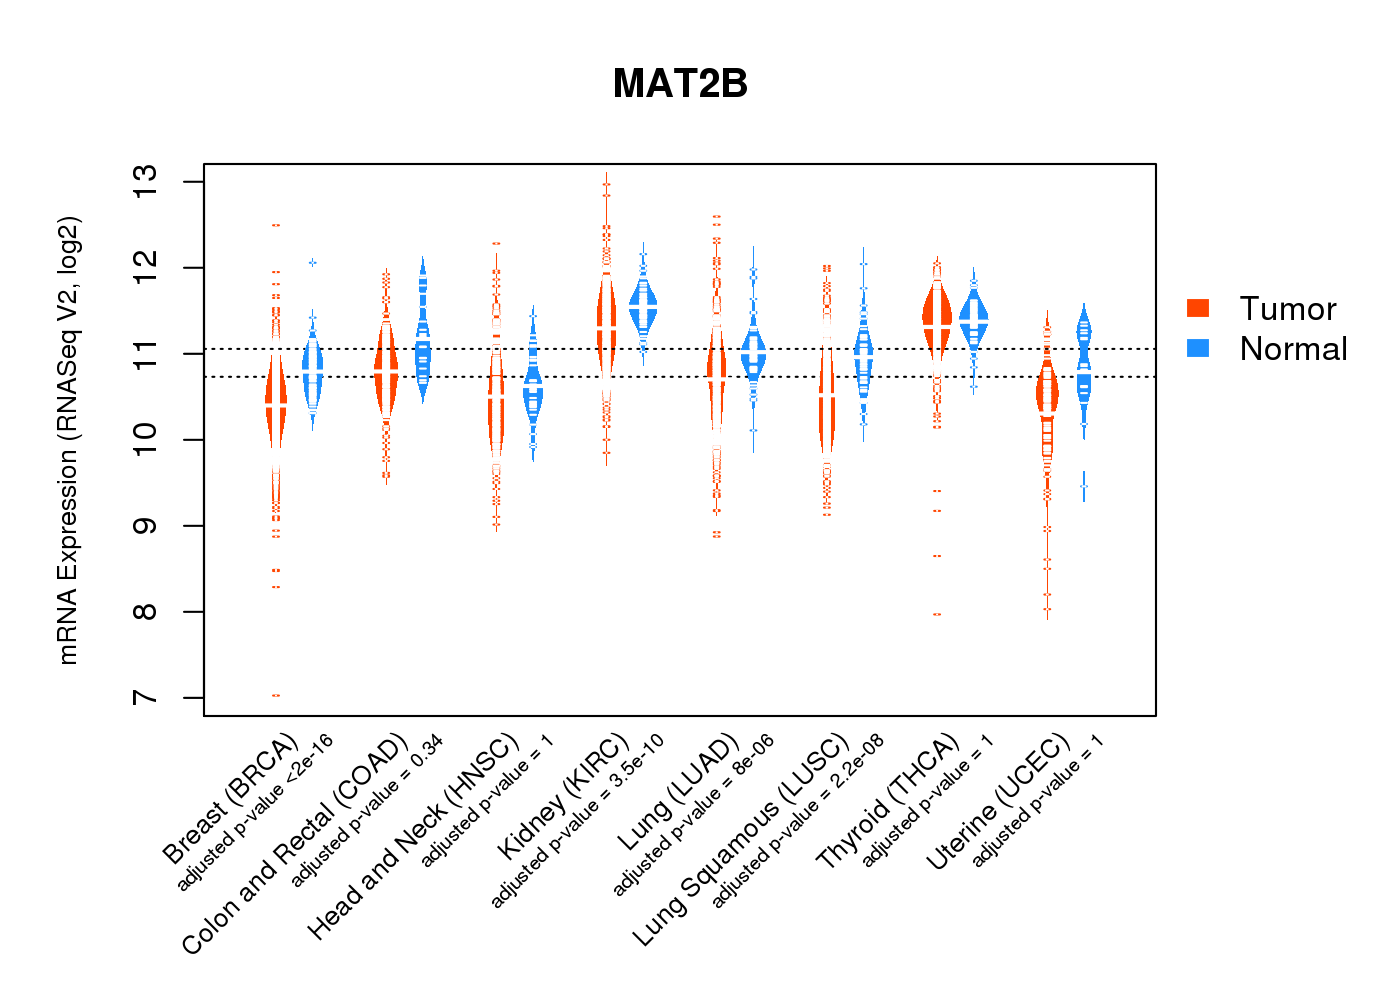 |
| Top |
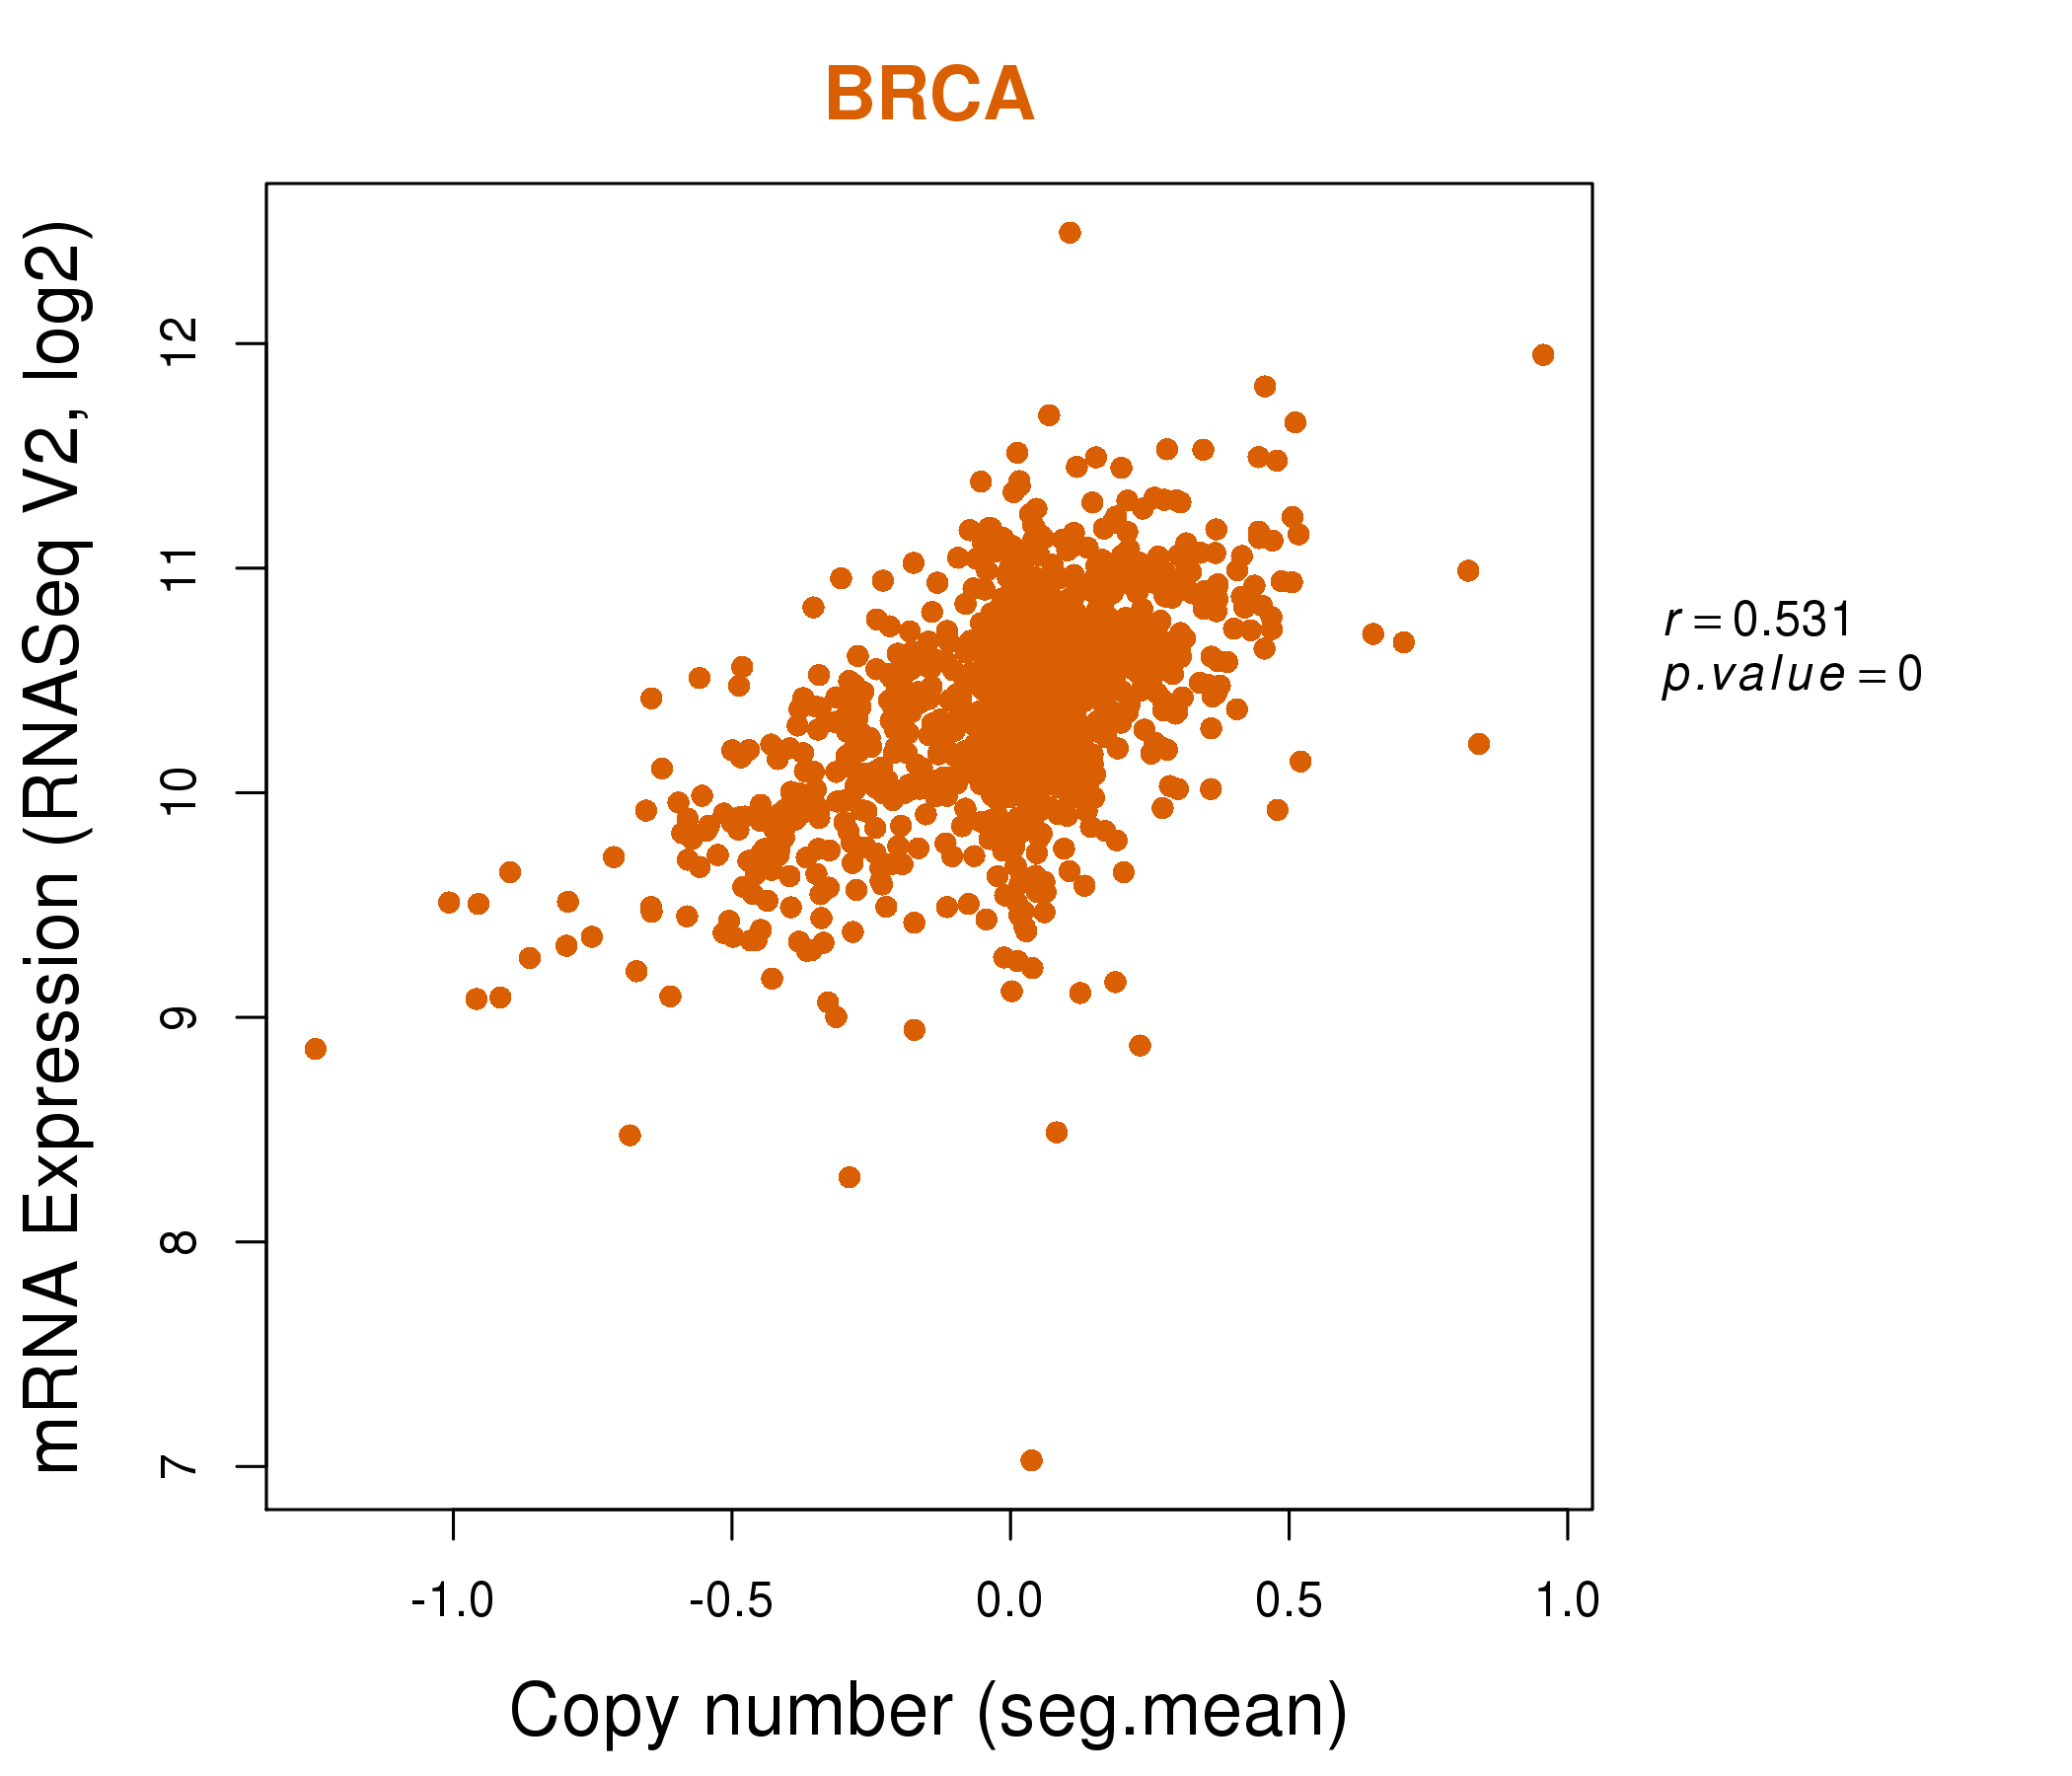
| * This plots show the correlation between CNV and gene expression. |
: Open all plots for all cancer types
 |
|
 |
|

| Top |
| Gene-Gene Network Information |
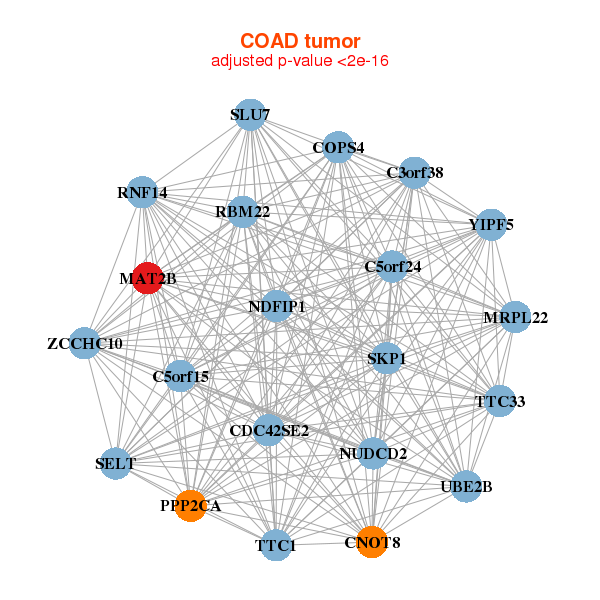
| * Co-Expression network figures were drawn using R package igraph. Only the top 20 genes with the highest correlations were shown. Red circle: input gene, orange circle: cell metabolism gene, sky circle: other gene |
: Open all plots for all cancer types
 |
|
| CREBRF,CDC42SE2,CEP120,ERAP1,FAM114A2,FCHO2,GIMAP2, MAT2B,MFAP3,PAPD4,POLK,PURA,PWWP2A,RAB8B, RBM22,RBM27,SLU7,SNX2,TLR3,UBLCP1,ZCCHC10 | ASF1A,ARL14EP,C11orf58,C12orf29,C7orf60,CRIPT,KBTBD3, LAMTOR3,MAT2B,BLOC1S5,NUP54,ORC4,PCNP,PTGES3, RBM7,SMAD4,SYPL1,THAP10,THAP1,ZNF22,ZNF639 |
 |
|
| C3orf38,C5orf15,C5orf24,CDC42SE2,CNOT8,COPS4,MAT2B, MRPL22,NDFIP1,NUDCD2,PPP2CA,RBM22,RNF14,SELT, SKP1,SLU7,TTC1,TTC33,UBE2B,YIPF5,ZCCHC10 | ATG5,C3orf38,CHIC2,DGUOK,DPY30,EAPP,GABARAPL2, ISCA2,MAT2B,MTIF3,NXT2,PDZD11,PEX11B,PPCS, RCHY1,SUMO1,SUMO3,TMEM179B,TSPAN31,UBAC2,UFC1 |
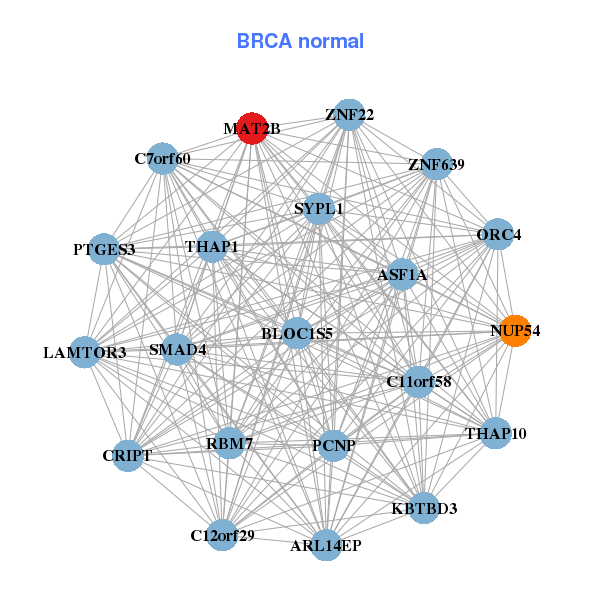
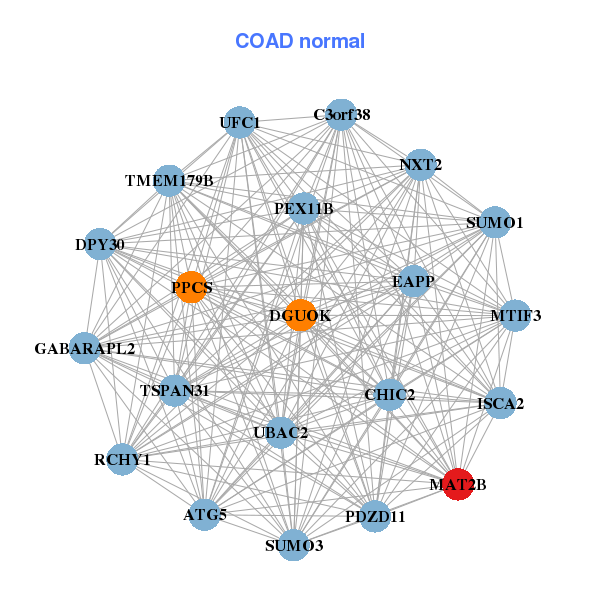
| * Co-Expression network figures were drawn using R package igraph. Only the top 20 genes with the highest correlations were shown. Red circle: input gene, orange circle: cell metabolism gene, sky circle: other gene |
: Open all plots for all cancer types
| Top |
: Open all interacting genes' information including KEGG pathway for all interacting genes from DAVID
| Top |
| Pharmacological Information for MAT2B |
| There's no related Drug. |
| Top |
| Cross referenced IDs for MAT2B |
| * We obtained these cross-references from Uniprot database. It covers 150 different DBs, 18 categories. http://www.uniprot.org/help/cross_references_section |
: Open all cross reference information
|
Copyright © 2016-Present - The Univsersity of Texas Health Science Center at Houston @ |