|
||||||||||||||||||||
| |
| Phenotypic Information (metabolism pathway, cancer, disease, phenome) |
| |
| |
| Gene-Gene Network Information: Co-Expression Network, Interacting Genes & KEGG |
| |
|


| Gene Summary for AMY1A |
| Top |
| Phenotypic Information for AMY1A(metabolism pathway, cancer, disease, phenome) |
| Cancer | CGAP: AMY1A |
| Familial Cancer Database: AMY1A | |
| * This gene is included in those cancer gene databases. |
|
|
|
|
|
|
| ||||||||||||||
Oncogene 1 | Significant driver gene in | |||||||||||||||||||
| cf) number; DB name 1 Oncogene; http://nar.oxfordjournals.org/content/35/suppl_1/D721.long, 2 Tumor Suppressor gene; https://bioinfo.uth.edu/TSGene/, 3 Cancer Gene Census; http://www.nature.com/nrc/journal/v4/n3/abs/nrc1299.html, 4 CancerGenes; http://nar.oxfordjournals.org/content/35/suppl_1/D721.long, 5 Network of Cancer Gene; http://ncg.kcl.ac.uk/index.php, 1Therapeutic Vulnerabilities in Cancer; http://cbio.mskcc.org/cancergenomics/statius/ |
| KEGG_STARCH_AND_SUCROSE_METABOLISM REACTOME_METABOLISM_OF_CARBOHYDRATES | |
| OMIM | 104700; gene. 104701; gene. 104702; gene. |
| Orphanet | |
| Disease | KEGG Disease: AMY1A |
| MedGen: AMY1A (Human Medical Genetics with Condition) | |
| ClinVar: AMY1A | |
| Phenotype | MGI: AMY1A (International Mouse Phenotyping Consortium) |
| PhenomicDB: AMY1A | |
| Mutations for AMY1A |
| * Under tables are showing count per each tissue to give us broad intuition about tissue specific mutation patterns.You can go to the detailed page for each mutation database's web site. |
| There's no structural variation information in COSMIC data for this gene. |
| * From mRNA Sanger sequences, Chitars2.0 arranged chimeric transcripts. This table shows AMY1A related fusion information. |
| ID | Head Gene | Tail Gene | Accession | Gene_a | qStart_a | qEnd_a | Chromosome_a | tStart_a | tEnd_a | Gene_a | qStart_a | qEnd_a | Chromosome_a | tStart_a | tEnd_a |
| Top |
| There's no copy number variation information in COSMIC data for this gene. |
| Top |
|
 |
| Top |
| Stat. for Non-Synonymous SNVs (# total SNVs=4) | (# total SNVs=0) |
 | |
(# total SNVs=0) | (# total SNVs=0) |
| Top |
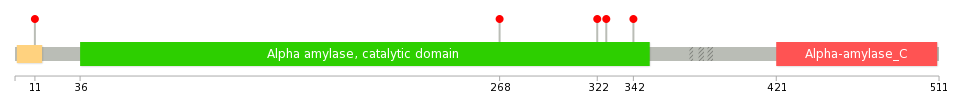
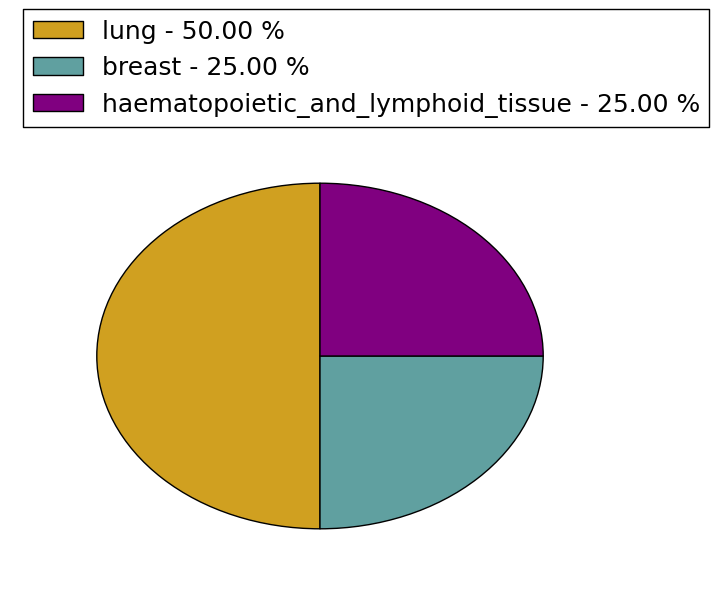
| * When you move the cursor on each content, you can see more deailed mutation information on the Tooltip. Those are primary_site,primary_histology,mutation(aa),pubmedID. |
| GRCh37 position | Mutation(aa) | Unique sampleID count |
| chr1:104198984-104198984 | p.G11A | 1 |
| chr1:104202090-104202090 | p.V268G | 1 |
| chr1:104203067-104203067 | p.A322T | 1 |
| chr1:104203082-104203082 | p.I327V | 1 |
| chr1:104203222-104203222 | p.F342Y | 1 |
| Top |
|
 |
| Point Mutation/ Tissue ID | 1 | 2 | 3 | 4 | 5 | 6 | 7 | 8 | 9 | 10 | 11 | 12 | 13 | 14 | 15 | 16 | 17 | 18 | 19 | 20 |
| # sample | ||||||||||||||||||||
| # mutation | ||||||||||||||||||||
| nonsynonymous SNV | ||||||||||||||||||||
| synonymous SNV |
| cf) Tissue ID; Tissue type (1; BLCA[Bladder Urothelial Carcinoma], 2; BRCA[Breast invasive carcinoma], 3; CESC[Cervical squamous cell carcinoma and endocervical adenocarcinoma], 4; COAD[Colon adenocarcinoma], 5; GBM[Glioblastoma multiforme], 6; Glioma Low Grade, 7; HNSC[Head and Neck squamous cell carcinoma], 8; KICH[Kidney Chromophobe], 9; KIRC[Kidney renal clear cell carcinoma], 10; KIRP[Kidney renal papillary cell carcinoma], 11; LAML[Acute Myeloid Leukemia], 12; LUAD[Lung adenocarcinoma], 13; LUSC[Lung squamous cell carcinoma], 14; OV[Ovarian serous cystadenocarcinoma ], 15; PAAD[Pancreatic adenocarcinoma], 16; PRAD[Prostate adenocarcinoma], 17; SKCM[Skin Cutaneous Melanoma], 18:STAD[Stomach adenocarcinoma], 19:THCA[Thyroid carcinoma], 20:UCEC[Uterine Corpus Endometrial Carcinoma]) |
| Top |
| * We represented just top 10 SNVs. When you move the cursor on each content, you can see more deailed mutation information on the Tooltip. Those are primary_site, primary_histology, mutation(aa), pubmedID. |
| Genomic Position | Mutation(aa) | Unique sampleID count |
| * Copy number data were extracted from TCGA using R package TCGA-Assembler. The URLs of all public data files on TCGA DCC data server were gathered on Jan-05-2015. Function ProcessCNAData in TCGA-Assembler package was used to obtain gene-level copy number value which is calculated as the average copy number of the genomic region of a gene. |
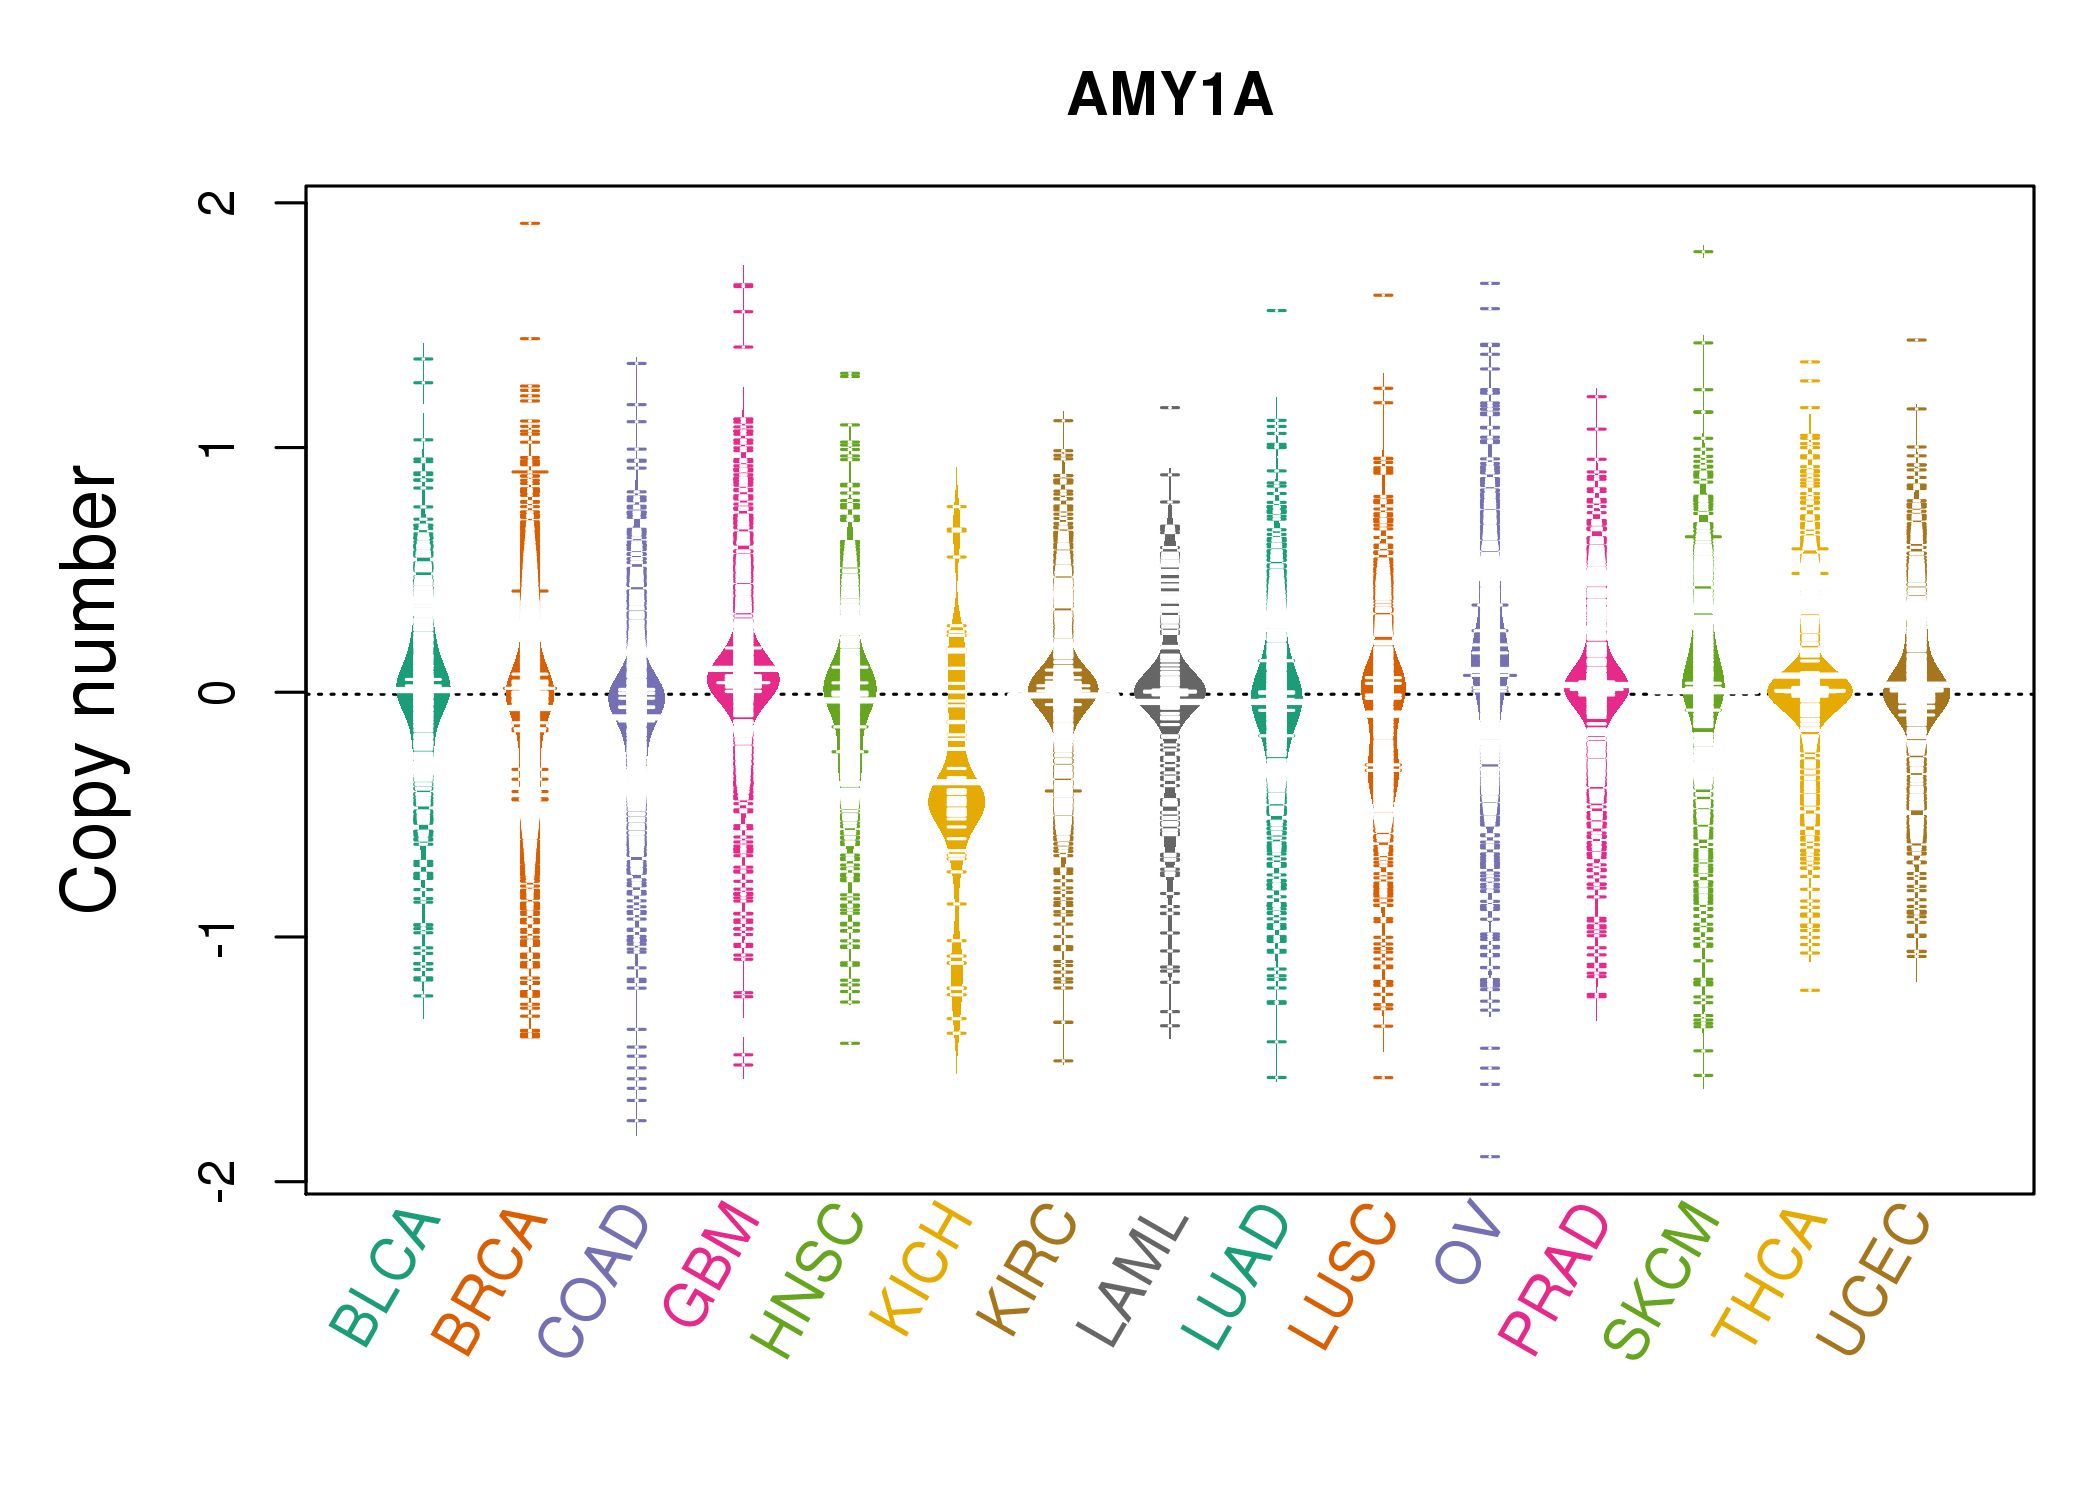 |
| cf) Tissue ID[Tissue type]: BLCA[Bladder Urothelial Carcinoma], BRCA[Breast invasive carcinoma], CESC[Cervical squamous cell carcinoma and endocervical adenocarcinoma], COAD[Colon adenocarcinoma], GBM[Glioblastoma multiforme], Glioma Low Grade, HNSC[Head and Neck squamous cell carcinoma], KICH[Kidney Chromophobe], KIRC[Kidney renal clear cell carcinoma], KIRP[Kidney renal papillary cell carcinoma], LAML[Acute Myeloid Leukemia], LUAD[Lung adenocarcinoma], LUSC[Lung squamous cell carcinoma], OV[Ovarian serous cystadenocarcinoma ], PAAD[Pancreatic adenocarcinoma], PRAD[Prostate adenocarcinoma], SKCM[Skin Cutaneous Melanoma], STAD[Stomach adenocarcinoma], THCA[Thyroid carcinoma], UCEC[Uterine Corpus Endometrial Carcinoma] |
| Top |
| Gene Expression for AMY1A |
| * CCLE gene expression data were extracted from CCLE_Expression_Entrez_2012-10-18.res: Gene-centric RMA-normalized mRNA expression data. |
 |
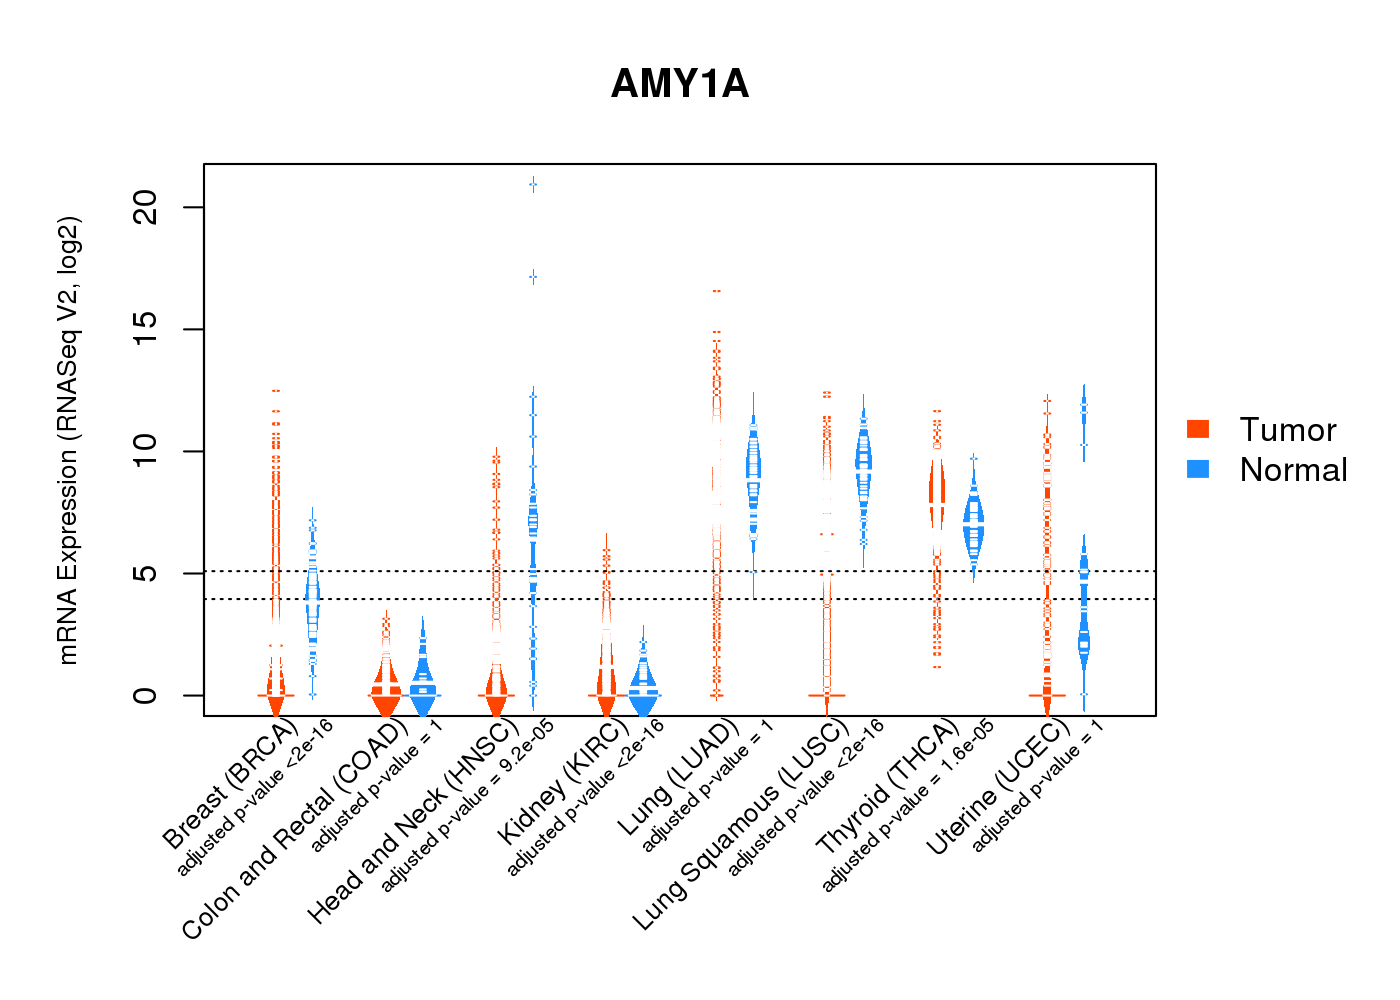
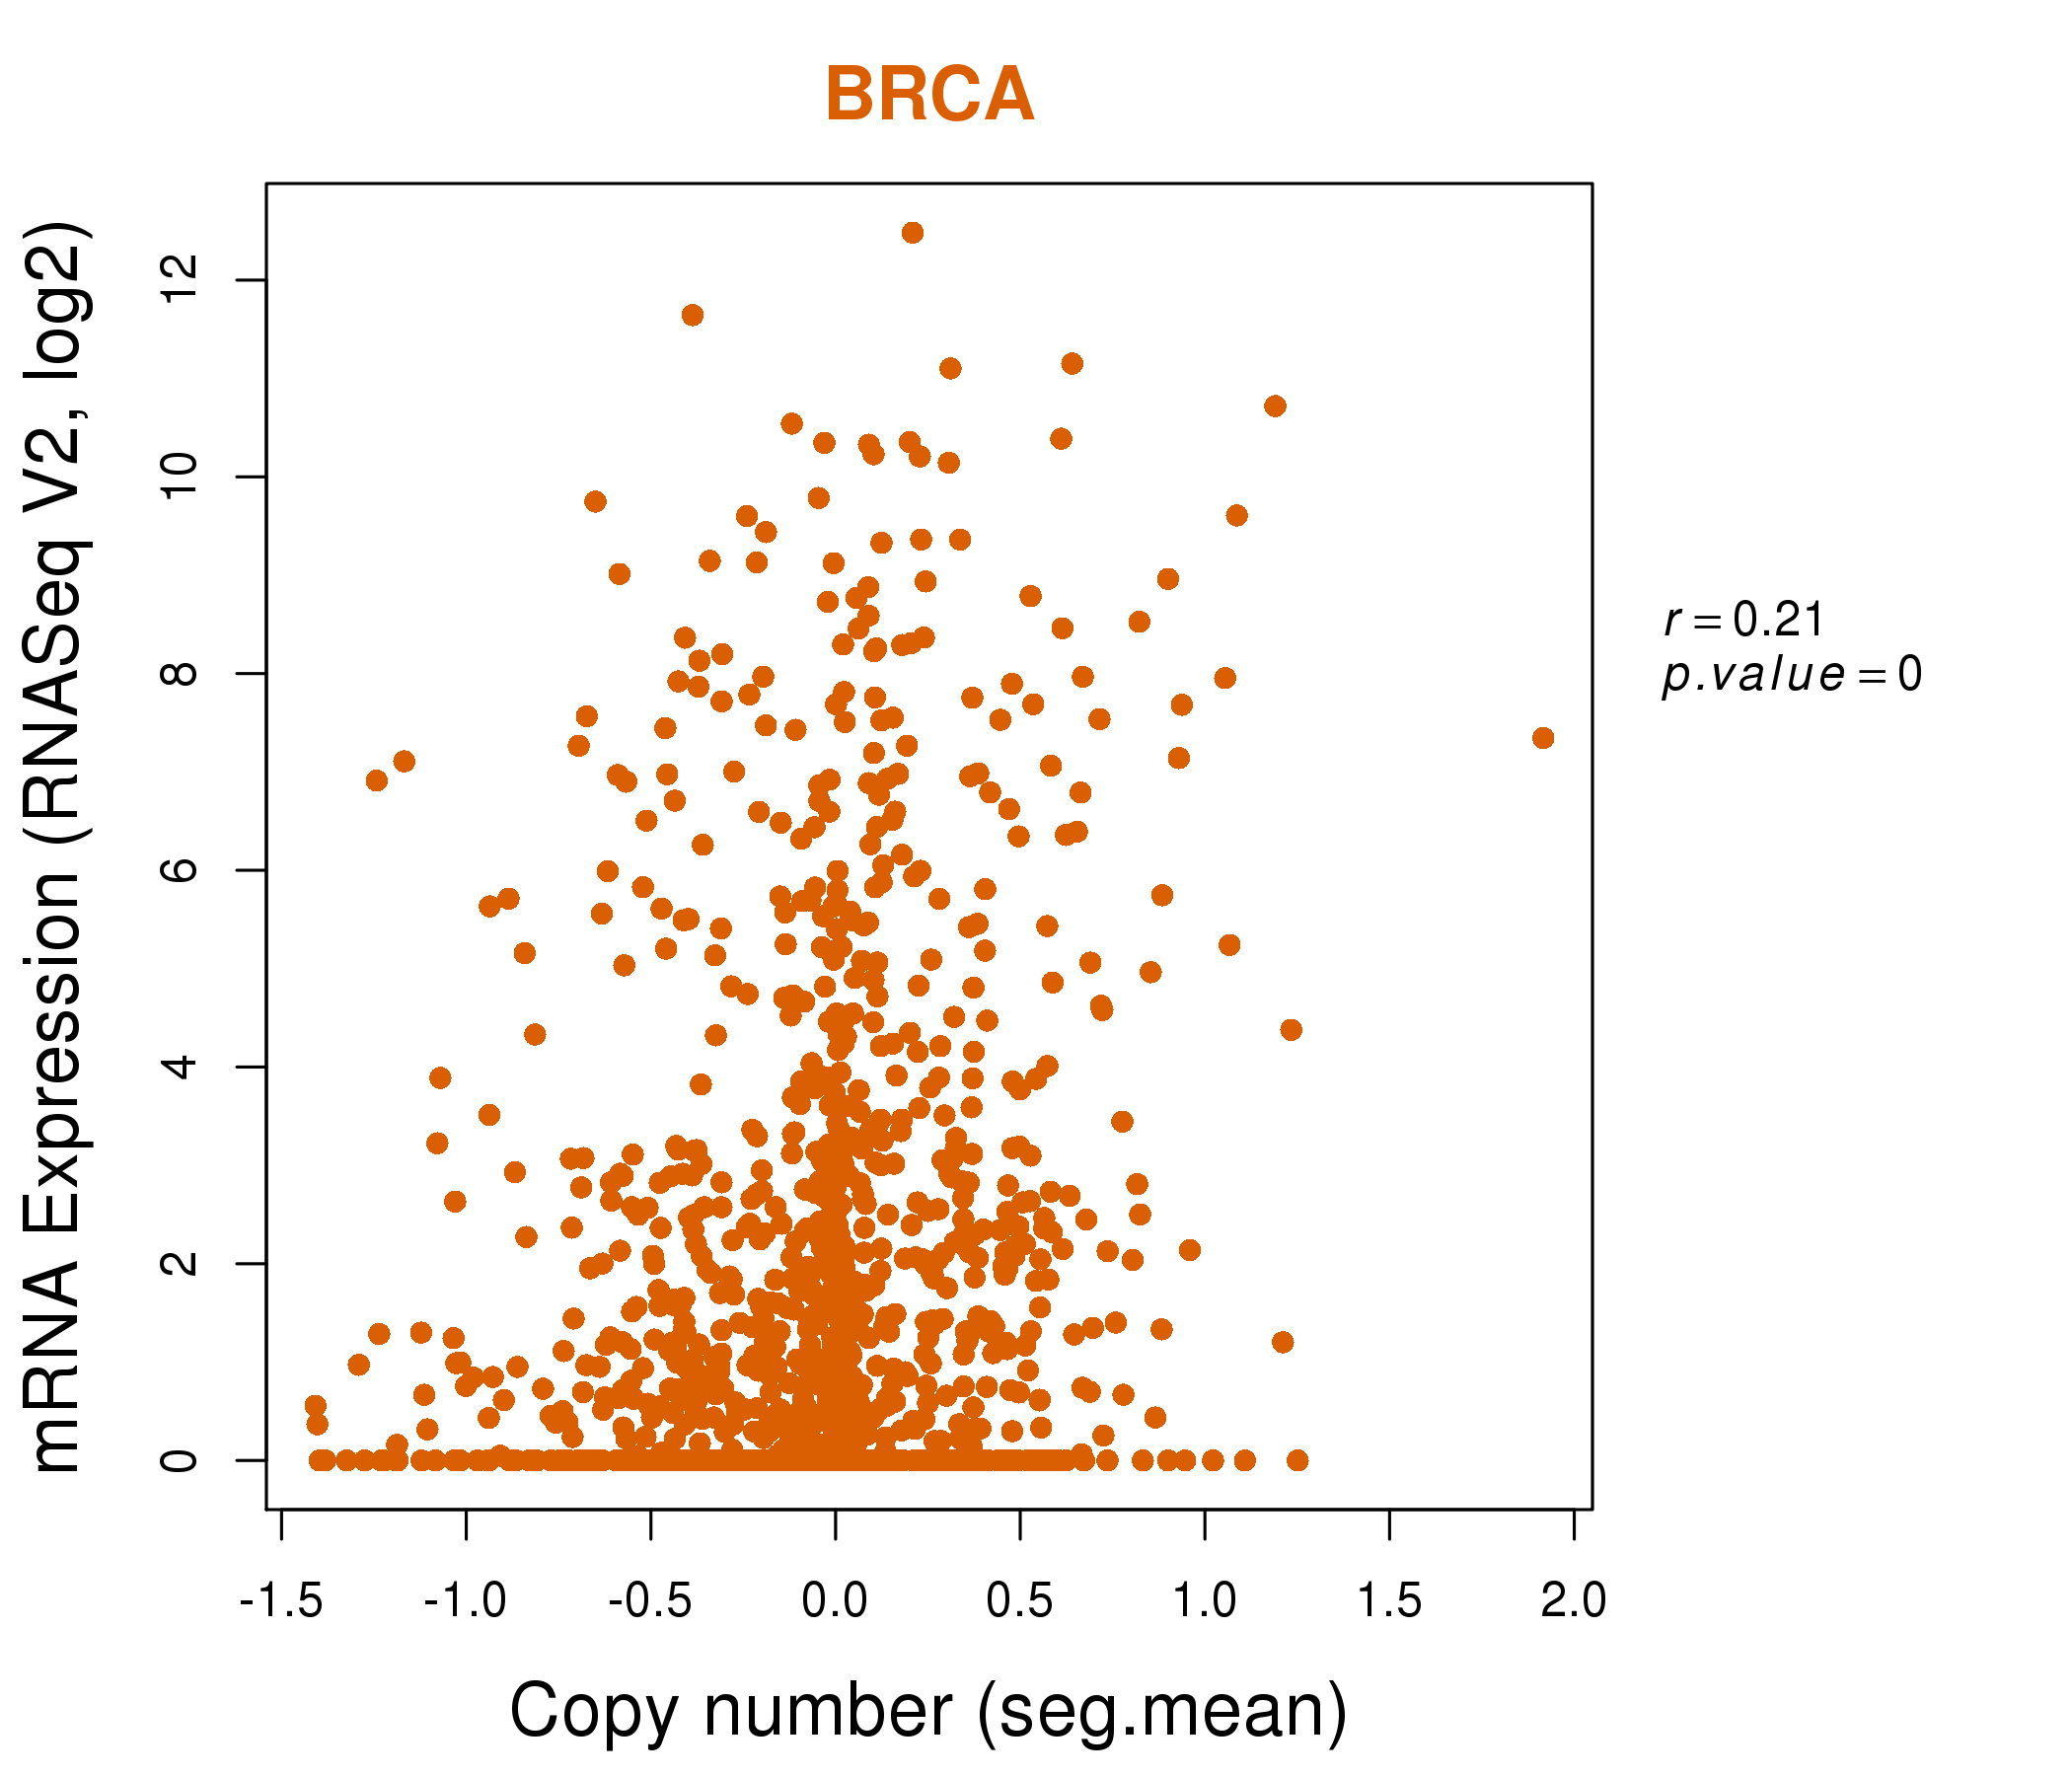
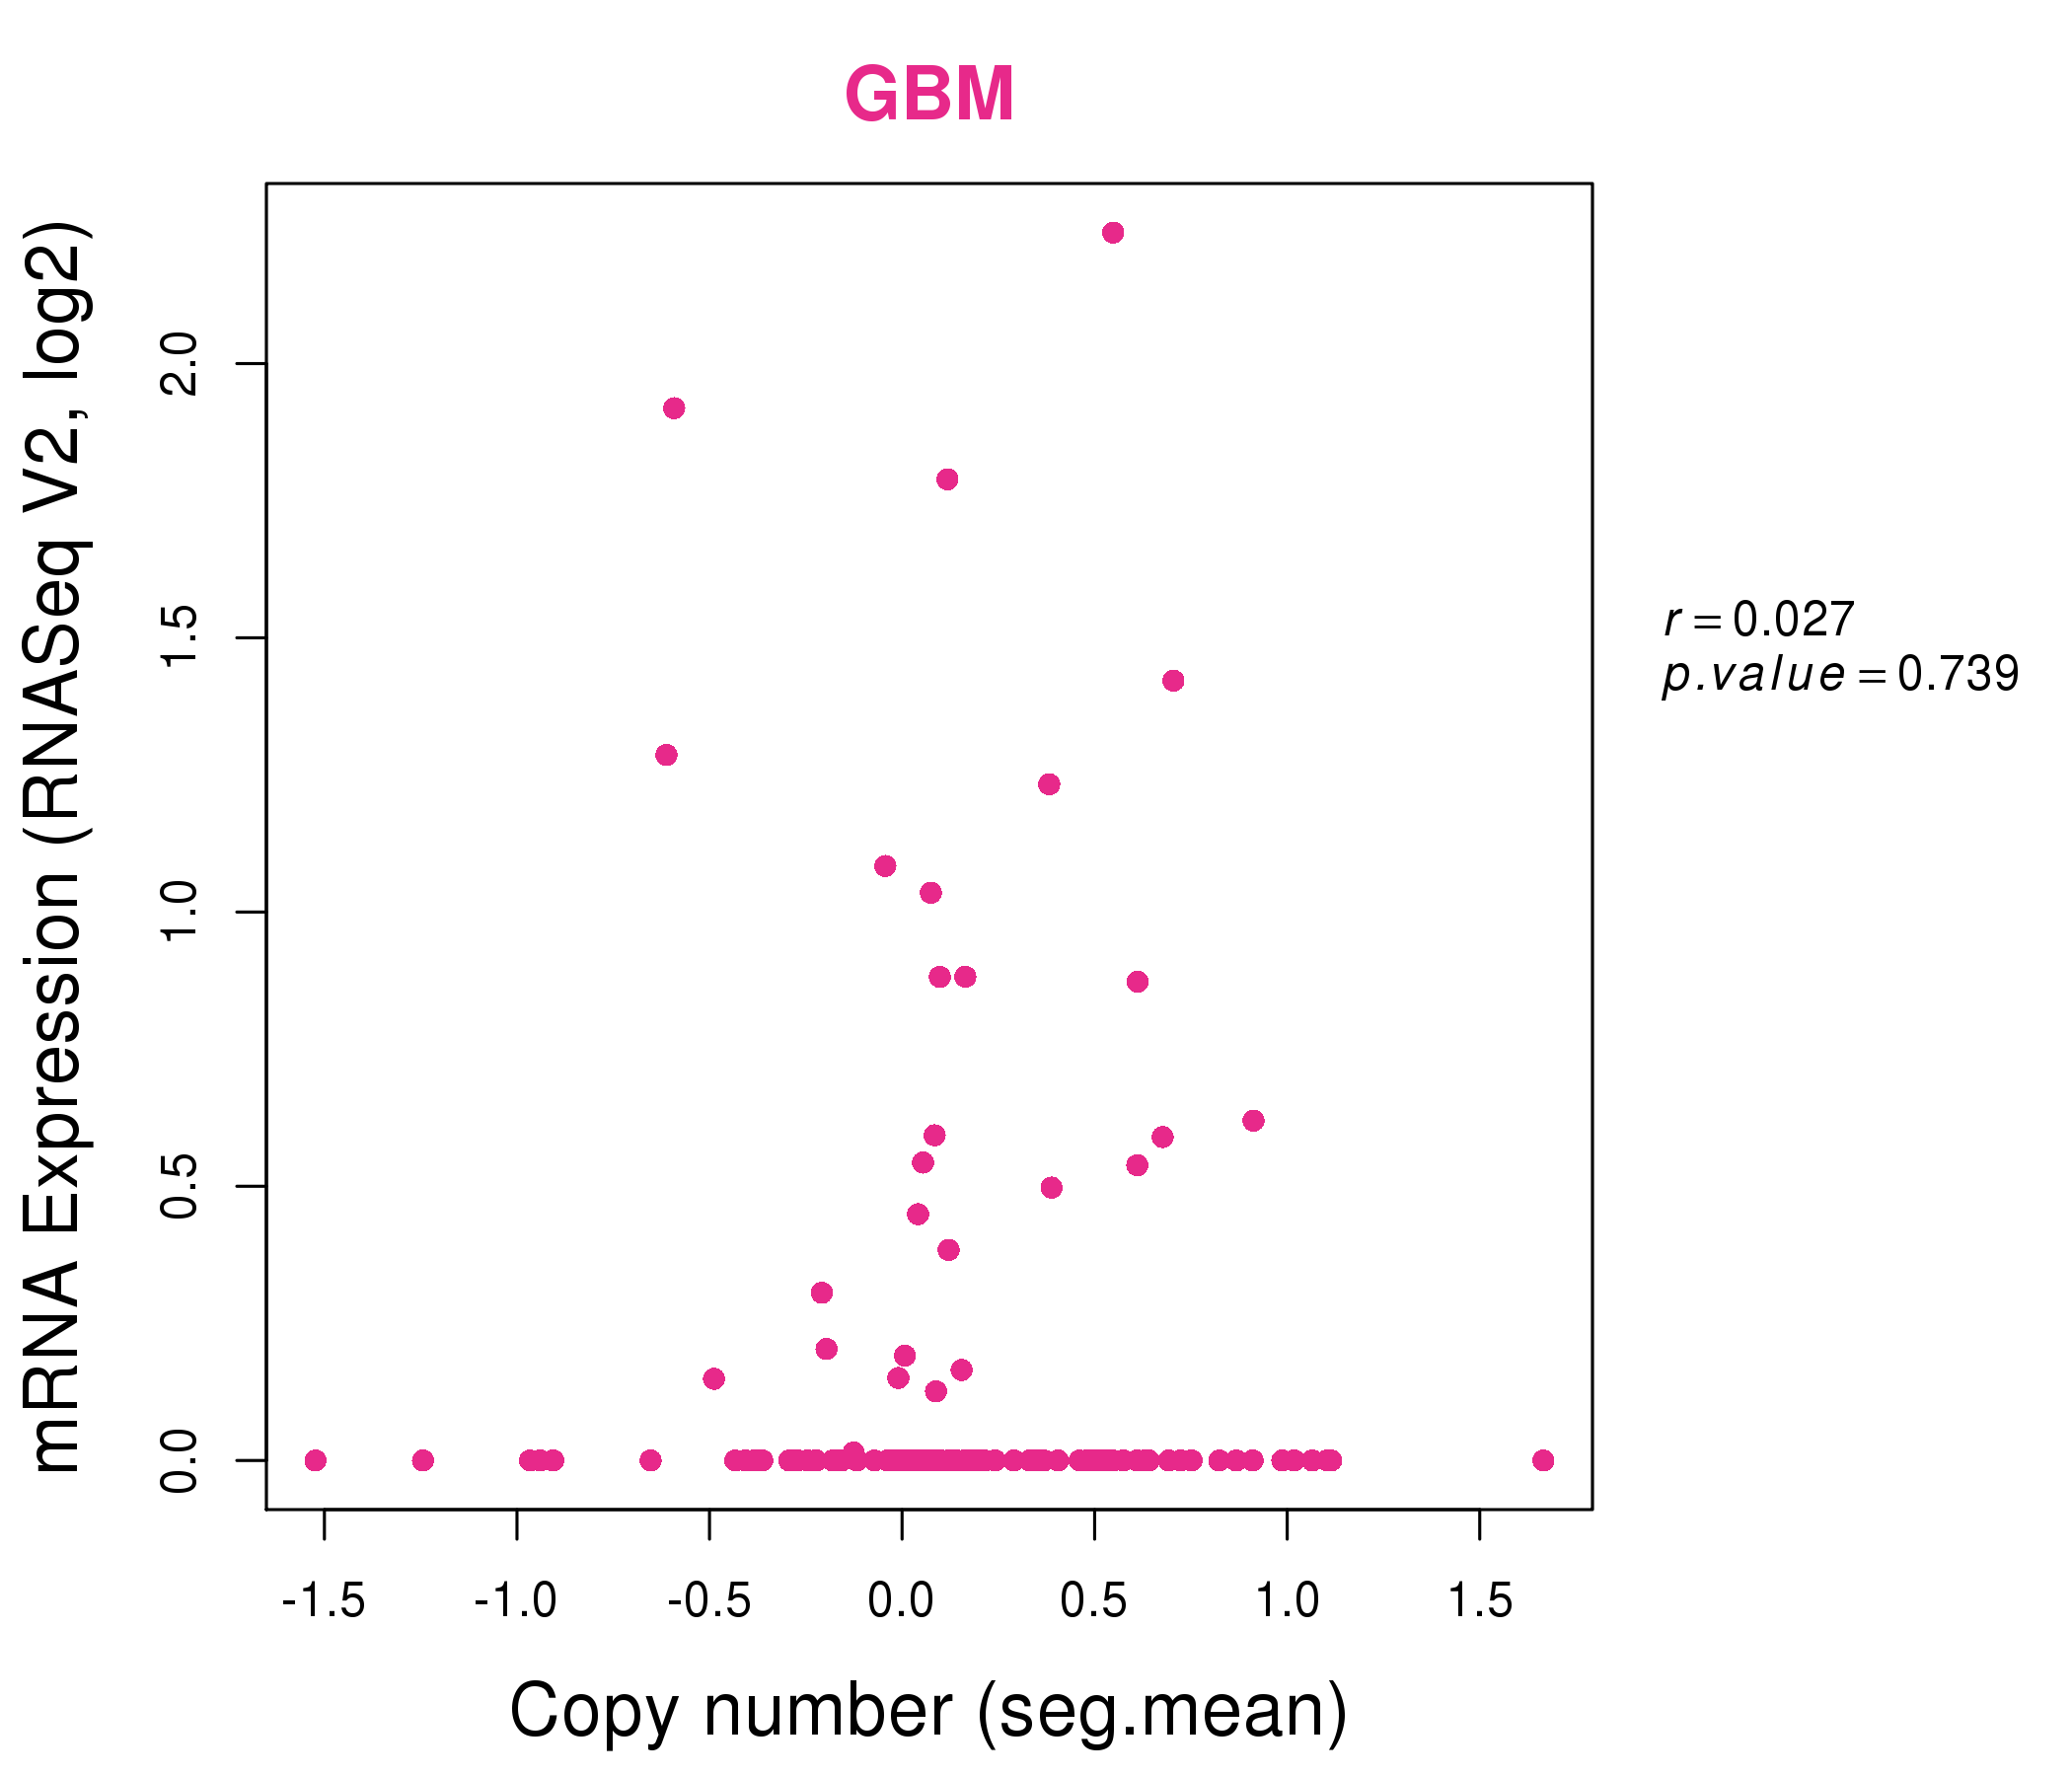
| * Normalized gene expression data of RNASeqV2 was extracted from TCGA using R package TCGA-Assembler. The URLs of all public data files on TCGA DCC data server were gathered at Jan-05-2015. Only eight cancer types have enough normal control samples for differential expression analysis. (t test, adjusted p<0.05 (using Benjamini-Hochberg FDR)) |
 |
| Top |
| * This plots show the correlation between CNV and gene expression. |
: Open all plots for all cancer types
 |
|
 |
|
| Top |
| Gene-Gene Network Information |
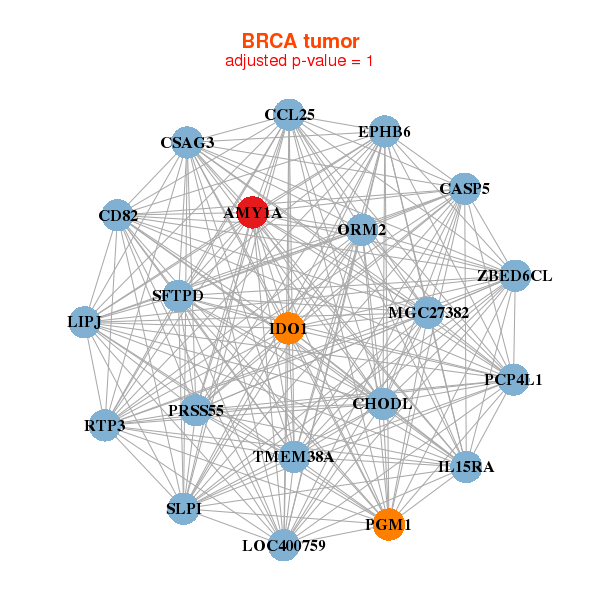
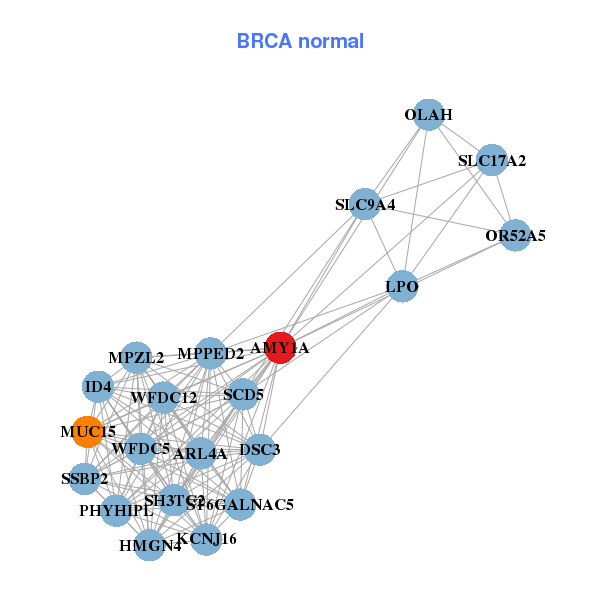
| * Co-Expression network figures were drawn using R package igraph. Only the top 20 genes with the highest correlations were shown. Red circle: input gene, orange circle: cell metabolism gene, sky circle: other gene |
: Open all plots for all cancer types
 |
| ||||
| AMY1A,ZBED6CL,CASP5,CCL25,CD82,CHODL,CSAG3, EPHB6,IDO1,IL15RA,LIPJ,LOC400759,MGC27382,ORM2, PCP4L1,PGM1,PRSS55,RTP3,SFTPD,SLPI,TMEM38A | AMY1A,ARL4A,DSC3,HMGN4,ID4,KCNJ16,LPO, MPPED2,MPZL2,MUC15,OLAH,OR52A5,PHYHIPL,SCD5, SH3TC2,SLC17A2,SLC9A4,SSBP2,ST6GALNAC5,WFDC12,WFDC5 | ||||
 |
| ||||
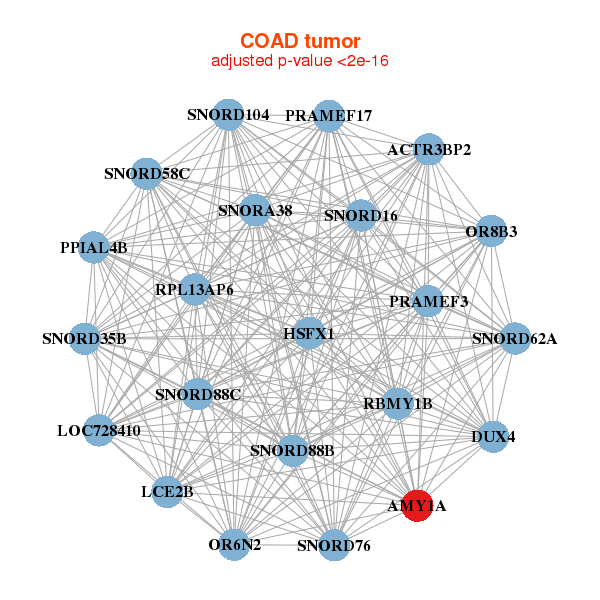
| AMY1A,DUX4,ACTR3BP2,HSFX1,LCE2B,LOC728410,OR6N2, OR8B3,PPIAL4B,PRAMEF17,PRAMEF3,RBMY1B,RPL13AP6,SNORA38, SNORD104,SNORD16,SNORD35B,SNORD58C,SNORD62A,SNORD76,SNORD88B, SNOR | AMY1A,AQP4,FAM181A-AS1,C4orf45,C7orf65,KRT17,LRP6, MAGEA8,MYLK3,POU3F2,PSG5,RSF1,RSPH6A,SECISBP2L, SENP6,SERPINB4,SKINTL,SPRR2D,TEX15,VSIG10L,ZIC5 |
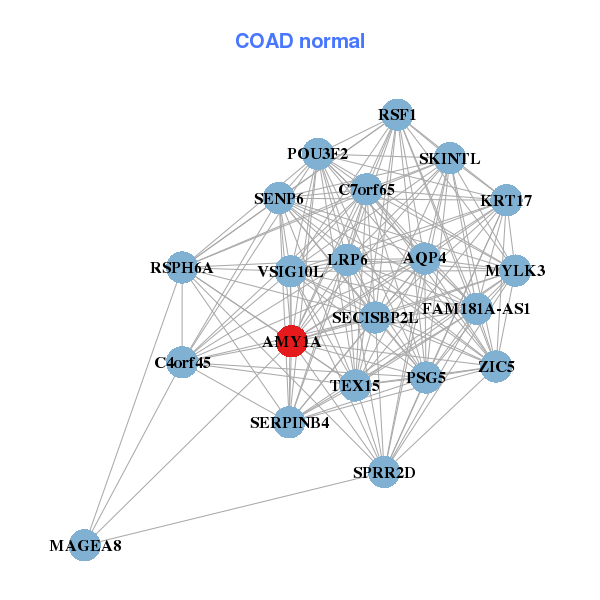
| * Co-Expression network figures were drawn using R package igraph. Only the top 20 genes with the highest correlations were shown. Red circle: input gene, orange circle: cell metabolism gene, sky circle: other gene |
: Open all plots for all cancer types
| Top |
: Open all interacting genes' information including KEGG pathway for all interacting genes from DAVID
| Top |
| Pharmacological Information for AMY1A |
| DB Category | DB Name | DB's ID and Url link |
| Chemistry | BindingDB | P04745; -. |
| Chemistry | ChEMBL | CHEMBL2478; -. |
| Organism-specific databases | PharmGKB | PA24783; -. |
| Organism-specific databases | CTD | 276; -. |
| Organism-specific databases | CTD | 277; -. |
| Organism-specific databases | CTD | 278; -. |
| * Gene Centered Interaction Network. |
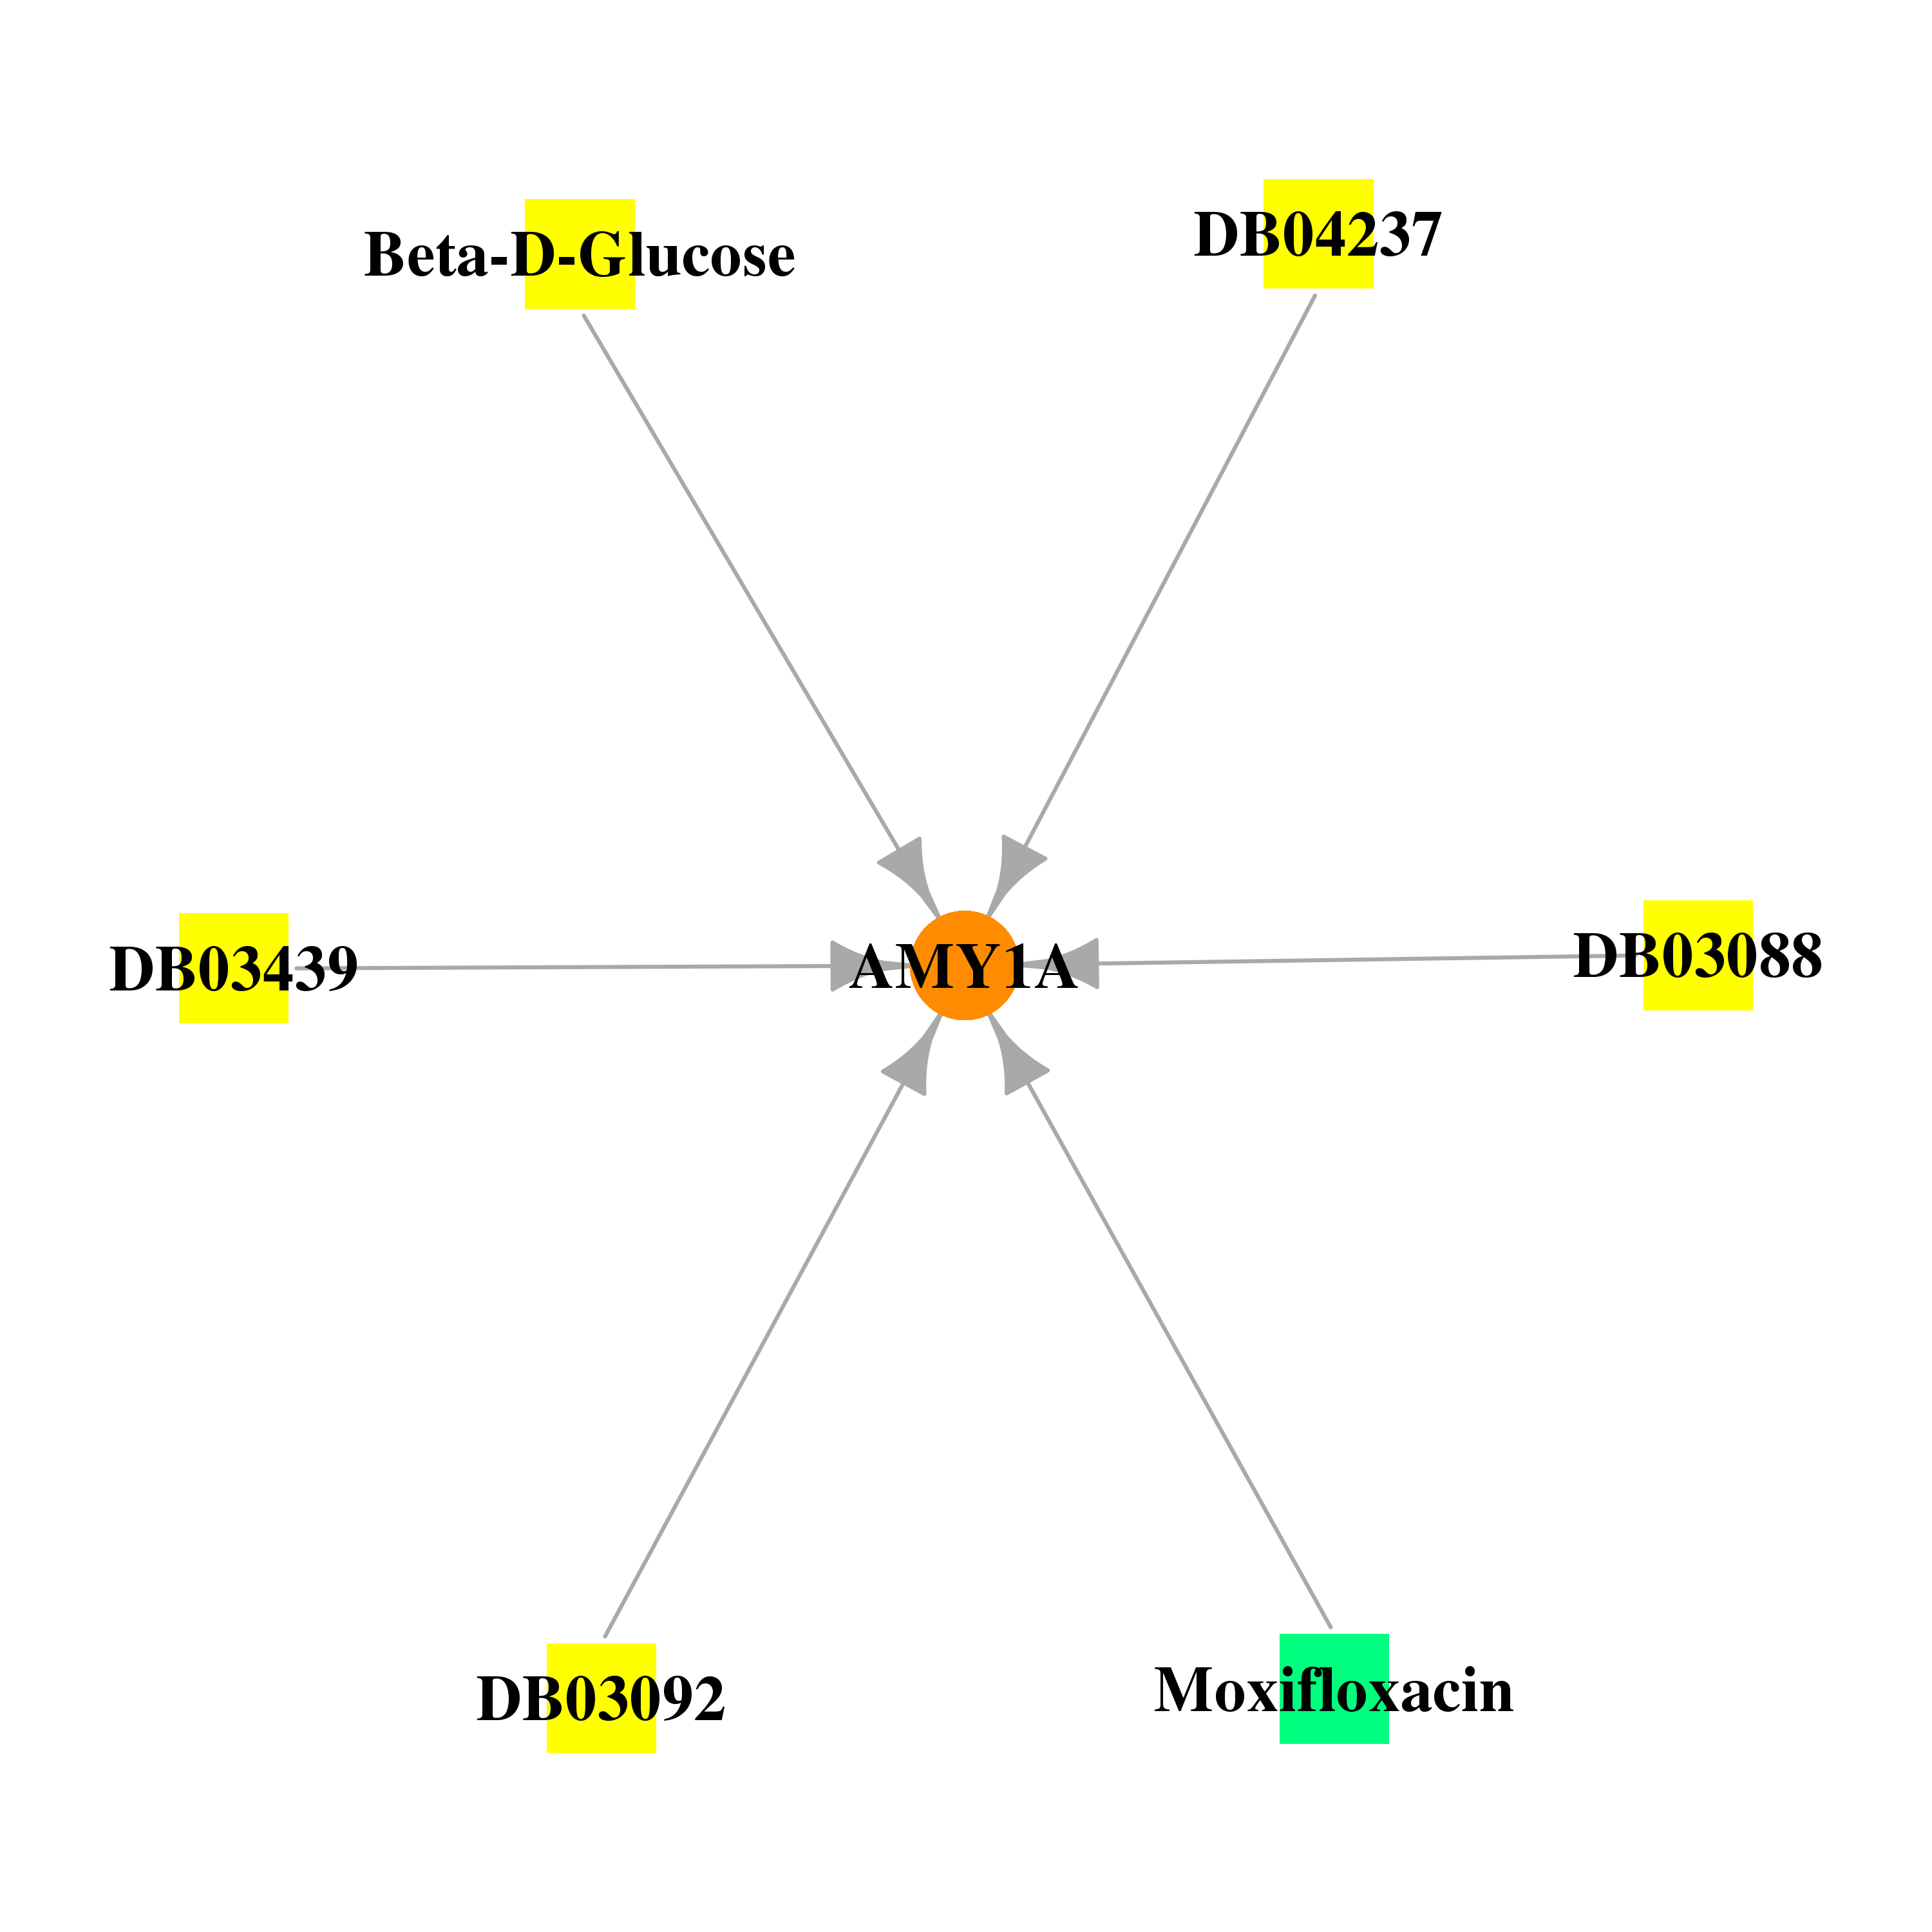 |
| * Drug Centered Interaction Network. |
| DrugBank ID | Target Name | Drug Groups | Generic Name | Drug Centered Network | Drug Structure |
| DB02379 | amylase, alpha 1A (salivary) | experimental | Beta-D-Glucose | 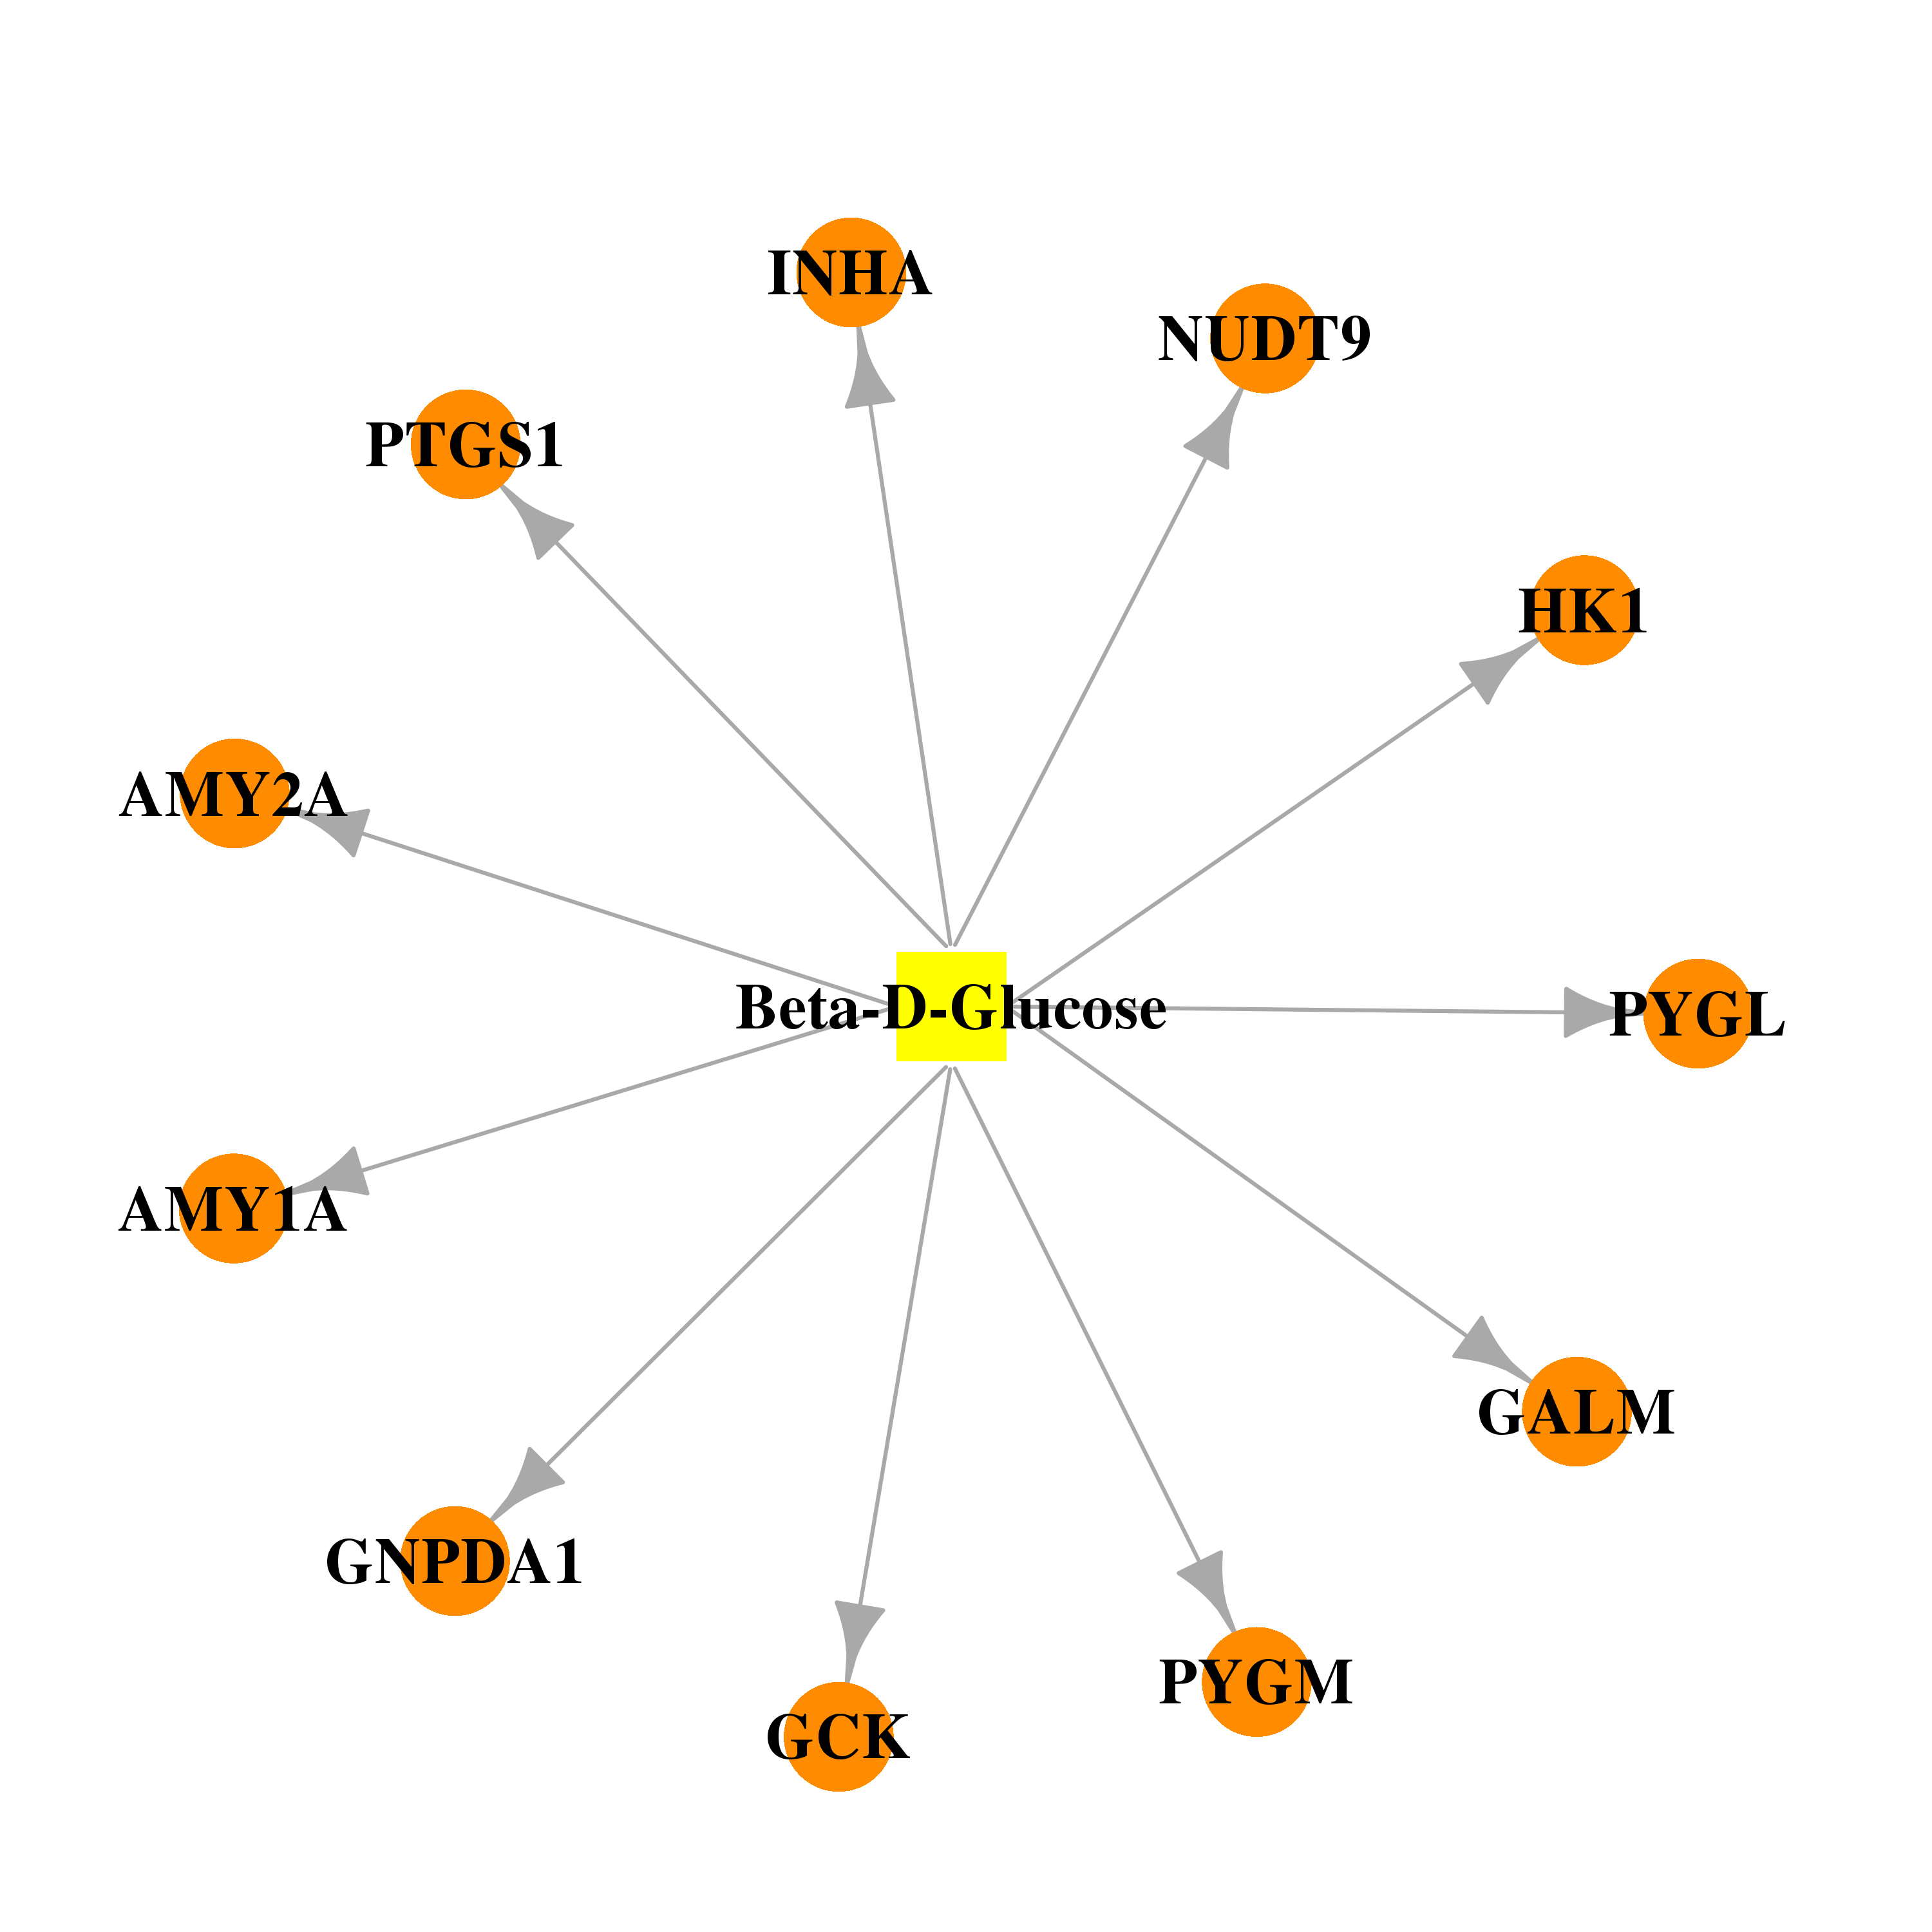 |  |
| DB03088 | amylase, alpha 1A (salivary) | experimental | Pyroglutamic Acid | 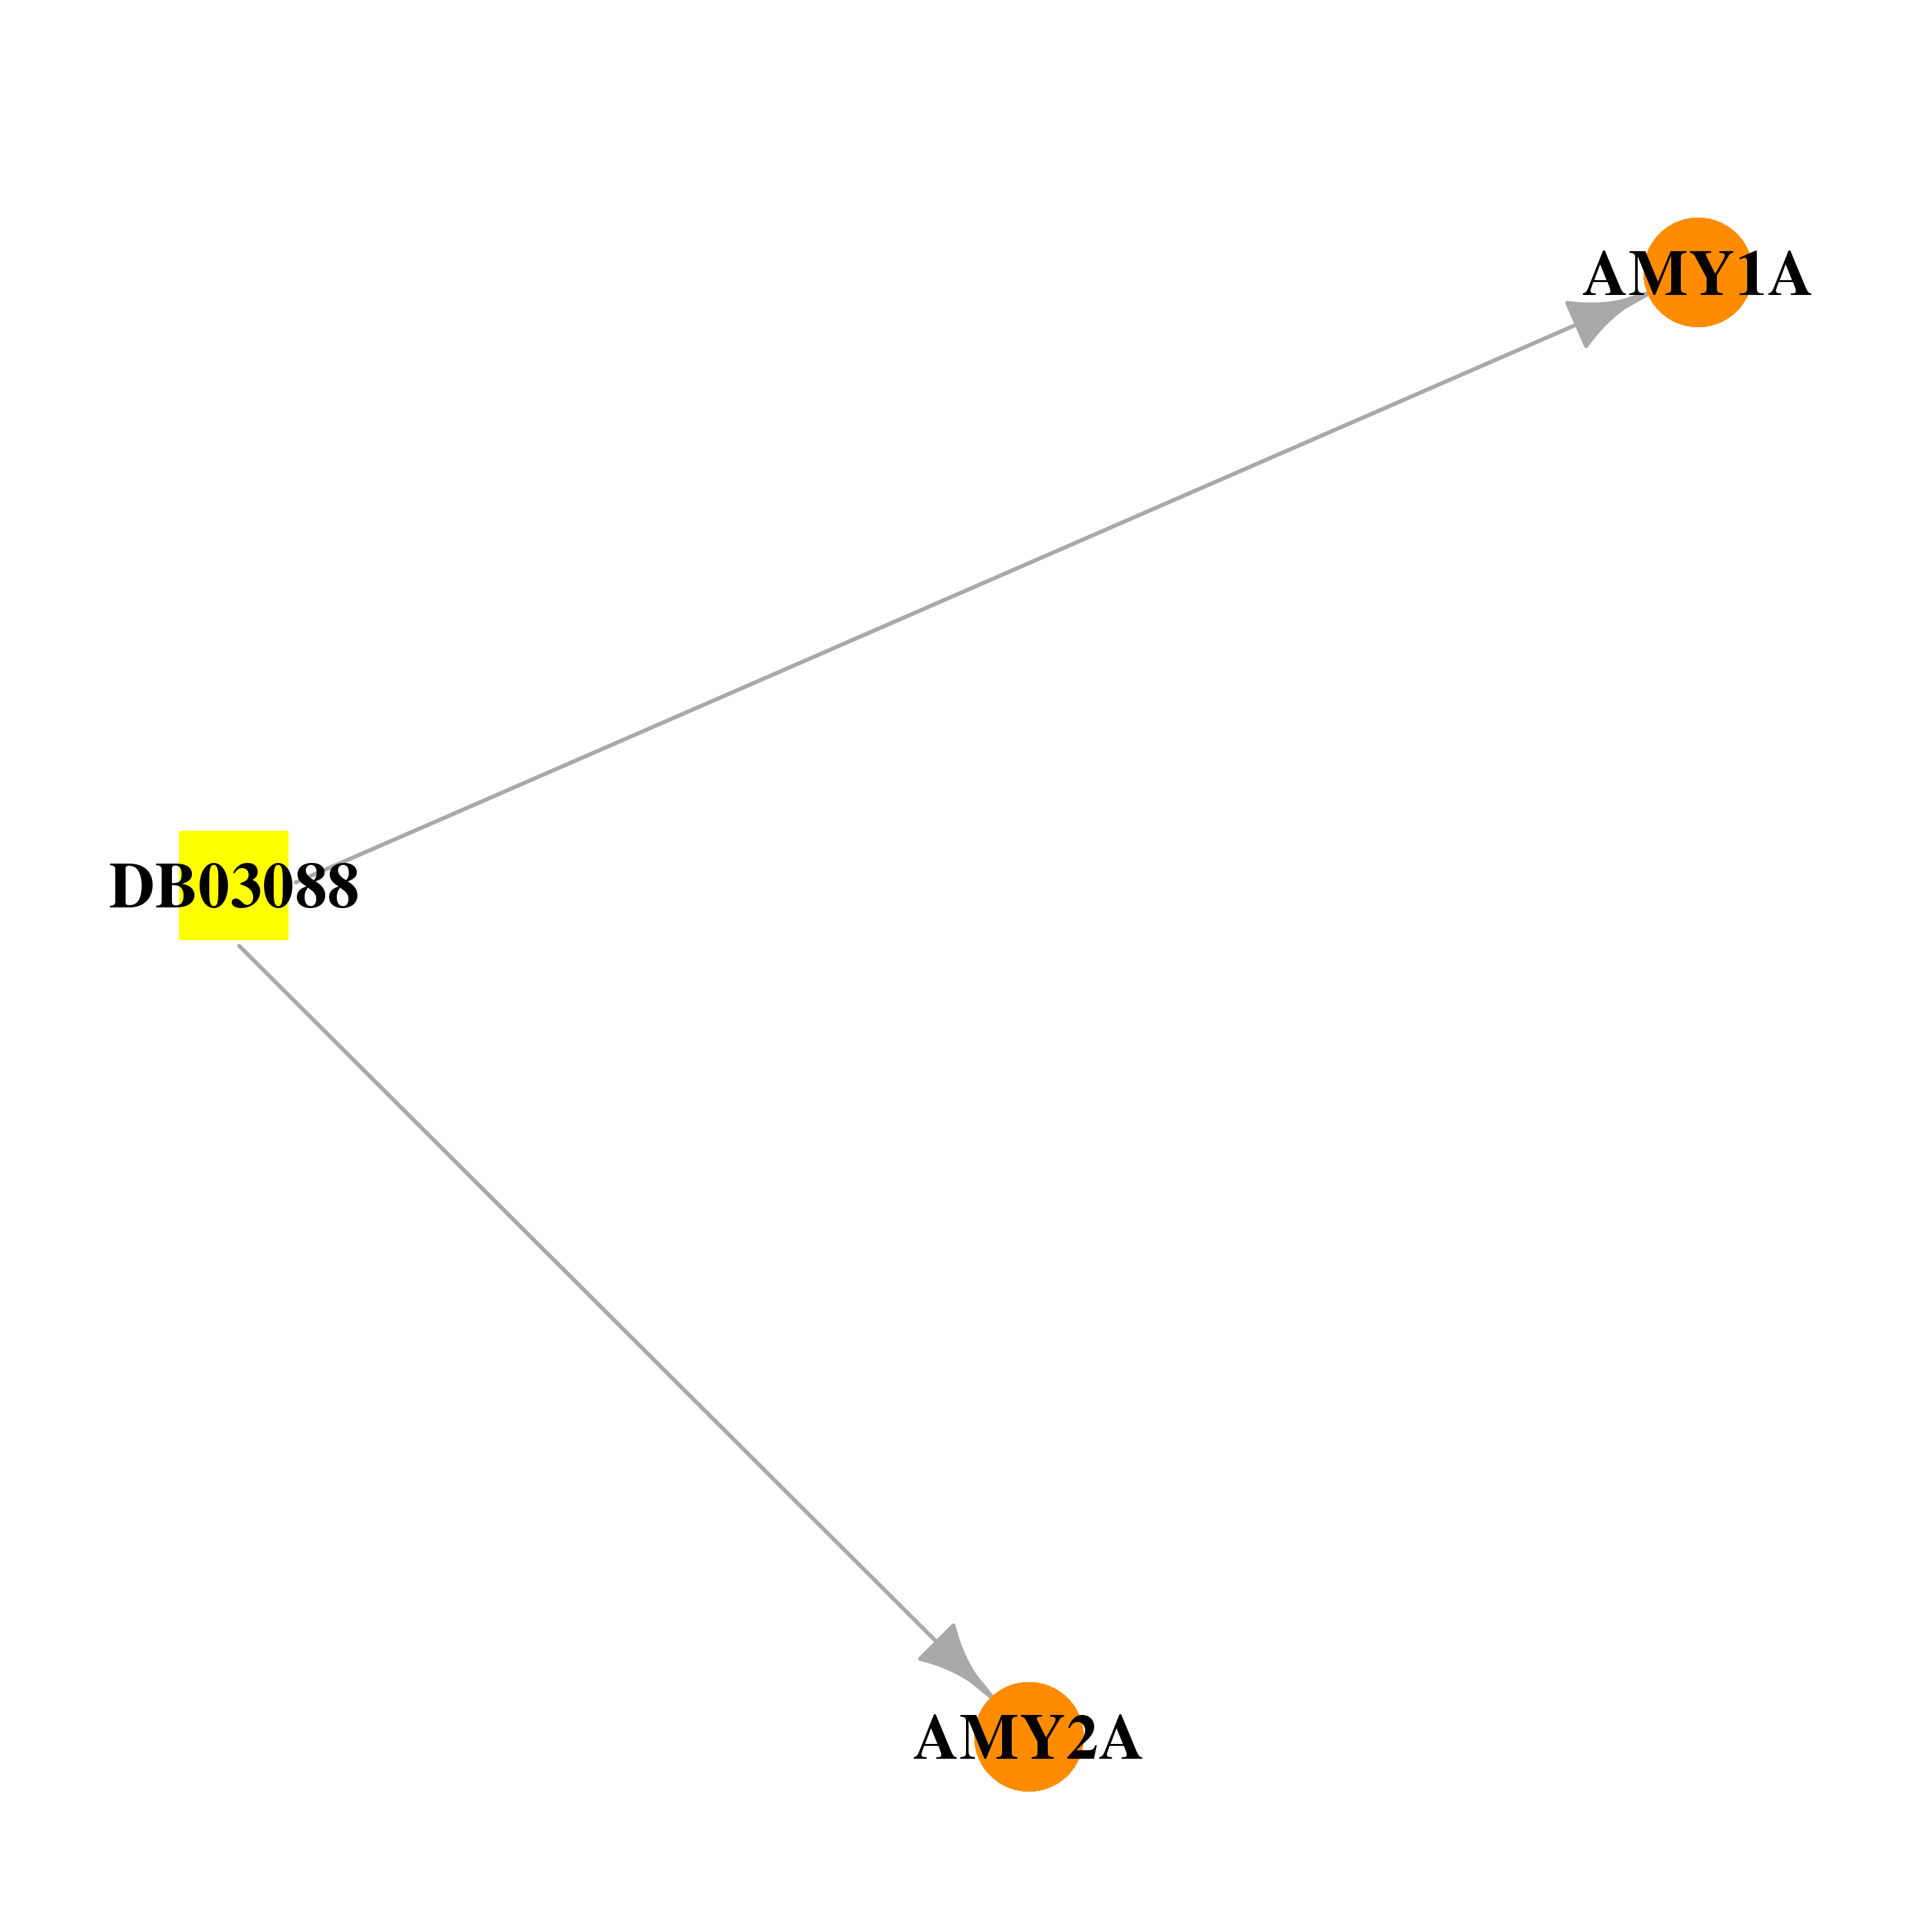 |  |
| DB03092 | amylase, alpha 1A (salivary) | experimental | 5-Hydroxymethyl-Chonduritol |  |  |
| DB03439 | amylase, alpha 1A (salivary) | experimental | 4,6-Dideoxy-4-Amino-Alpha-D-Glucose | 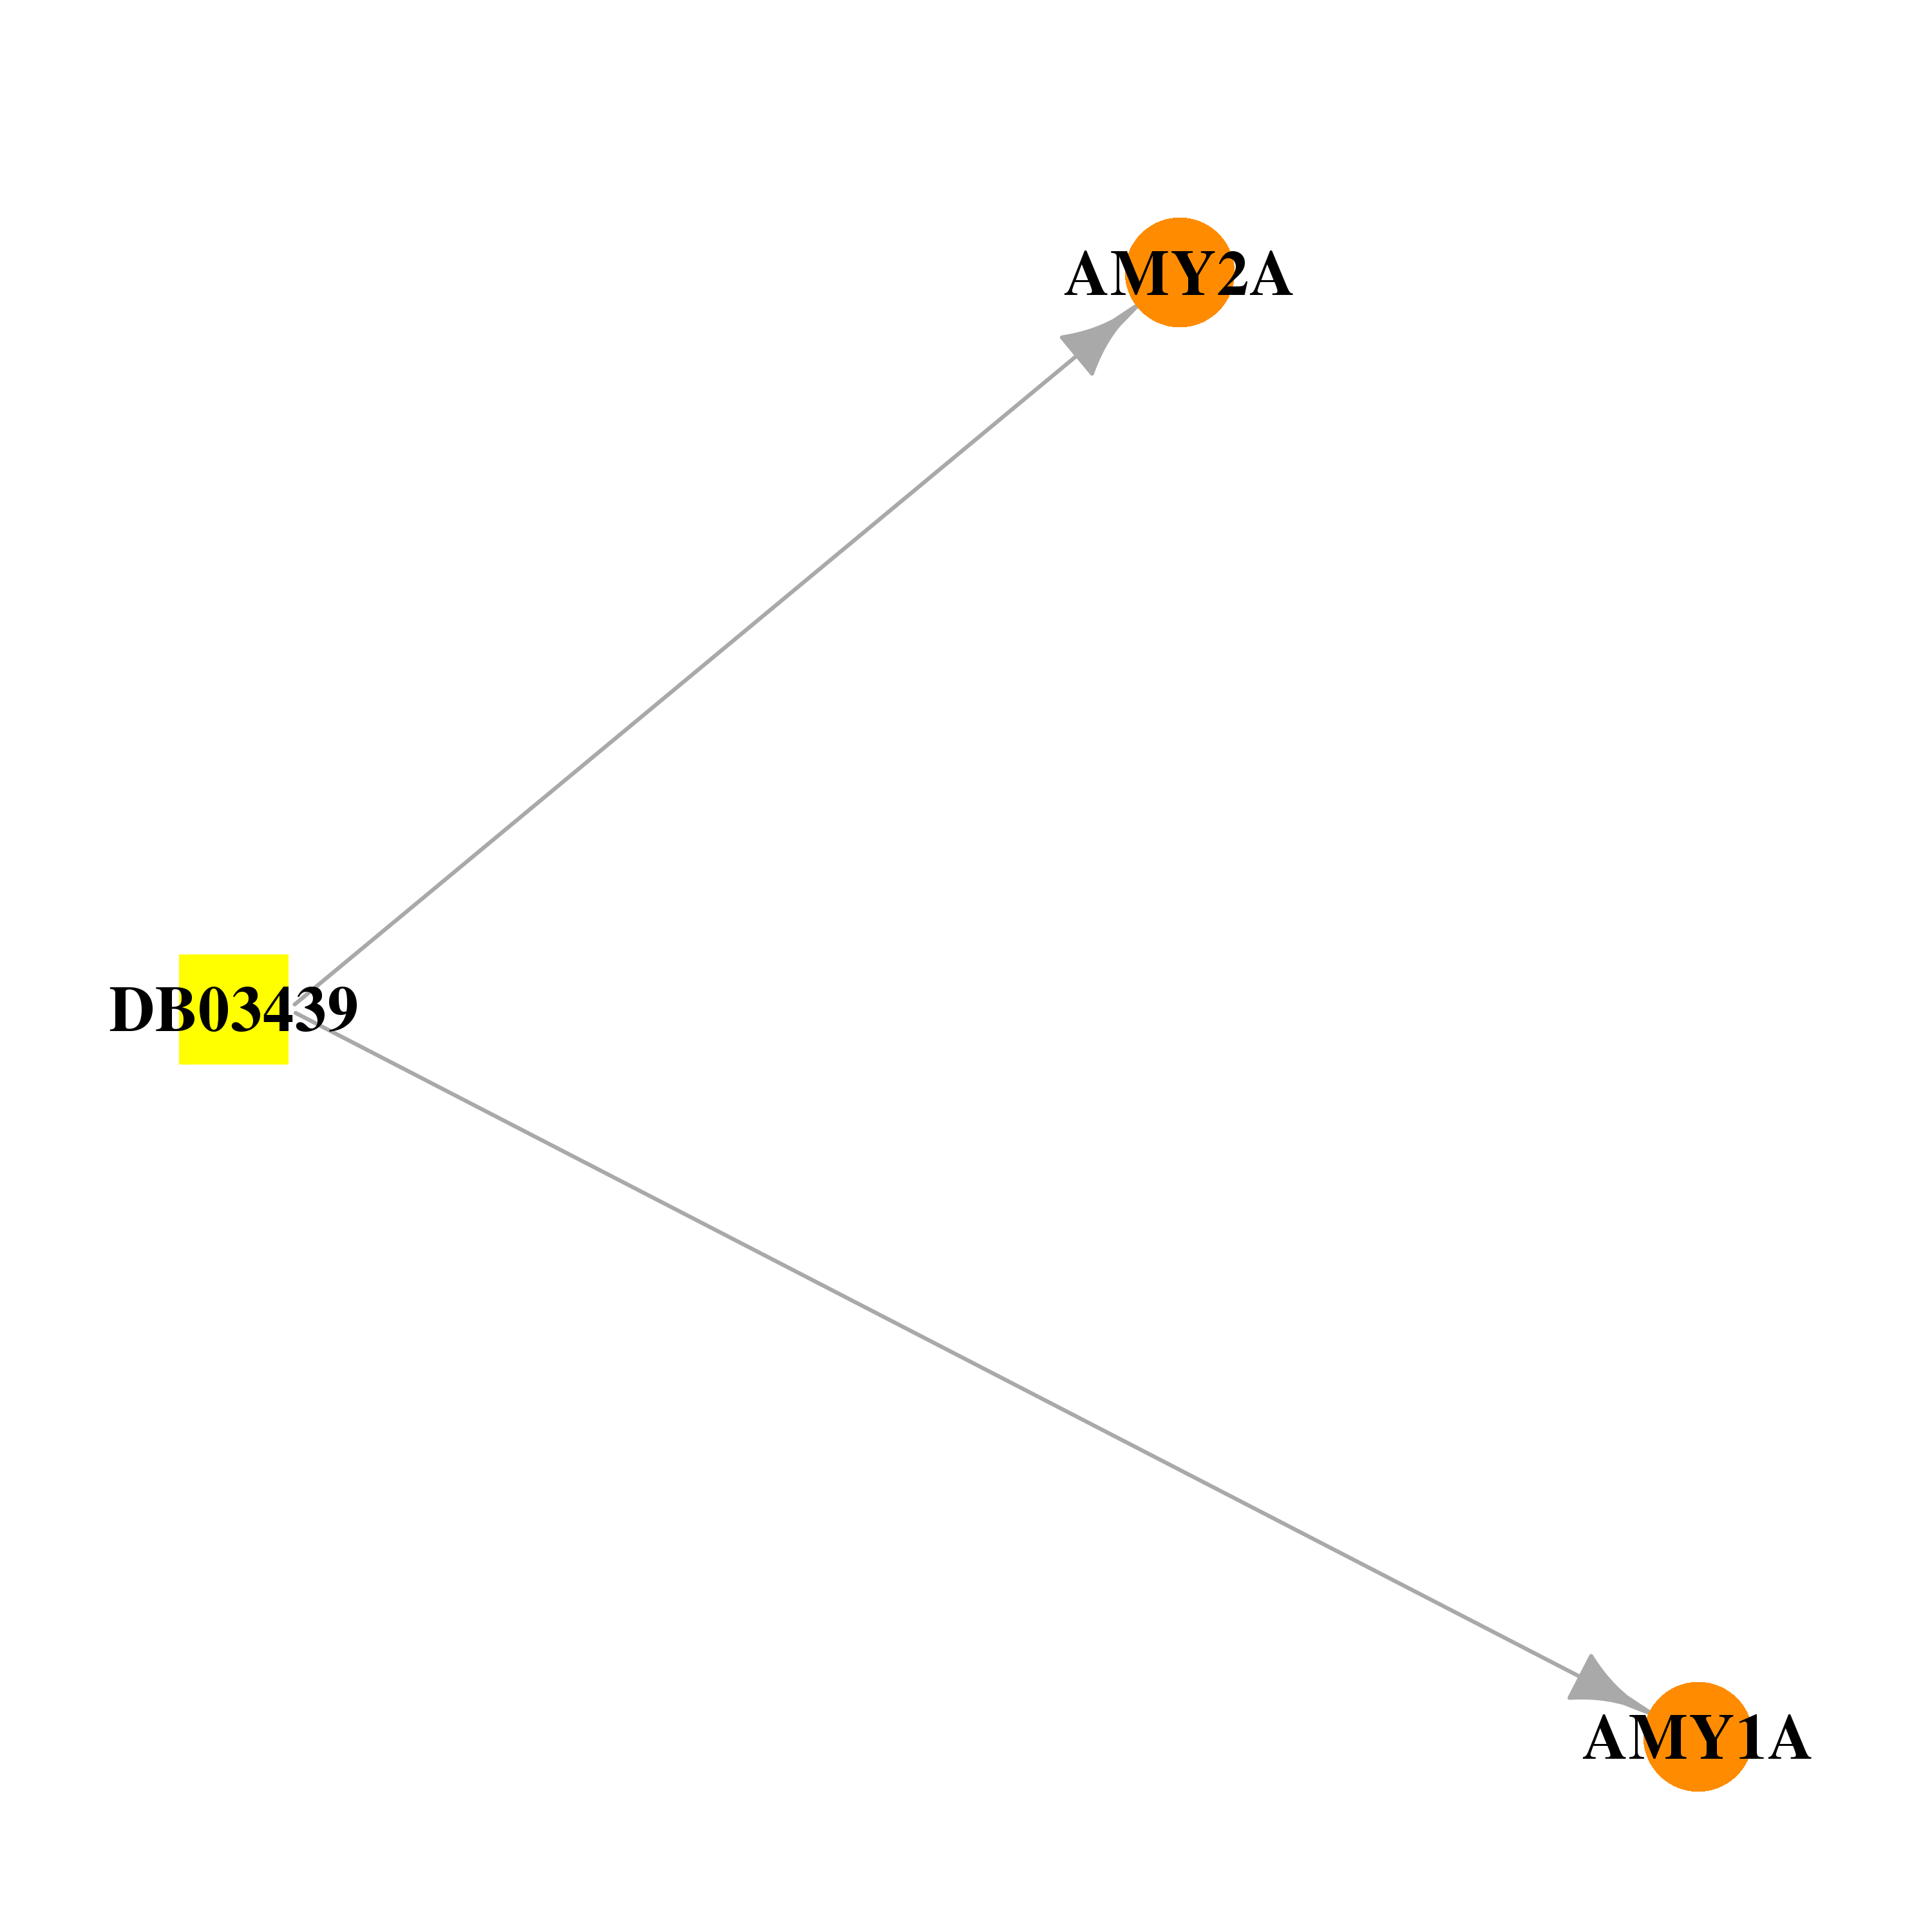 | 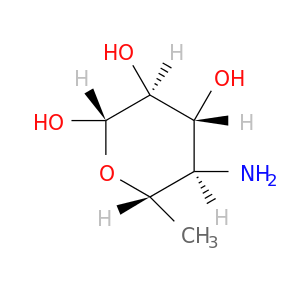 |
| DB04237 | amylase, alpha 1A (salivary) | experimental | Tris(Hydroxyethyl)Aminomethane | 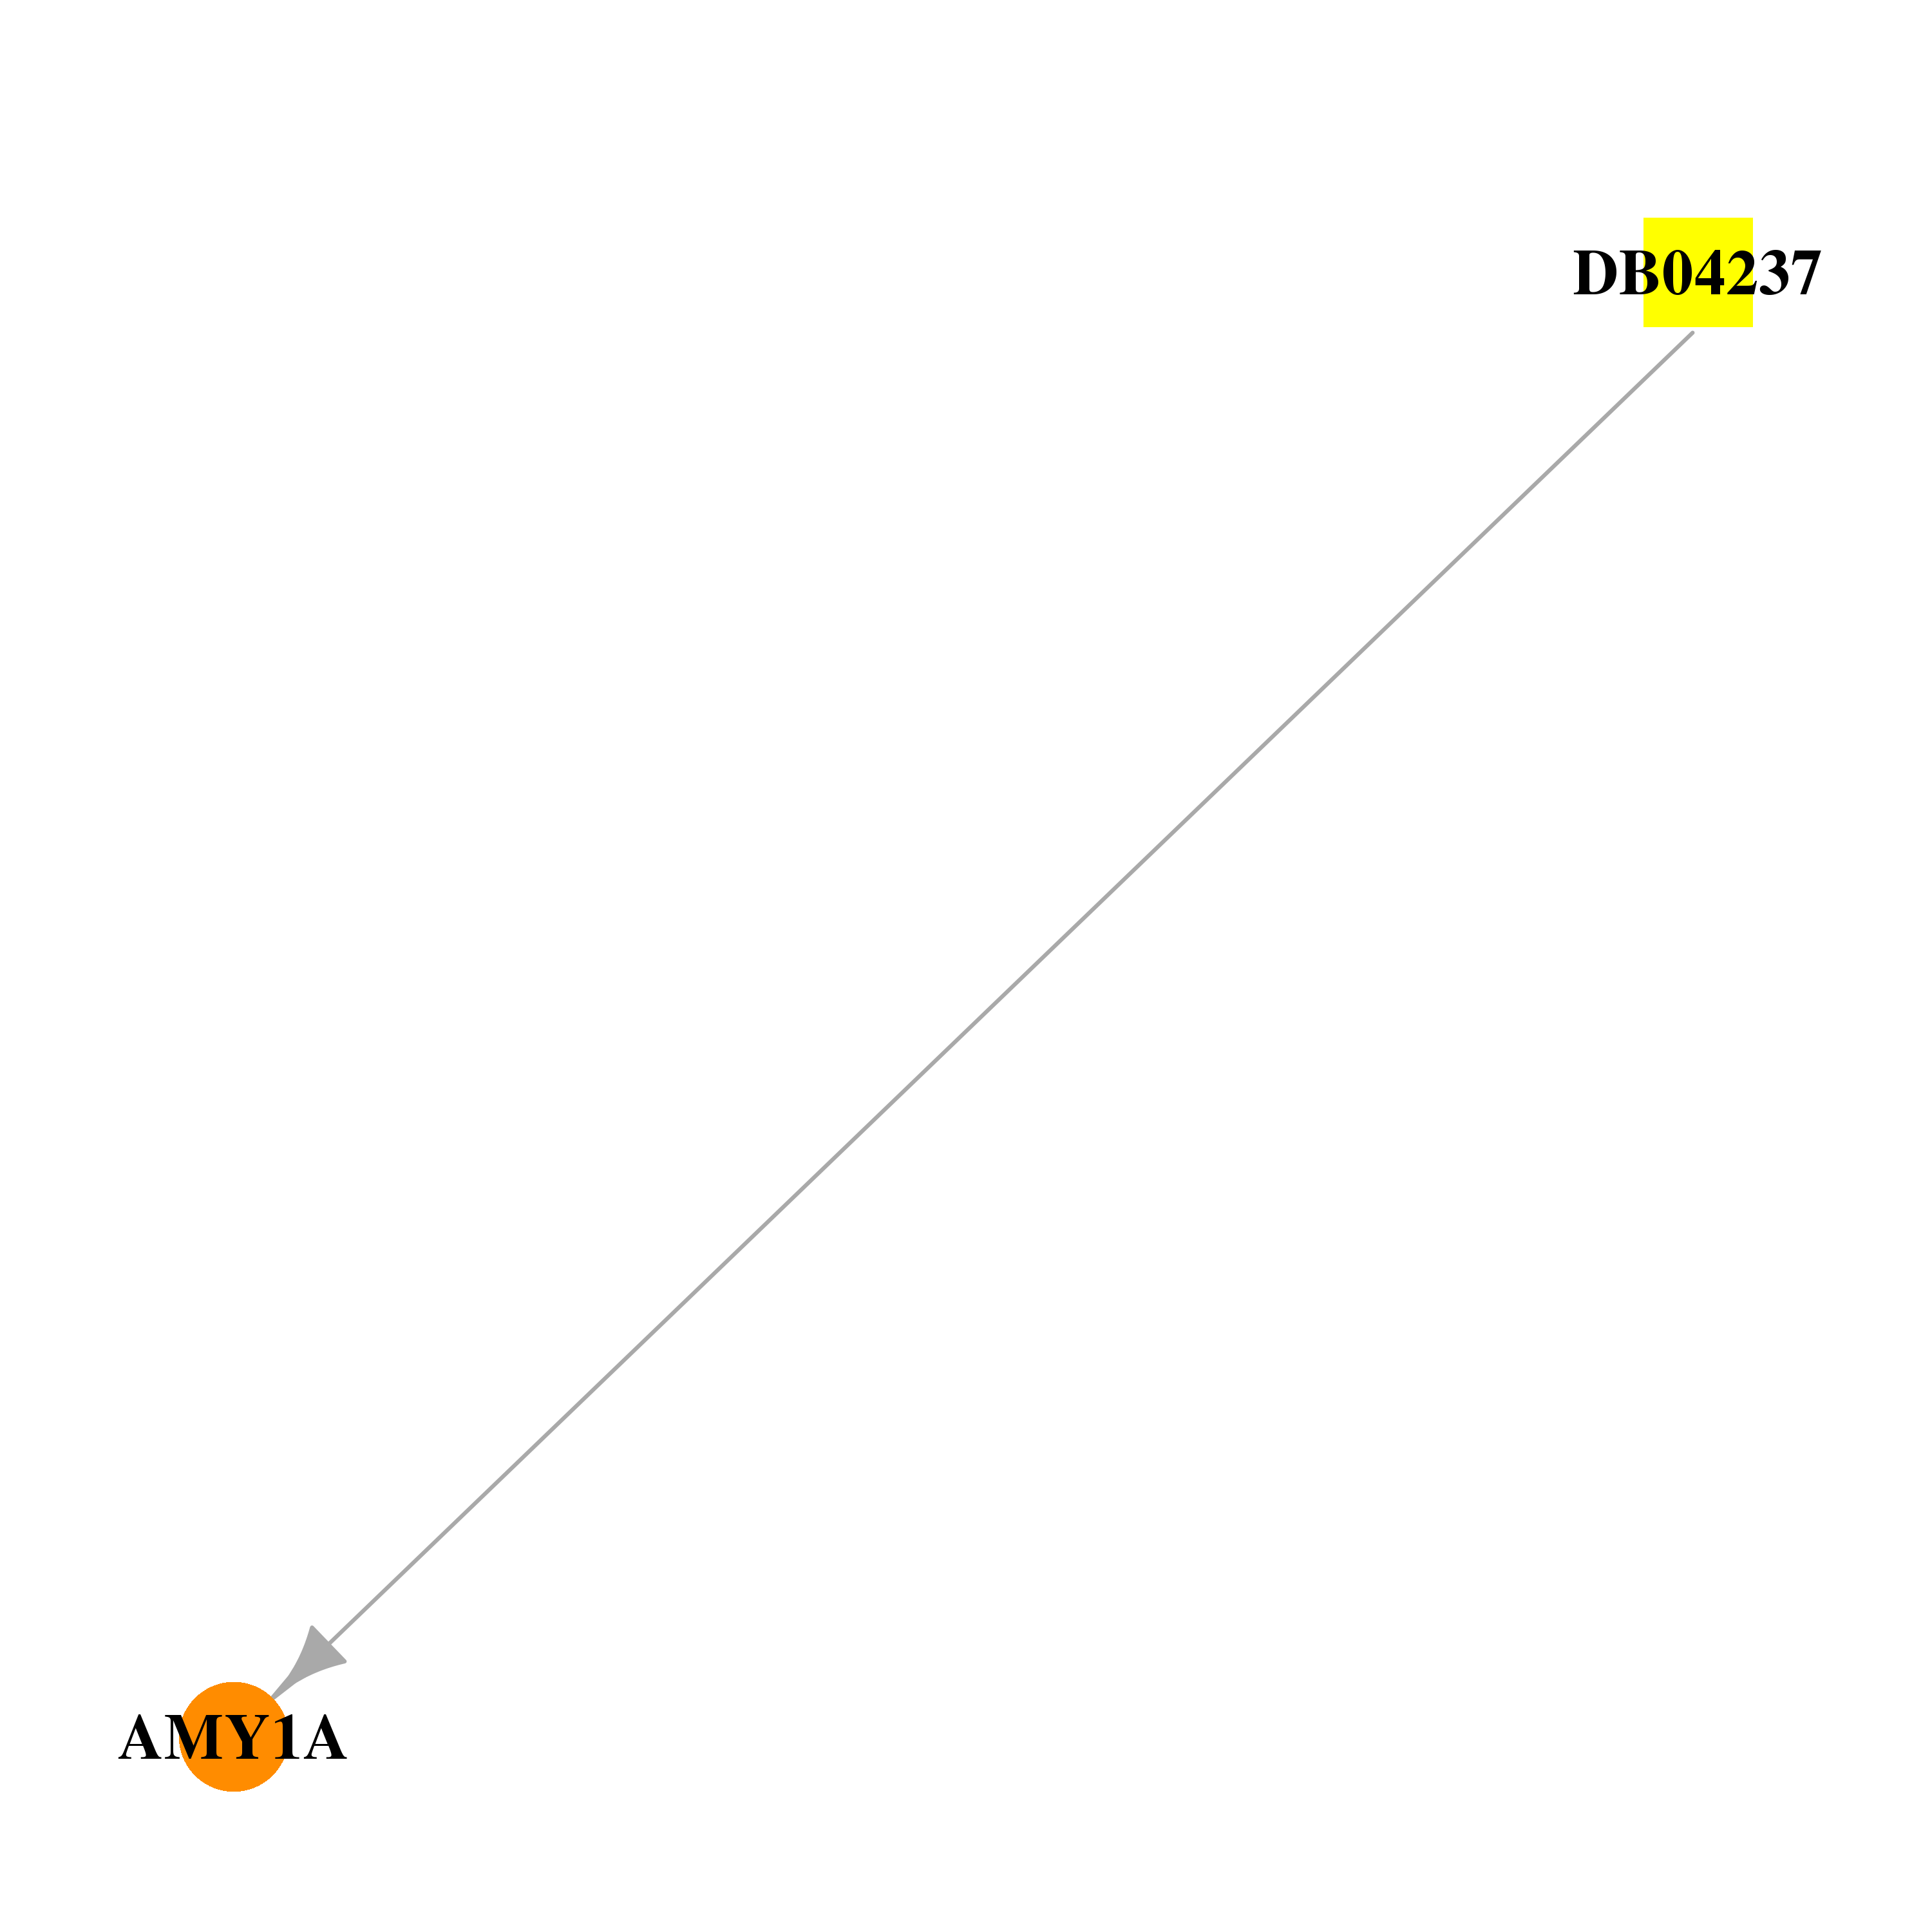 | 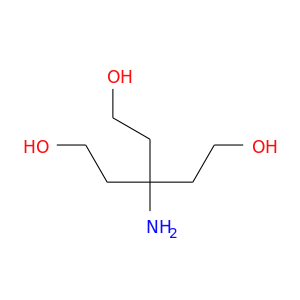 |
| DB00218 | amylase, alpha 1A (salivary) | approved; investigational | Moxifloxacin |  | 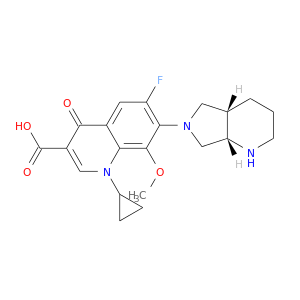 |
| Top |
| Cross referenced IDs for AMY1A |
| * We obtained these cross-references from Uniprot database. It covers 150 different DBs, 18 categories. http://www.uniprot.org/help/cross_references_section |
: Open all cross reference information
|
Copyright © 2016-Present - The Univsersity of Texas Health Science Center at Houston @ |