|
||||||||||||||||||||
| |
| Phenotypic Information (metabolism pathway, cancer, disease, phenome) |
| |
| |
| Gene-Gene Network Information: Co-Expression Network, Interacting Genes & KEGG |
| |
|


| Gene Summary for GM2A |
| Top |
| Phenotypic Information for GM2A(metabolism pathway, cancer, disease, phenome) |
| Cancer | CGAP: GM2A |
| Familial Cancer Database: GM2A | |
| * This gene is included in those cancer gene databases. |
|
|
|
|
|
| . | ||||||||||||||
Oncogene 1 | Significant driver gene in | |||||||||||||||||||
| cf) number; DB name 1 Oncogene; http://nar.oxfordjournals.org/content/35/suppl_1/D721.long, 2 Tumor Suppressor gene; https://bioinfo.uth.edu/TSGene/, 3 Cancer Gene Census; http://www.nature.com/nrc/journal/v4/n3/abs/nrc1299.html, 4 CancerGenes; http://nar.oxfordjournals.org/content/35/suppl_1/D721.long, 5 Network of Cancer Gene; http://ncg.kcl.ac.uk/index.php, 1Therapeutic Vulnerabilities in Cancer; http://cbio.mskcc.org/cancergenomics/statius/ |
| REACTOME_GLYCOSPHINGOLIPID_METABOLISM REACTOME_PHOSPHOLIPID_METABOLISM REACTOME_SPHINGOLIPID_METABOLISM REACTOME_METABOLISM_OF_LIPIDS_AND_LIPOPROTEINS | |
| OMIM | |
| Orphanet | |
| Disease | KEGG Disease: GM2A |
| MedGen: GM2A (Human Medical Genetics with Condition) | |
| ClinVar: GM2A | |
| Phenotype | MGI: GM2A (International Mouse Phenotyping Consortium) |
| PhenomicDB: GM2A | |
| Mutations for GM2A |
| * Under tables are showing count per each tissue to give us broad intuition about tissue specific mutation patterns.You can go to the detailed page for each mutation database's web site. |
| There's no structural variation information in COSMIC data for this gene. |
| * From mRNA Sanger sequences, Chitars2.0 arranged chimeric transcripts. This table shows GM2A related fusion information. |
| ID | Head Gene | Tail Gene | Accession | Gene_a | qStart_a | qEnd_a | Chromosome_a | tStart_a | tEnd_a | Gene_a | qStart_a | qEnd_a | Chromosome_a | tStart_a | tEnd_a |
| BU620269 | SYN1 | 18 | 180 | X | 47446026 | 47446188 | GM2A | 176 | 704 | 5 | 150647002 | 150647534 | |
| BQ549982 | CD68 | 1 | 198 | 17 | 7482987 | 7483267 | GM2A | 198 | 477 | 5 | 150648146 | 150648425 | |
| Top |
| There's no copy number variation information in COSMIC data for this gene. |
| Top |
|
 |
| Top |
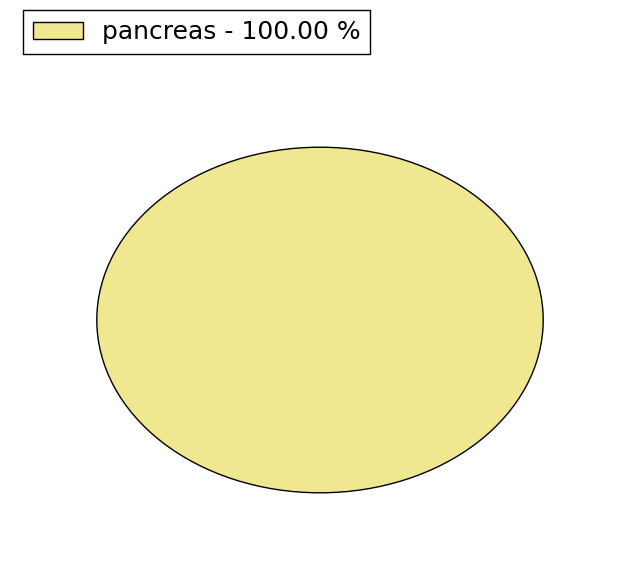
| Stat. for Non-Synonymous SNVs (# total SNVs=14) | (# total SNVs=8) |
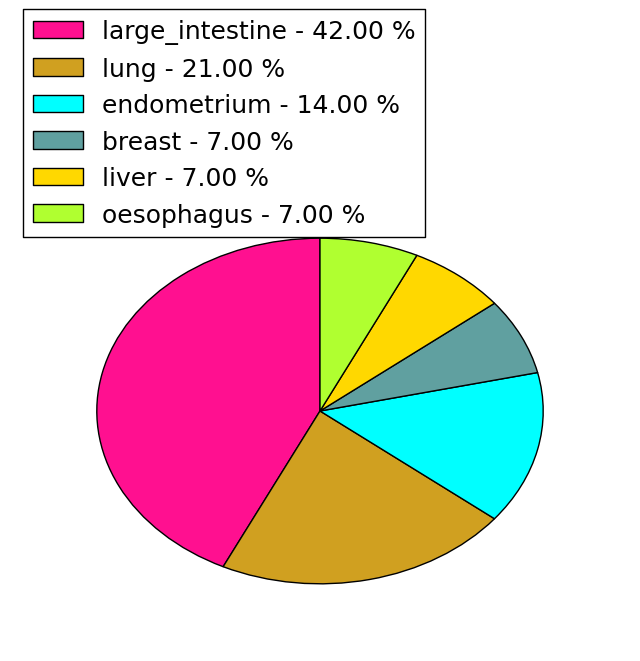 |  |
(# total SNVs=2) | (# total SNVs=0) |
 |
| Top |
| * When you move the cursor on each content, you can see more deailed mutation information on the Tooltip. Those are primary_site,primary_histology,mutation(aa),pubmedID. |
| GRCh37 position | Mutation(aa) | Unique sampleID count |
| chr5:150632814-150632814 | p.L13M | 3 |
| chr5:150646888-150646888 | p.V153A | 2 |
| chr5:150646946-150646946 | p.S172S | 2 |
| chr5:150639348-150639348 | p.C39fs*9 | 2 |
| chr5:150646433-150646433 | p.L129L | 1 |
| chr5:150646969-150646969 | p.R180L | 1 |
| chr5:150639411-150639411 | p.I59I | 1 |
| chr5:150646436-150646436 | p.R130C | 1 |
| chr5:150646988-150646988 | p.I186I | 1 |
| chr5:150639454-150639454 | p.V74I | 1 |
| Top |
|
 |
| Point Mutation/ Tissue ID | 1 | 2 | 3 | 4 | 5 | 6 | 7 | 8 | 9 | 10 | 11 | 12 | 13 | 14 | 15 | 16 | 17 | 18 | 19 | 20 |
| # sample | 1 | 4 | 1 | 1 | 2 | 4 | 2 | 3 | ||||||||||||
| # mutation | 1 | 3 | 1 | 1 | 2 | 4 | 2 | 3 | ||||||||||||
| nonsynonymous SNV | 2 | 1 | 2 | 2 | 2 | |||||||||||||||
| synonymous SNV | 1 | 2 | 1 | 1 | 1 | 2 | 1 |
| cf) Tissue ID; Tissue type (1; BLCA[Bladder Urothelial Carcinoma], 2; BRCA[Breast invasive carcinoma], 3; CESC[Cervical squamous cell carcinoma and endocervical adenocarcinoma], 4; COAD[Colon adenocarcinoma], 5; GBM[Glioblastoma multiforme], 6; Glioma Low Grade, 7; HNSC[Head and Neck squamous cell carcinoma], 8; KICH[Kidney Chromophobe], 9; KIRC[Kidney renal clear cell carcinoma], 10; KIRP[Kidney renal papillary cell carcinoma], 11; LAML[Acute Myeloid Leukemia], 12; LUAD[Lung adenocarcinoma], 13; LUSC[Lung squamous cell carcinoma], 14; OV[Ovarian serous cystadenocarcinoma ], 15; PAAD[Pancreatic adenocarcinoma], 16; PRAD[Prostate adenocarcinoma], 17; SKCM[Skin Cutaneous Melanoma], 18:STAD[Stomach adenocarcinoma], 19:THCA[Thyroid carcinoma], 20:UCEC[Uterine Corpus Endometrial Carcinoma]) |
| Top |
| * We represented just top 10 SNVs. When you move the cursor on each content, you can see more deailed mutation information on the Tooltip. Those are primary_site, primary_histology, mutation(aa), pubmedID. |
| Genomic Position | Mutation(aa) | Unique sampleID count |
| chr5:150646946 | p.S172S | 2 |
| chr5:150632814 | p.L13M,GM2A | 2 |
| chr5:150646406 | p.L129L,GM2A | 1 |
| chr5:150646433 | p.R130C,GM2A | 1 |
| chr5:150646436 | p.R130H,GM2A | 1 |
| chr5:150632802 | p.S176N | 1 |
| chr5:150646437 | p.S177S | 1 |
| chr5:150632804 | p.I186I | 1 |
| chr5:150646957 | p.L9F,GM2A | 1 |
| chr5:150632828 | p.L9L,GM2A | 1 |
| * Copy number data were extracted from TCGA using R package TCGA-Assembler. The URLs of all public data files on TCGA DCC data server were gathered on Jan-05-2015. Function ProcessCNAData in TCGA-Assembler package was used to obtain gene-level copy number value which is calculated as the average copy number of the genomic region of a gene. |
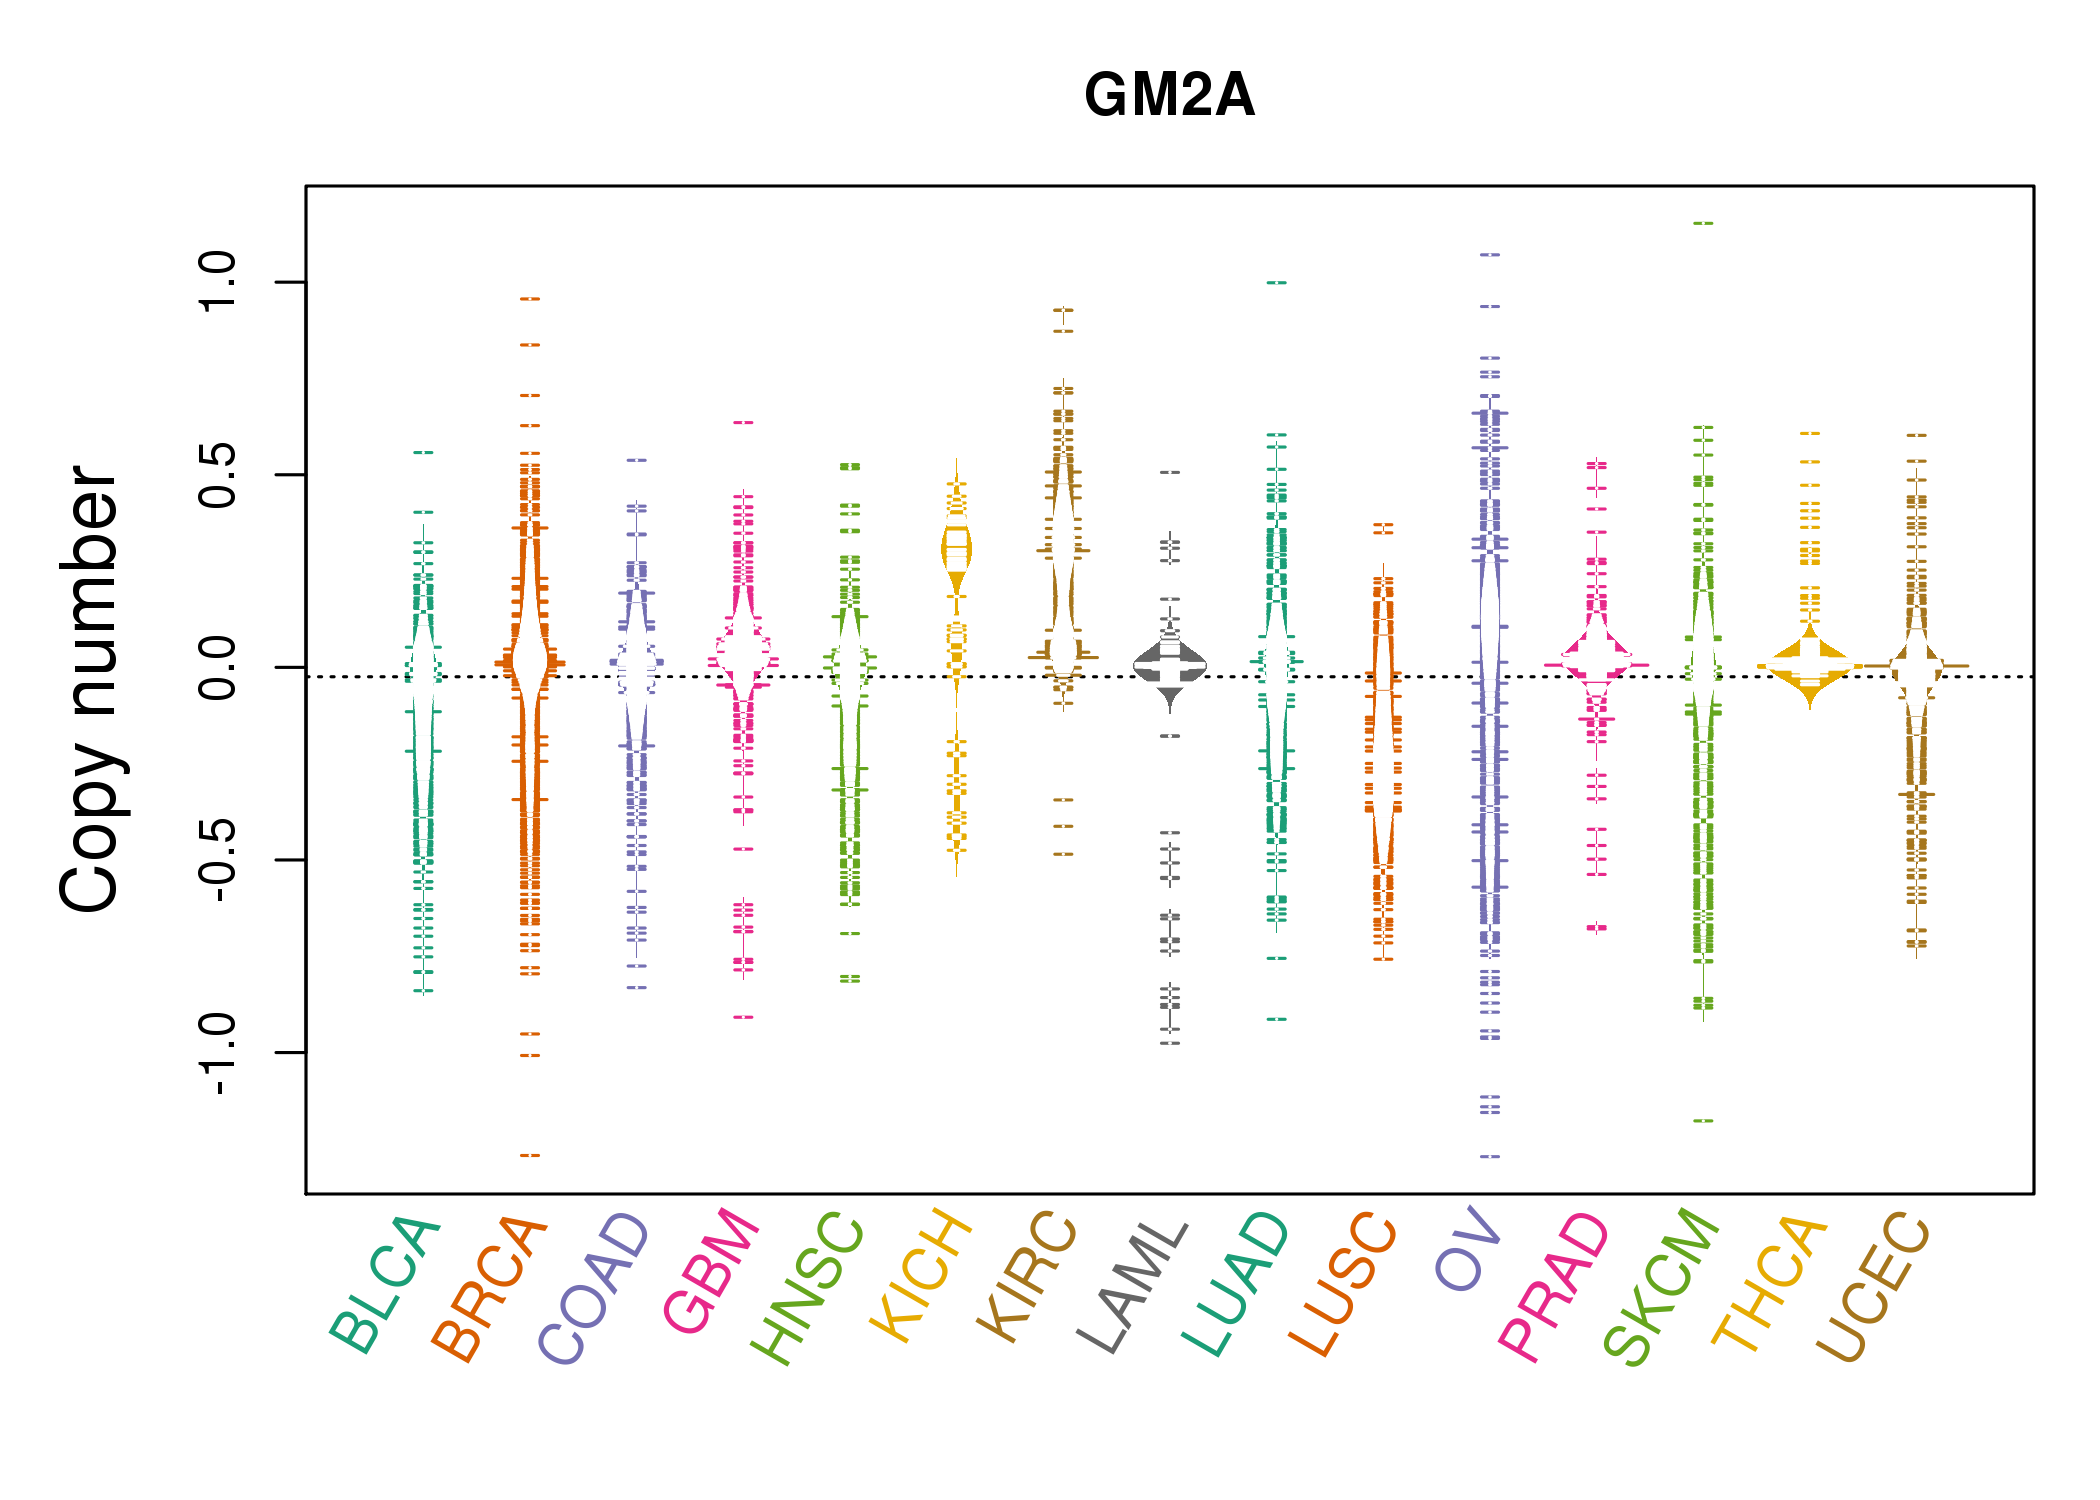 |
| cf) Tissue ID[Tissue type]: BLCA[Bladder Urothelial Carcinoma], BRCA[Breast invasive carcinoma], CESC[Cervical squamous cell carcinoma and endocervical adenocarcinoma], COAD[Colon adenocarcinoma], GBM[Glioblastoma multiforme], Glioma Low Grade, HNSC[Head and Neck squamous cell carcinoma], KICH[Kidney Chromophobe], KIRC[Kidney renal clear cell carcinoma], KIRP[Kidney renal papillary cell carcinoma], LAML[Acute Myeloid Leukemia], LUAD[Lung adenocarcinoma], LUSC[Lung squamous cell carcinoma], OV[Ovarian serous cystadenocarcinoma ], PAAD[Pancreatic adenocarcinoma], PRAD[Prostate adenocarcinoma], SKCM[Skin Cutaneous Melanoma], STAD[Stomach adenocarcinoma], THCA[Thyroid carcinoma], UCEC[Uterine Corpus Endometrial Carcinoma] |
| Top |
| Gene Expression for GM2A |
| * CCLE gene expression data were extracted from CCLE_Expression_Entrez_2012-10-18.res: Gene-centric RMA-normalized mRNA expression data. |
 |
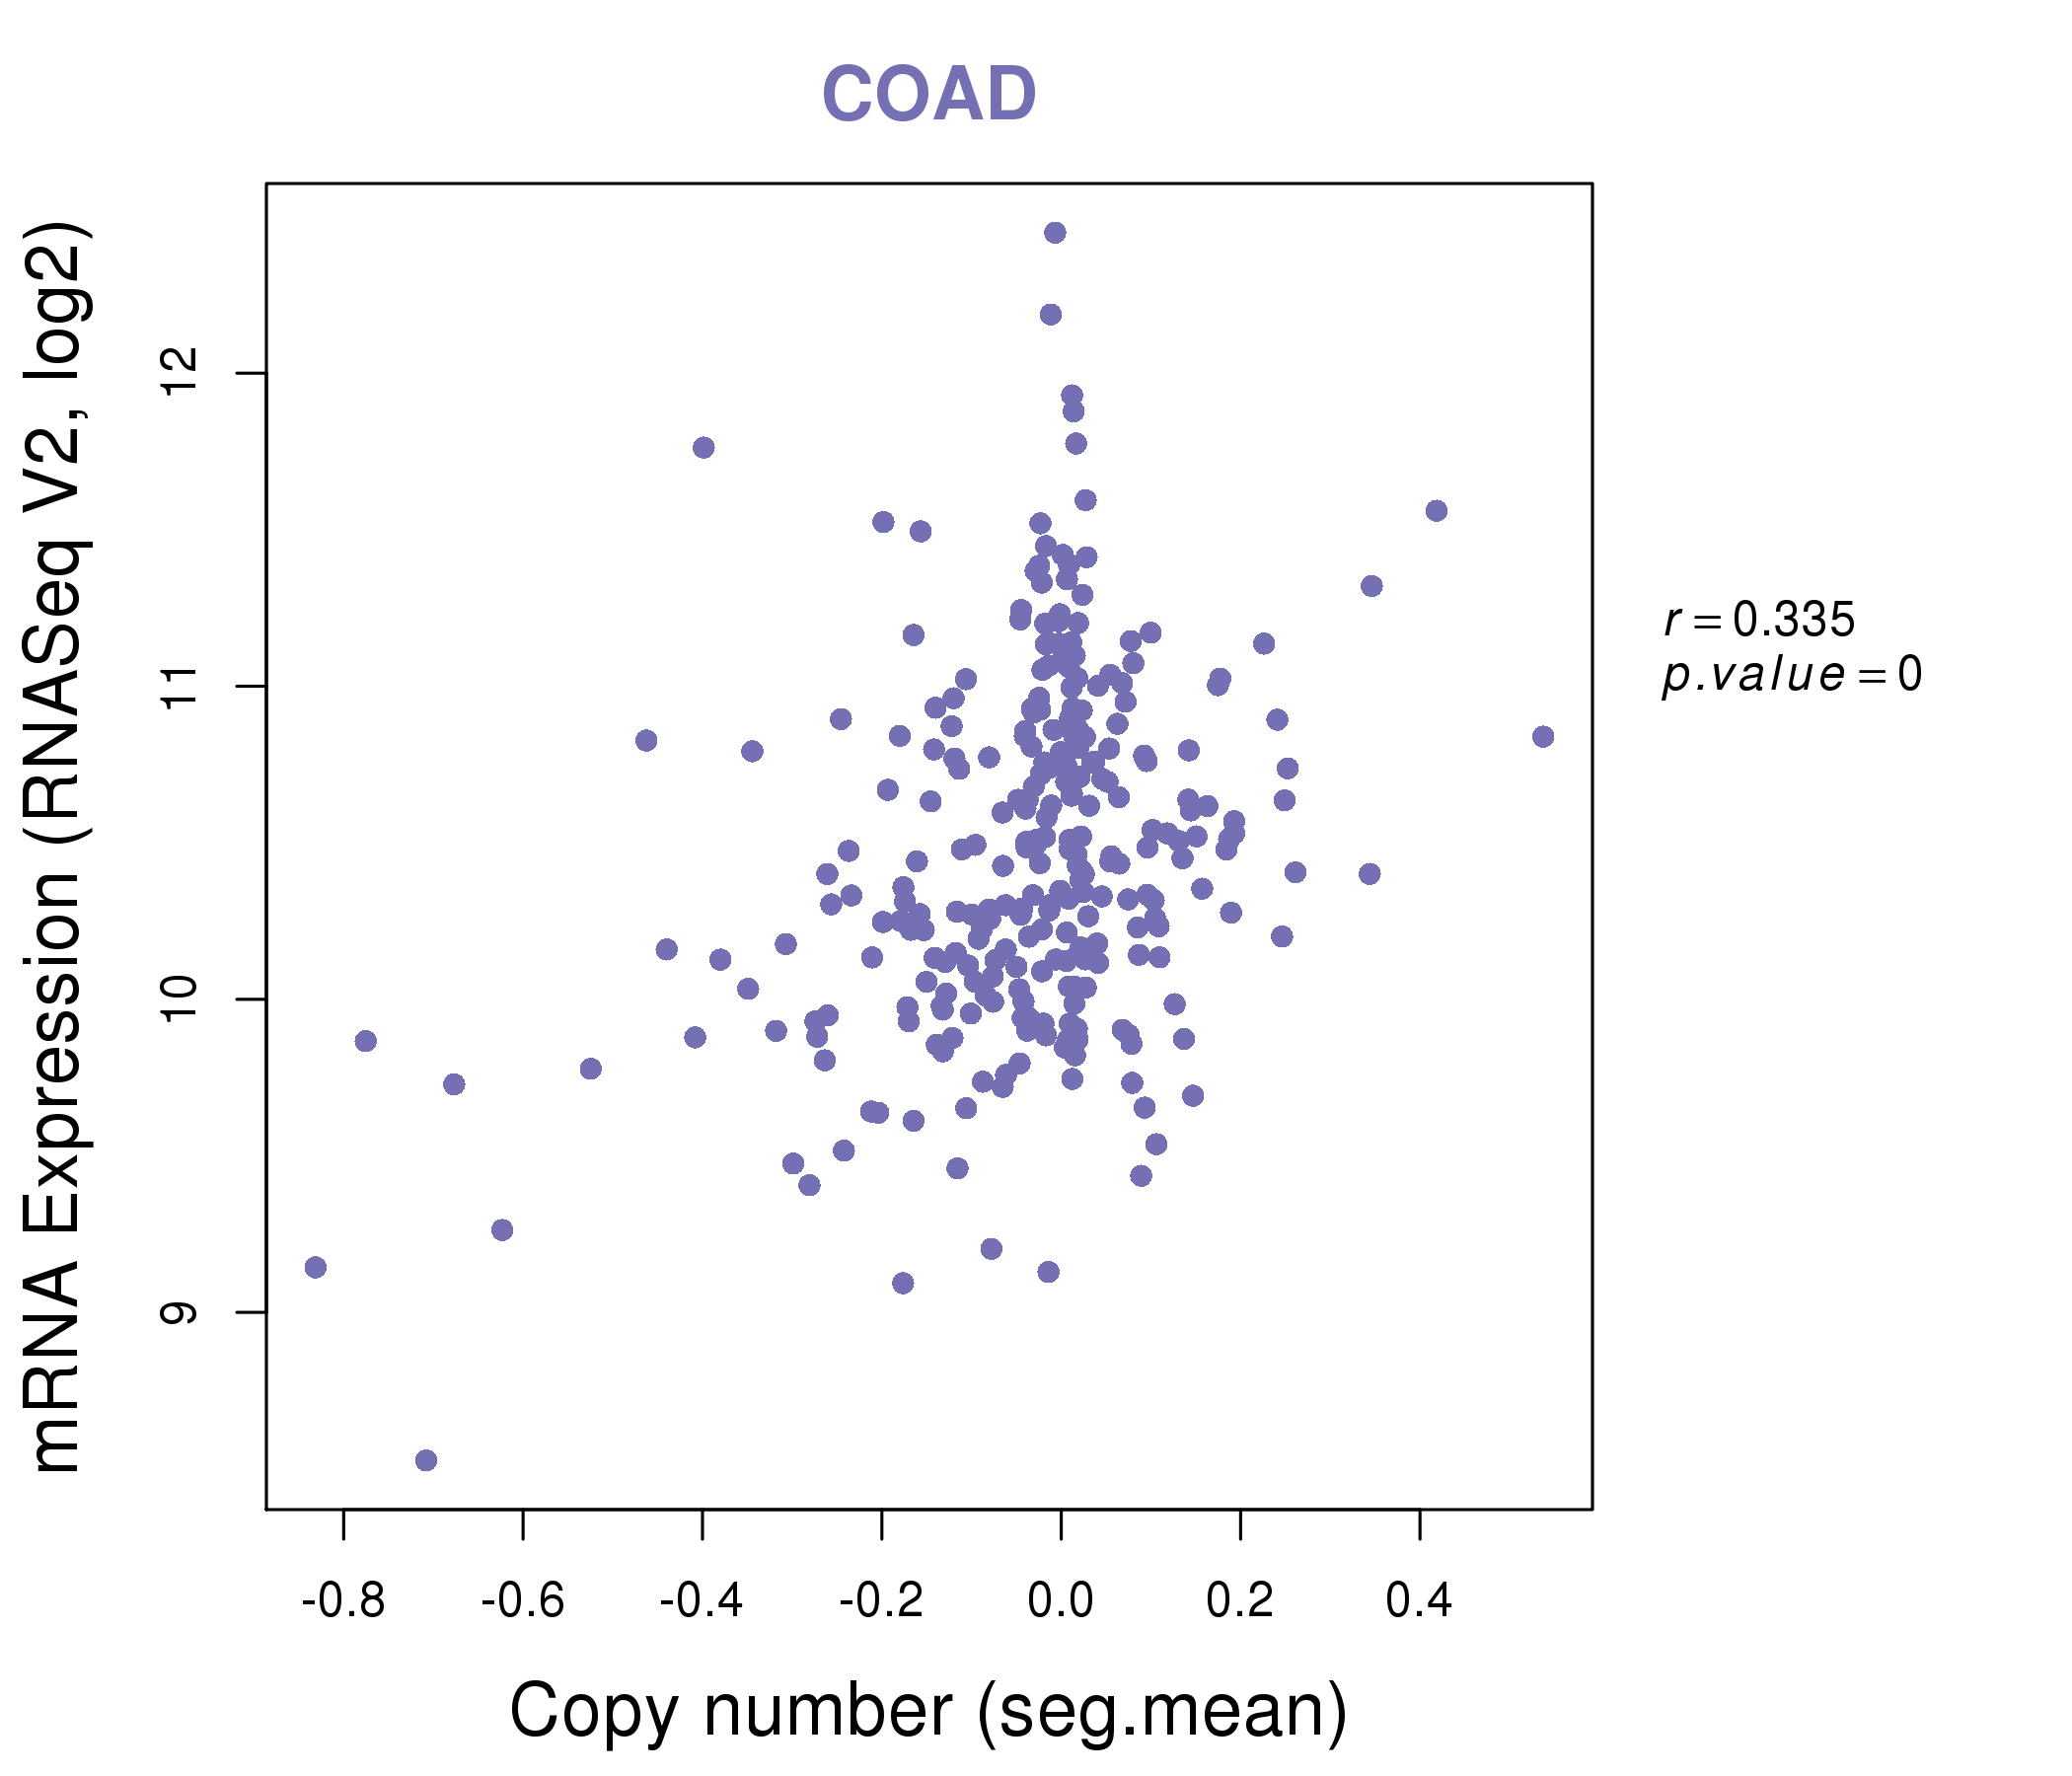
| * Normalized gene expression data of RNASeqV2 was extracted from TCGA using R package TCGA-Assembler. The URLs of all public data files on TCGA DCC data server were gathered at Jan-05-2015. Only eight cancer types have enough normal control samples for differential expression analysis. (t test, adjusted p<0.05 (using Benjamini-Hochberg FDR)) |
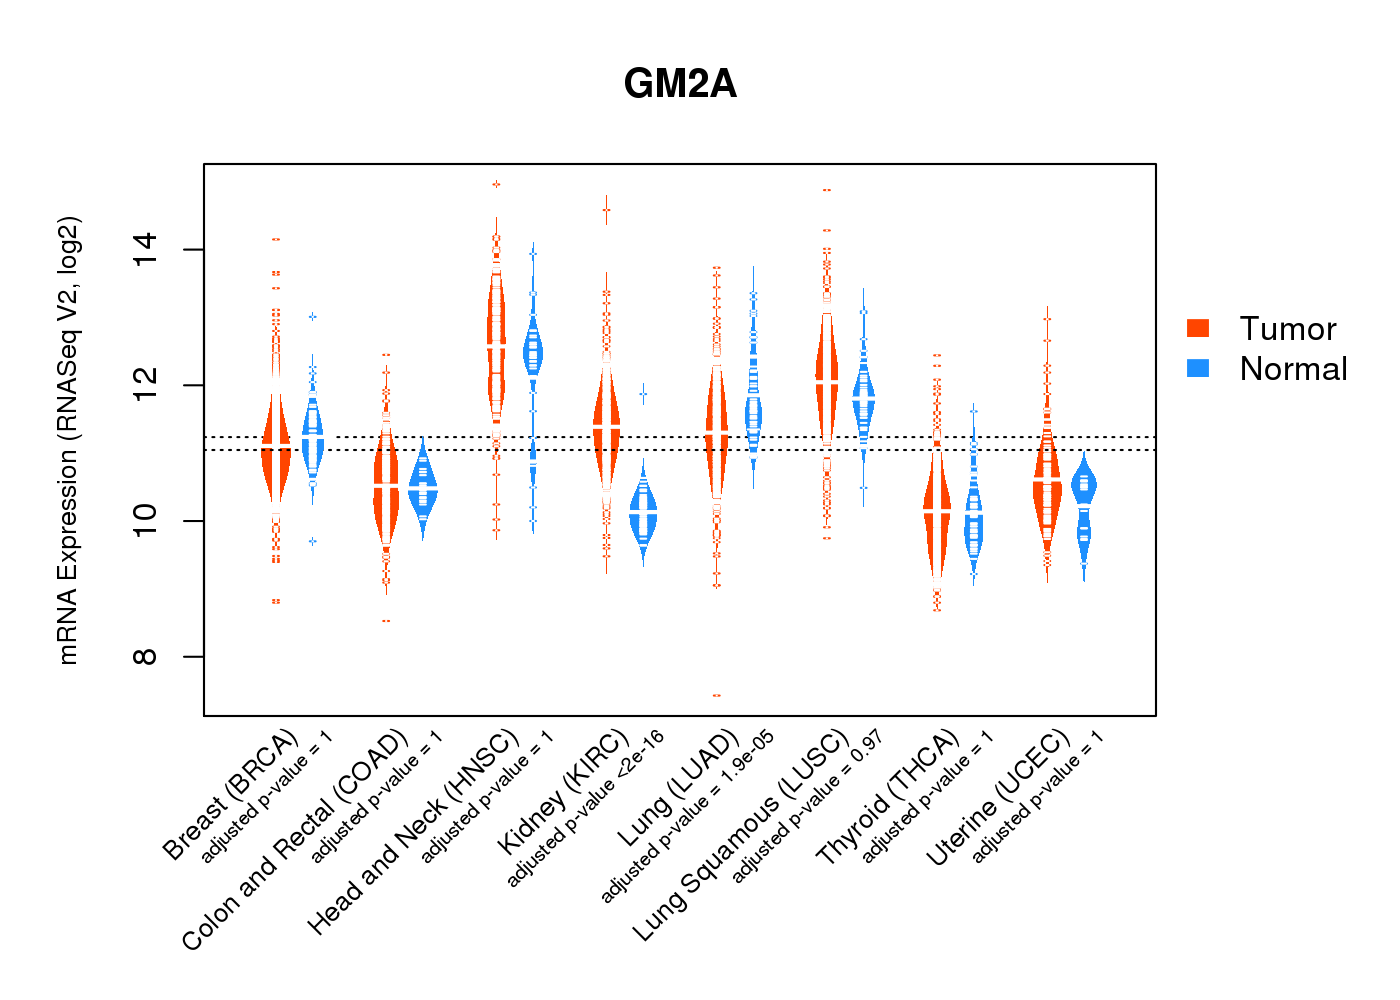 |
| Top |
| * This plots show the correlation between CNV and gene expression. |
: Open all plots for all cancer types
 |
|
 |
|


| Top |
| Gene-Gene Network Information |
| * Co-Expression network figures were drawn using R package igraph. Only the top 20 genes with the highest correlations were shown. Red circle: input gene, orange circle: cell metabolism gene, sky circle: other gene |
: Open all plots for all cancer types
 |
| ||||
| APOC1,CCRL2,CD300LF,CD68,CTSS,FGR,GM2A, HAVCR2,HTRA4,IFI30,IGSF6,ITGAX,ITGB2,LAPTM5, LILRB4,LIPA,NCF2,NPL,PILRA,SLC7A7,TRPV2 | ACP5,BCL2A1,CD300LF,CD52,CECR1,GM2A,IFI30, IGSF6,ITGAX,ITGB2,KCNJ5,LY86,PIK3R6,PLA2G7, SIGLEC7,SIRPB1,SLC29A3,TM4SF19,DCSTAMP,TREM2,TREML1 | ||||
 |
| ||||
| C1QA,C1QB,C1QC,CD300C,CD300LF,CD86,FCER1G, FCGR3A,GM2A,GPNMB,HAVCR2,HK3,IFI30,ITGB2, LAIR1,LAPTM5,LILRB4,SLAMF8,SLC15A3,SPI1,TYROBP | ARHGAP22,ARHGAP25,ARHGEF6,CD4,CMKLR1,CYTH4,FLI1, GM2A,GPSM3,IL10RA,ITGB2,KCNAB2,MFNG,NCKAP1L, OPRL1,ORAI2,PTAFR,SPI1,ST8SIA4,TGFB1,WIPF1 |

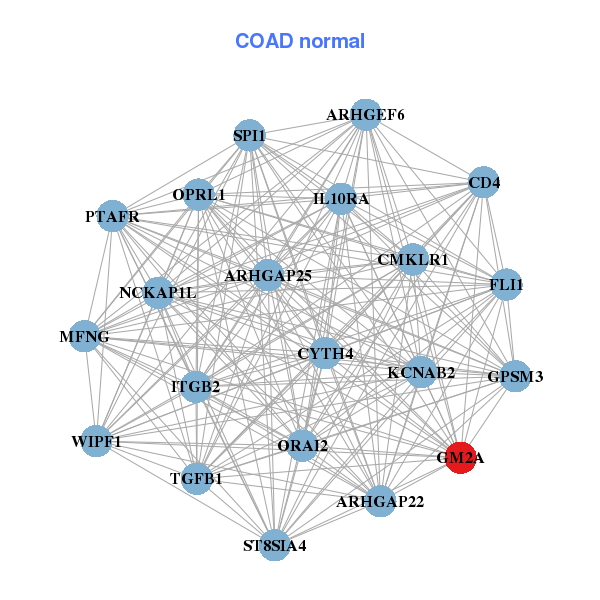
| * Co-Expression network figures were drawn using R package igraph. Only the top 20 genes with the highest correlations were shown. Red circle: input gene, orange circle: cell metabolism gene, sky circle: other gene |
: Open all plots for all cancer types
| Top |
: Open all interacting genes' information including KEGG pathway for all interacting genes from DAVID
| Top |
| Pharmacological Information for GM2A |
| DB Category | DB Name | DB's ID and Url link |
| * Gene Centered Interaction Network. |
 |
| * Drug Centered Interaction Network. |
| DrugBank ID | Target Name | Drug Groups | Generic Name | Drug Centered Network | Drug Structure |
| DB02261 | GM2 ganglioside activator | experimental | Platelet Activating Factor | 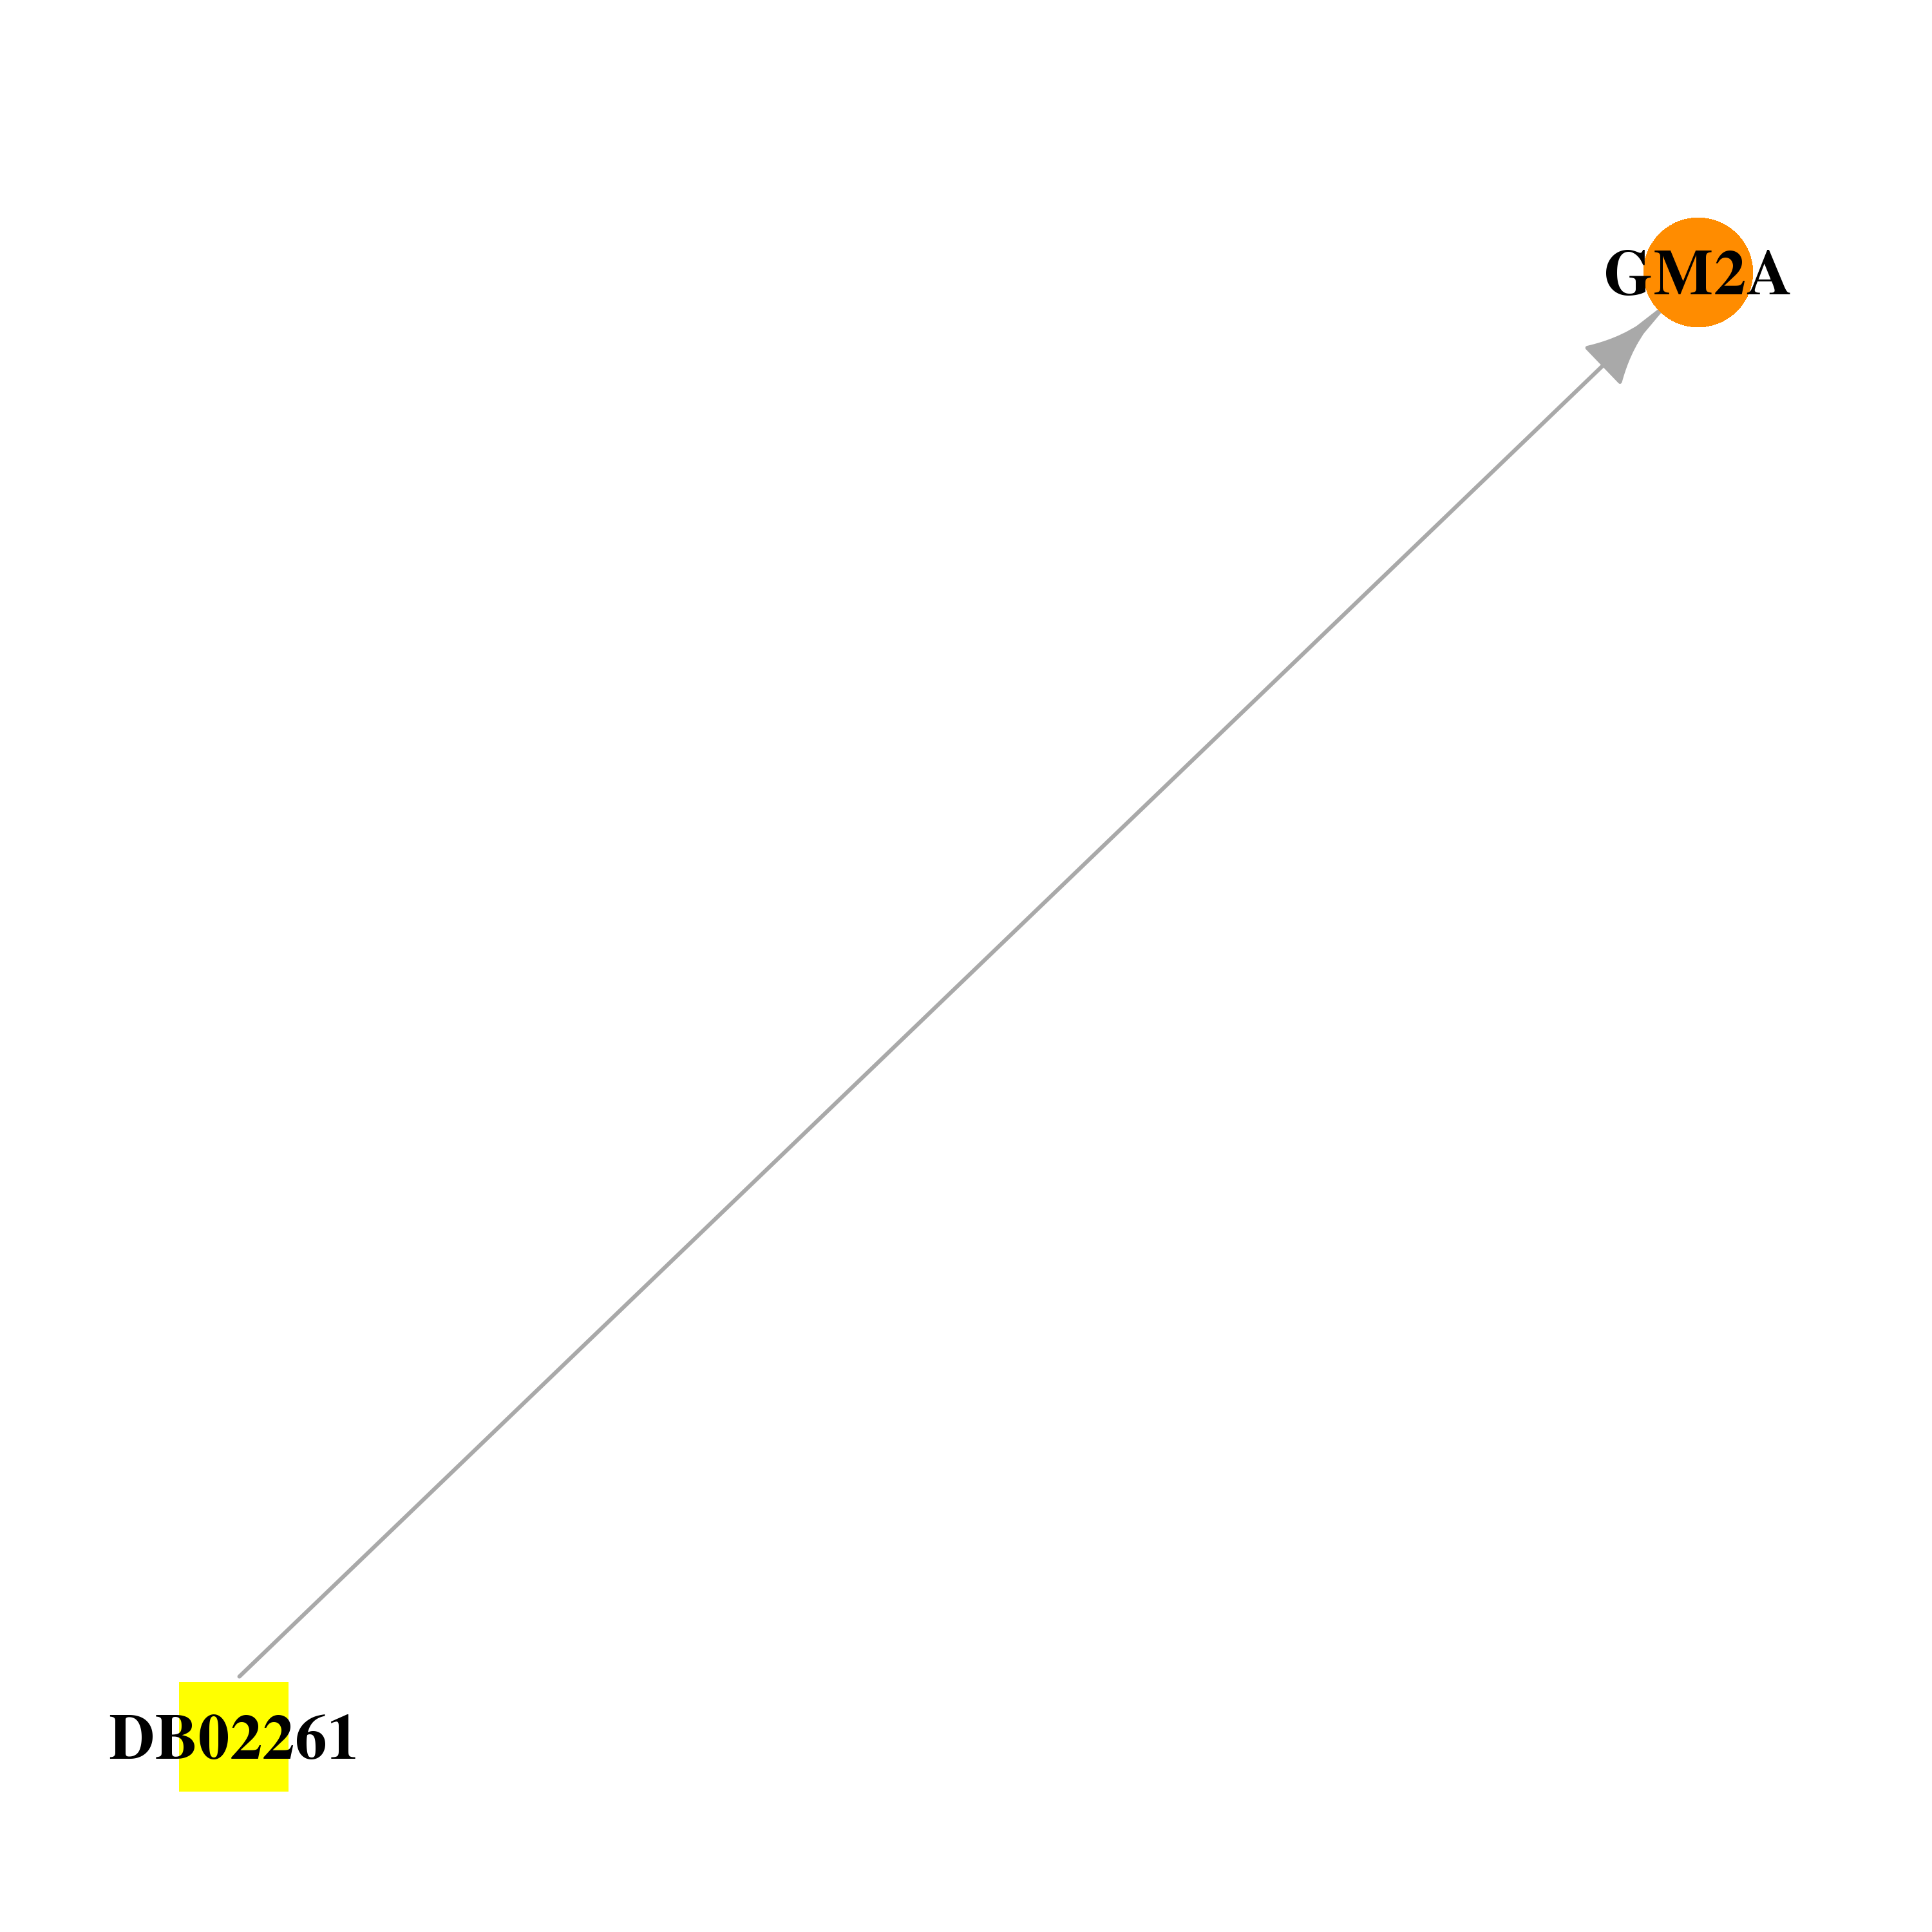 | 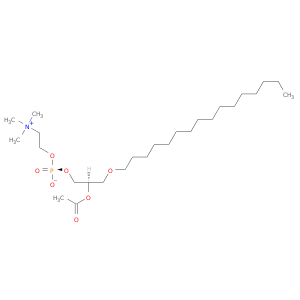 |
| DB03633 | GM2 ganglioside activator | experimental | Lpc-Ether | 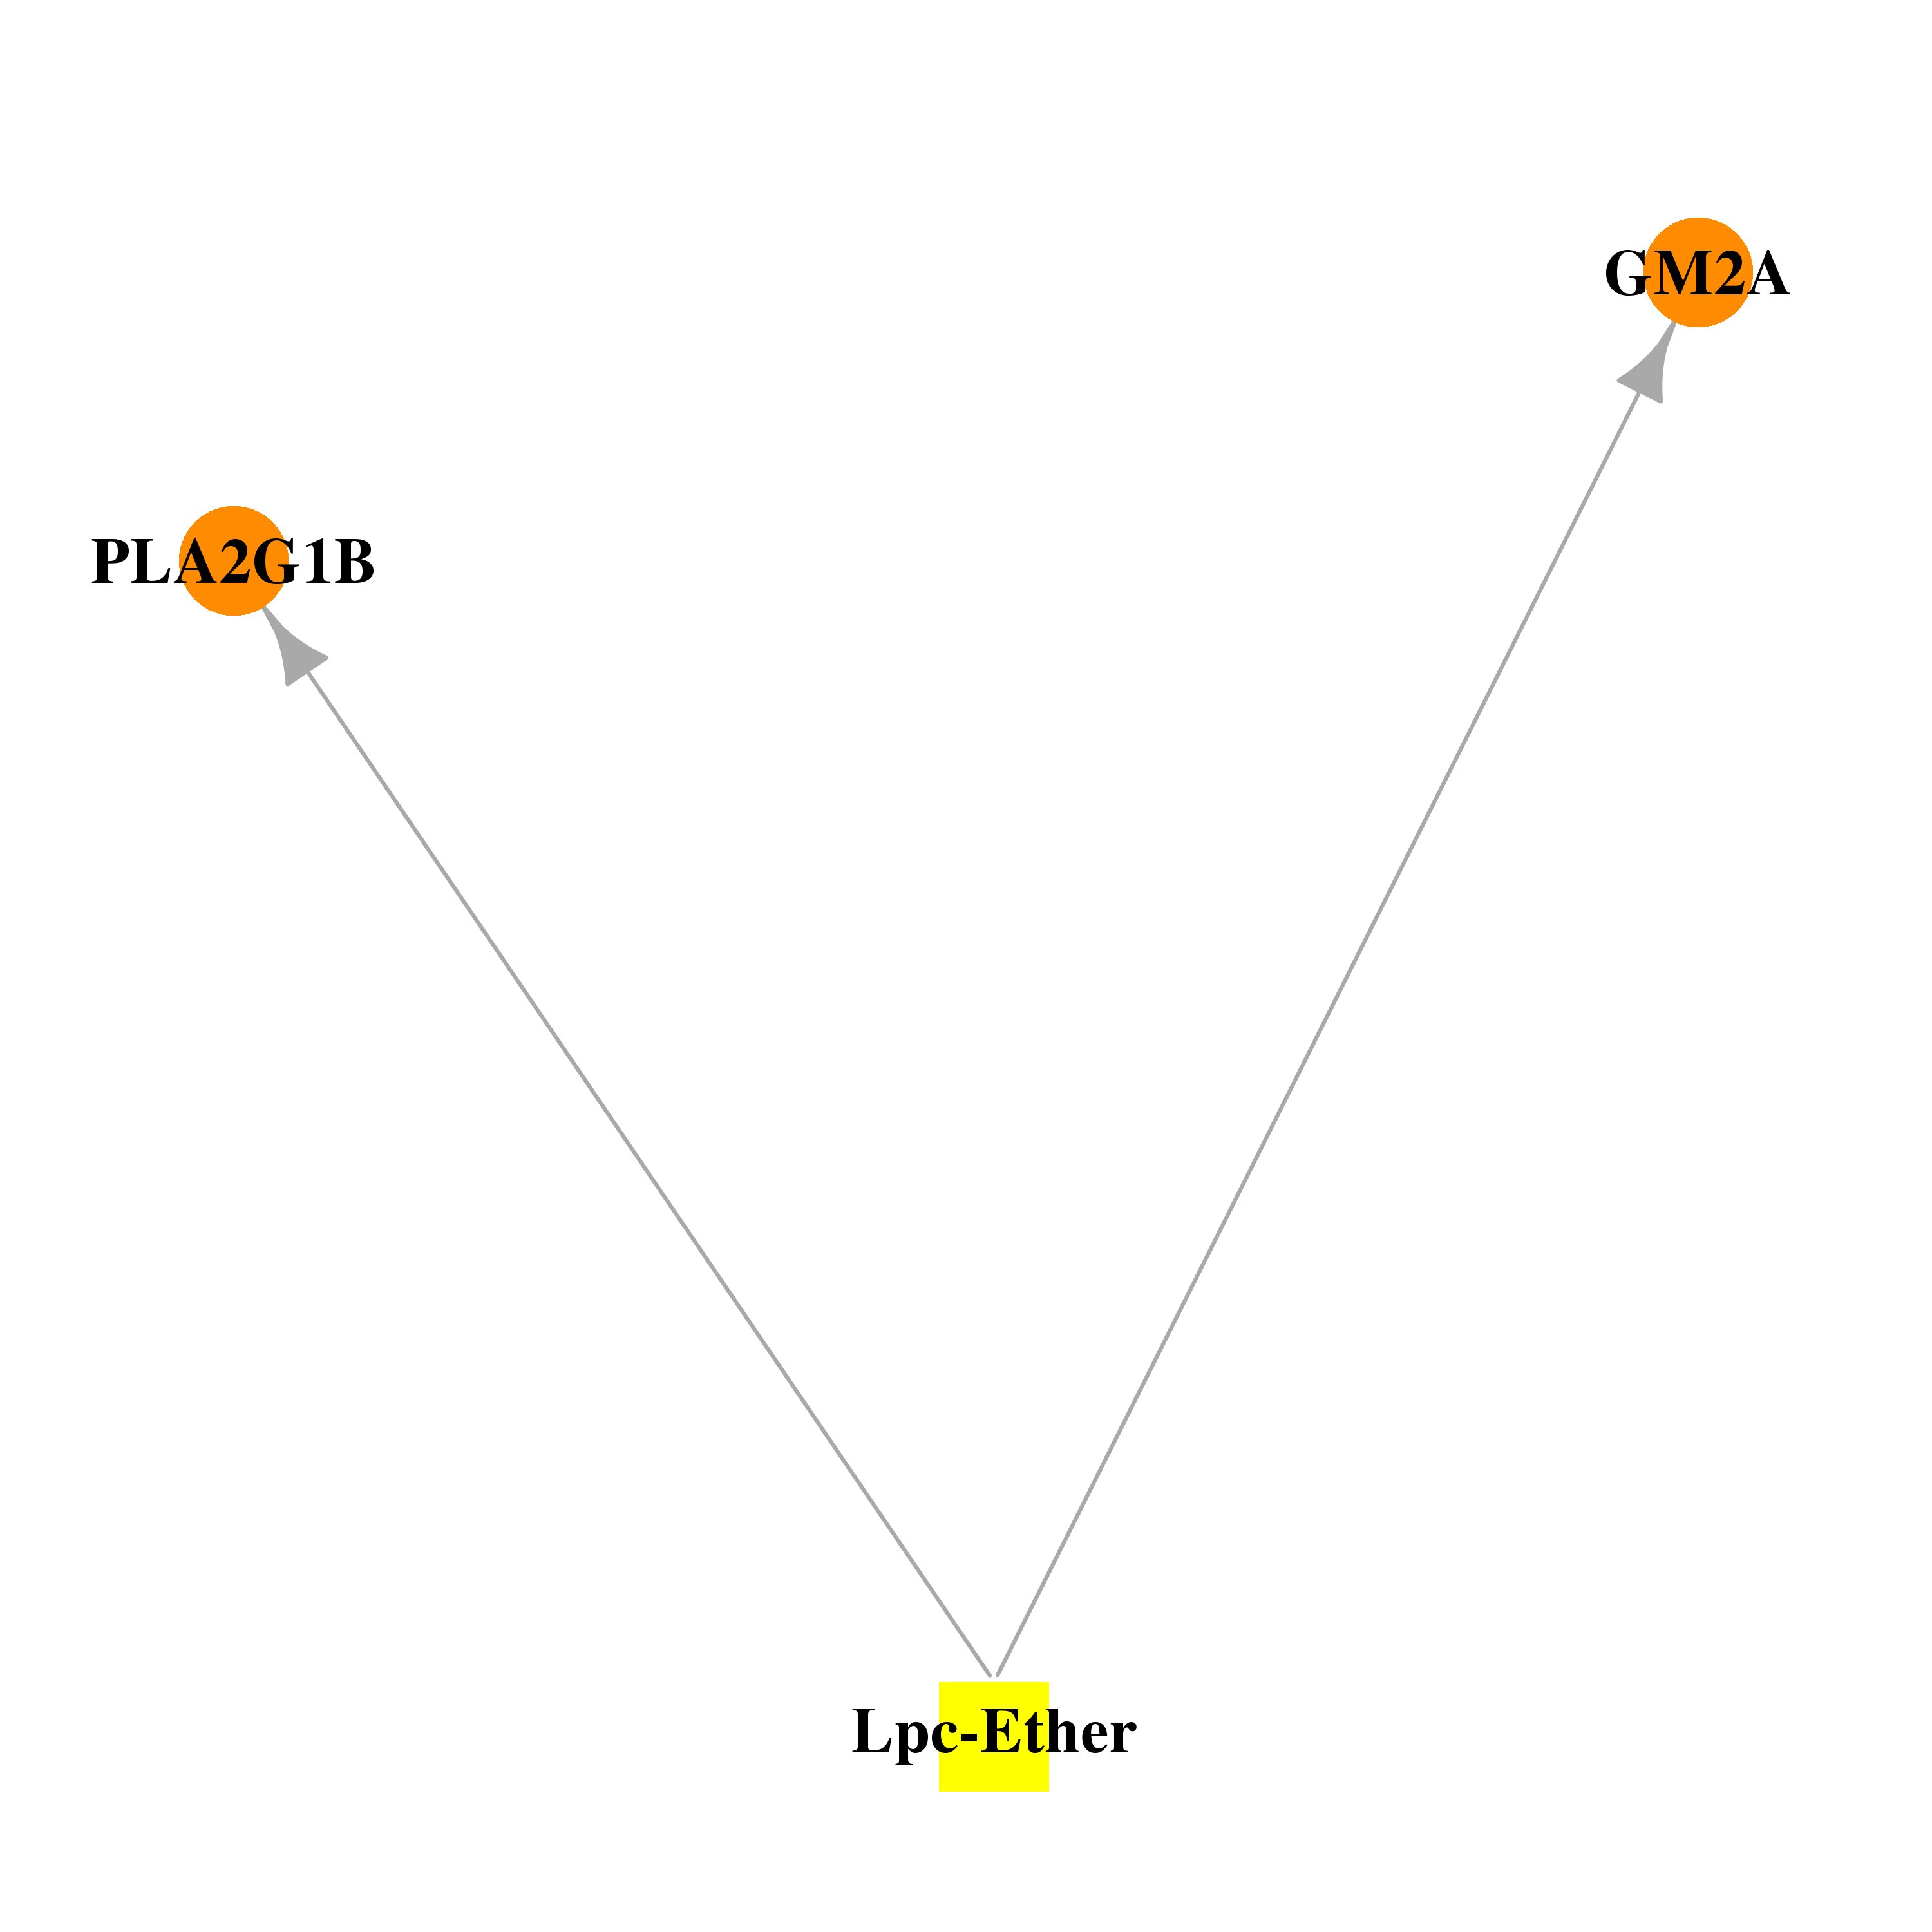 |  |
| DB04660 | GM2 ganglioside activator | experimental | Glycerylphosphorylcholine |  |  |
| DB08231 | GM2 ganglioside activator | experimental | MYRISTIC ACID |  | 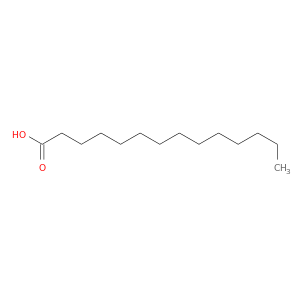 |
| Top |
| Cross referenced IDs for GM2A |
| * We obtained these cross-references from Uniprot database. It covers 150 different DBs, 18 categories. http://www.uniprot.org/help/cross_references_section |
: Open all cross reference information
|
Copyright © 2016-Present - The Univsersity of Texas Health Science Center at Houston @ |