|
|||||||||||||||||||||||||||||||||||||||||||||||||||||||||||||||||||||||||||||||||||||||||||||||||||||||||||||||||||||||||||||||||||||||||||||||||||||||||||||||||||||||||||||||||||||||||||||||||||||||||||||||||||||||||||||||||||||||||||||||||||||||||||||||||||||||||||||||||||||||||||||||||||||||||||||||||||||||||||||||||||||||||||||||||||
| |
| Phenotypic Information (metabolism pathway, cancer, disease, phenome) |
| |
| |
| Gene-Gene Network Information: Co-Expression Network, Interacting Genes & KEGG |
| |
|


| Gene Summary for GMDS |
| Top |
| Phenotypic Information for GMDS(metabolism pathway, cancer, disease, phenome) |
| Cancer | CGAP: GMDS |
| Familial Cancer Database: GMDS | |
| * This gene is included in those cancer gene databases. |
|
|
|
|
|
| . | |||||||||||||||||||||||||||||||||||||||||||||||||||||||||||||||||||||||||||||||||||||||||||||||||||||||||||||||||||||||||||||||||||||||||||||||||||||||||||||||||||||||||||||||||||||||||||||||||||||||||||||||||||||||||||||||||||||||||||||||||||||||||||||||||||||||||||||||||||||||||||||||||||||||||||||||||||||||||||||||||||||||||||||
Oncogene 1 | Significant driver gene in | ||||||||||||||||||||||||||||||||||||||||||||||||||||||||||||||||||||||||||||||||||||||||||||||||||||||||||||||||||||||||||||||||||||||||||||||||||||||||||||||||||||||||||||||||||||||||||||||||||||||||||||||||||||||||||||||||||||||||||||||||||||||||||||||||||||||||||||||||||||||||||||||||||||||||||||||||||||||||||||||||||||||||||||||||||
| cf) number; DB name 1 Oncogene; http://nar.oxfordjournals.org/content/35/suppl_1/D721.long, 2 Tumor Suppressor gene; https://bioinfo.uth.edu/TSGene/, 3 Cancer Gene Census; http://www.nature.com/nrc/journal/v4/n3/abs/nrc1299.html, 4 CancerGenes; http://nar.oxfordjournals.org/content/35/suppl_1/D721.long, 5 Network of Cancer Gene; http://ncg.kcl.ac.uk/index.php, 1Therapeutic Vulnerabilities in Cancer; http://cbio.mskcc.org/cancergenomics/statius/ |
| KEGG_FRUCTOSE_AND_MANNOSE_METABOLISM KEGG_AMINO_SUGAR_AND_NUCLEOTIDE_SUGAR_METABOLISM | |
| OMIM | |
| Orphanet | |
| Disease | KEGG Disease: GMDS |
| MedGen: GMDS (Human Medical Genetics with Condition) | |
| ClinVar: GMDS | |
| Phenotype | MGI: GMDS (International Mouse Phenotyping Consortium) |
| PhenomicDB: GMDS | |
| Mutations for GMDS |
| * Under tables are showing count per each tissue to give us broad intuition about tissue specific mutation patterns.You can go to the detailed page for each mutation database's web site. |
| - Statistics for Tissue and Mutation type | Top |
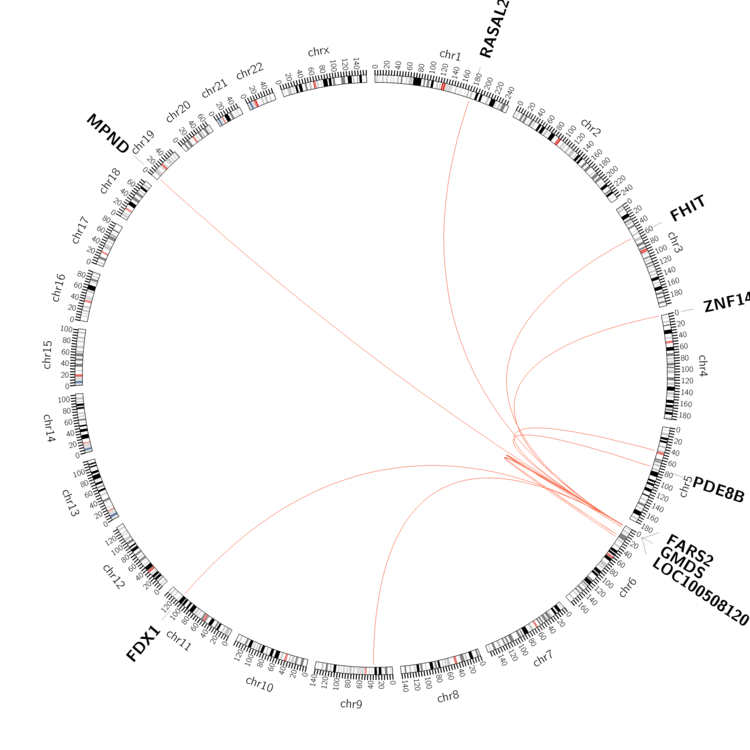 |
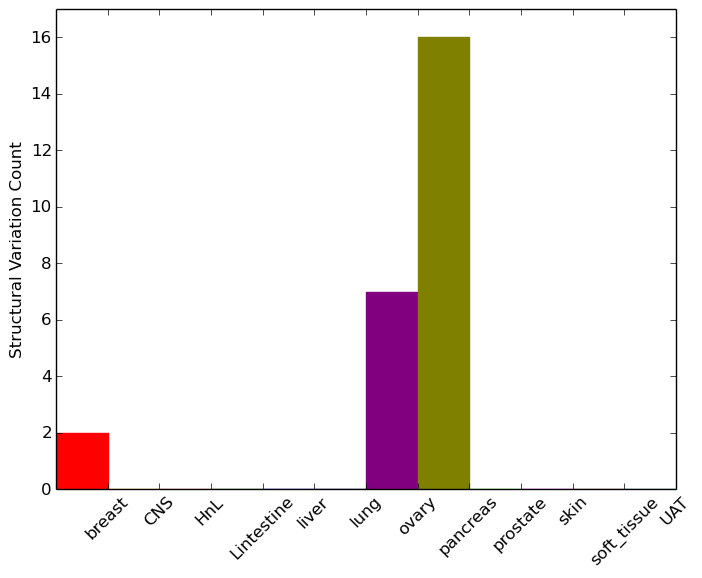
| - For Inter-chromosomal Variations |
| * Inter-chromosomal variantions includes 'interchromosomal amplicon to amplicon', 'interchromosomal amplicon to non-amplified dna', 'interchromosomal insertion', 'Interchromosomal unknown type'. |
 |
| - For Intra-chromosomal Variations |
| * Intra-chromosomal variantions includes 'intrachromosomal amplicon to amplicon', 'intrachromosomal amplicon to non-amplified dna', 'intrachromosomal deletion', 'intrachromosomal fold-back inversion', 'intrachromosomal inversion', 'intrachromosomal tandem duplication', 'Intrachromosomal unknown type', 'intrachromosomal with inverted orientation', 'intrachromosomal with non-inverted orientation'. |
 |
| Sample | Symbol_a | Chr_a | Start_a | End_a | Symbol_b | Chr_b | Start_b | End_b |
| breast | GMDS | chr6 | 1720003 | 1720003 | FARS2 | chr6 | 5740896 | 5740896 |
| breast | GMDS | chr6 | 2101153 | 2101553 | GMDS | chr6 | 2118990 | 2119390 |
| ovary | GMDS | chr6 | 1641575 | 1641595 | GMDS | chr6 | 1643602 | 1643622 |
| ovary | GMDS | chr6 | 1659834 | 1659854 | chr6 | 22511387 | 22511407 | |
| ovary | GMDS | chr6 | 1663489 | 1663509 | MPND | chr19 | 4358907 | 4358927 |
| ovary | GMDS | chr6 | 1669346 | 1669366 | chr6 | 1594887 | 1594907 | |
| ovary | GMDS | chr6 | 1703007 | 1703027 | GMDS | chr6 | 1676834 | 1676854 |
| ovary | GMDS | chr6 | 1734871 | 1734891 | chr6 | 22774319 | 22774339 | |
| ovary | GMDS | chr6 | 1789422 | 1789442 | FDX1 | chr11 | 110312497 | 110312517 |
| ovary | GMDS | chr6 | 1834577 | 1834597 | chr6 | 1202364 | 1202384 | |
| ovary | GMDS | chr6 | 1979926 | 1979946 | GMDS | chr6 | 1968280 | 1968300 |
| ovary | GMDS | chr6 | 2140310 | 2140330 | chr9 | 34840491 | 34840511 | |
| ovary | GMDS | chr6 | 2164646 | 2164666 | chr5 | 46200650 | 46200670 | |
| pancreas | GMDS | chr6 | 1633219 | 1633239 | GMDS | chr6 | 1796499 | 1796519 |
| pancreas | GMDS | chr6 | 1682791 | 1682811 | GMDS | chr6 | 1683093 | 1683113 |
| pancreas | GMDS | chr6 | 1682791 | 1682811 | GMDS | chr6 | 1683103 | 1683123 |
| pancreas | GMDS | chr6 | 1687757 | 1687777 | GMDS | chr6 | 1737500 | 1737520 |
| pancreas | GMDS | chr6 | 1706456 | 1706456 | GMDS | chr6 | 1840107 | 1840107 |
| pancreas | GMDS | chr6 | 1714799 | 1714819 | GMDS | chr6 | 1920544 | 1920564 |
| pancreas | GMDS | chr6 | 1758644 | 1758664 | GMDS | chr6 | 1822545 | 1822565 |
| pancreas | GMDS | chr6 | 1779633 | 1779653 | GMDS | chr6 | 2049466 | 2049486 |
| pancreas | GMDS | chr6 | 1831372 | 1831392 | LOC100508120 | chr6 | 2358168 | 2358188 |
| pancreas | GMDS | chr6 | 1851806 | 1851826 | chr24 | 3489987 | 3490007 | |
| pancreas | GMDS | chr6 | 1903141 | 1903161 | LOC100508120 | chr6 | 2291531 | 2291551 |
| pancreas | GMDS | chr6 | 1952335 | 1952355 | GMDS | chr6 | 1887934 | 1887954 |
| pancreas | GMDS | chr6 | 2042987 | 2043007 | GMDS | chr6 | 2043571 | 2043591 |
| pancreas | GMDS | chr6 | 2073752 | 2073772 | chr6 | 26420479 | 26420499 | |
| pancreas | GMDS | chr6 | 2079507 | 2079527 | GMDS | chr6 | 2075516 | 2075536 |
| cf) Tissue number; Tissue name (1;Breast, 2;Central_nervous_system, 3;Haematopoietic_and_lymphoid_tissue, 4;Large_intestine, 5;Liver, 6;Lung, 7;Ovary, 8;Pancreas, 9;Prostate, 10;Skin, 11;Soft_tissue, 12;Upper_aerodigestive_tract) |
| * From mRNA Sanger sequences, Chitars2.0 arranged chimeric transcripts. This table shows GMDS related fusion information. |
| ID | Head Gene | Tail Gene | Accession | Gene_a | qStart_a | qEnd_a | Chromosome_a | tStart_a | tEnd_a | Gene_a | qStart_a | qEnd_a | Chromosome_a | tStart_a | tEnd_a |
| AW375751 | TCP1 | 39 | 97 | 6 | 160201475 | 160201533 | GMDS | 95 | 262 | 6 | 1698518 | 1698685 | |
| BG954532 | ERGIC1 | 6 | 150 | 5 | 172379197 | 172379340 | GMDS | 141 | 249 | 6 | 2142163 | 2142271 | |
| BQ897638 | GMDS | 26 | 132 | 6 | 1905154 | 1905260 | PARVA | 126 | 738 | 11 | 12550905 | 12551506 | |
| CV573848 | GMDS | 1 | 114 | 6 | 1626429 | 1626542 | GMDS | 110 | 630 | 6 | 1629192 | 1629712 | |
| BE002314 | GMDS | 23 | 157 | 6 | 1860850 | 1860984 | TLE1 | 154 | 176 | 9 | 84253459 | 84253482 | |
| BE830483 | GMDS | 138 | 160 | 6 | 1792745 | 1792767 | ZNF843 | 158 | 290 | 16 | 31449918 | 31450050 | |
| Top |
| Mutation type/ Tissue ID | brca | cns | cerv | endome | haematopo | kidn | Lintest | liver | lung | ns | ovary | pancre | prost | skin | stoma | thyro | urina | |||
| Total # sample | 8 | 1 | 1 | 14 | 2 | 7 | 2 | 20 | ||||||||||||
| GAIN (# sample) | 7 | 1 | 1 | 1 | 5 | 2 | 1 | |||||||||||||
| LOSS (# sample) | 1 | 1 | 13 | 1 | 2 | 19 |
| cf) Tissue ID; Tissue type (1; Breast, 2; Central_nervous_system, 3; Cervix, 4; Endometrium, 5; Haematopoietic_and_lymphoid_tissue, 6; Kidney, 7; Large_intestine, 8; Liver, 9; Lung, 10; NS, 11; Ovary, 12; Pancreas, 13; Prostate, 14; Skin, 15; Stomach, 16; Thyroid, 17; Urinary_tract) |
| Top |
|
 |
| Top |
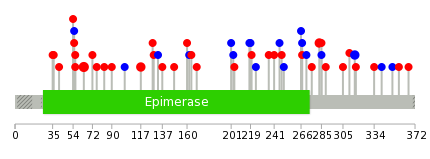
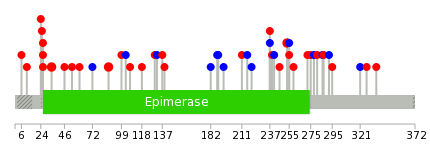
| Stat. for Non-Synonymous SNVs (# total SNVs=31) | (# total SNVs=13) |
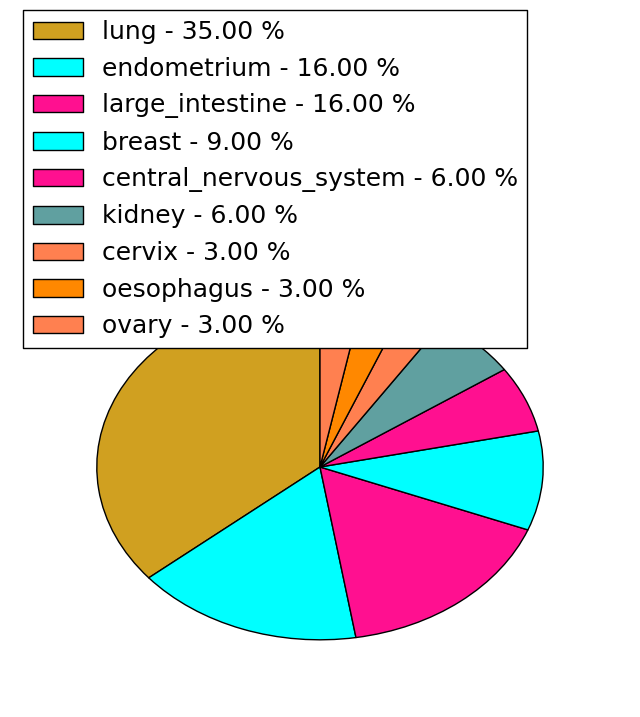 |  |
(# total SNVs=0) | (# total SNVs=0) |
| Top |
| * When you move the cursor on each content, you can see more deailed mutation information on the Tooltip. Those are primary_site,primary_histology,mutation(aa),pubmedID. |
| GRCh37 position | Mutation(aa) | Unique sampleID count |
| chr6:2117747-2117747 | p.R64Q | 3 |
| chr6:1961196-1961196 | p.S117F | 2 |
| chr6:1961041-1961041 | p.E169K | 2 |
| chr6:1742745-1742745 | p.E283K | 2 |
| chr6:1726689-1726689 | p.H316H | 2 |
| chr6:1742725-1742725 | p.F289L | 1 |
| chr6:1961164-1961164 | p.D128Y | 1 |
| chr6:2117775-2117775 | p.R55W | 1 |
| chr6:1930370-1930370 | p.K246K | 1 |
| chr6:1624425-1624425 | p.M366I | 1 |
| Top |
|
 |
| Point Mutation/ Tissue ID | 1 | 2 | 3 | 4 | 5 | 6 | 7 | 8 | 9 | 10 | 11 | 12 | 13 | 14 | 15 | 16 | 17 | 18 | 19 | 20 |
| # sample | 2 | 3 | 1 | 4 | 1 | 1 | 1 | 1 | 10 | 1 | 1 | 1 | 7 | 4 | 1 | 6 | ||||
| # mutation | 3 | 3 | 1 | 4 | 1 | 1 | 1 | 1 | 10 | 1 | 1 | 1 | 7 | 4 | 1 | 8 | ||||
| nonsynonymous SNV | 3 | 2 | 1 | 3 | 1 | 1 | 1 | 9 | 4 | 2 | 1 | 5 | ||||||||
| synonymous SNV | 1 | 1 | 1 | 1 | 1 | 1 | 1 | 3 | 2 | 3 |
| cf) Tissue ID; Tissue type (1; BLCA[Bladder Urothelial Carcinoma], 2; BRCA[Breast invasive carcinoma], 3; CESC[Cervical squamous cell carcinoma and endocervical adenocarcinoma], 4; COAD[Colon adenocarcinoma], 5; GBM[Glioblastoma multiforme], 6; Glioma Low Grade, 7; HNSC[Head and Neck squamous cell carcinoma], 8; KICH[Kidney Chromophobe], 9; KIRC[Kidney renal clear cell carcinoma], 10; KIRP[Kidney renal papillary cell carcinoma], 11; LAML[Acute Myeloid Leukemia], 12; LUAD[Lung adenocarcinoma], 13; LUSC[Lung squamous cell carcinoma], 14; OV[Ovarian serous cystadenocarcinoma ], 15; PAAD[Pancreatic adenocarcinoma], 16; PRAD[Prostate adenocarcinoma], 17; SKCM[Skin Cutaneous Melanoma], 18:STAD[Stomach adenocarcinoma], 19:THCA[Thyroid carcinoma], 20:UCEC[Uterine Corpus Endometrial Carcinoma]) |
| Top |
| * We represented just top 10 SNVs. When you move the cursor on each content, you can see more deailed mutation information on the Tooltip. Those are primary_site, primary_histology, mutation(aa), pubmedID. |
| Genomic Position | Mutation(aa) | Unique sampleID count |
| chr6:1961196 | p.S87F,GMDS | 2 |
| chr6:1742745 | p.R34Q,GMDS | 2 |
| chr6:2117747 | p.R26L,GMDS | 2 |
| chr6:2117771 | p.E253K,GMDS | 2 |
| chr6:1726733 | p.G246W,GMDS | 1 |
| chr6:2117772 | p.V118L,GMDS | 1 |
| chr6:1930370 | p.M336I,GMDS | 1 |
| chr6:1624425 | p.F241F,GMDS | 1 |
| chr6:1961137 | p.D107Y,GMDS | 1 |
| chr6:1742725 | p.E327K,GMDS | 1 |
| * Copy number data were extracted from TCGA using R package TCGA-Assembler. The URLs of all public data files on TCGA DCC data server were gathered on Jan-05-2015. Function ProcessCNAData in TCGA-Assembler package was used to obtain gene-level copy number value which is calculated as the average copy number of the genomic region of a gene. |
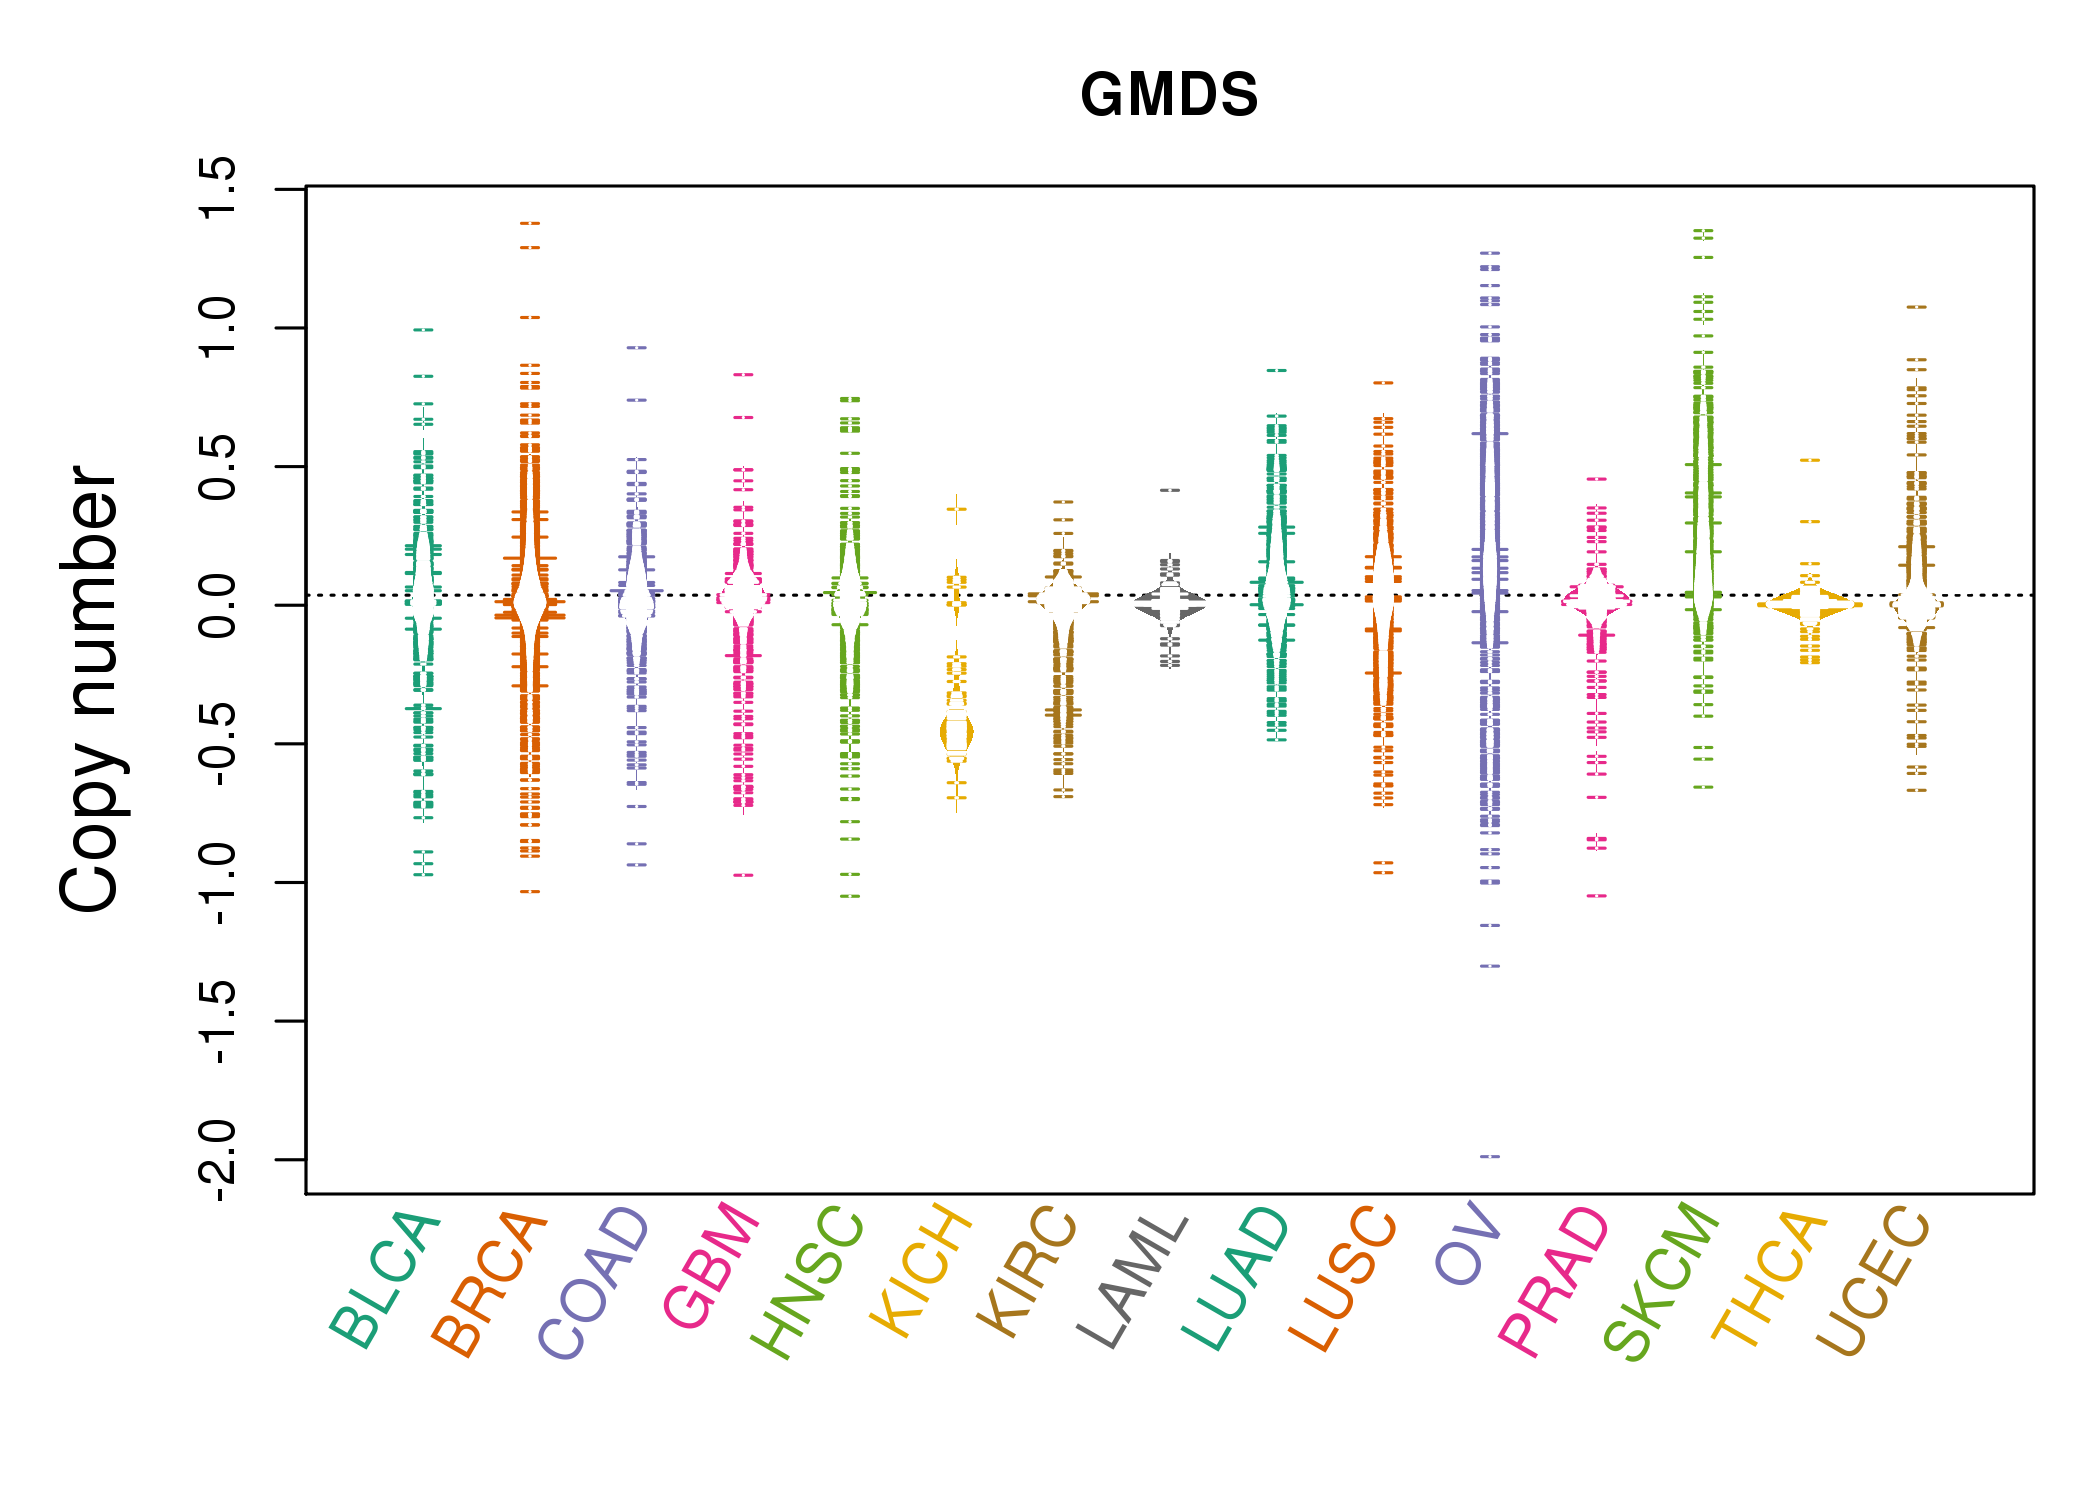 |
| cf) Tissue ID[Tissue type]: BLCA[Bladder Urothelial Carcinoma], BRCA[Breast invasive carcinoma], CESC[Cervical squamous cell carcinoma and endocervical adenocarcinoma], COAD[Colon adenocarcinoma], GBM[Glioblastoma multiforme], Glioma Low Grade, HNSC[Head and Neck squamous cell carcinoma], KICH[Kidney Chromophobe], KIRC[Kidney renal clear cell carcinoma], KIRP[Kidney renal papillary cell carcinoma], LAML[Acute Myeloid Leukemia], LUAD[Lung adenocarcinoma], LUSC[Lung squamous cell carcinoma], OV[Ovarian serous cystadenocarcinoma ], PAAD[Pancreatic adenocarcinoma], PRAD[Prostate adenocarcinoma], SKCM[Skin Cutaneous Melanoma], STAD[Stomach adenocarcinoma], THCA[Thyroid carcinoma], UCEC[Uterine Corpus Endometrial Carcinoma] |
| Top |
| Gene Expression for GMDS |
| * CCLE gene expression data were extracted from CCLE_Expression_Entrez_2012-10-18.res: Gene-centric RMA-normalized mRNA expression data. |
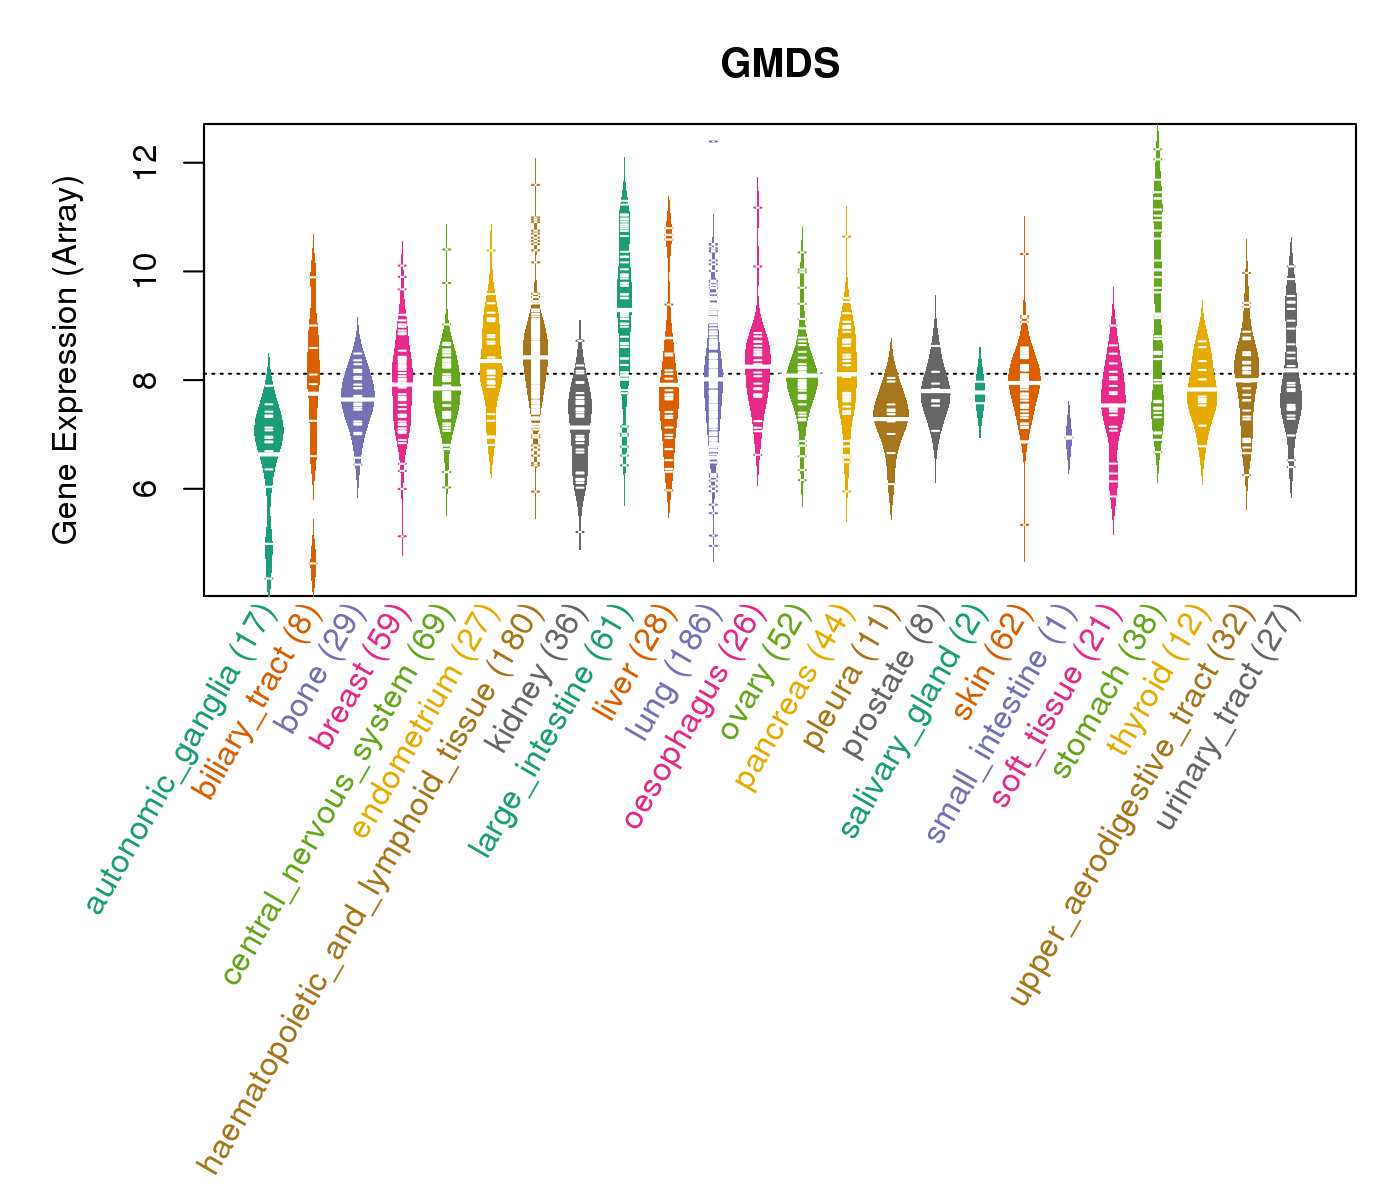 |
| * Normalized gene expression data of RNASeqV2 was extracted from TCGA using R package TCGA-Assembler. The URLs of all public data files on TCGA DCC data server were gathered at Jan-05-2015. Only eight cancer types have enough normal control samples for differential expression analysis. (t test, adjusted p<0.05 (using Benjamini-Hochberg FDR)) |
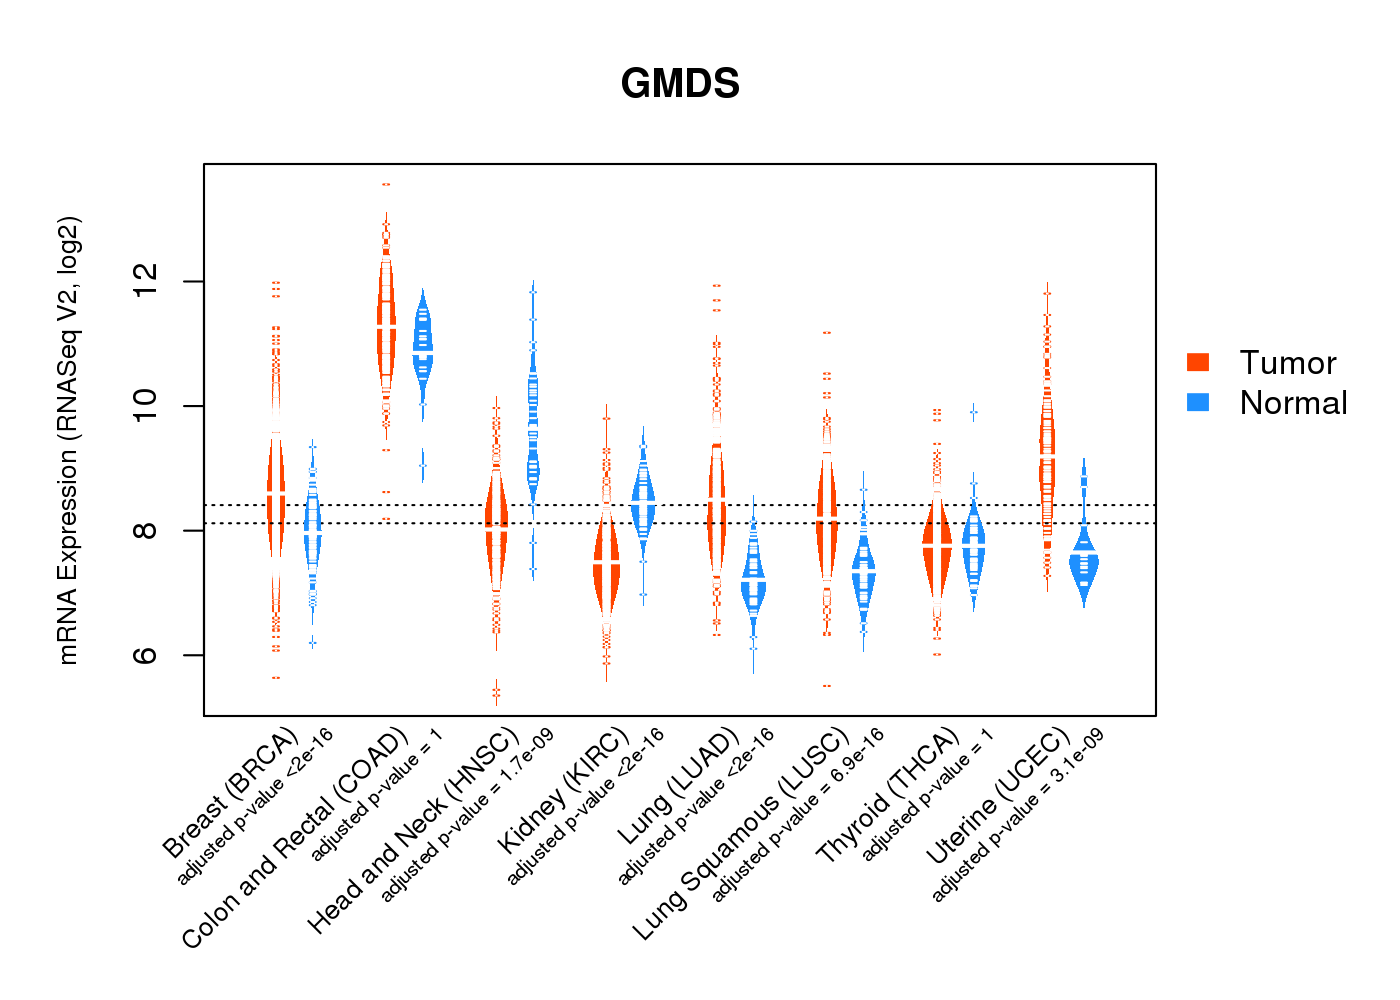 |
| Top |
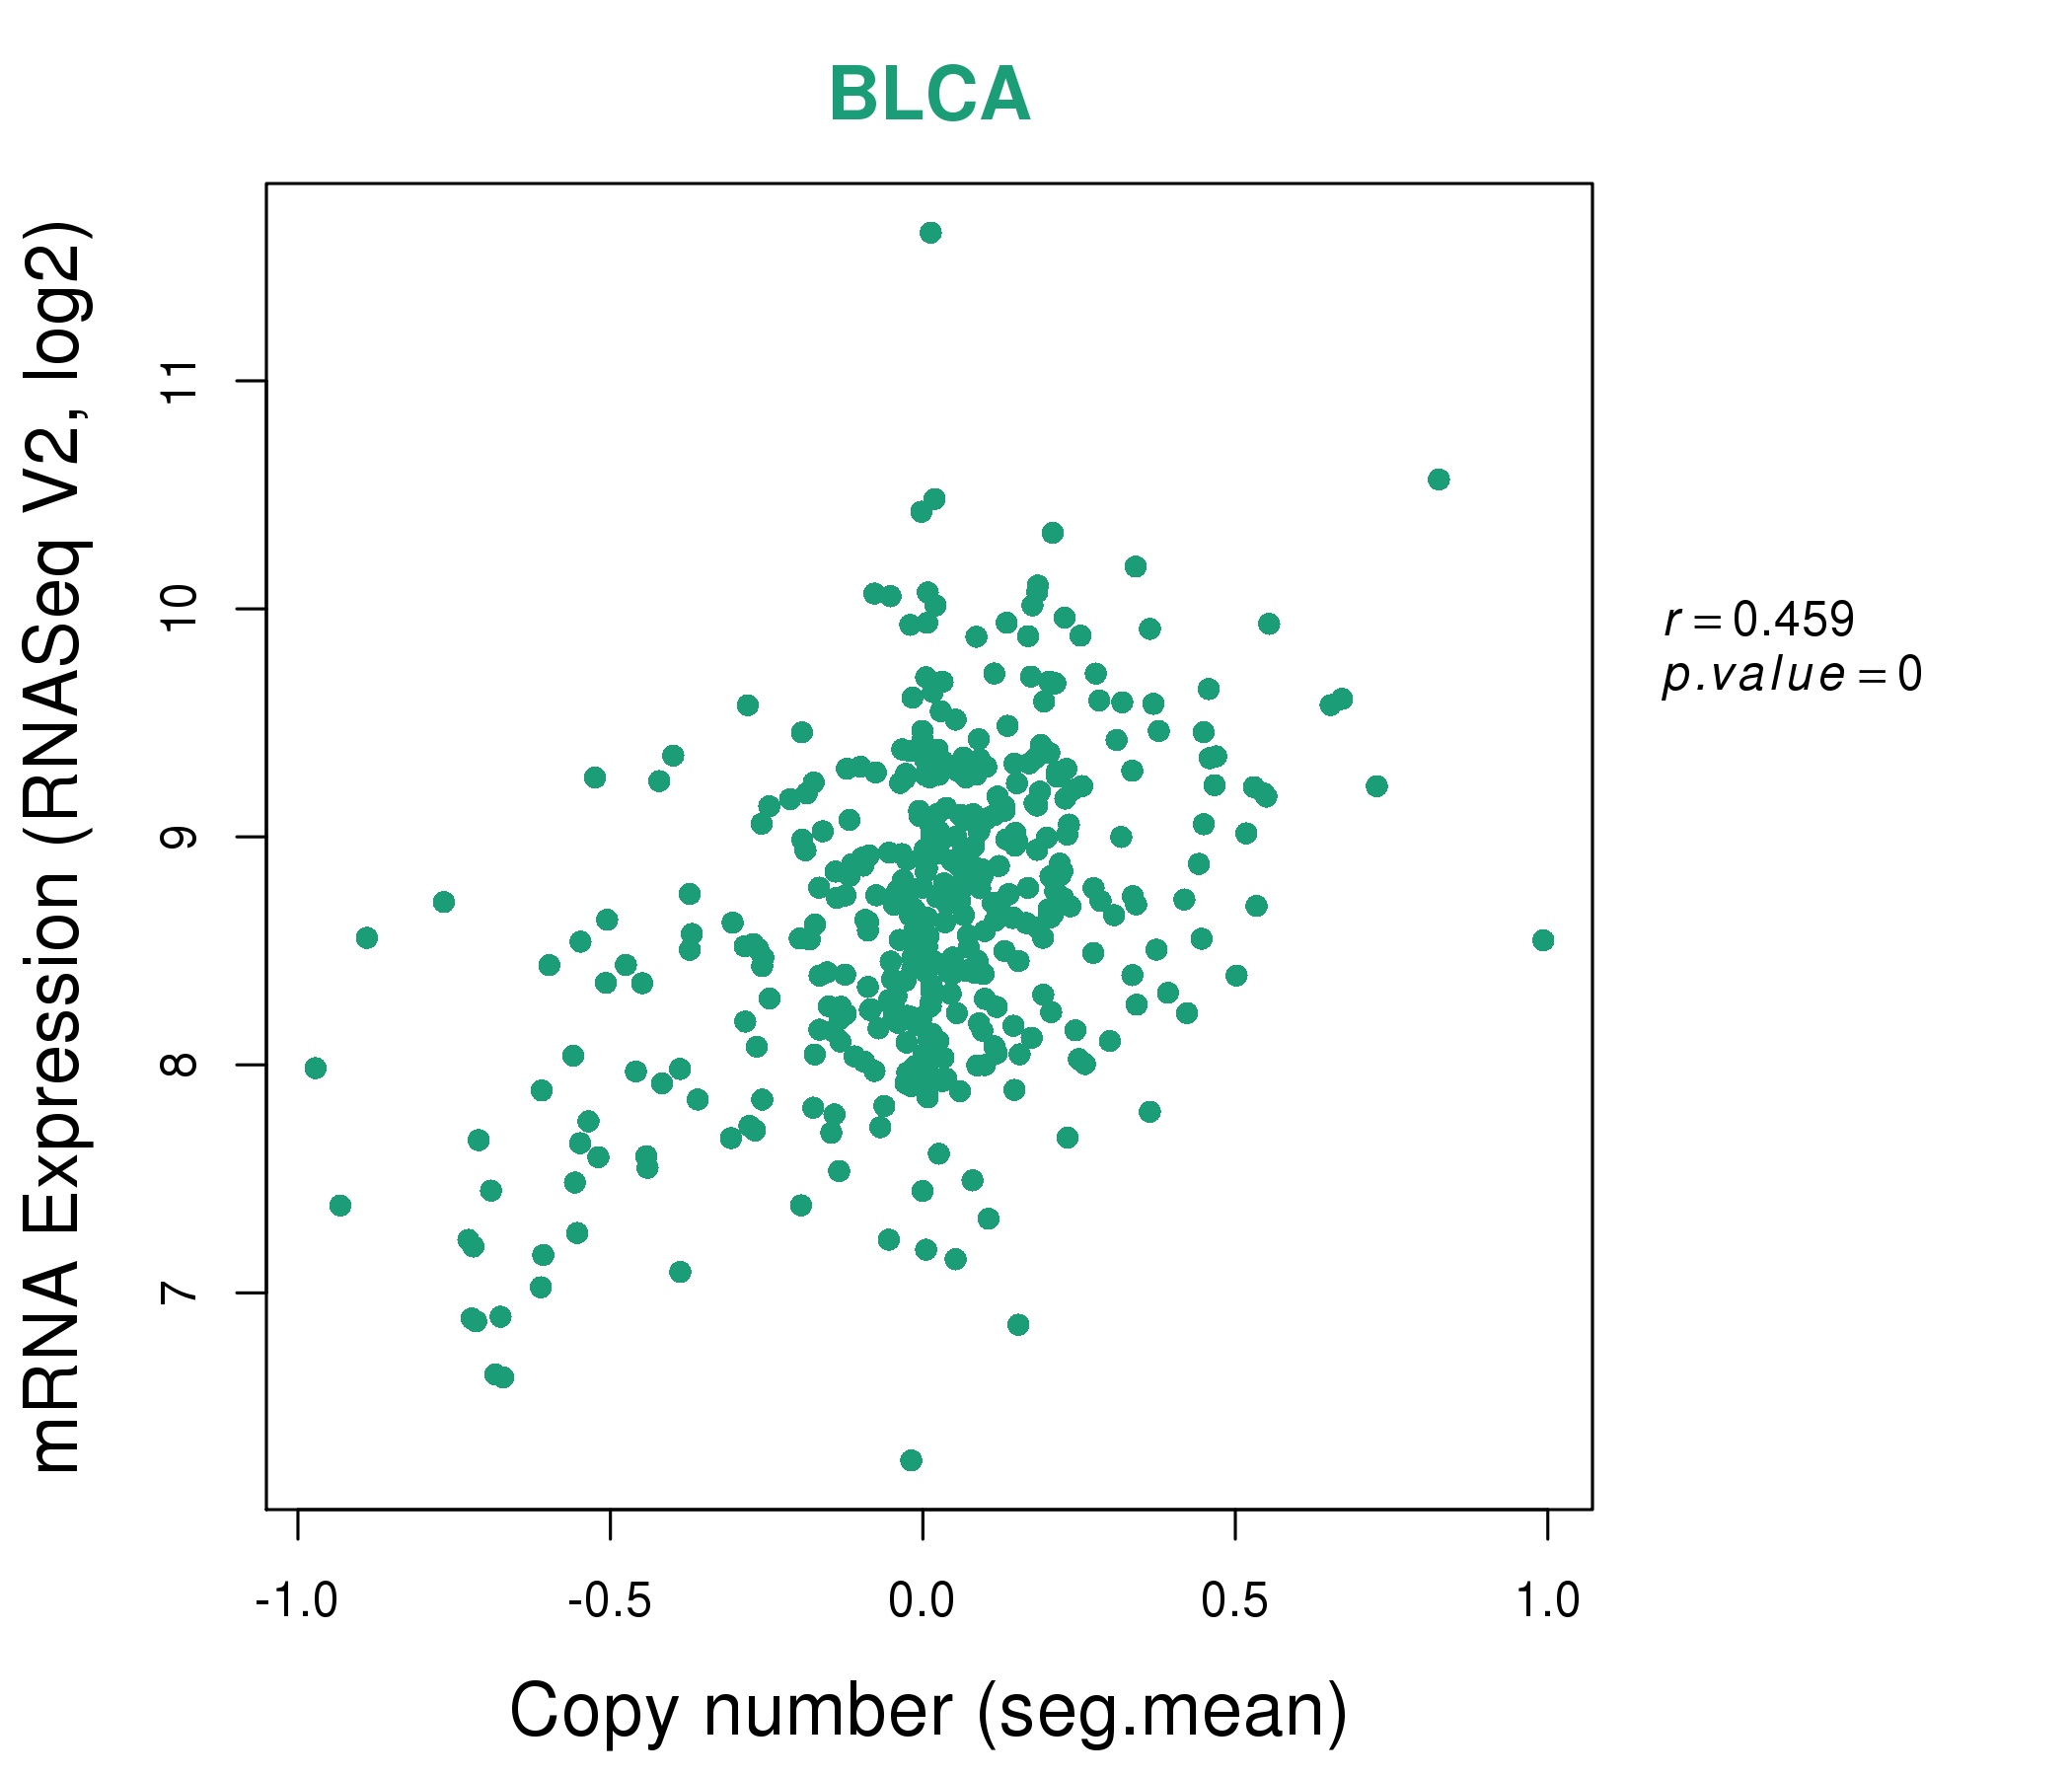
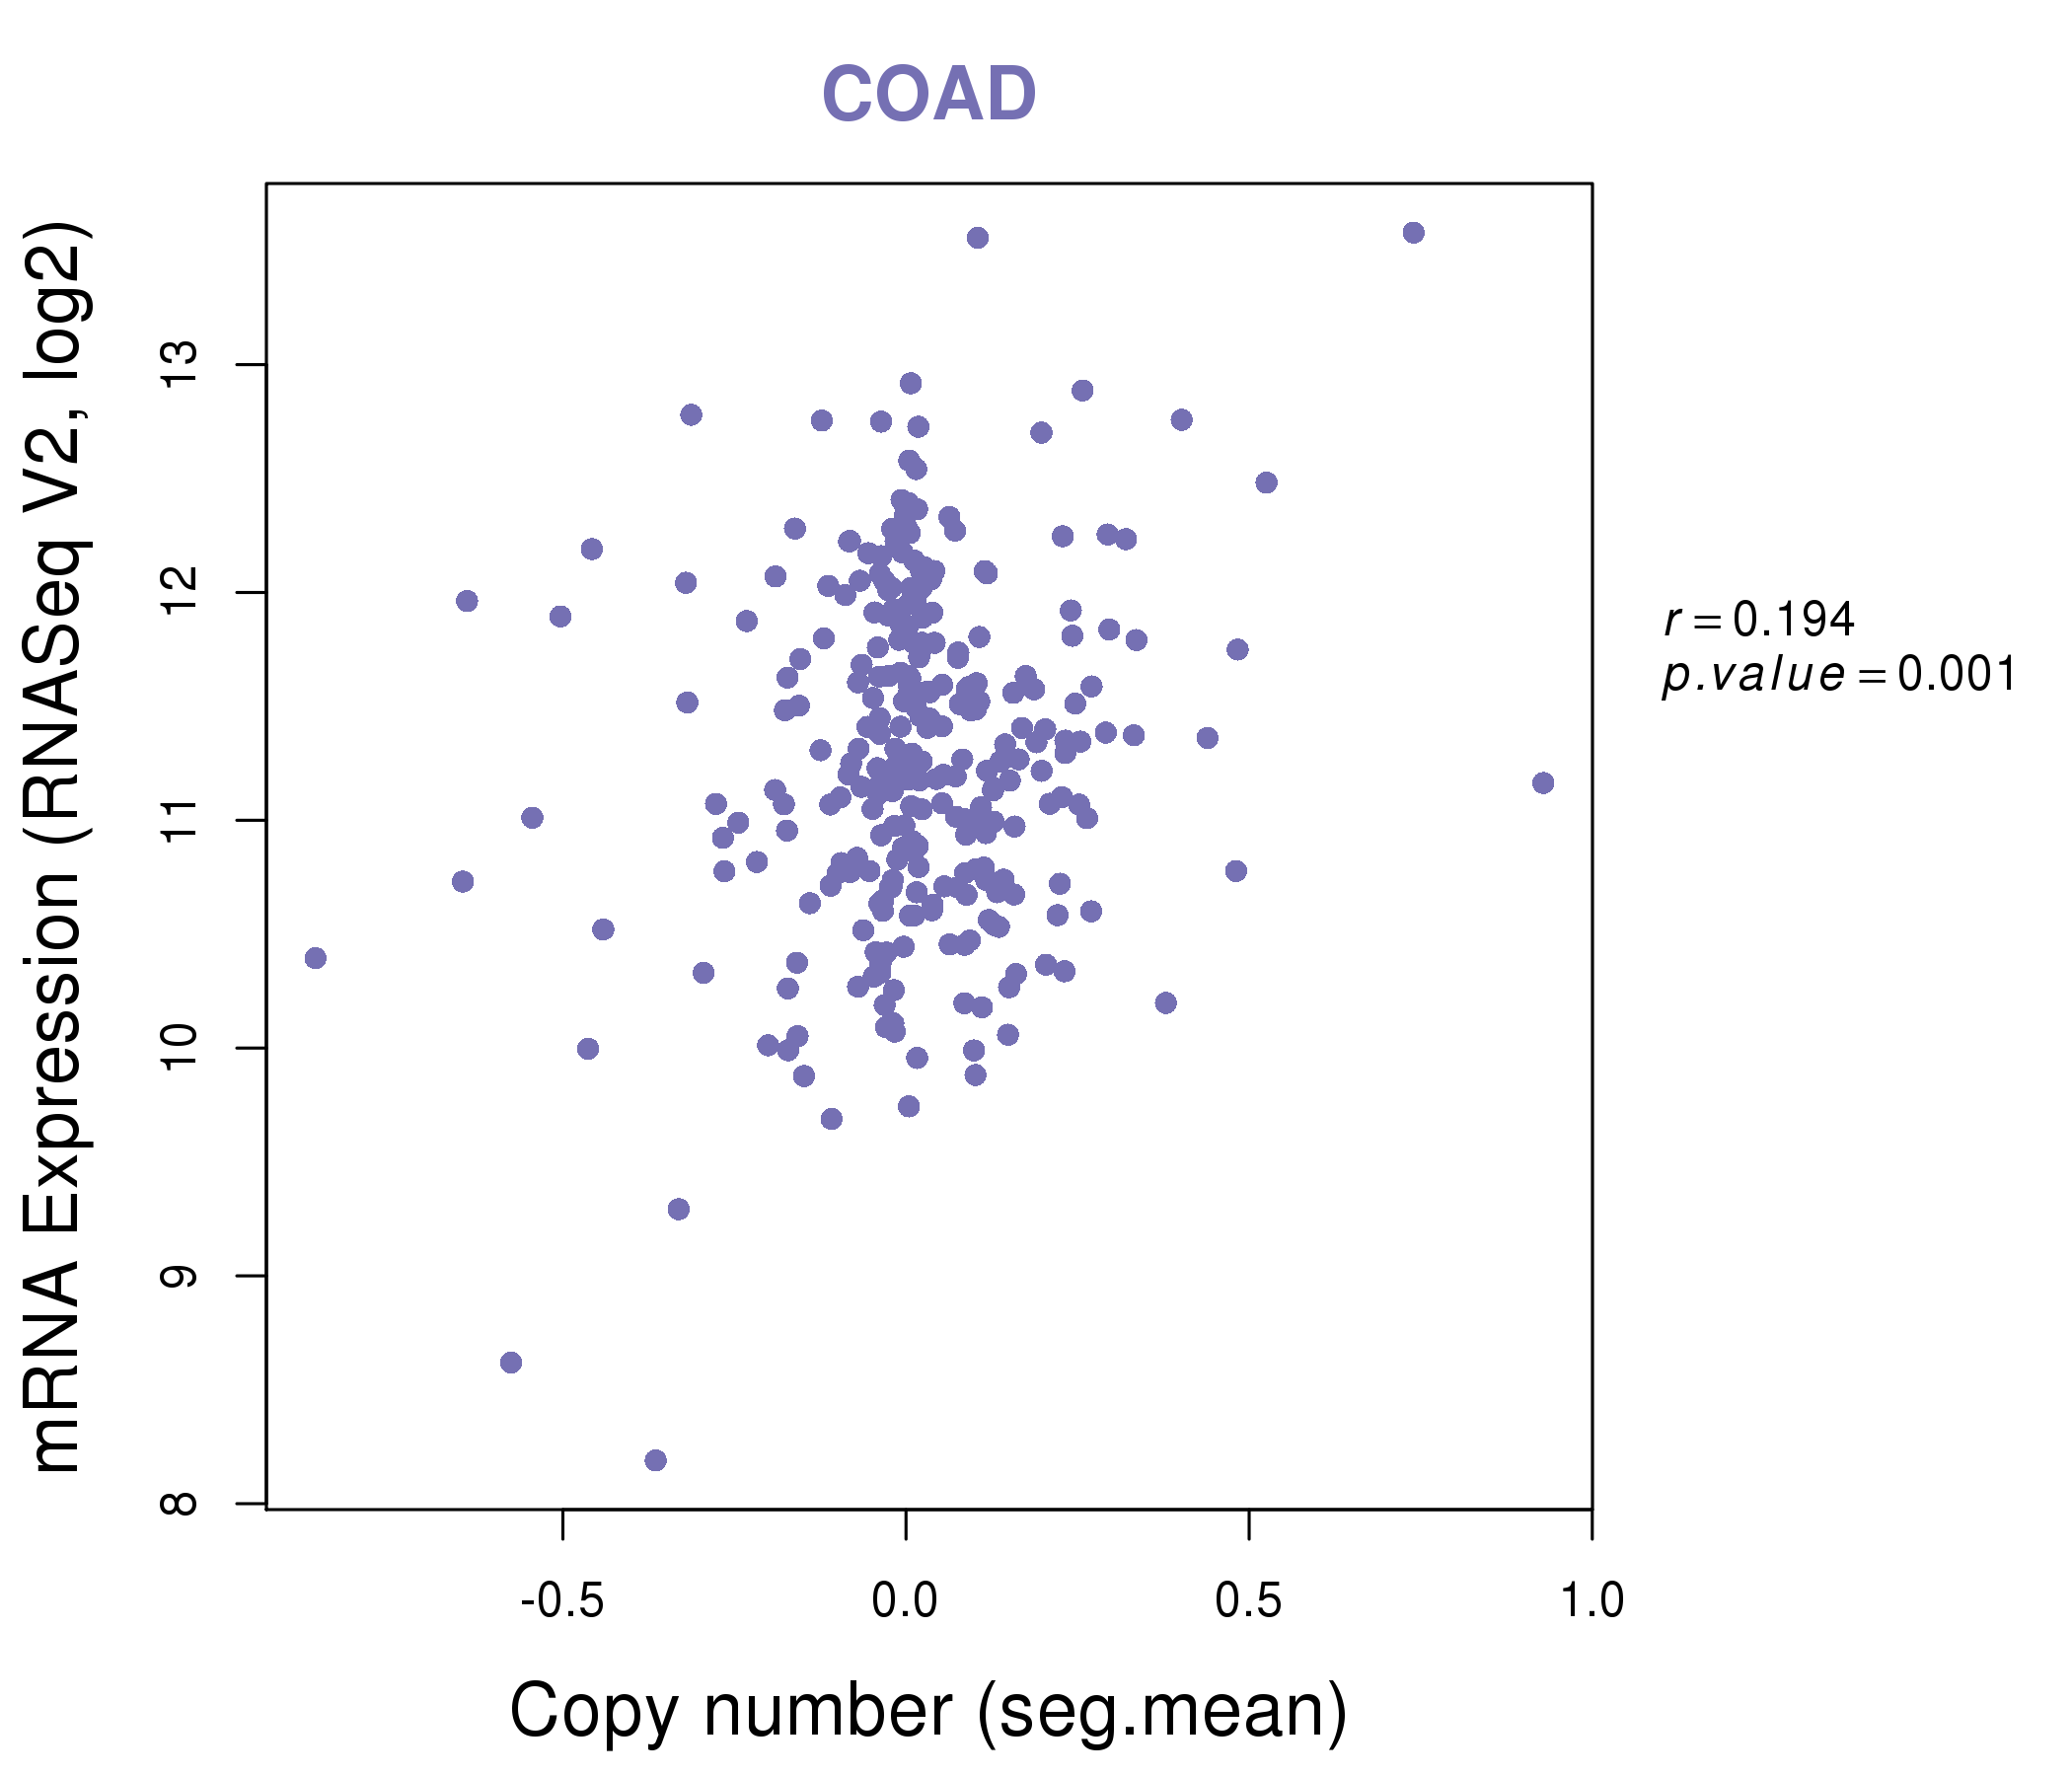
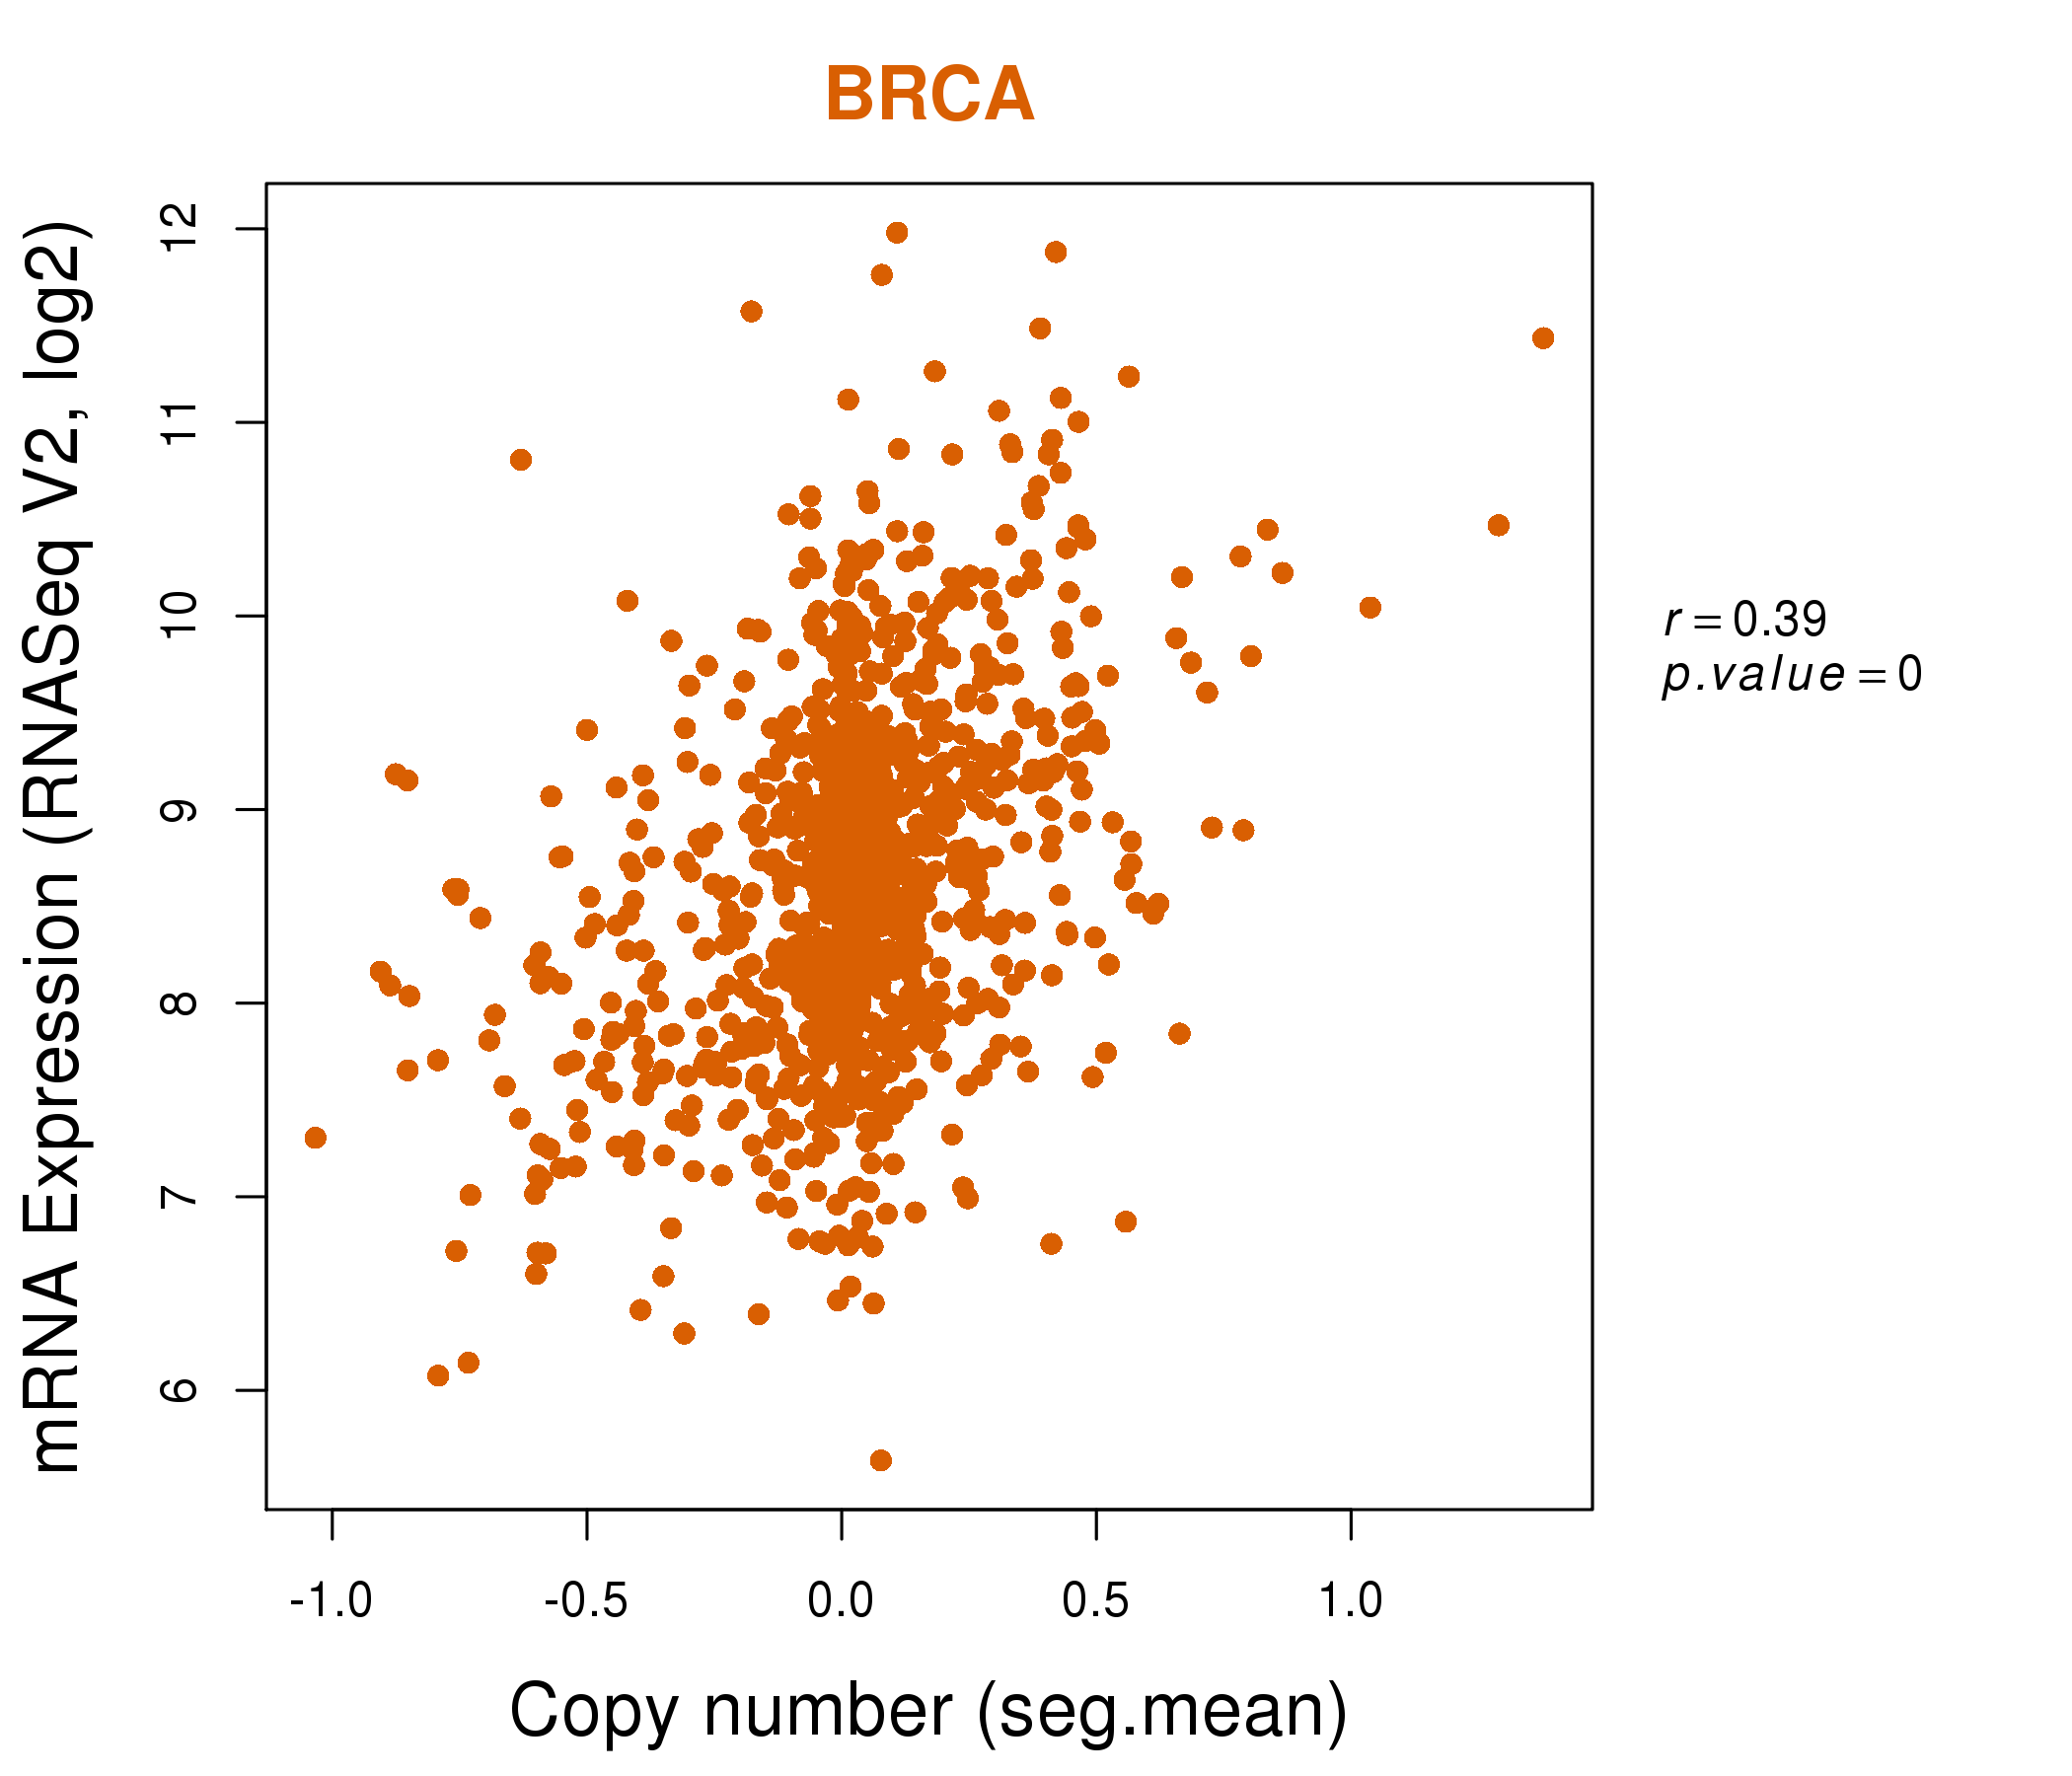
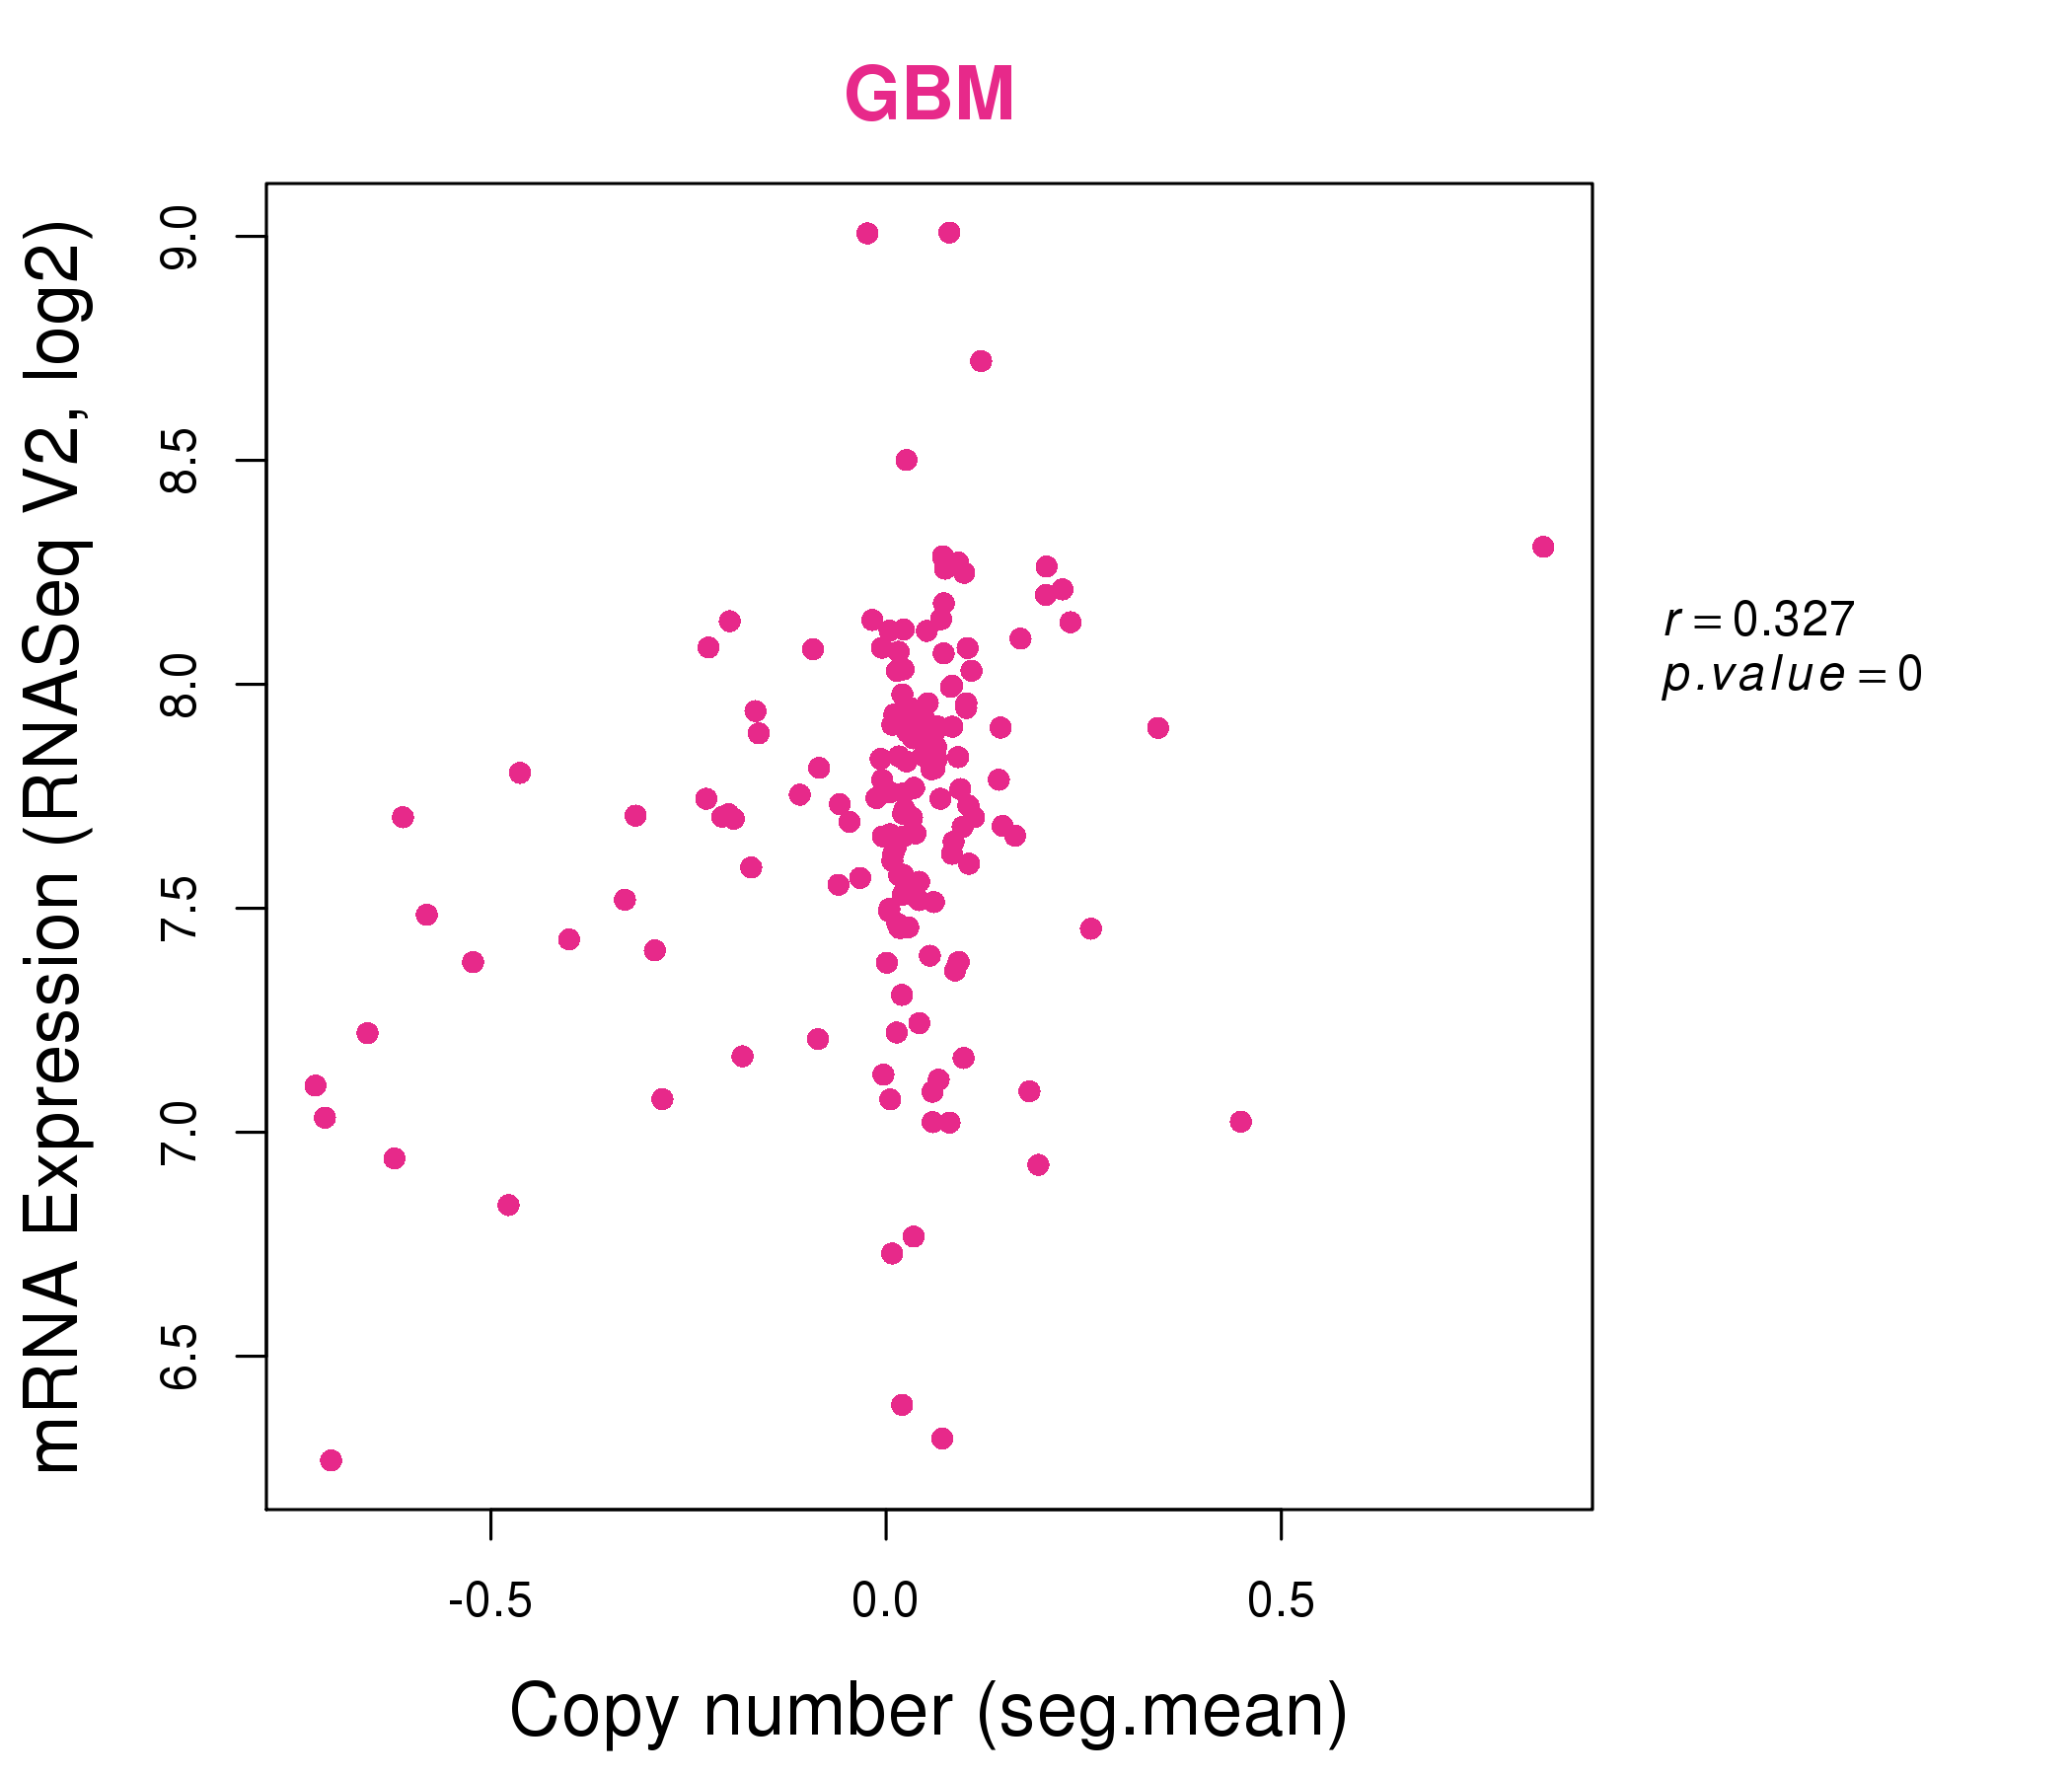
| * This plots show the correlation between CNV and gene expression. |
: Open all plots for all cancer types
 |
|
 |
|
| Top |
| Gene-Gene Network Information |
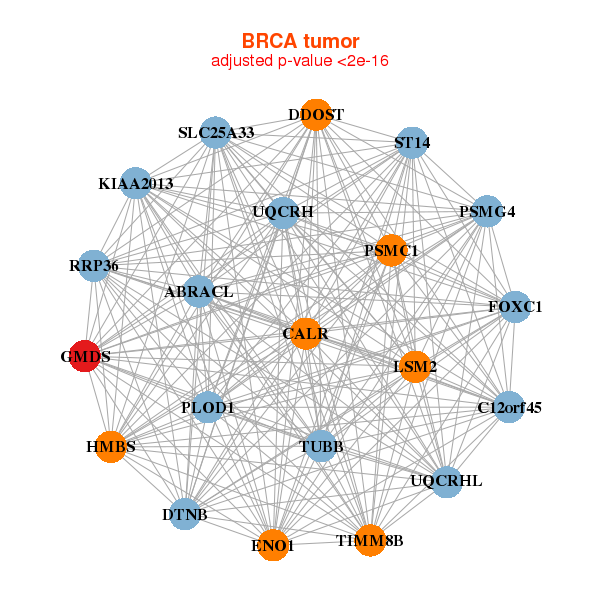
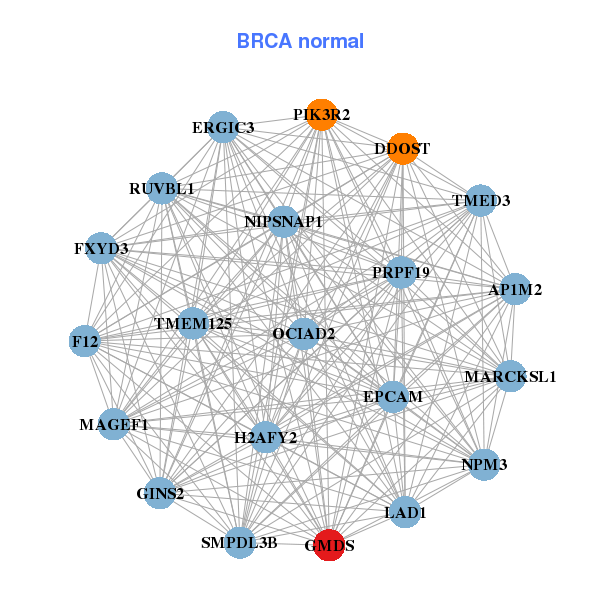
| * Co-Expression network figures were drawn using R package igraph. Only the top 20 genes with the highest correlations were shown. Red circle: input gene, orange circle: cell metabolism gene, sky circle: other gene |
: Open all plots for all cancer types
 |
| ||||
| C12orf45,ABRACL,RRP36,CALR,DDOST,DTNB,ENO1, FOXC1,GMDS,HMBS,KIAA2013,LSM2,PLOD1,PSMC1, PSMG4,SLC25A33,ST14,TIMM8B,TUBB,UQCRH,UQCRHL | AP1M2,DDOST,EPCAM,ERGIC3,F12,FXYD3,GINS2, GMDS,H2AFY2,LAD1,MAGEF1,MARCKSL1,NIPSNAP1,NPM3, OCIAD2,PIK3R2,PRPF19,RUVBL1,SMPDL3B,TMED3,TMEM125 | ||||
 |
| ||||
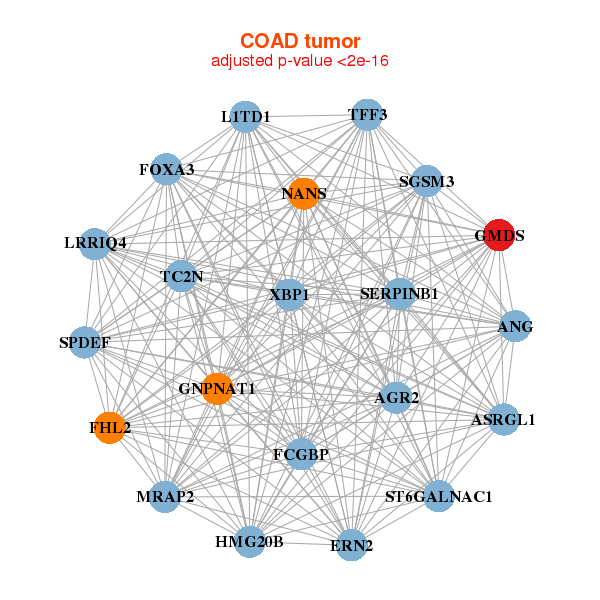
| AGR2,ANG,ASRGL1,ERN2,FCGBP,FHL2,FOXA3, GMDS,GNPNAT1,HMG20B,L1TD1,LRRIQ4,MRAP2,NANS, SERPINB1,SGSM3,SPDEF,ST6GALNAC1,TC2N,TFF3,XBP1 | AK7,AURKA,COASY,COQ2,DARS2,DERL1,GALK2, GMDS,HMGB3,HSD17B4,MIPEP,MMAA,MRAP2,NFE2L3, NME2P1,PGD,RARS,RPN1,RTN4IP1,SRBD1,TPM3 |

| * Co-Expression network figures were drawn using R package igraph. Only the top 20 genes with the highest correlations were shown. Red circle: input gene, orange circle: cell metabolism gene, sky circle: other gene |
: Open all plots for all cancer types
| Top |
: Open all interacting genes' information including KEGG pathway for all interacting genes from DAVID
| Top |
| Pharmacological Information for GMDS |
| DB Category | DB Name | DB's ID and Url link |
| * Gene Centered Interaction Network. |
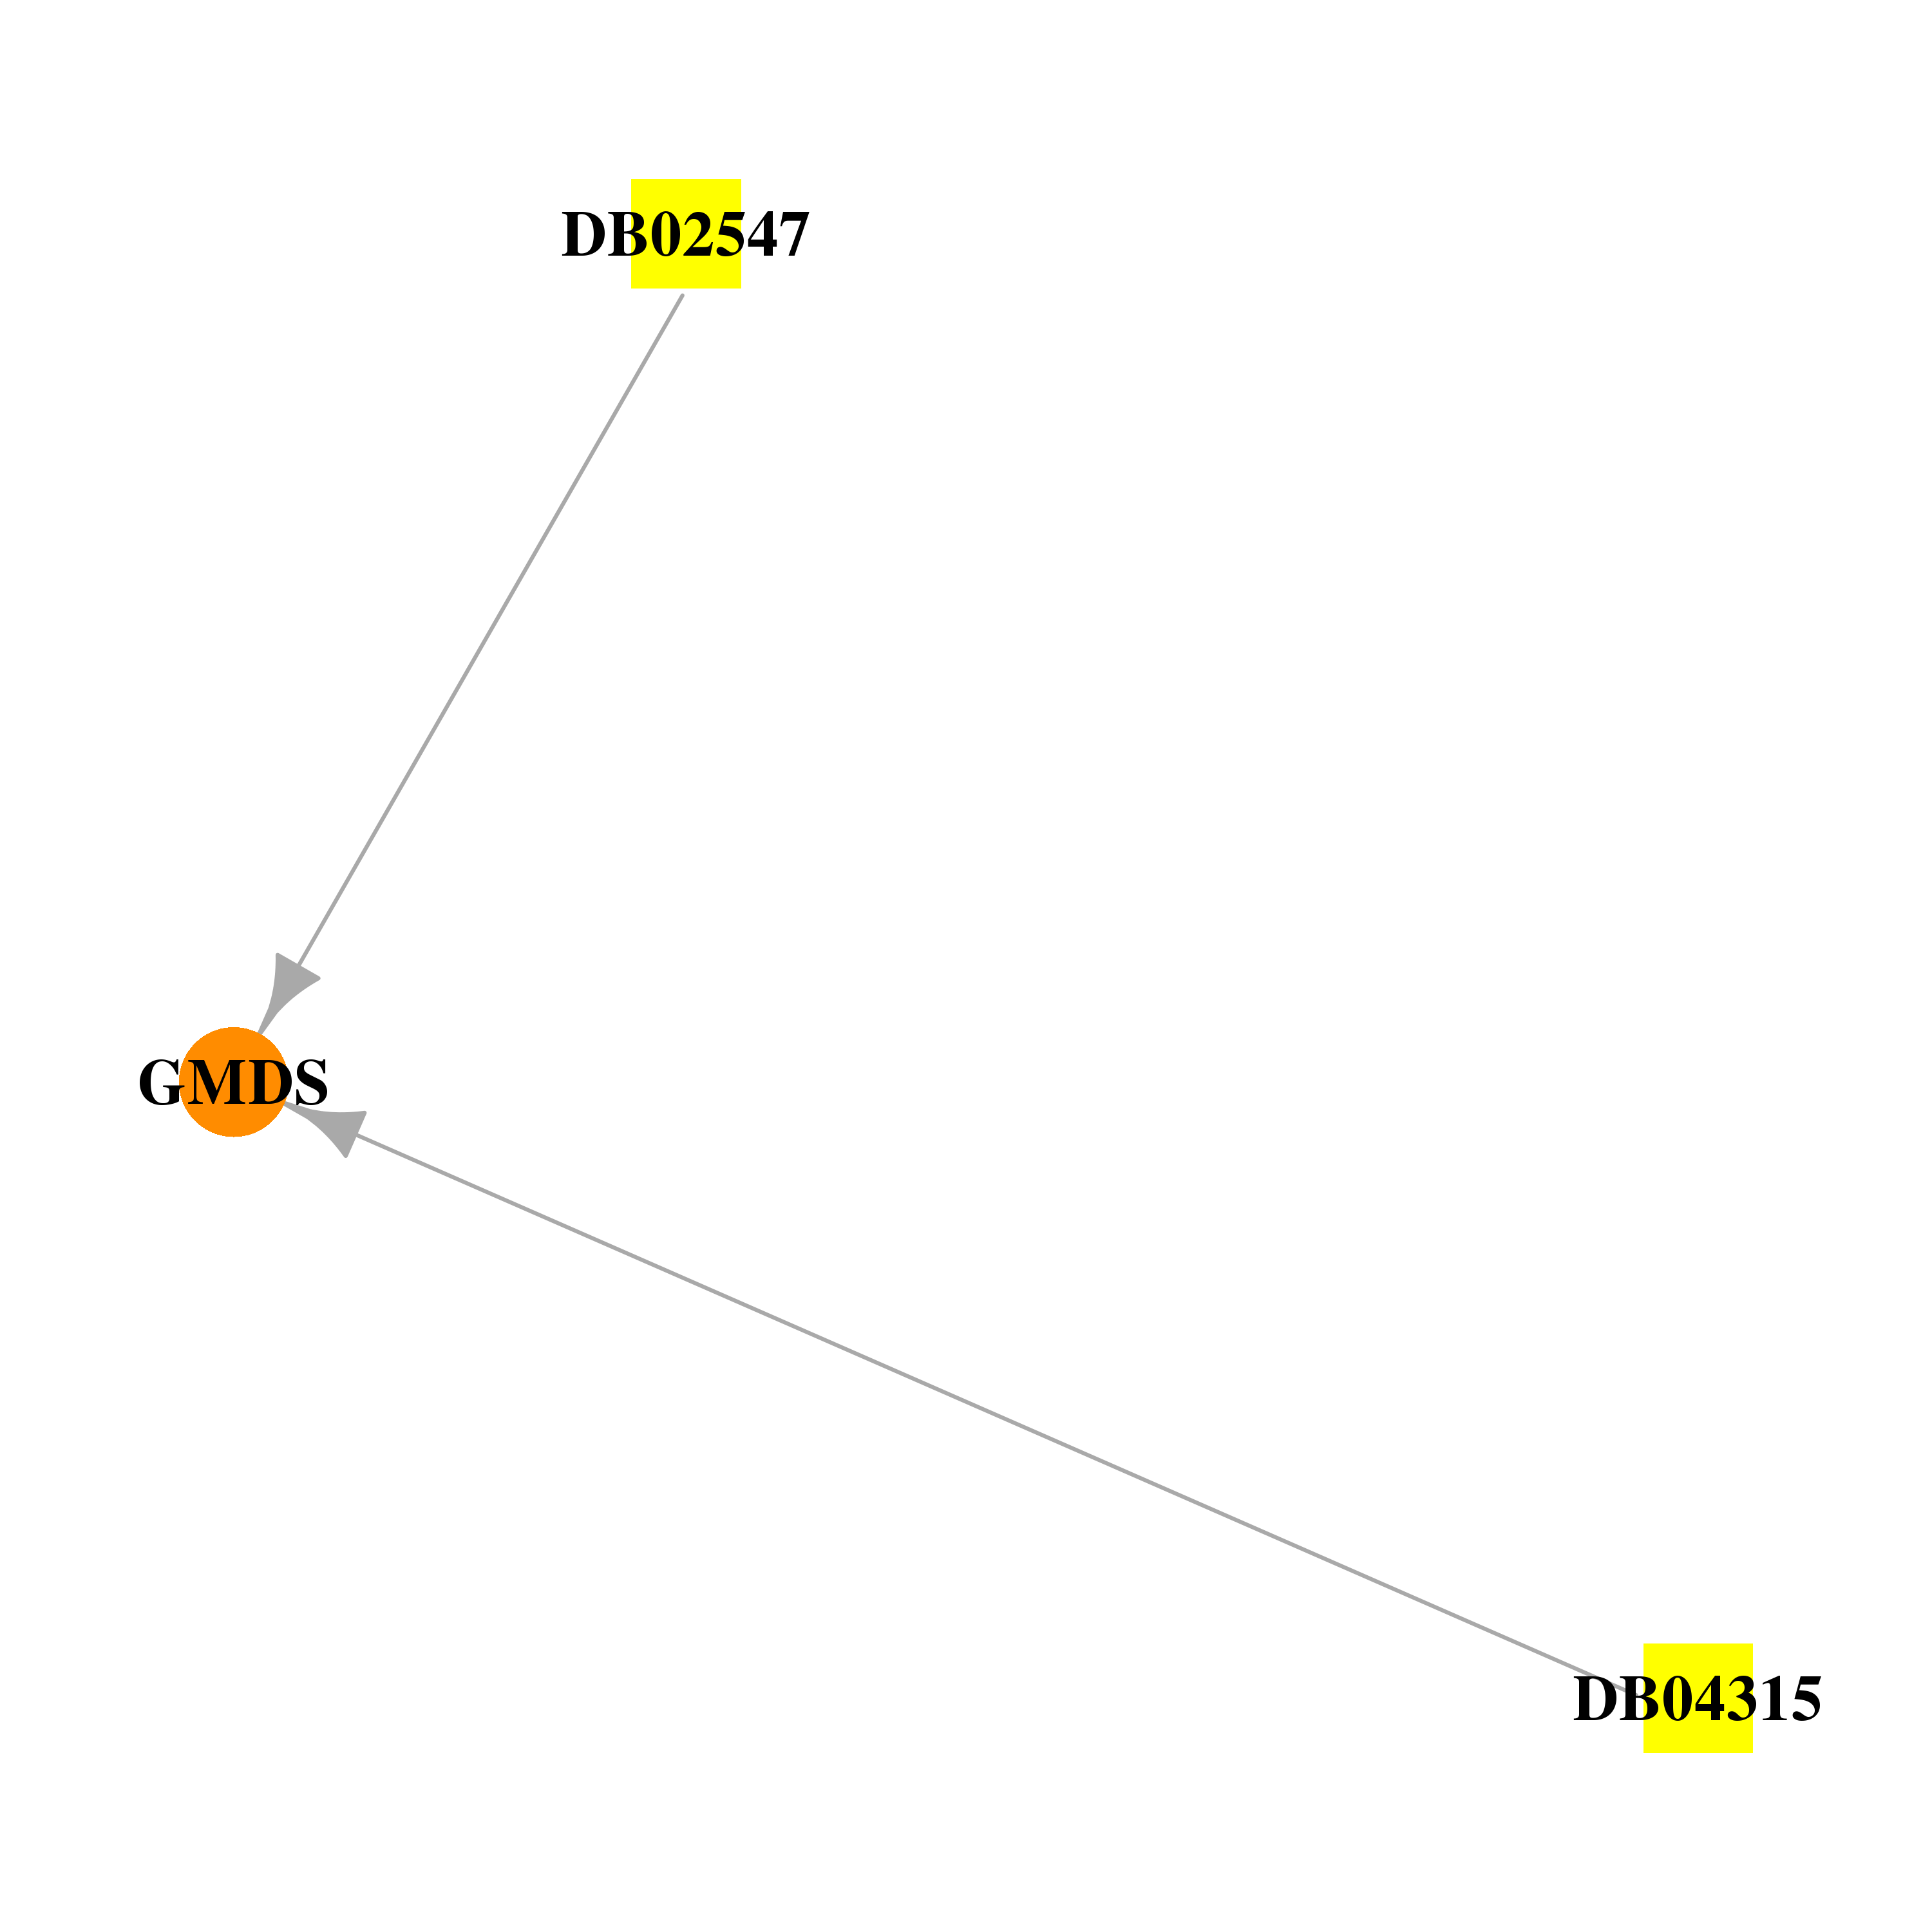 |
| * Drug Centered Interaction Network. |
| DrugBank ID | Target Name | Drug Groups | Generic Name | Drug Centered Network | Drug Structure |
| DB02547 | GDP-mannose 4,6-dehydratase | experimental | Guanosine-5'-Diphosphate-Rhamnose | 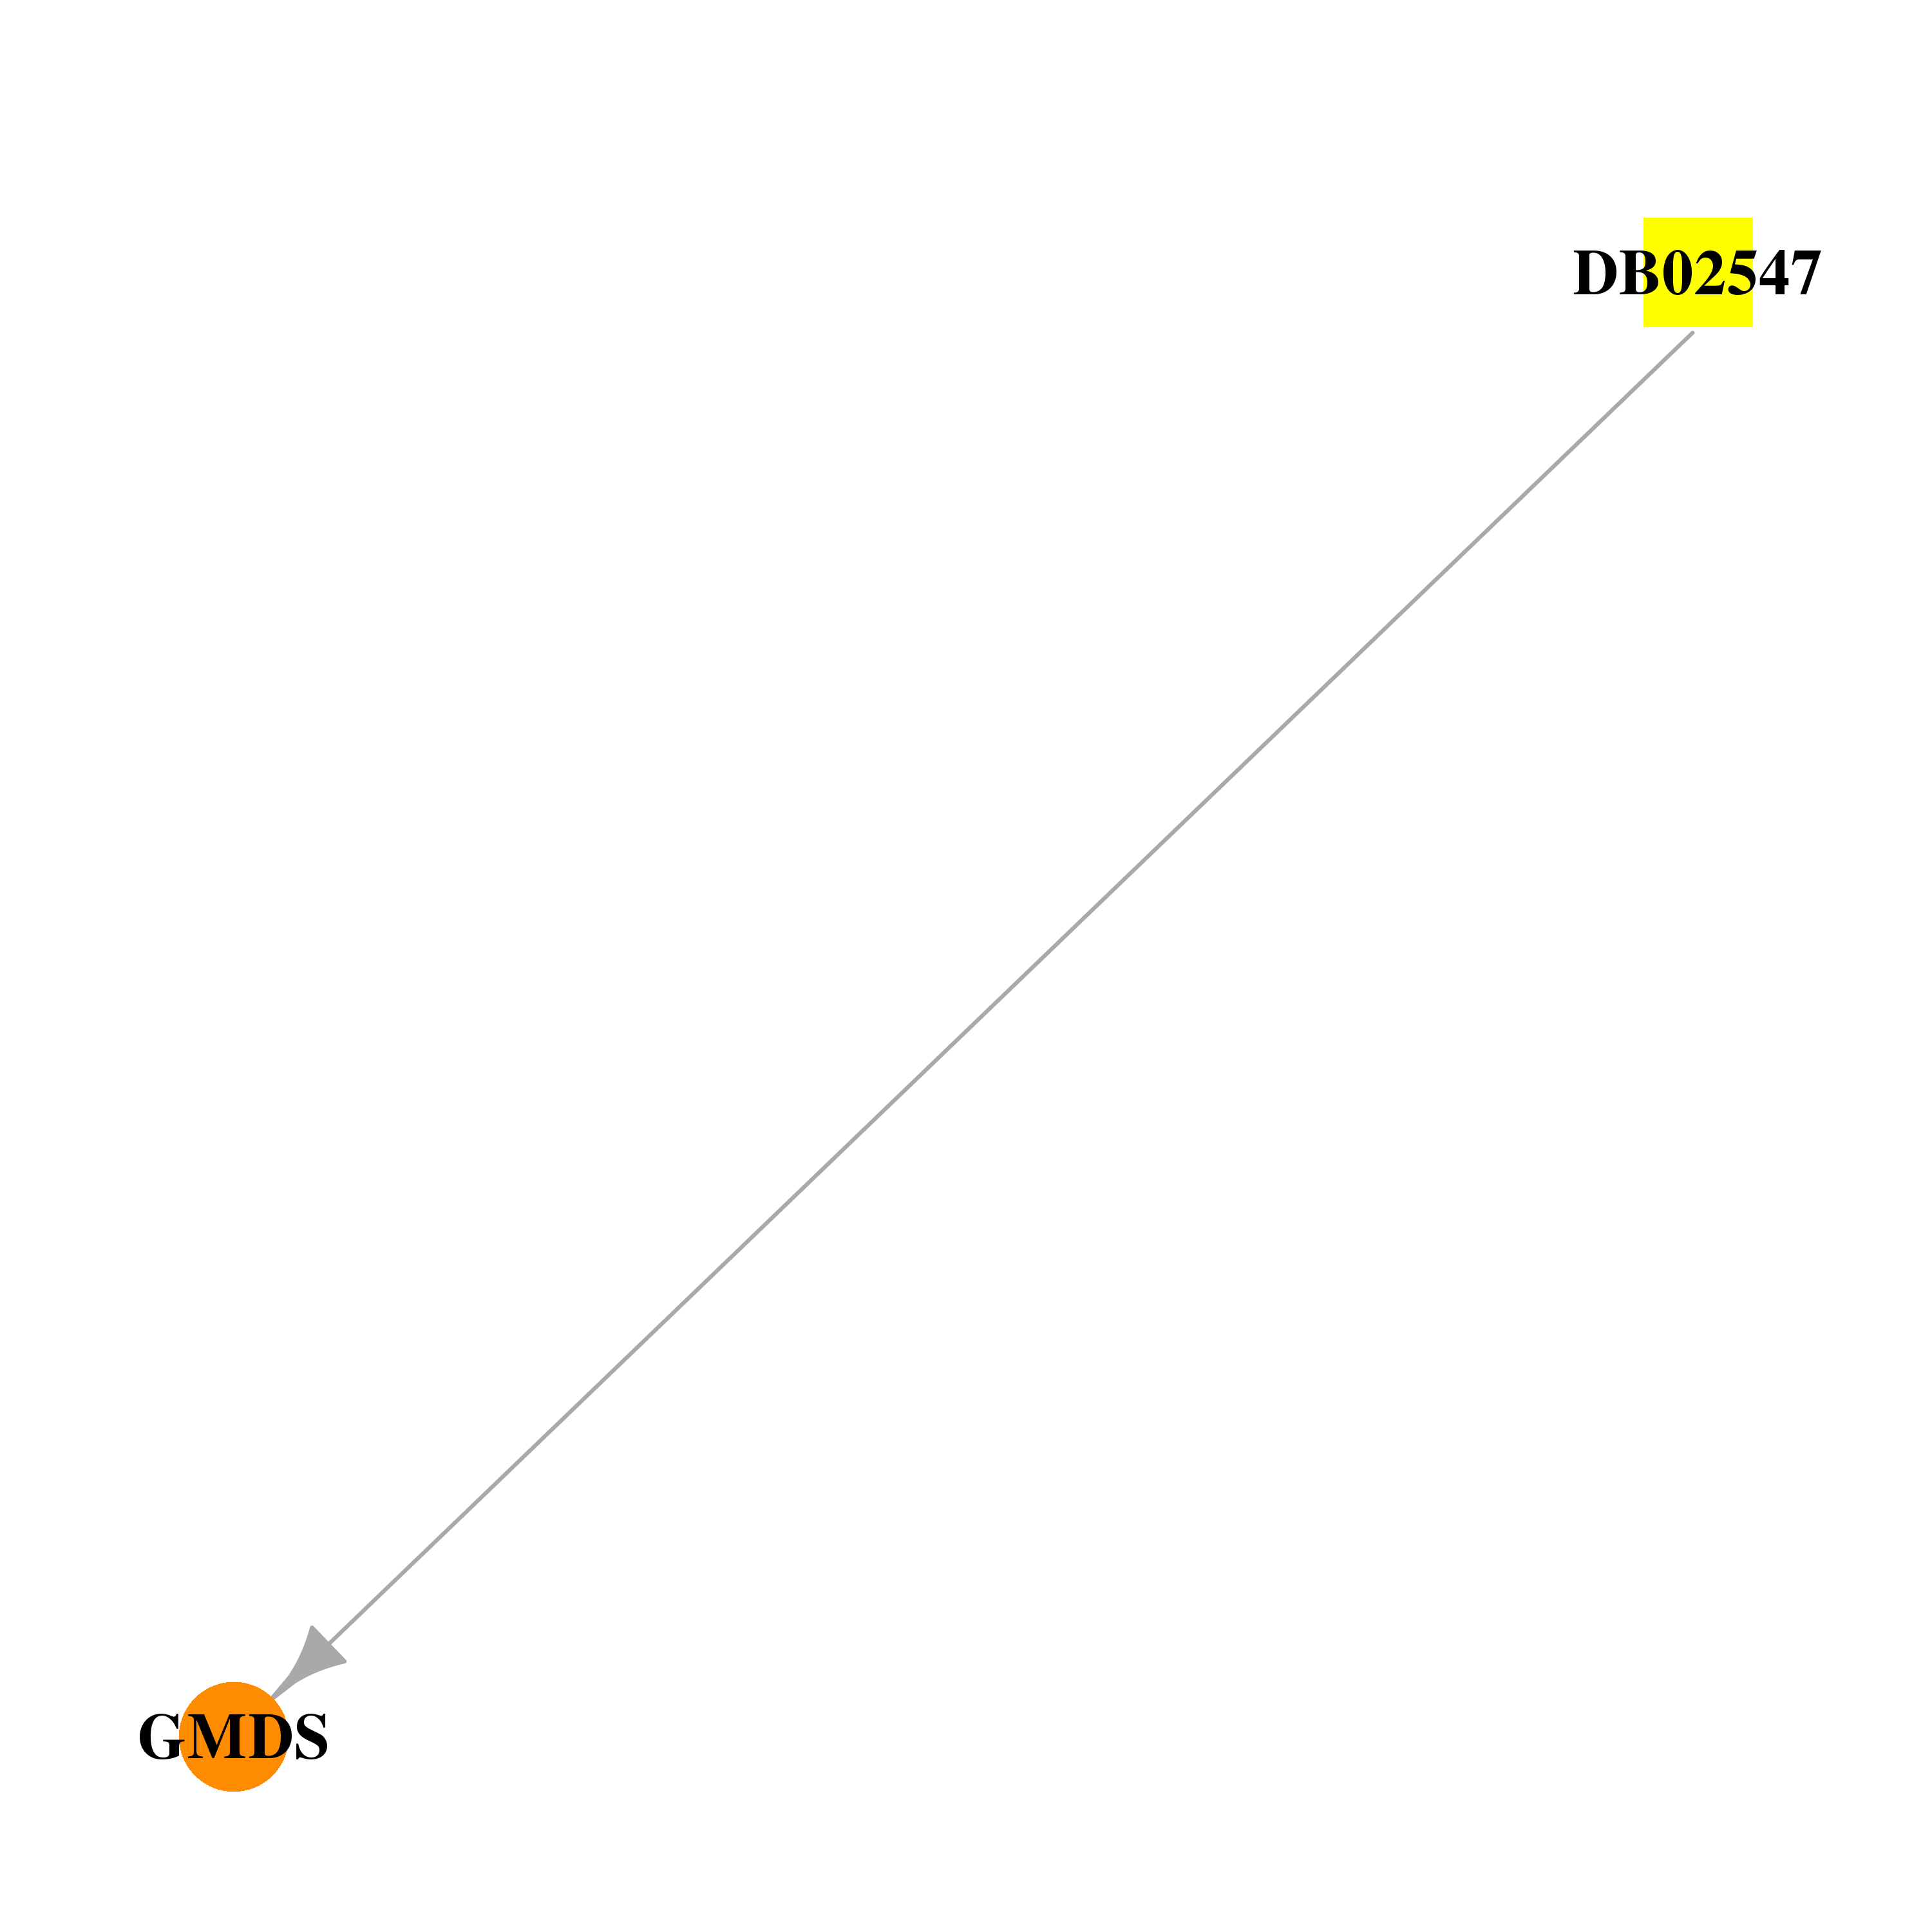 | 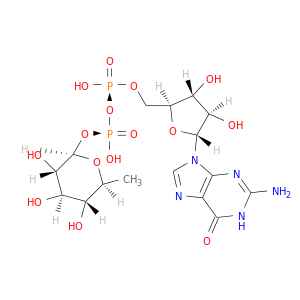 |
| DB04315 | GDP-mannose 4,6-dehydratase | experimental | Guanosine-5'-Diphosphate |  | 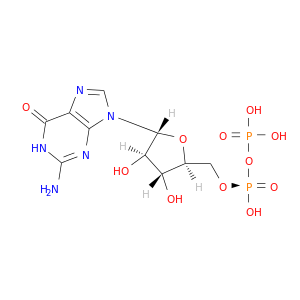 |
| Top |
| Cross referenced IDs for GMDS |
| * We obtained these cross-references from Uniprot database. It covers 150 different DBs, 18 categories. http://www.uniprot.org/help/cross_references_section |
: Open all cross reference information
|
Copyright © 2016-Present - The Univsersity of Texas Health Science Center at Houston @ |