|
|||||||||||||||||||||||||||||||||||||||||||||||||||||||||||||||||||||||||||||||||||||||||||||||||||||||||||||||||||||||||||||||||||||||||||||||||||||||||||||||||||||||||||||||||||||||||||||||||||||||||||||||||||||||||||||||||||||||||||||||||||||||||||||||||||||||||||||||||||||||||||||||||||||||||||||||||||||||||||||||||||||||||||||||||||||||||
| |
| Phenotypic Information (metabolism pathway, cancer, disease, phenome) |
| |
| |
| Gene-Gene Network Information: Co-Expression Network, Interacting Genes & KEGG |
| |
|


| Gene Summary for GNA11 |
| Basic gene info. | Gene symbol | GNA11 |
| Gene name | guanine nucleotide binding protein (G protein), alpha 11 (Gq class) | |
| Synonyms | FBH|FBH2|FHH2|GNA-11|HHC2|HYPOC2 | |
| Cytomap | UCSC genome browser: 19p13.3 | |
| Genomic location | chr19 :3094407-3121454 | |
| Type of gene | protein-coding | |
| RefGenes | NM_002067.4, | |
| Ensembl id | ENSG00000088256 | |
| Description | G-protein subunit alpha-11g alpha-11guanine nucleotide-binding protein G(y) subunit alphaguanine nucleotide-binding protein subunit alpha-11 | |
| Modification date | 20141222 | |
| dbXrefs | MIM : 139313 | |
| HGNC : HGNC | ||
| Ensembl : ENSG00000088256 | ||
| HPRD : 00759 | ||
| Vega : OTTHUMG00000180631 | ||
| Protein | UniProt: P29992 go to UniProt's Cross Reference DB Table | |
| Expression | CleanEX: HS_GNA11 | |
| BioGPS: 2767 | ||
| Gene Expression Atlas: ENSG00000088256 | ||
| The Human Protein Atlas: ENSG00000088256 | ||
| Pathway | NCI Pathway Interaction Database: GNA11 | |
| KEGG: GNA11 | ||
| REACTOME: GNA11 | ||
| ConsensusPathDB | ||
| Pathway Commons: GNA11 | ||
| Metabolism | MetaCyc: GNA11 | |
| HUMANCyc: GNA11 | ||
| Regulation | Ensembl's Regulation: ENSG00000088256 | |
| miRBase: chr19 :3,094,407-3,121,454 | ||
| TargetScan: NM_002067 | ||
| cisRED: ENSG00000088256 | ||
| Context | iHOP: GNA11 | |
| cancer metabolism search in PubMed: GNA11 | ||
| UCL Cancer Institute: GNA11 | ||
| Assigned class in ccmGDB | B - This gene belongs to cancer gene. | |
| Top |
| Phenotypic Information for GNA11(metabolism pathway, cancer, disease, phenome) |
| Cancer | CGAP: GNA11 |
| Familial Cancer Database: GNA11 | |
| * This gene is included in those cancer gene databases. |
|
|
|
|
|
| . | |||||||||||||||||||||||||||||||||||||||||||||||||||||||||||||||||||||||||||||||||||||||||||||||||||||||||||||||||||||||||||||||||||||||||||||||||||||||||||||||||||||||||||||||||||||||||||||||||||||||||||||||||||||||||||||||||||||||||||||||||||||||||||||||||||||||||||||||||||||||||||||||||||||||||||||||||||||||||||||||||||||||||||||||||||
Oncogene 1 | Significant driver gene in | ||||||||||||||||||||||||||||||||||||||||||||||||||||||||||||||||||||||||||||||||||||||||||||||||||||||||||||||||||||||||||||||||||||||||||||||||||||||||||||||||||||||||||||||||||||||||||||||||||||||||||||||||||||||||||||||||||||||||||||||||||||||||||||||||||||||||||||||||||||||||||||||||||||||||||||||||||||||||||||||||||||||||||||||||||||||||
| cf) number; DB name 1 Oncogene; http://nar.oxfordjournals.org/content/35/suppl_1/D721.long, 2 Tumor Suppressor gene; https://bioinfo.uth.edu/TSGene/, 3 Cancer Gene Census; http://www.nature.com/nrc/journal/v4/n3/abs/nrc1299.html, 4 CancerGenes; http://nar.oxfordjournals.org/content/35/suppl_1/D721.long, 5 Network of Cancer Gene; http://ncg.kcl.ac.uk/index.php, 1Therapeutic Vulnerabilities in Cancer; http://cbio.mskcc.org/cancergenomics/statius/ |
| REACTOME_INTEGRATION_OF_ENERGY_METABOLISM | |
| OMIM | 139313; gene. 145981; phenotype. 615361; phenotype. |
| Orphanet | 101049; Familial hypocalciuric hypercalcemia type 2. 428; Autosomal dominant hypocalcemia. |
| Disease | KEGG Disease: GNA11 |
| MedGen: GNA11 (Human Medical Genetics with Condition) | |
| ClinVar: GNA11 | |
| Phenotype | MGI: GNA11 (International Mouse Phenotyping Consortium) |
| PhenomicDB: GNA11 | |
| Mutations for GNA11 |
| * Under tables are showing count per each tissue to give us broad intuition about tissue specific mutation patterns.You can go to the detailed page for each mutation database's web site. |
| There's no structural variation information in COSMIC data for this gene. |
| * From mRNA Sanger sequences, Chitars2.0 arranged chimeric transcripts. This table shows GNA11 related fusion information. |
| ID | Head Gene | Tail Gene | Accession | Gene_a | qStart_a | qEnd_a | Chromosome_a | tStart_a | tEnd_a | Gene_a | qStart_a | qEnd_a | Chromosome_a | tStart_a | tEnd_a |
| CK818891 | GNA11 | 1 | 216 | 19 | 3115036 | 3119254 | REG1A | 208 | 260 | 2 | 79350483 | 79350535 | |
| CK818890 | REG1A | 16 | 64 | 2 | 79350483 | 79350531 | GNA11 | 56 | 272 | 19 | 3115035 | 3119254 | |
| BM126302 | GNA11 | 1 | 200 | 19 | 3115052 | 3119254 | REG1A | 192 | 244 | 2 | 79350483 | 79350535 | |
| BM126025 | REG1A | 12 | 64 | 2 | 79350483 | 79350535 | GNA11 | 56 | 225 | 19 | 3118933 | 3119254 | |
| Top |
| Mutation type/ Tissue ID | brca | cns | cerv | endome | haematopo | kidn | Lintest | liver | lung | ns | ovary | pancre | prost | skin | stoma | thyro | urina | |||
| Total # sample | 1 | 1 | ||||||||||||||||||
| GAIN (# sample) | 1 | |||||||||||||||||||
| LOSS (# sample) | 1 |
| cf) Tissue ID; Tissue type (1; Breast, 2; Central_nervous_system, 3; Cervix, 4; Endometrium, 5; Haematopoietic_and_lymphoid_tissue, 6; Kidney, 7; Large_intestine, 8; Liver, 9; Lung, 10; NS, 11; Ovary, 12; Pancreas, 13; Prostate, 14; Skin, 15; Stomach, 16; Thyroid, 17; Urinary_tract) |
| Top |
|
 |
| Top |
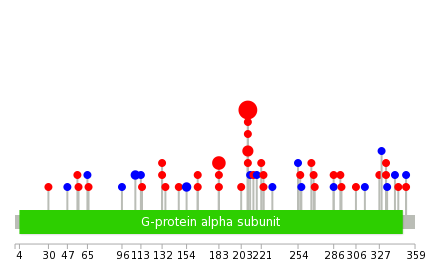
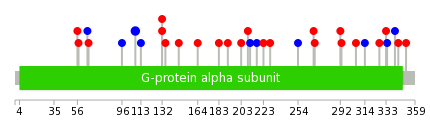
| Stat. for Non-Synonymous SNVs (# total SNVs=279) | (# total SNVs=12) |
 |  |
(# total SNVs=1) | (# total SNVs=0) |
 |
| Top |
| * When you move the cursor on each content, you can see more deailed mutation information on the Tooltip. Those are primary_site,primary_histology,mutation(aa),pubmedID. |
| GRCh37 position | Mutation(aa) | Unique sampleID count |
| chr19:3118942-3118942 | p.Q209L | 143 |
| chr19:3115012-3115012 | p.R183C | 9 |
| chr19:3118941-3118941 | p.Q209K | 4 |
| chr19:3118942-3118943 | p.Q209L | 4 |
| chr19:3115011-3115012 | p.R183C | 3 |
| chr19:3113468-3113468 | p.S154S | 2 |
| chr19:3113330-3113330 | p.A108A | 2 |
| chr19:3115013-3115013 | p.R183L | 2 |
| chr19:3094737-3094737 | p.R30W | 1 |
| chr19:3119021-3119021 | p.Y235* | 1 |
| Top |
|
 |
| Point Mutation/ Tissue ID | 1 | 2 | 3 | 4 | 5 | 6 | 7 | 8 | 9 | 10 | 11 | 12 | 13 | 14 | 15 | 16 | 17 | 18 | 19 | 20 |
| # sample | 1 | 7 | 1 | 1 | 3 | 1 | 1 | 7 | 7 | 3 | ||||||||||
| # mutation | 1 | 7 | 1 | 1 | 4 | 1 | 1 | 7 | 7 | 3 | ||||||||||
| nonsynonymous SNV | 1 | 4 | 1 | 3 | 1 | 1 | 4 | 5 | 2 | |||||||||||
| synonymous SNV | 3 | 1 | 1 | 3 | 2 | 1 |
| cf) Tissue ID; Tissue type (1; BLCA[Bladder Urothelial Carcinoma], 2; BRCA[Breast invasive carcinoma], 3; CESC[Cervical squamous cell carcinoma and endocervical adenocarcinoma], 4; COAD[Colon adenocarcinoma], 5; GBM[Glioblastoma multiforme], 6; Glioma Low Grade, 7; HNSC[Head and Neck squamous cell carcinoma], 8; KICH[Kidney Chromophobe], 9; KIRC[Kidney renal clear cell carcinoma], 10; KIRP[Kidney renal papillary cell carcinoma], 11; LAML[Acute Myeloid Leukemia], 12; LUAD[Lung adenocarcinoma], 13; LUSC[Lung squamous cell carcinoma], 14; OV[Ovarian serous cystadenocarcinoma ], 15; PAAD[Pancreatic adenocarcinoma], 16; PRAD[Prostate adenocarcinoma], 17; SKCM[Skin Cutaneous Melanoma], 18:STAD[Stomach adenocarcinoma], 19:THCA[Thyroid carcinoma], 20:UCEC[Uterine Corpus Endometrial Carcinoma]) |
| Top |
| * We represented just top 10 SNVs. When you move the cursor on each content, you can see more deailed mutation information on the Tooltip. Those are primary_site, primary_histology, mutation(aa), pubmedID. |
| Genomic Position | Mutation(aa) | Unique sampleID count |
| chr19:3113330 | p.A108A | 2 |
| chr19:3110298 | p.I132V | 1 |
| chr19:3118942 | p.F292V | 1 |
| chr19:3121039 | p.I132M | 1 |
| chr19:3118949 | p.P293S | 1 |
| chr19:3121077 | p.L135P | 1 |
| chr19:3113345 | p.R306L | 1 |
| chr19:3118967 | p.R147H | 1 |
| chr19:3121094 | p.V314V | 1 |
| chr19:3113400 | p.V164I | 1 |
| * Copy number data were extracted from TCGA using R package TCGA-Assembler. The URLs of all public data files on TCGA DCC data server were gathered on Jan-05-2015. Function ProcessCNAData in TCGA-Assembler package was used to obtain gene-level copy number value which is calculated as the average copy number of the genomic region of a gene. |
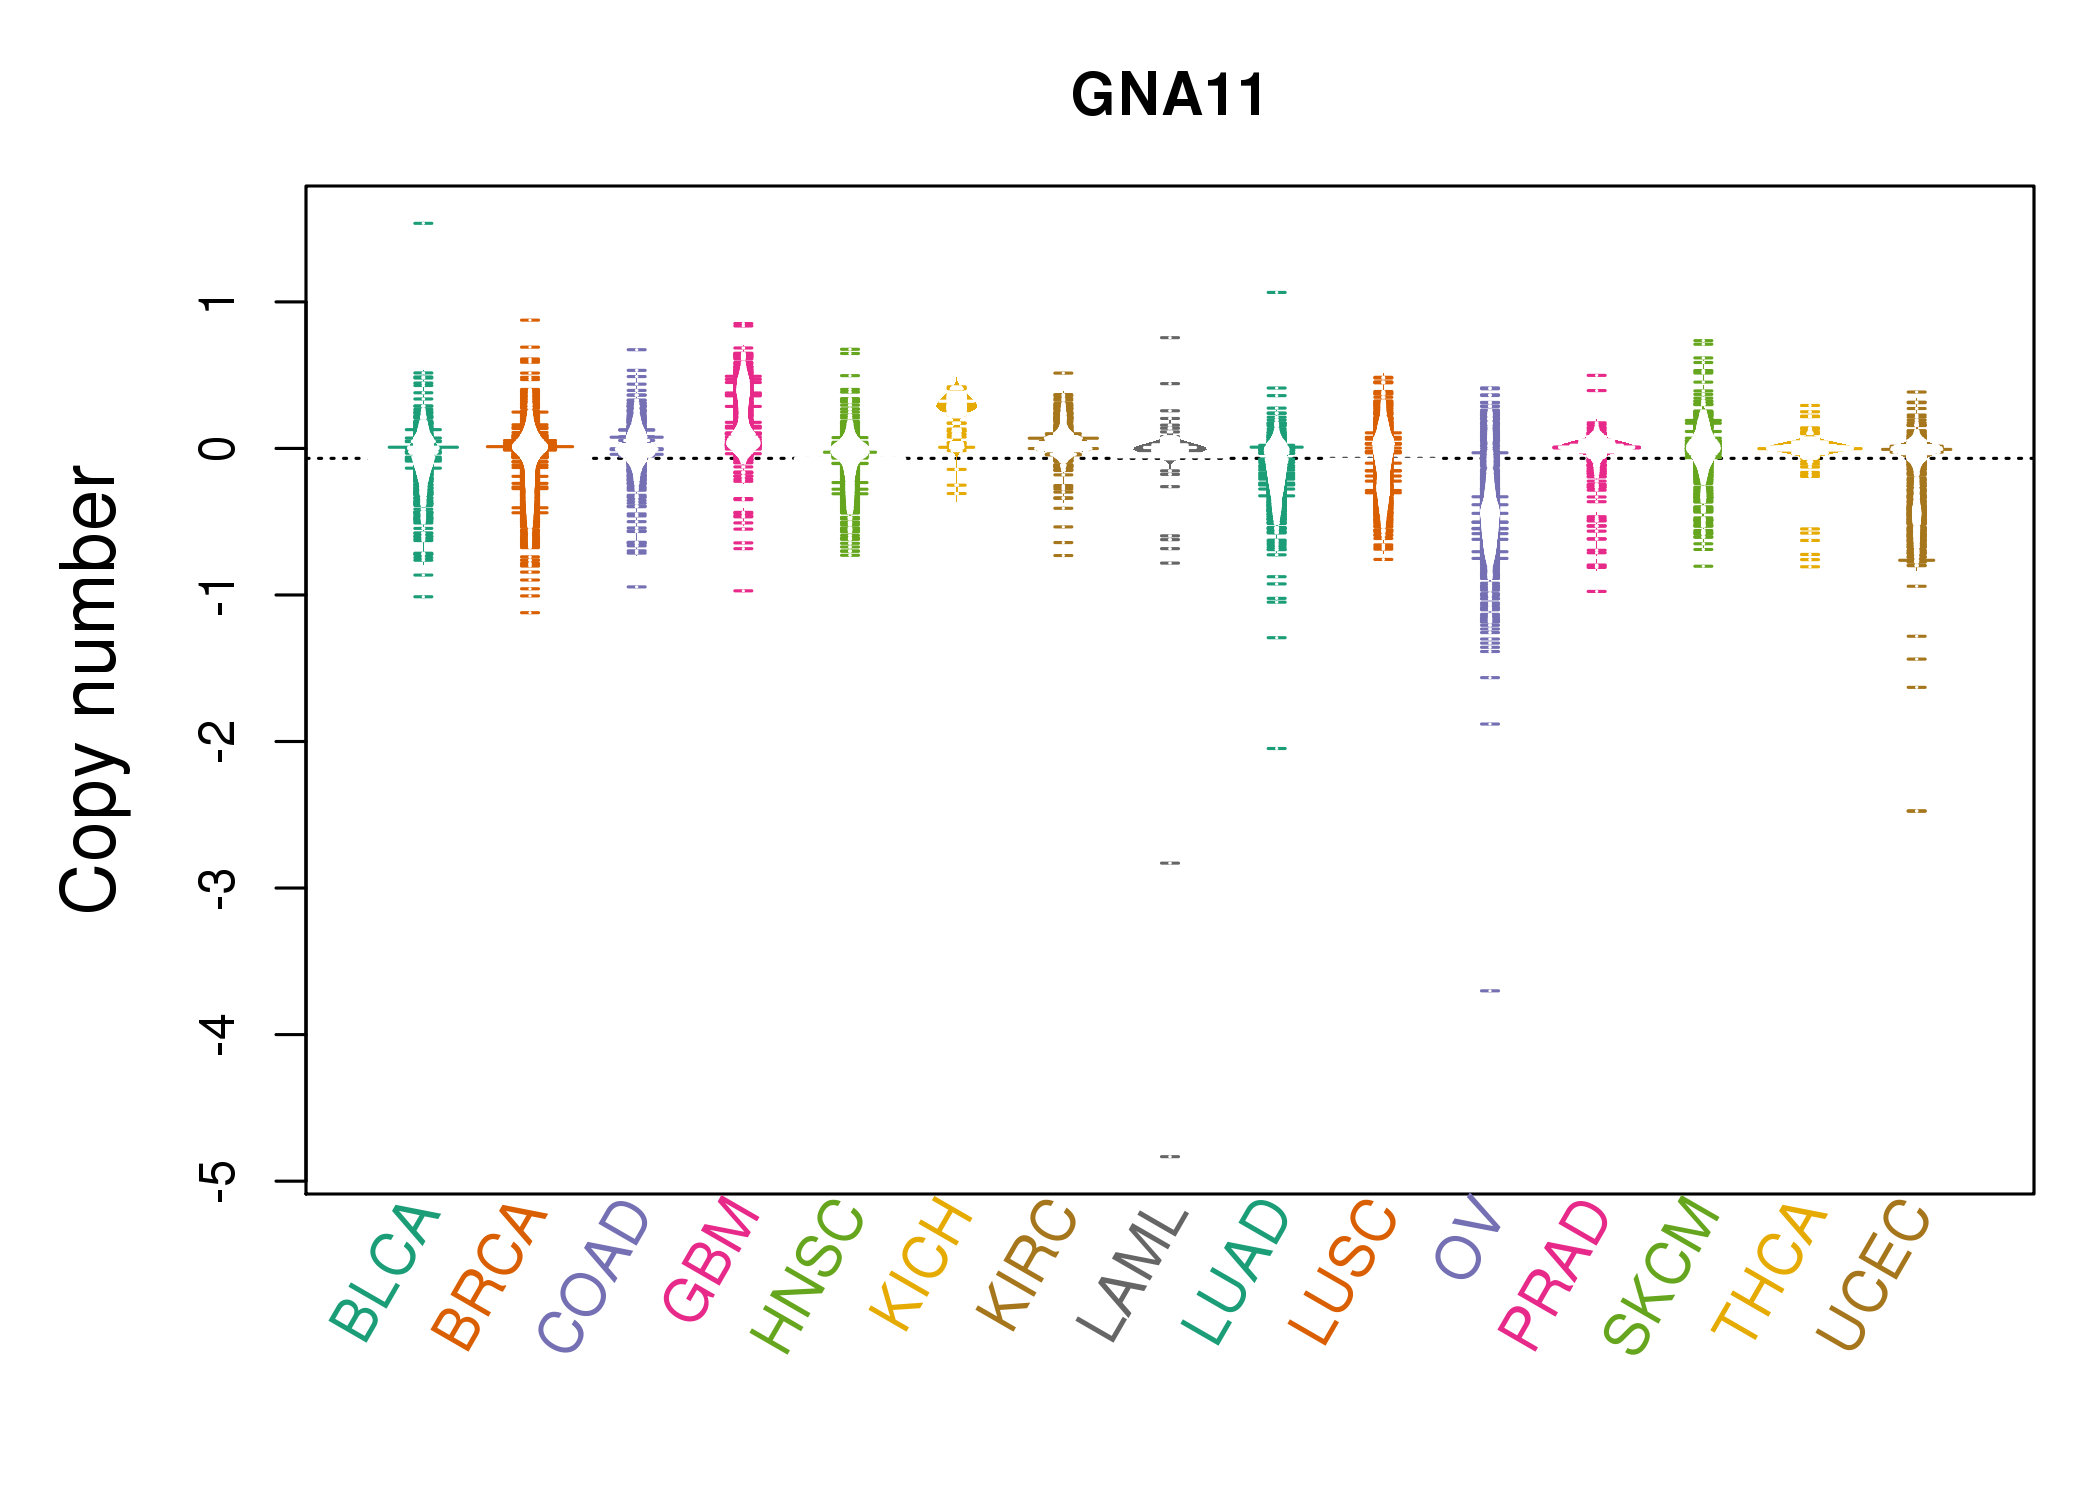 |
| cf) Tissue ID[Tissue type]: BLCA[Bladder Urothelial Carcinoma], BRCA[Breast invasive carcinoma], CESC[Cervical squamous cell carcinoma and endocervical adenocarcinoma], COAD[Colon adenocarcinoma], GBM[Glioblastoma multiforme], Glioma Low Grade, HNSC[Head and Neck squamous cell carcinoma], KICH[Kidney Chromophobe], KIRC[Kidney renal clear cell carcinoma], KIRP[Kidney renal papillary cell carcinoma], LAML[Acute Myeloid Leukemia], LUAD[Lung adenocarcinoma], LUSC[Lung squamous cell carcinoma], OV[Ovarian serous cystadenocarcinoma ], PAAD[Pancreatic adenocarcinoma], PRAD[Prostate adenocarcinoma], SKCM[Skin Cutaneous Melanoma], STAD[Stomach adenocarcinoma], THCA[Thyroid carcinoma], UCEC[Uterine Corpus Endometrial Carcinoma] |
| Top |
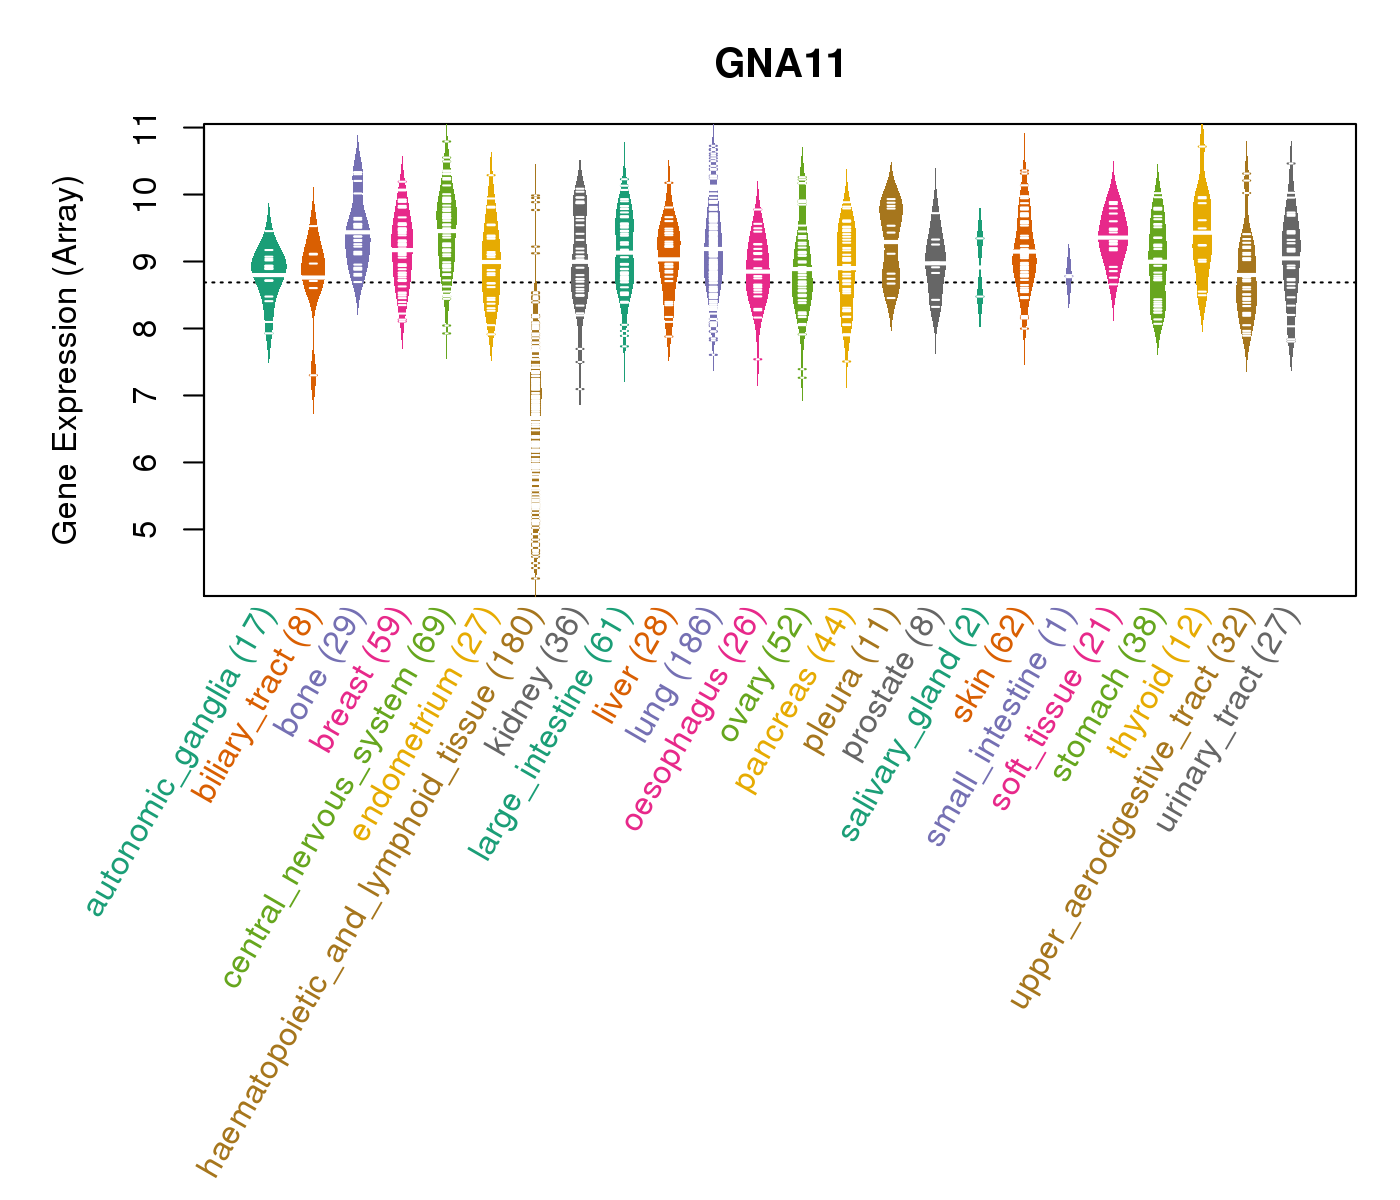
| Gene Expression for GNA11 |
| * CCLE gene expression data were extracted from CCLE_Expression_Entrez_2012-10-18.res: Gene-centric RMA-normalized mRNA expression data. |
 |
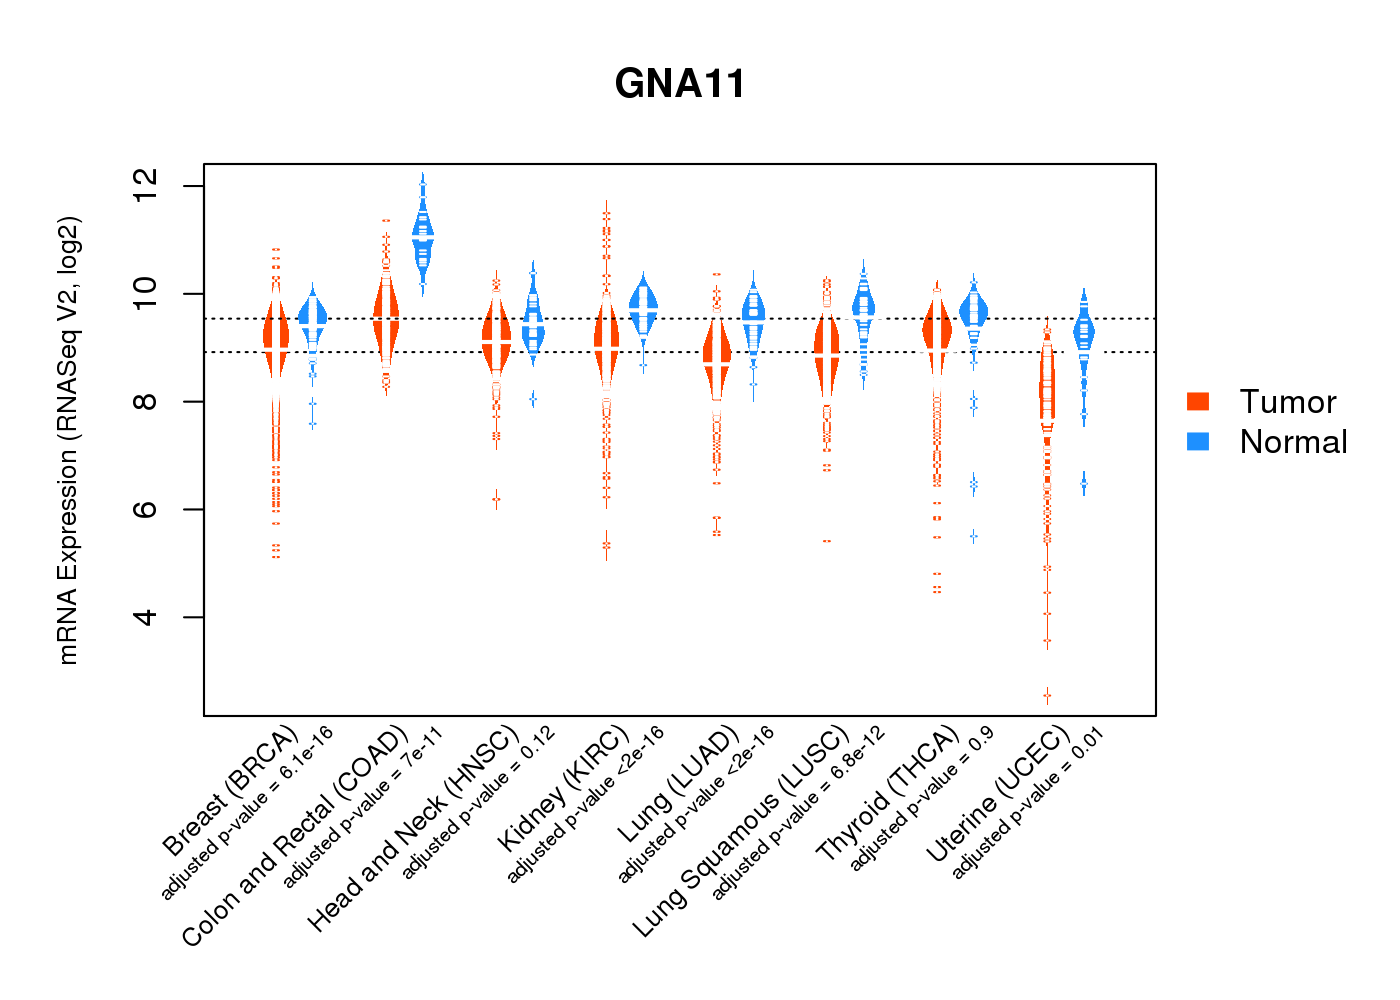
| * Normalized gene expression data of RNASeqV2 was extracted from TCGA using R package TCGA-Assembler. The URLs of all public data files on TCGA DCC data server were gathered at Jan-05-2015. Only eight cancer types have enough normal control samples for differential expression analysis. (t test, adjusted p<0.05 (using Benjamini-Hochberg FDR)) |
 |
| Top |
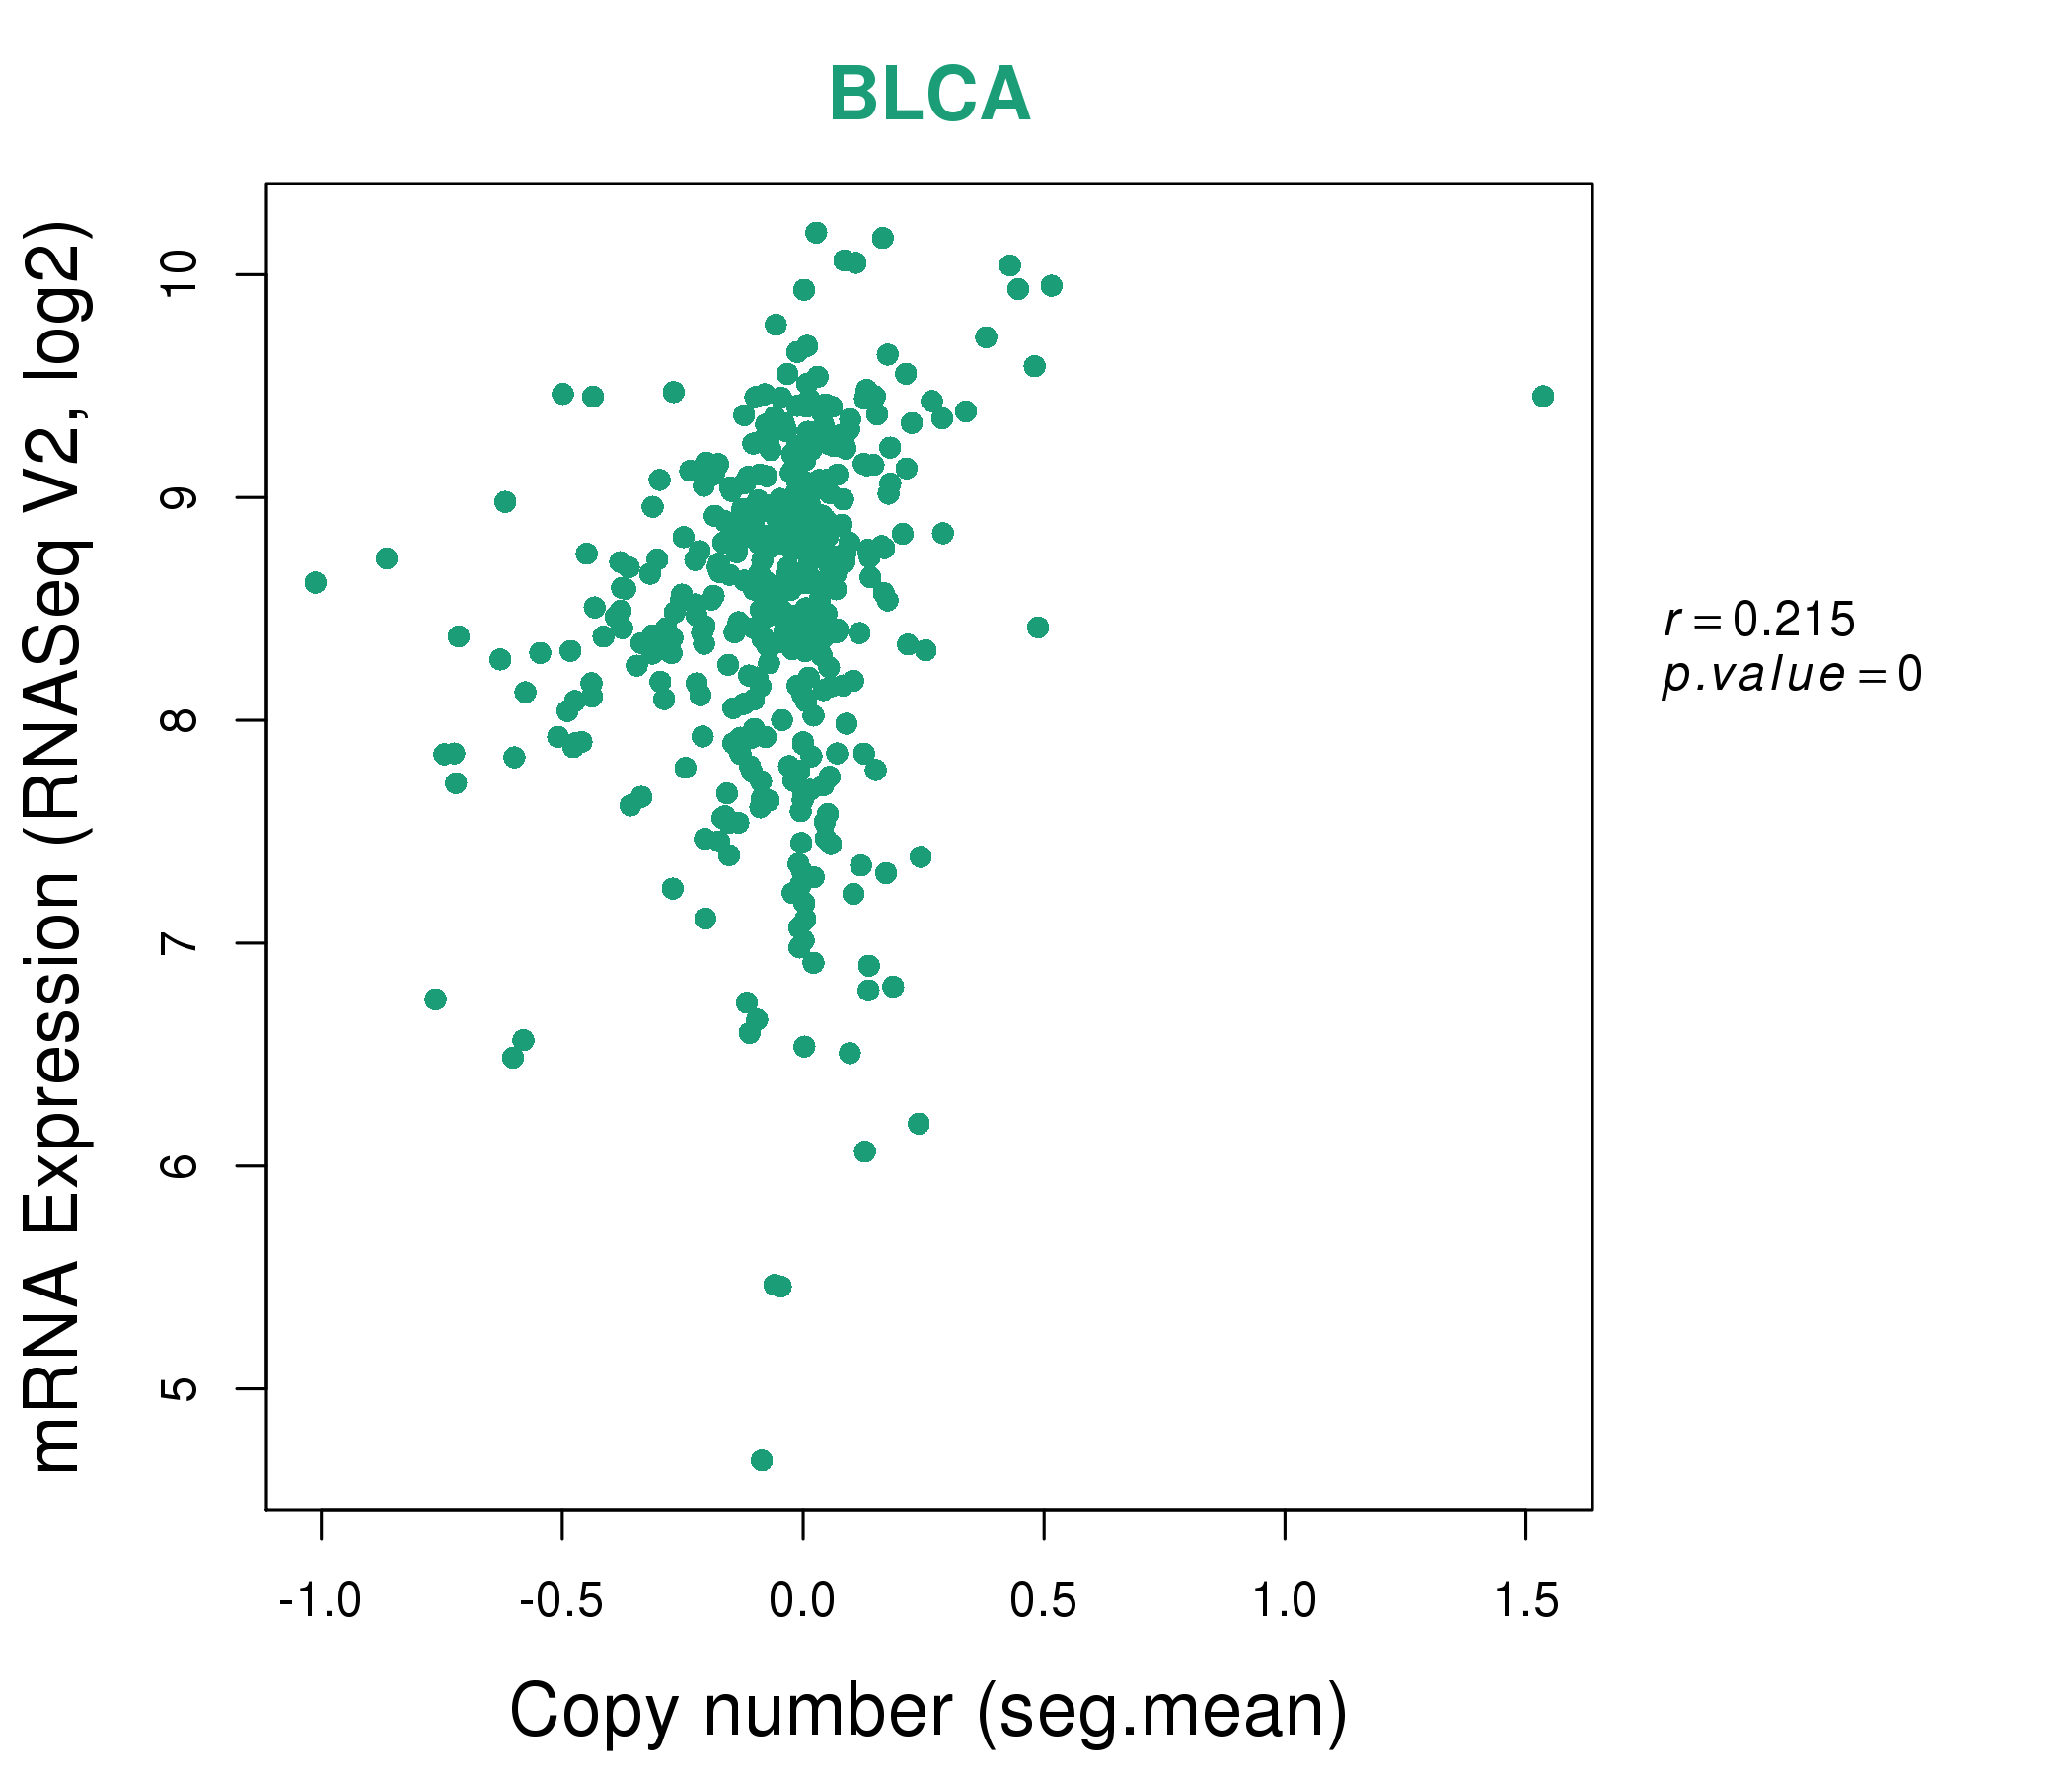
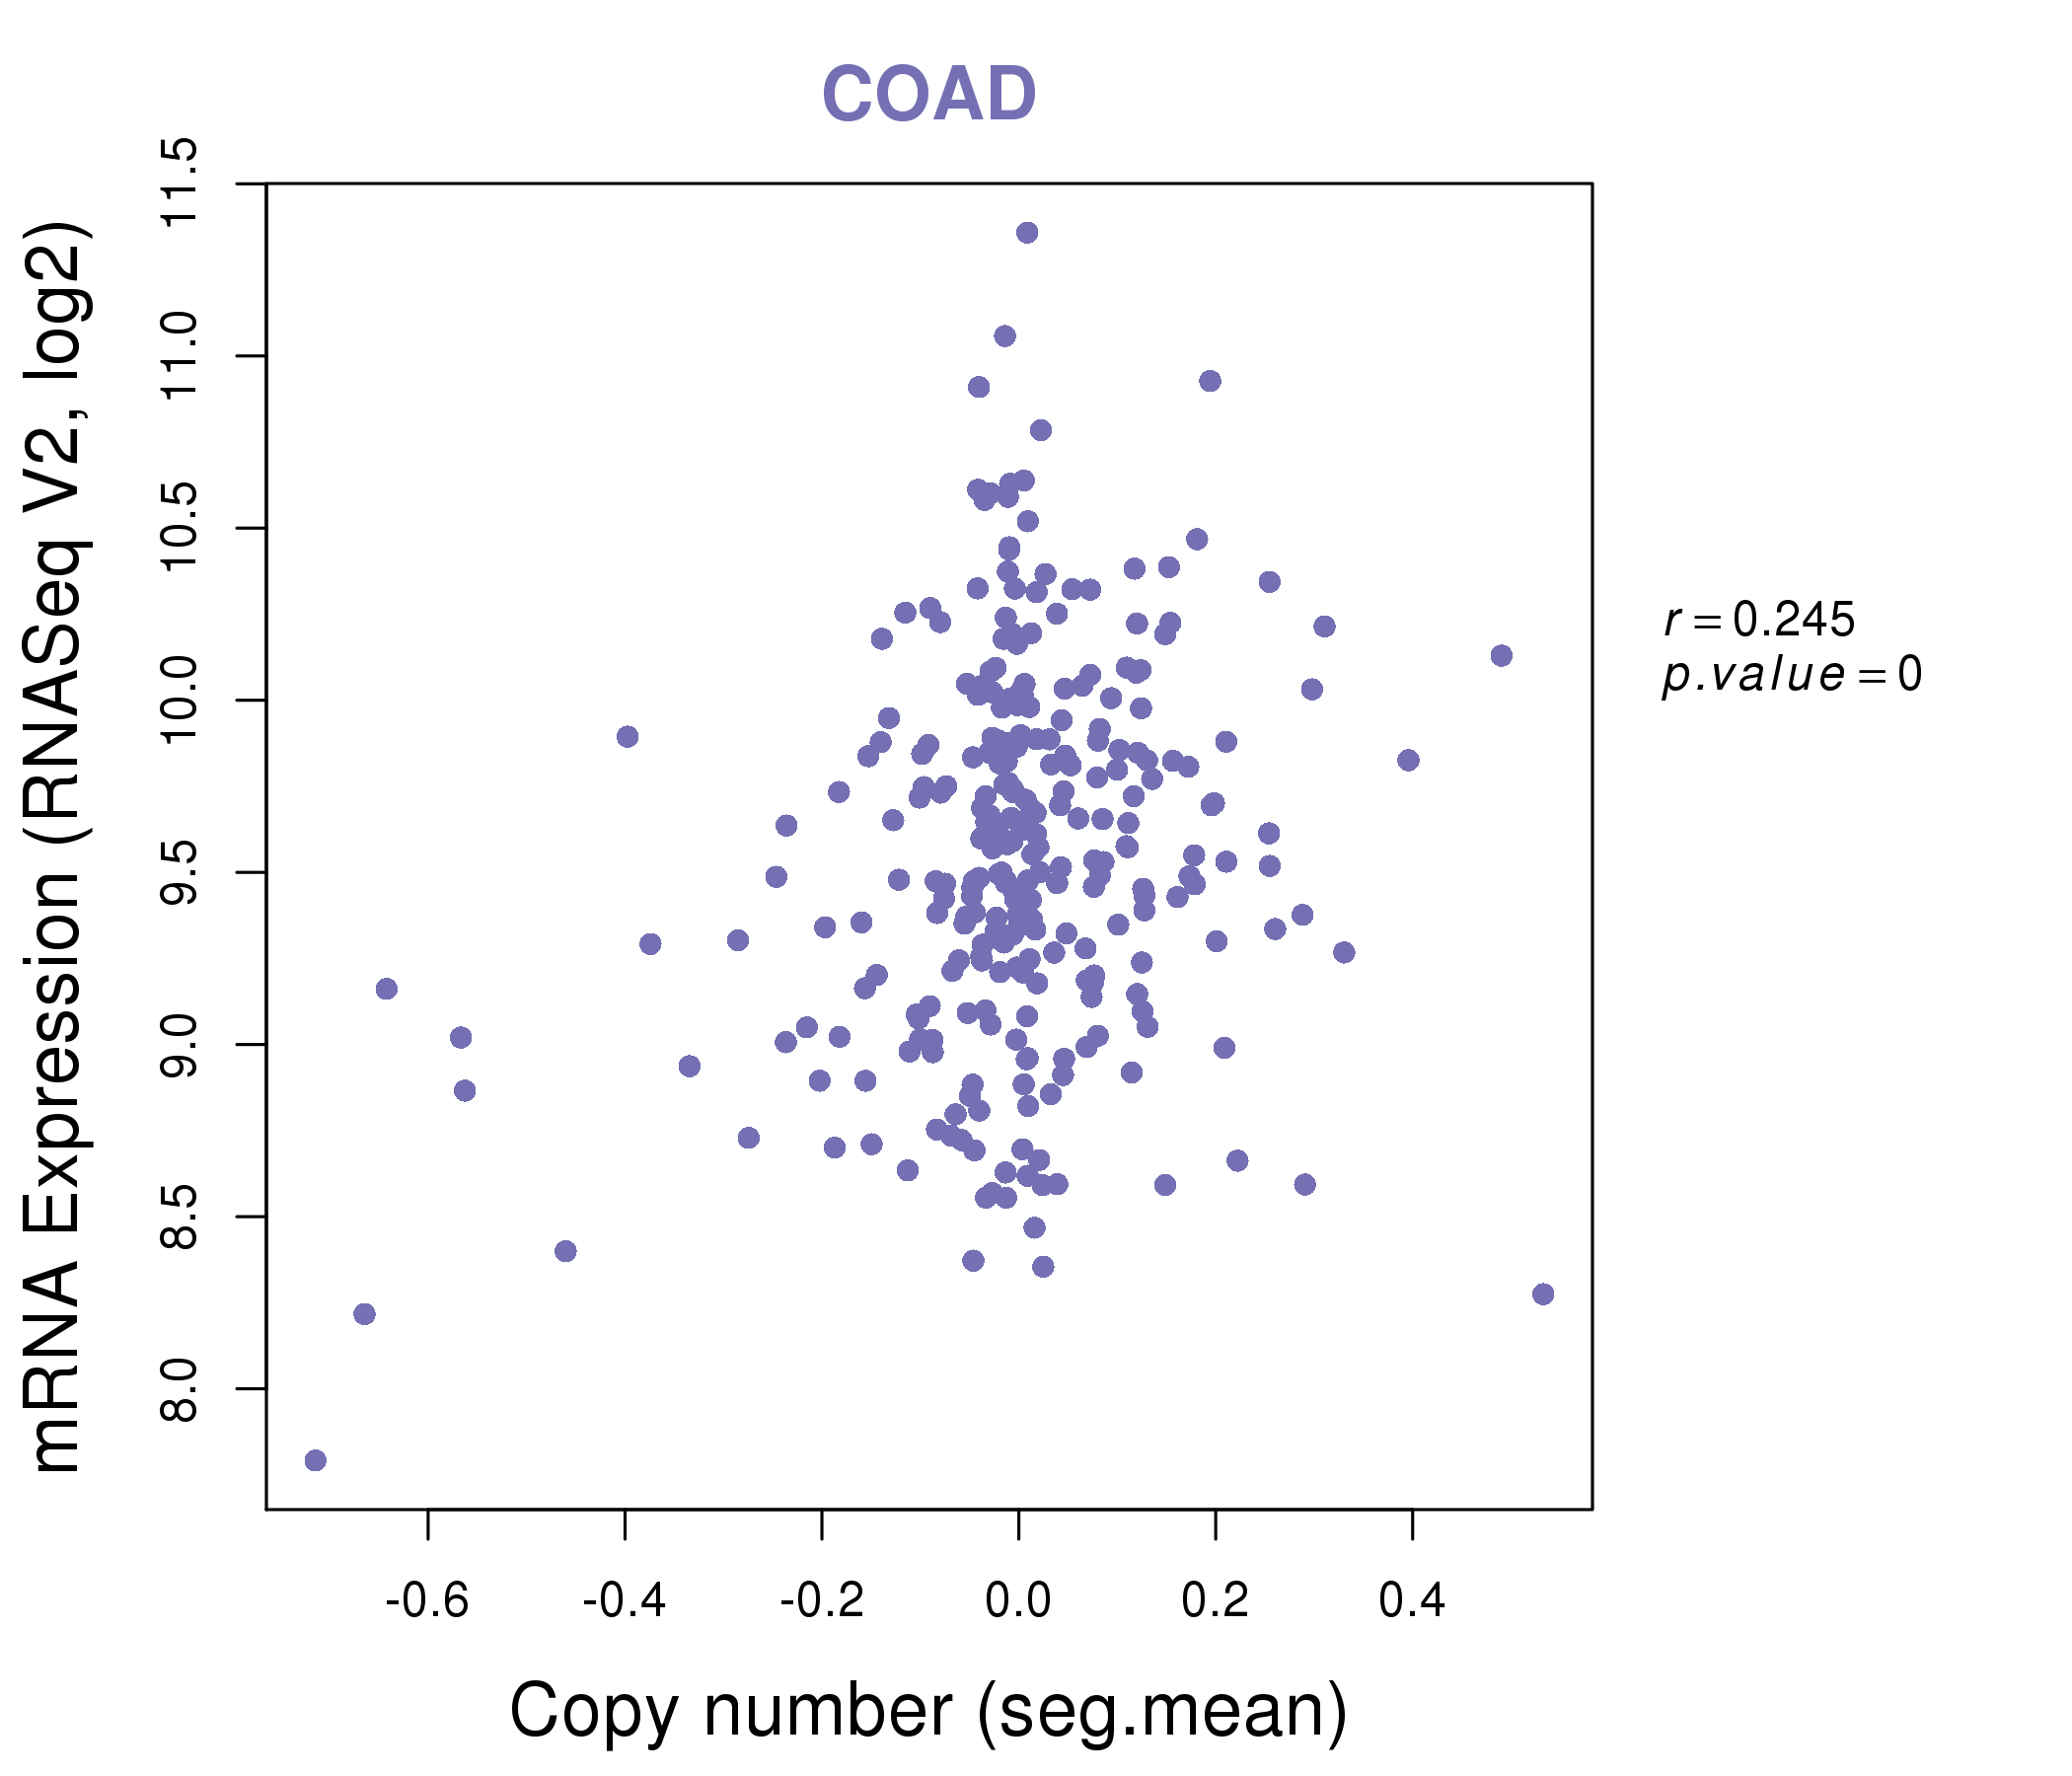
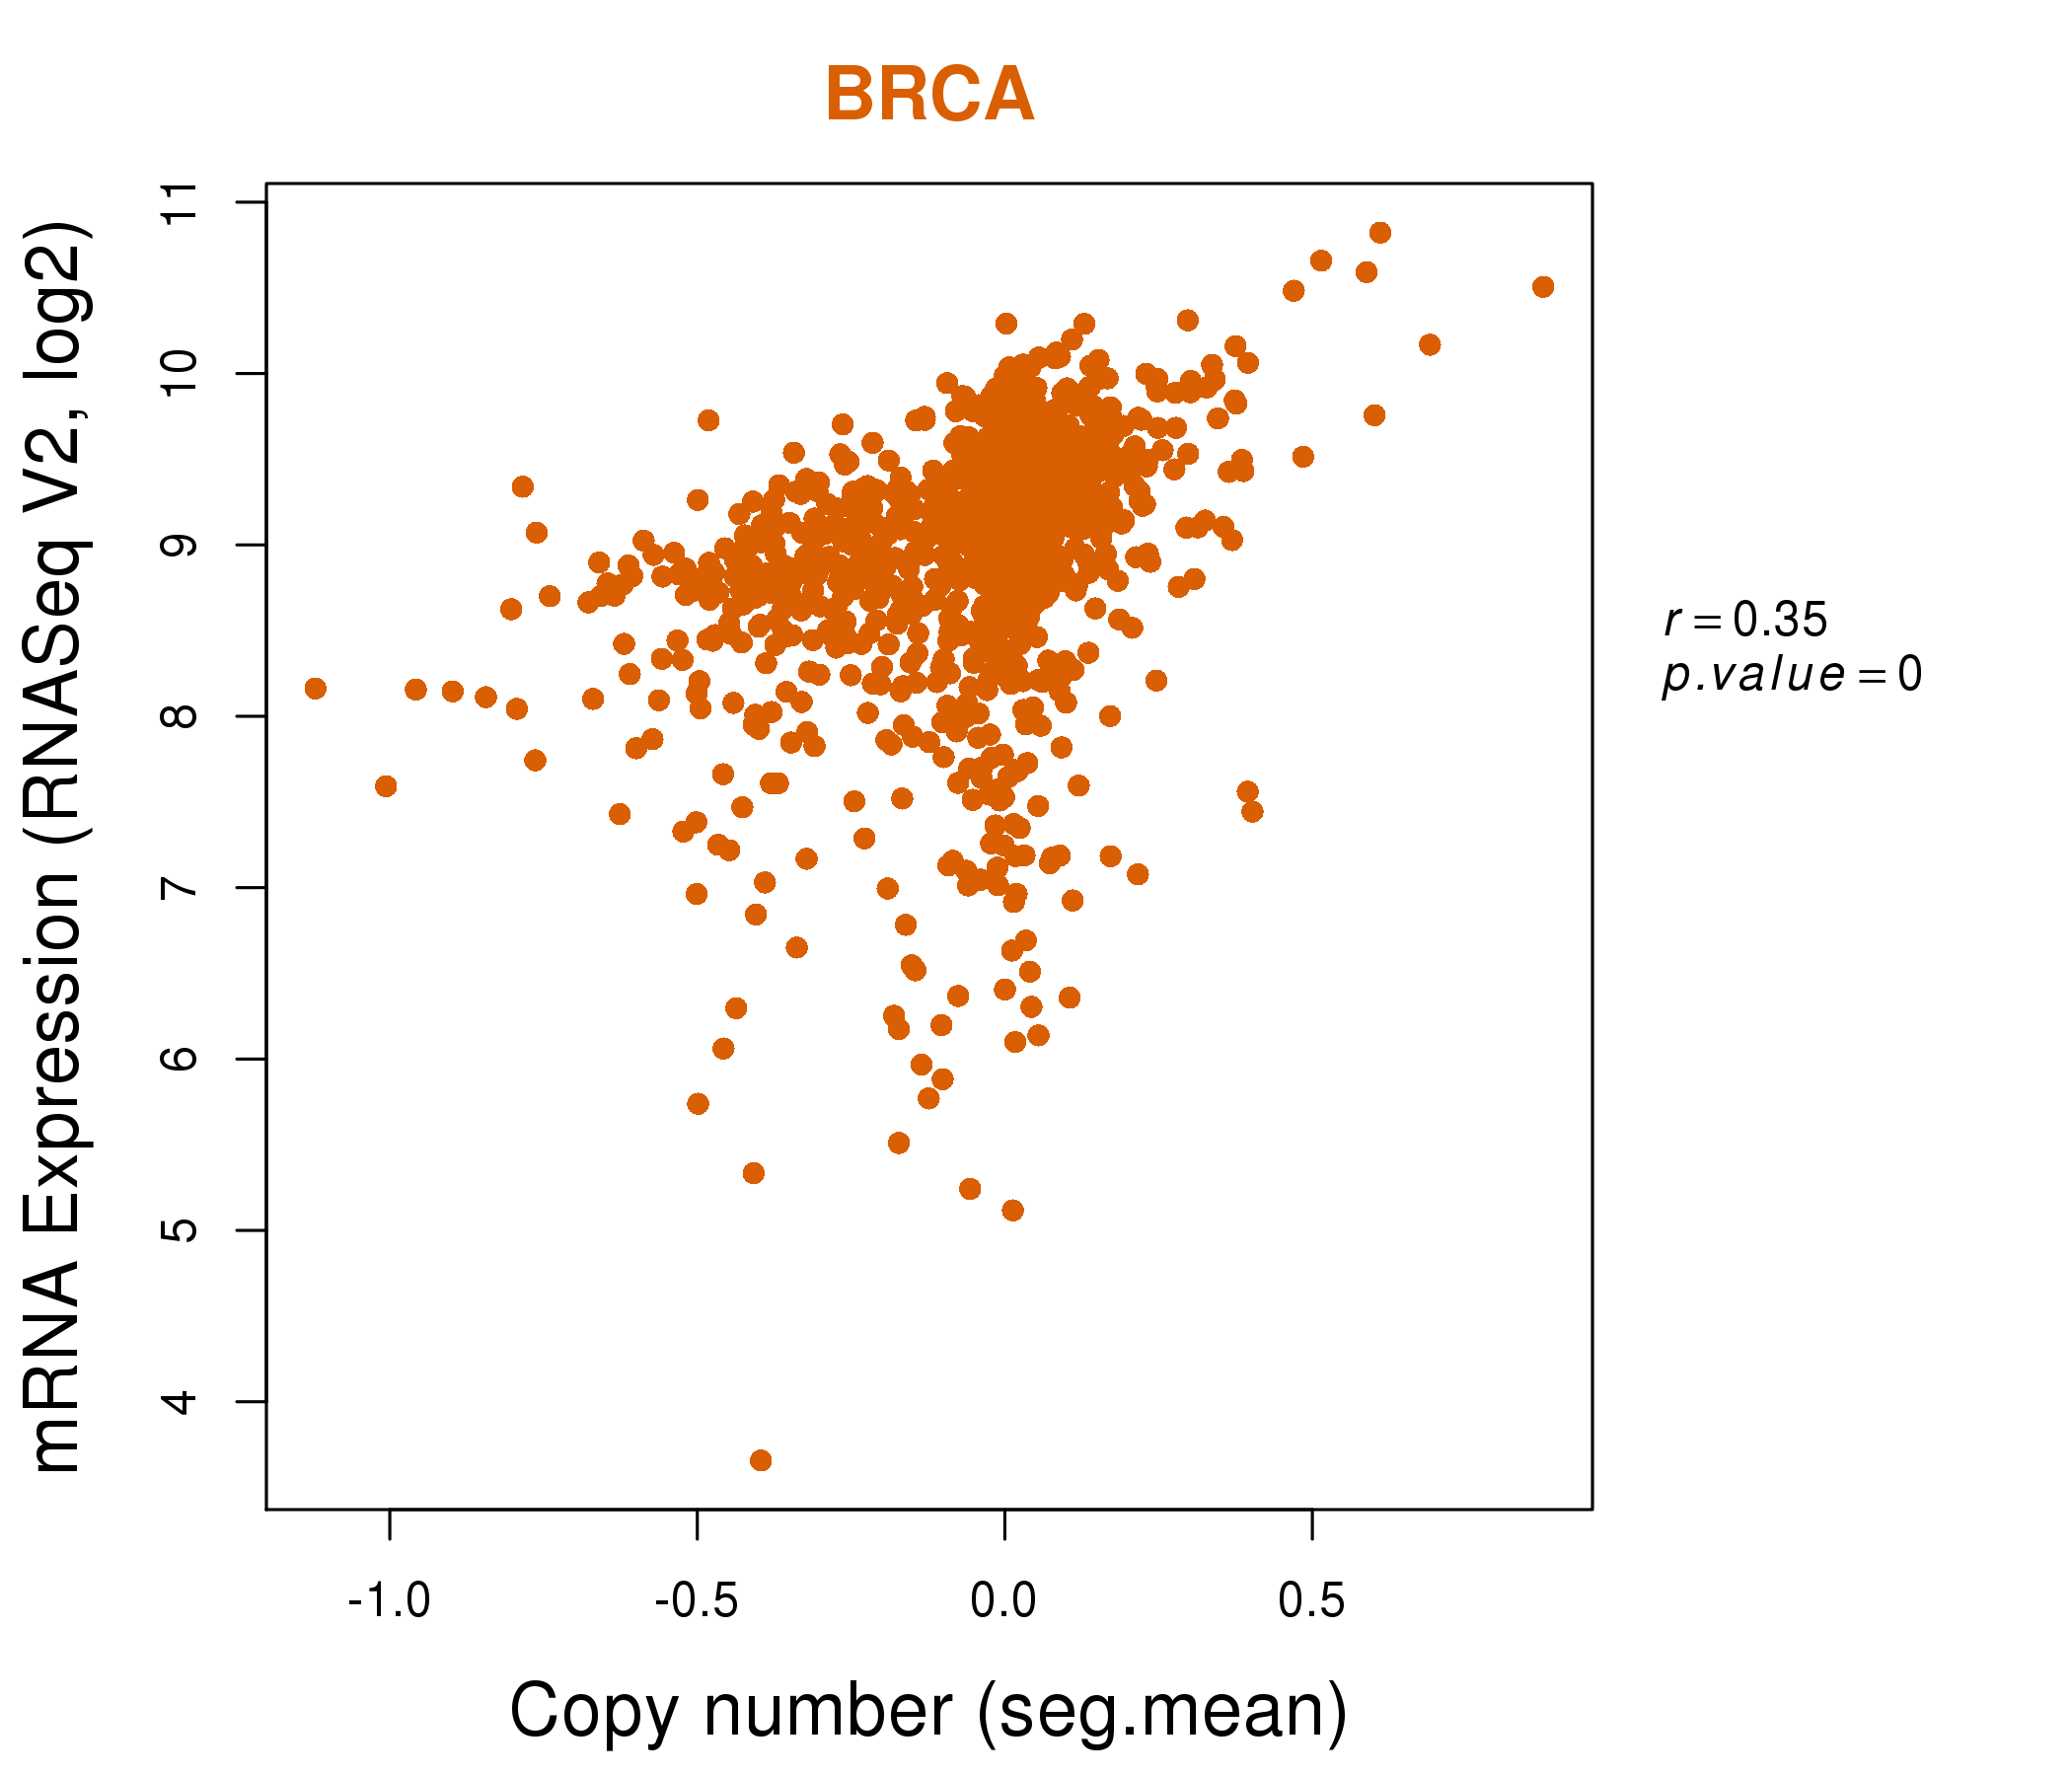
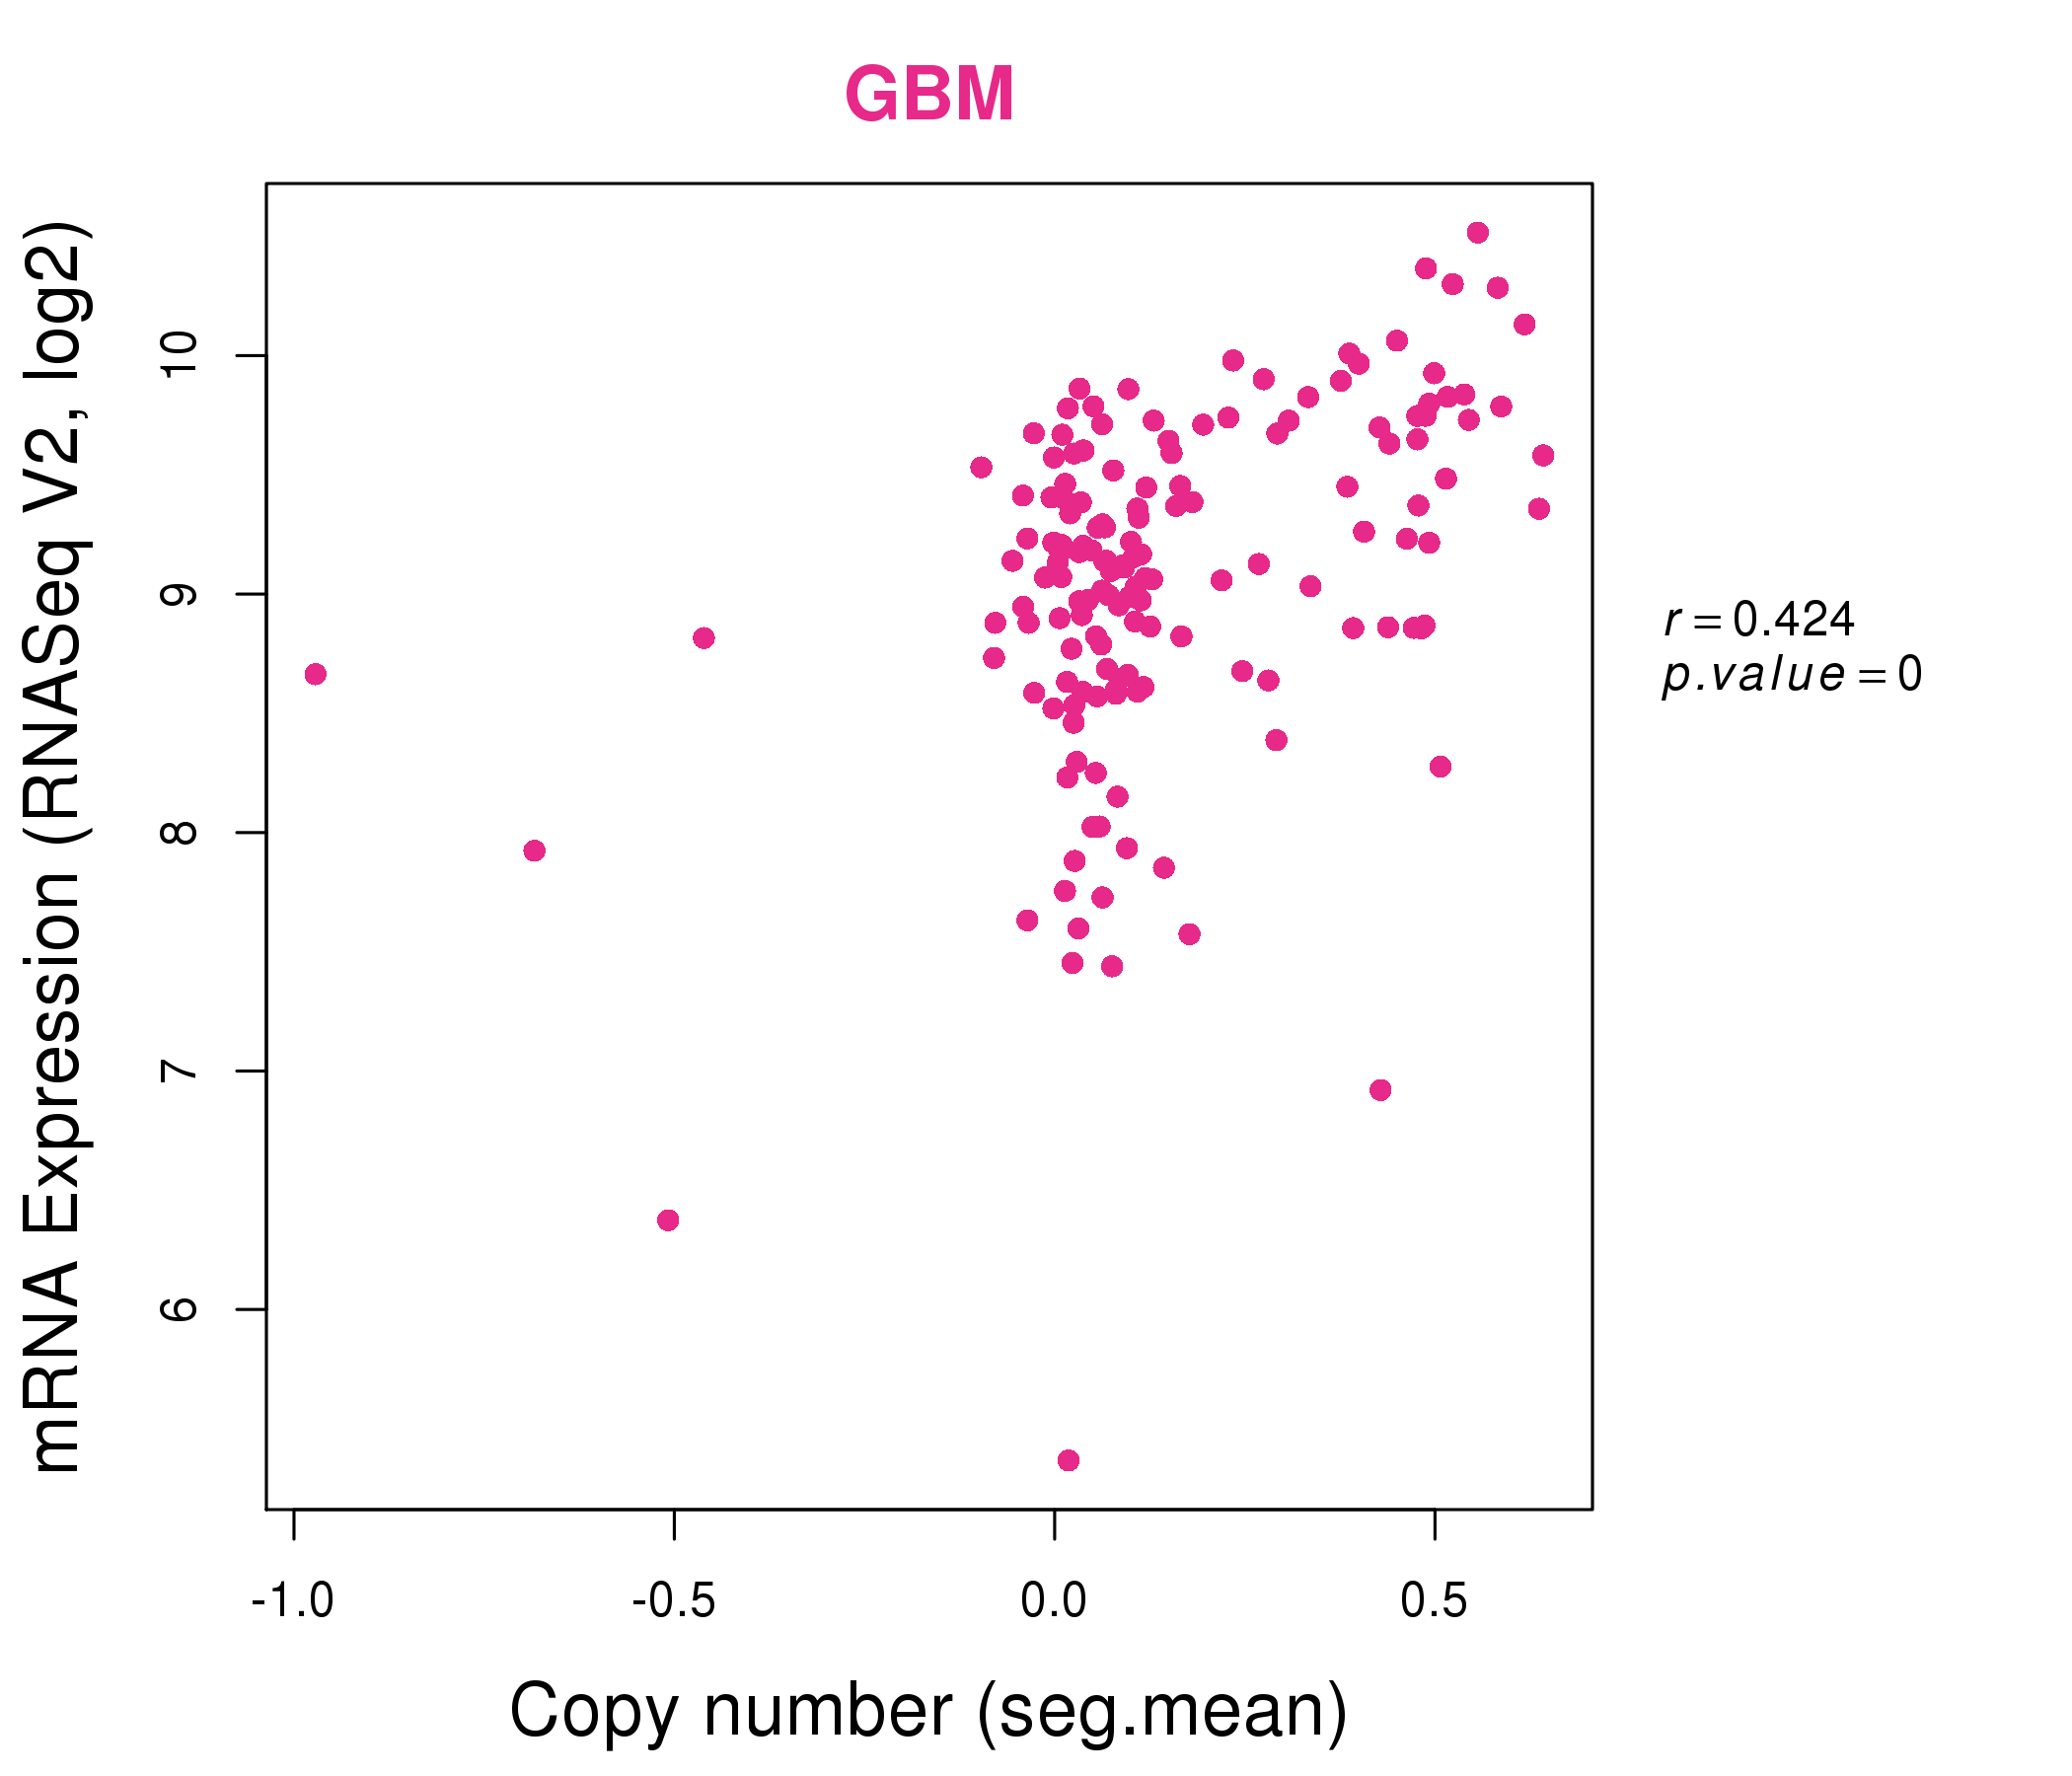
| * This plots show the correlation between CNV and gene expression. |
: Open all plots for all cancer types
 |
|
 |
|
| Top |
| Gene-Gene Network Information |
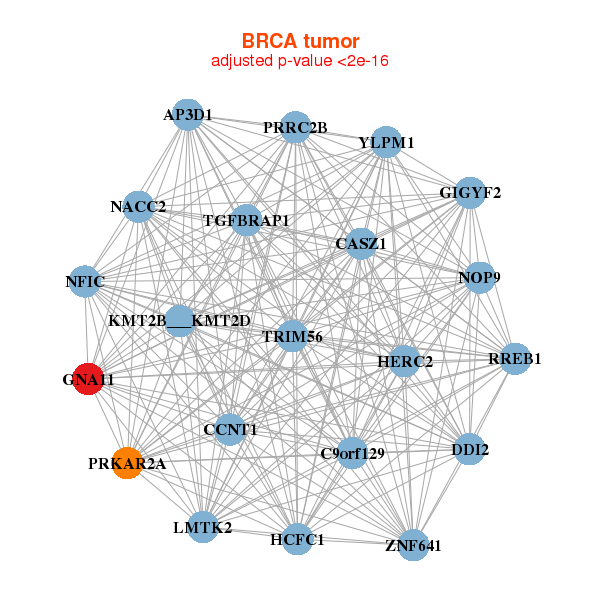
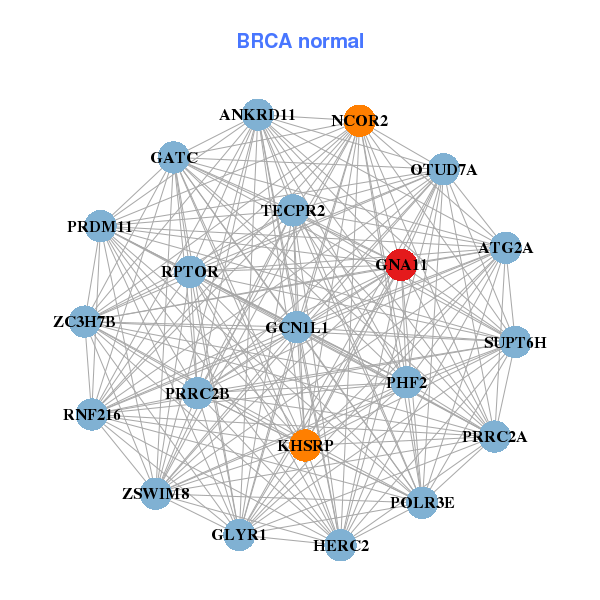
| * Co-Expression network figures were drawn using R package igraph. Only the top 20 genes with the highest correlations were shown. Red circle: input gene, orange circle: cell metabolism gene, sky circle: other gene |
: Open all plots for all cancer types
 |
| ||||
| AP3D1,PRRC2B,NOP9,C9orf129,CASZ1,CCNT1,DDI2, GIGYF2,GNA11,HCFC1,HERC2,LMTK2,KMT2B___KMT2D,NACC2, NFIC,PRKAR2A,RREB1,TGFBRAP1,TRIM56,YLPM1,ZNF641 | ANKRD11,ATG2A,PRRC2A,PRRC2B,GATC,GCN1L1,GLYR1, GNA11,HERC2,KHSRP,ZSWIM8,NCOR2,OTUD7A,PHF2, POLR3E,PRDM11,RNF216,RPTOR,SUPT6H,TECPR2,ZC3H7B | ||||
 |
| ||||
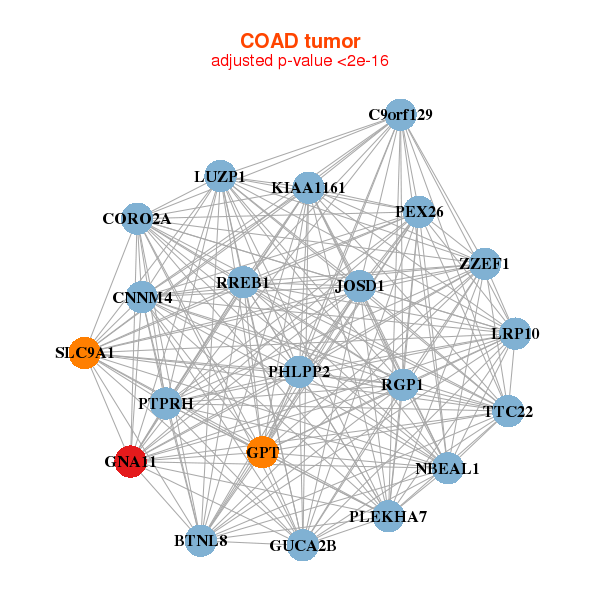
| BTNL8,C9orf129,CNNM4,CORO2A,GNA11,GPT,GUCA2B, JOSD1,KIAA1161,LRP10,LUZP1,NBEAL1,PEX26,PHLPP2, PLEKHA7,PTPRH,RGP1,RREB1,SLC9A1,TTC22,ZZEF1 | AGPAT3,MISP,C1orf106,CARD10,COBL,GNA11,KCNK5, KIAA0247,LASP1,LPIN2,LUZP1,MALL,MAST2,MYO5B, MYO7B,PLEKHG6,SCIN,SLC9A3R1,SORT1,SPINT1,TOM1 |
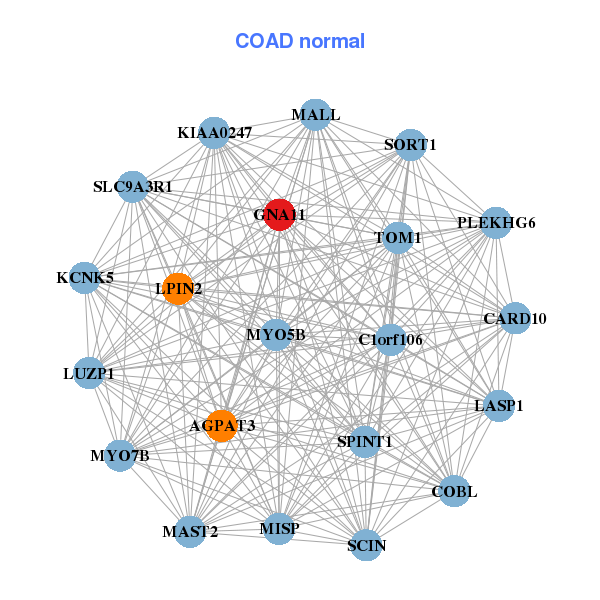
| * Co-Expression network figures were drawn using R package igraph. Only the top 20 genes with the highest correlations were shown. Red circle: input gene, orange circle: cell metabolism gene, sky circle: other gene |
: Open all plots for all cancer types
| Top |
: Open all interacting genes' information including KEGG pathway for all interacting genes from DAVID
| Top |
| Pharmacological Information for GNA11 |
| DB Category | DB Name | DB's ID and Url link |
| Organism-specific databases | PharmGKB | PA28764; -. |
| Organism-specific databases | CTD | 2767; -. |
| * Gene Centered Interaction Network. |
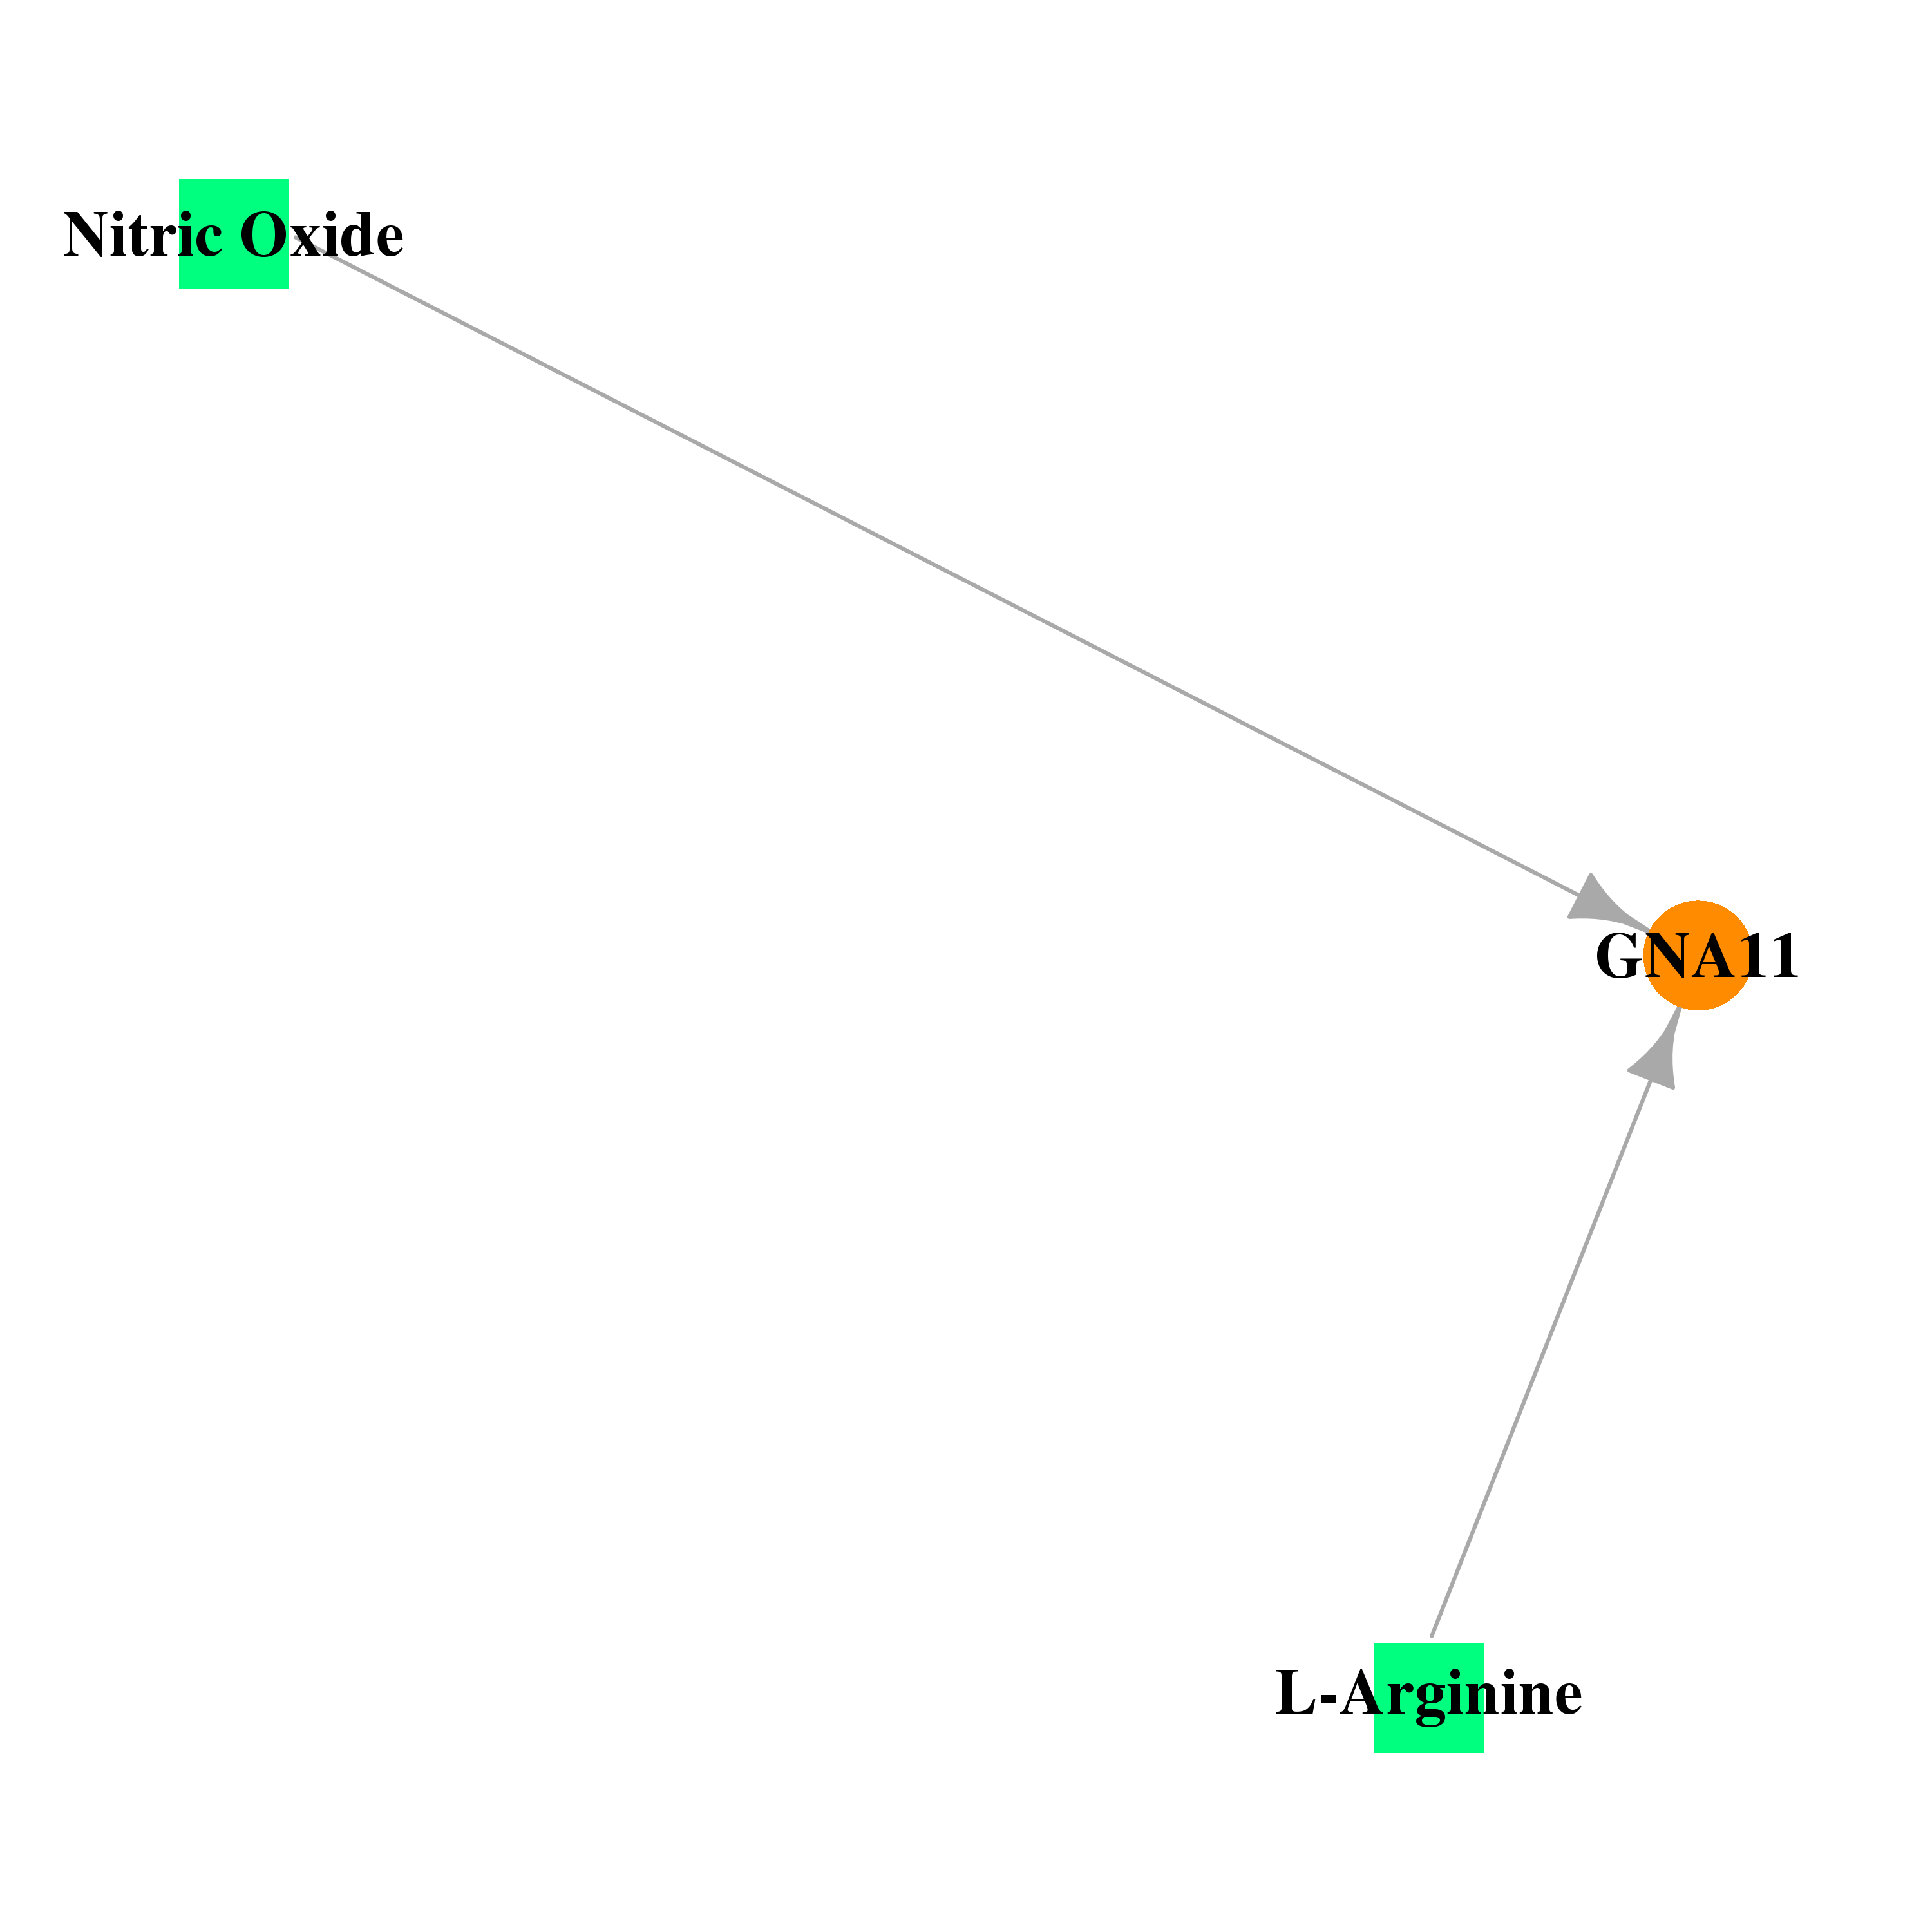 |
| * Drug Centered Interaction Network. |
| DrugBank ID | Target Name | Drug Groups | Generic Name | Drug Centered Network | Drug Structure |
| DB00125 | guanine nucleotide binding protein (G protein), alpha 11 (Gq class) | approved; nutraceutical | L-Arginine |  |  |
| DB00435 | guanine nucleotide binding protein (G protein), alpha 11 (Gq class) | approved | Nitric Oxide | 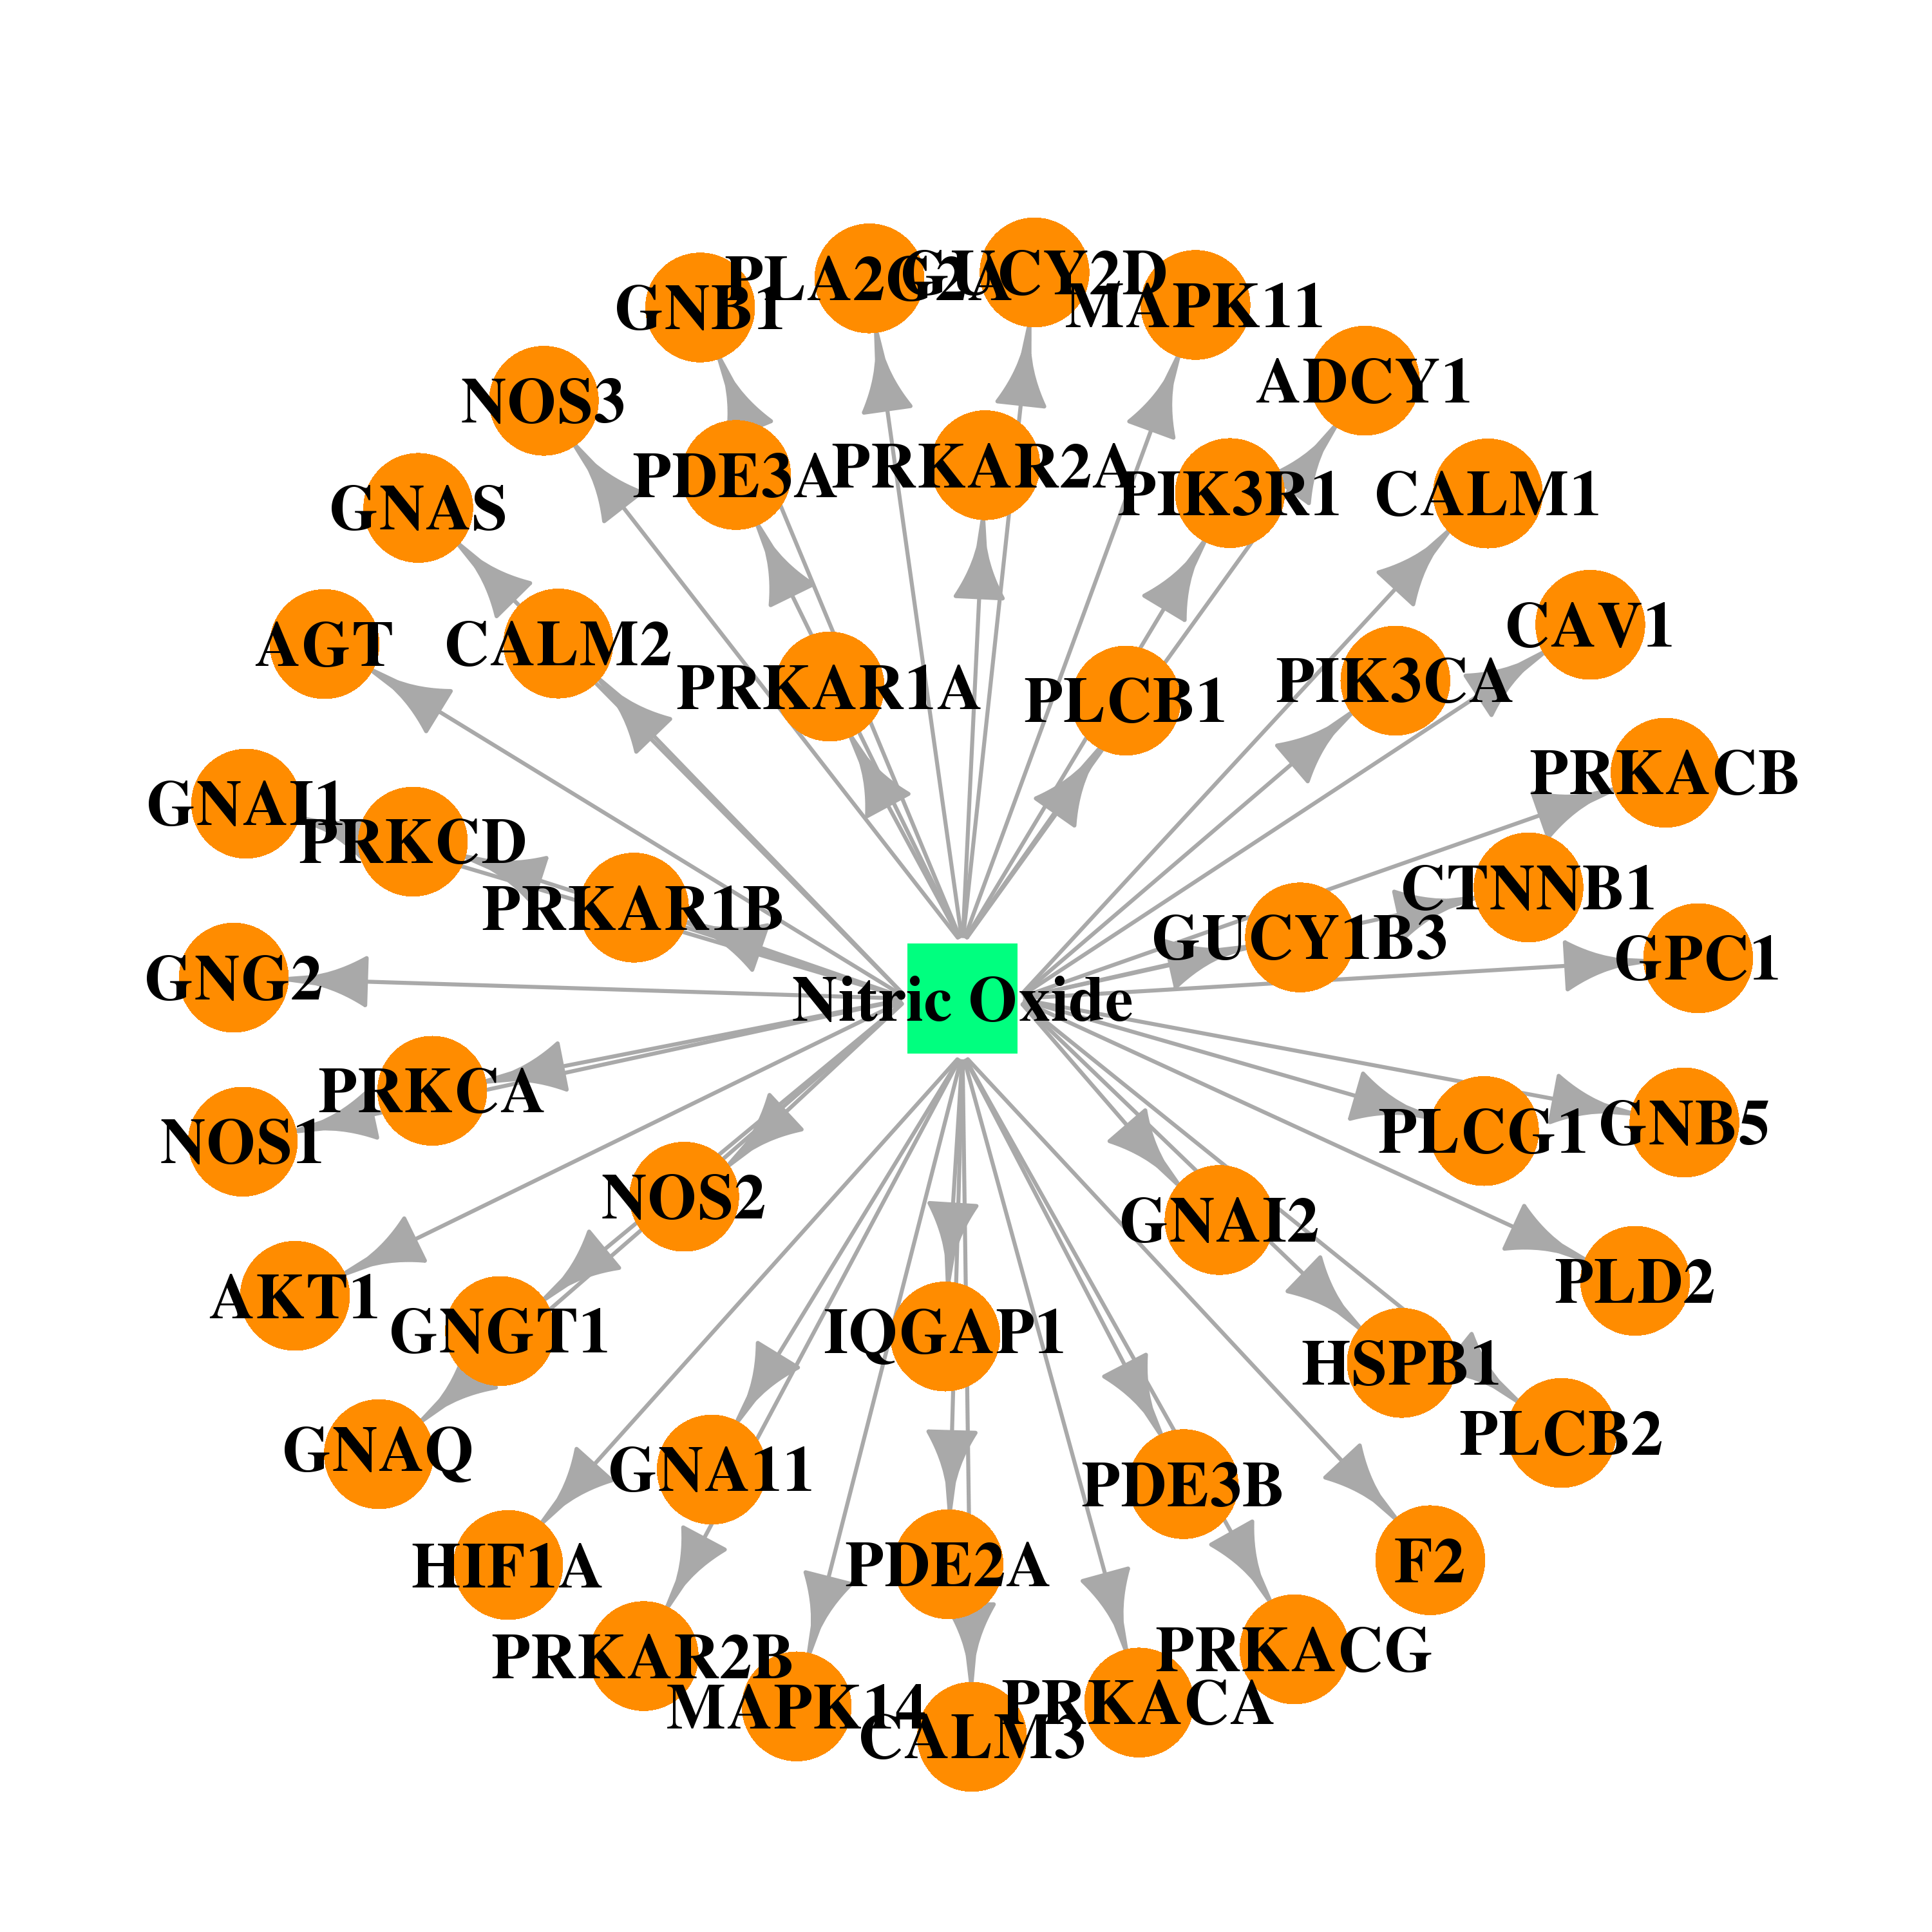 |  |
| Top |
| Cross referenced IDs for GNA11 |
| * We obtained these cross-references from Uniprot database. It covers 150 different DBs, 18 categories. http://www.uniprot.org/help/cross_references_section |
: Open all cross reference information
|
Copyright © 2016-Present - The Univsersity of Texas Health Science Center at Houston @ |