|
||||||||||||||||||||
| |
| Phenotypic Information (metabolism pathway, cancer, disease, phenome) |
| |
| |
| Gene-Gene Network Information: Co-Expression Network, Interacting Genes & KEGG |
| |
|


| Gene Summary for GNA15 |
| Basic gene info. | Gene symbol | GNA15 |
| Gene name | guanine nucleotide binding protein (G protein), alpha 15 (Gq class) | |
| Synonyms | GNA16 | |
| Cytomap | UCSC genome browser: 19p13.3 | |
| Genomic location | chr19 :3136190-3163766 | |
| Type of gene | protein-coding | |
| RefGenes | NM_002068.3, | |
| Ensembl id | ENSG00000060558 | |
| Description | G-protein subunit alpha-15G-protein subunit alpha-16epididymis tissue protein Li 17Eg alpha-15g alpha-16guanine nucleotide-binding protein subunit alpha-15guanine nucleotide-binding protein subunit alpha-16 | |
| Modification date | 20141207 | |
| dbXrefs | MIM : 139314 | |
| HGNC : HGNC | ||
| Ensembl : ENSG00000060558 | ||
| HPRD : 00760 | ||
| Vega : OTTHUMG00000180637 | ||
| Protein | UniProt: P30679 go to UniProt's Cross Reference DB Table | |
| Expression | CleanEX: HS_GNA15 | |
| BioGPS: 2769 | ||
| Gene Expression Atlas: ENSG00000060558 | ||
| The Human Protein Atlas: ENSG00000060558 | ||
| Pathway | NCI Pathway Interaction Database: GNA15 | |
| KEGG: GNA15 | ||
| REACTOME: GNA15 | ||
| ConsensusPathDB | ||
| Pathway Commons: GNA15 | ||
| Metabolism | MetaCyc: GNA15 | |
| HUMANCyc: GNA15 | ||
| Regulation | Ensembl's Regulation: ENSG00000060558 | |
| miRBase: chr19 :3,136,190-3,163,766 | ||
| TargetScan: NM_002068 | ||
| cisRED: ENSG00000060558 | ||
| Context | iHOP: GNA15 | |
| cancer metabolism search in PubMed: GNA15 | ||
| UCL Cancer Institute: GNA15 | ||
| Assigned class in ccmGDB | B - This gene belongs to cancer gene. | |
| Top |
| Phenotypic Information for GNA15(metabolism pathway, cancer, disease, phenome) |
| Cancer | CGAP: GNA15 |
| Familial Cancer Database: GNA15 | |
| * This gene is included in those cancer gene databases. |
|
|
|
|
|
| . | ||||||||||||||
Oncogene 1 | Significant driver gene in | |||||||||||||||||||
| cf) number; DB name 1 Oncogene; http://nar.oxfordjournals.org/content/35/suppl_1/D721.long, 2 Tumor Suppressor gene; https://bioinfo.uth.edu/TSGene/, 3 Cancer Gene Census; http://www.nature.com/nrc/journal/v4/n3/abs/nrc1299.html, 4 CancerGenes; http://nar.oxfordjournals.org/content/35/suppl_1/D721.long, 5 Network of Cancer Gene; http://ncg.kcl.ac.uk/index.php, 1Therapeutic Vulnerabilities in Cancer; http://cbio.mskcc.org/cancergenomics/statius/ |
| REACTOME_INTEGRATION_OF_ENERGY_METABOLISM | |
| OMIM | 139314; gene. |
| Orphanet | |
| Disease | KEGG Disease: GNA15 |
| MedGen: GNA15 (Human Medical Genetics with Condition) | |
| ClinVar: GNA15 | |
| Phenotype | MGI: GNA15 (International Mouse Phenotyping Consortium) |
| PhenomicDB: GNA15 | |
| Mutations for GNA15 |
| * Under tables are showing count per each tissue to give us broad intuition about tissue specific mutation patterns.You can go to the detailed page for each mutation database's web site. |
| There's no structural variation information in COSMIC data for this gene. |
| * From mRNA Sanger sequences, Chitars2.0 arranged chimeric transcripts. This table shows GNA15 related fusion information. |
| ID | Head Gene | Tail Gene | Accession | Gene_a | qStart_a | qEnd_a | Chromosome_a | tStart_a | tEnd_a | Gene_a | qStart_a | qEnd_a | Chromosome_a | tStart_a | tEnd_a |
| AY839731 | MLL | 1 | 168 | 11 | 118357884 | 118358051 | GNA15 | 167 | 459 | 19 | 3157358 | 3157650 | |
| BG272034 | GNA15 | 64 | 147 | 19 | 3163662 | 3163745 | FKBP15 | 143 | 216 | 9 | 116025106 | 116025179 | |
| Top |
| There's no copy number variation information in COSMIC data for this gene. |
| Top |
|
 |
| Top |
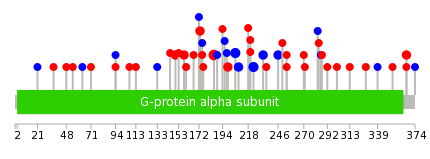
| Stat. for Non-Synonymous SNVs (# total SNVs=30) | (# total SNVs=12) |
 |  |
(# total SNVs=0) | (# total SNVs=0) |
| Top |
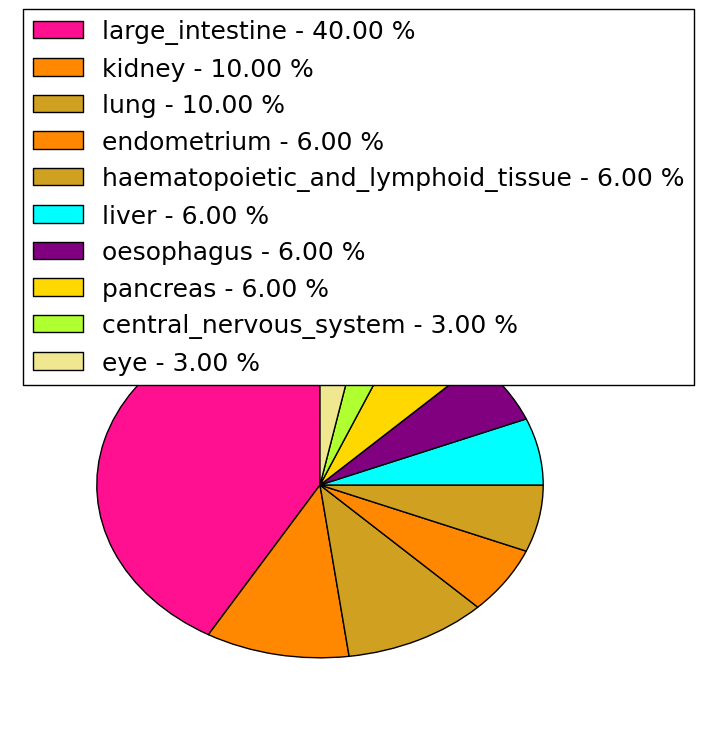
| * When you move the cursor on each content, you can see more deailed mutation information on the Tooltip. Those are primary_site,primary_histology,mutation(aa),pubmedID. |
| GRCh37 position | Mutation(aa) | Unique sampleID count |
| chr19:3151776-3151776 | p.R186H | 4 |
| chr19:3155875-3155875 | p.F223F | 3 |
| chr19:3155824-3155824 | p.I206I | 3 |
| chr19:3162988-3162988 | p.R366C | 2 |
| chr19:3150246-3150246 | p.R150C | 2 |
| chr19:3155902-3155902 | p.L232L | 2 |
| chr19:3150270-3150270 | p.D158N | 2 |
| chr19:3155944-3155944 | p.N246N | 2 |
| chr19:3151814-3151814 | p.V199M | 2 |
| chr19:3148725-3148725 | p.I94I | 2 |
| Top |
|
 |
| Point Mutation/ Tissue ID | 1 | 2 | 3 | 4 | 5 | 6 | 7 | 8 | 9 | 10 | 11 | 12 | 13 | 14 | 15 | 16 | 17 | 18 | 19 | 20 |
| # sample | 1 | 1 | 7 | 1 | 3 | 1 | 1 | 1 | 2 | 9 | 3 | 1 | 4 | |||||||
| # mutation | 1 | 1 | 7 | 1 | 3 | 1 | 1 | 1 | 2 | 10 | 4 | 1 | 5 | |||||||
| nonsynonymous SNV | 1 | 5 | 1 | 2 | 1 | 1 | 1 | 2 | 4 | 3 | 1 | 2 | ||||||||
| synonymous SNV | 1 | 2 | 1 | 6 | 1 | 3 |
| cf) Tissue ID; Tissue type (1; BLCA[Bladder Urothelial Carcinoma], 2; BRCA[Breast invasive carcinoma], 3; CESC[Cervical squamous cell carcinoma and endocervical adenocarcinoma], 4; COAD[Colon adenocarcinoma], 5; GBM[Glioblastoma multiforme], 6; Glioma Low Grade, 7; HNSC[Head and Neck squamous cell carcinoma], 8; KICH[Kidney Chromophobe], 9; KIRC[Kidney renal clear cell carcinoma], 10; KIRP[Kidney renal papillary cell carcinoma], 11; LAML[Acute Myeloid Leukemia], 12; LUAD[Lung adenocarcinoma], 13; LUSC[Lung squamous cell carcinoma], 14; OV[Ovarian serous cystadenocarcinoma ], 15; PAAD[Pancreatic adenocarcinoma], 16; PRAD[Prostate adenocarcinoma], 17; SKCM[Skin Cutaneous Melanoma], 18:STAD[Stomach adenocarcinoma], 19:THCA[Thyroid carcinoma], 20:UCEC[Uterine Corpus Endometrial Carcinoma]) |
| Top |
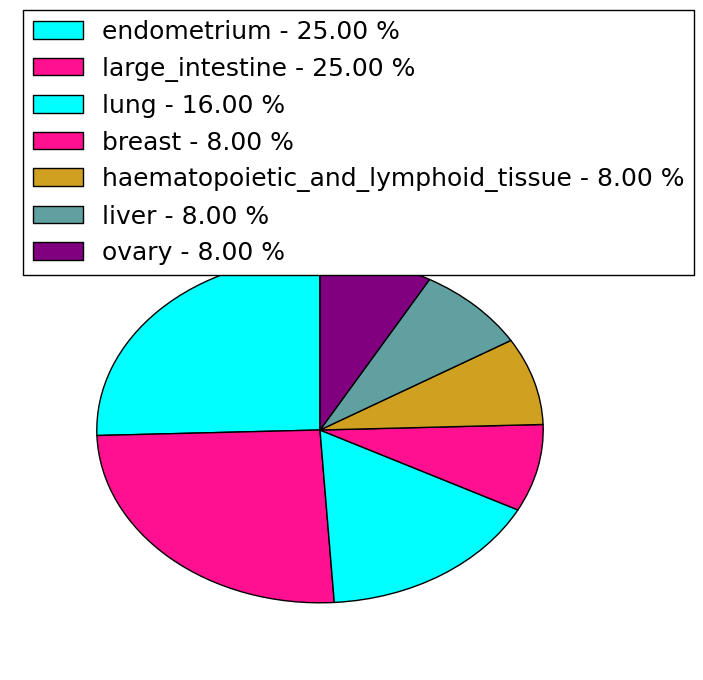
| * We represented just top 10 SNVs. When you move the cursor on each content, you can see more deailed mutation information on the Tooltip. Those are primary_site, primary_histology, mutation(aa), pubmedID. |
| Genomic Position | Mutation(aa) | Unique sampleID count |
| chr19:3151776 | p.R186H | 5 |
| chr19:3155824 | p.I206I | 3 |
| chr19:3155833 | p.I64M | 2 |
| chr19:3148635 | p.V209V | 2 |
| chr19:3150270 | p.E153K | 1 |
| chr19:3163012 | p.N246N | 1 |
| chr19:3150277 | p.D158N | 1 |
| chr19:3155864 | p.G259W | 1 |
| chr19:3151719 | p.A160V | 1 |
| chr19:3155875 | p.T270I | 1 |
| * Copy number data were extracted from TCGA using R package TCGA-Assembler. The URLs of all public data files on TCGA DCC data server were gathered on Jan-05-2015. Function ProcessCNAData in TCGA-Assembler package was used to obtain gene-level copy number value which is calculated as the average copy number of the genomic region of a gene. |
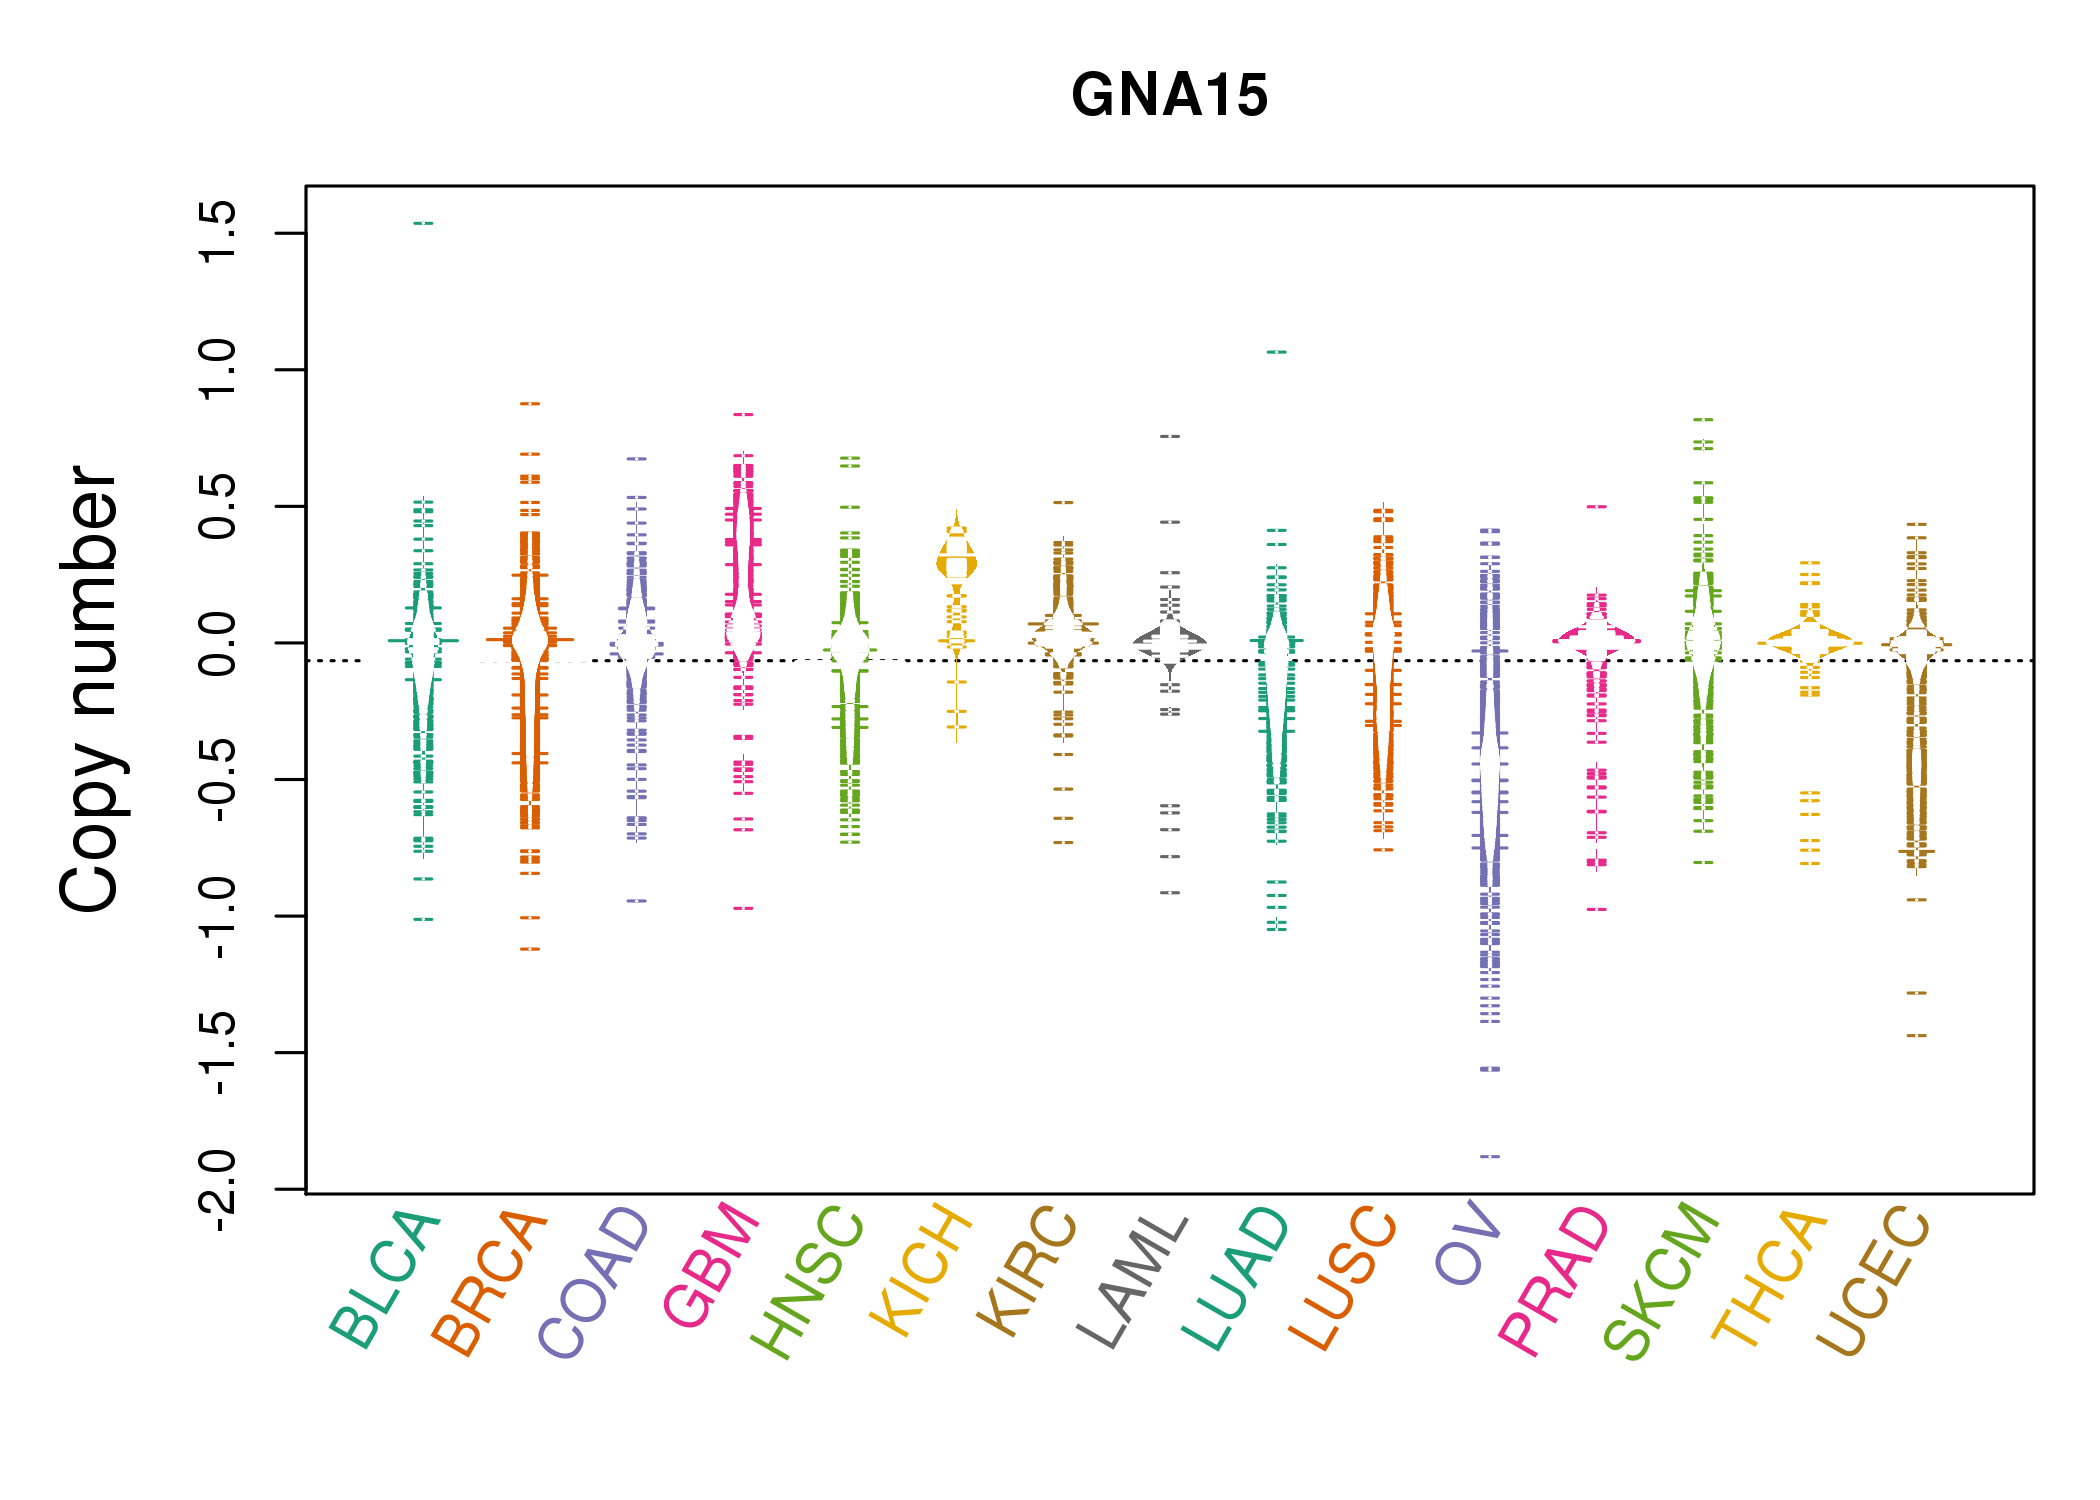 |
| cf) Tissue ID[Tissue type]: BLCA[Bladder Urothelial Carcinoma], BRCA[Breast invasive carcinoma], CESC[Cervical squamous cell carcinoma and endocervical adenocarcinoma], COAD[Colon adenocarcinoma], GBM[Glioblastoma multiforme], Glioma Low Grade, HNSC[Head and Neck squamous cell carcinoma], KICH[Kidney Chromophobe], KIRC[Kidney renal clear cell carcinoma], KIRP[Kidney renal papillary cell carcinoma], LAML[Acute Myeloid Leukemia], LUAD[Lung adenocarcinoma], LUSC[Lung squamous cell carcinoma], OV[Ovarian serous cystadenocarcinoma ], PAAD[Pancreatic adenocarcinoma], PRAD[Prostate adenocarcinoma], SKCM[Skin Cutaneous Melanoma], STAD[Stomach adenocarcinoma], THCA[Thyroid carcinoma], UCEC[Uterine Corpus Endometrial Carcinoma] |
| Top |
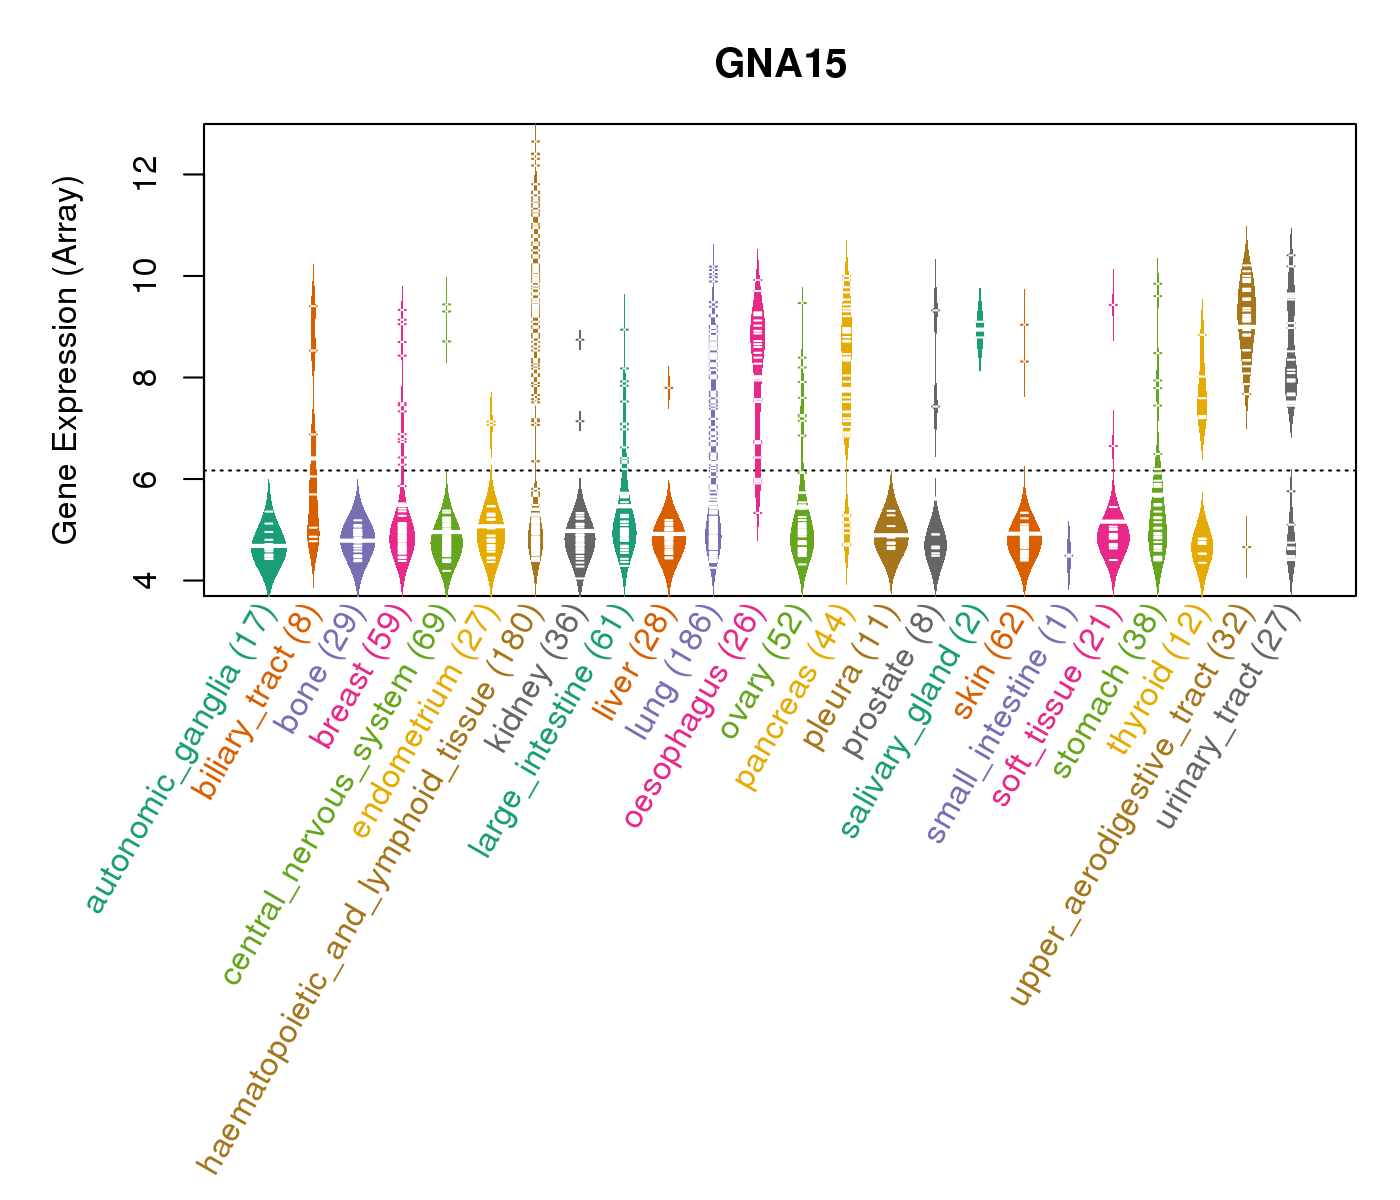
| Gene Expression for GNA15 |
| * CCLE gene expression data were extracted from CCLE_Expression_Entrez_2012-10-18.res: Gene-centric RMA-normalized mRNA expression data. |
 |
| * Normalized gene expression data of RNASeqV2 was extracted from TCGA using R package TCGA-Assembler. The URLs of all public data files on TCGA DCC data server were gathered at Jan-05-2015. Only eight cancer types have enough normal control samples for differential expression analysis. (t test, adjusted p<0.05 (using Benjamini-Hochberg FDR)) |
 |
| Top |
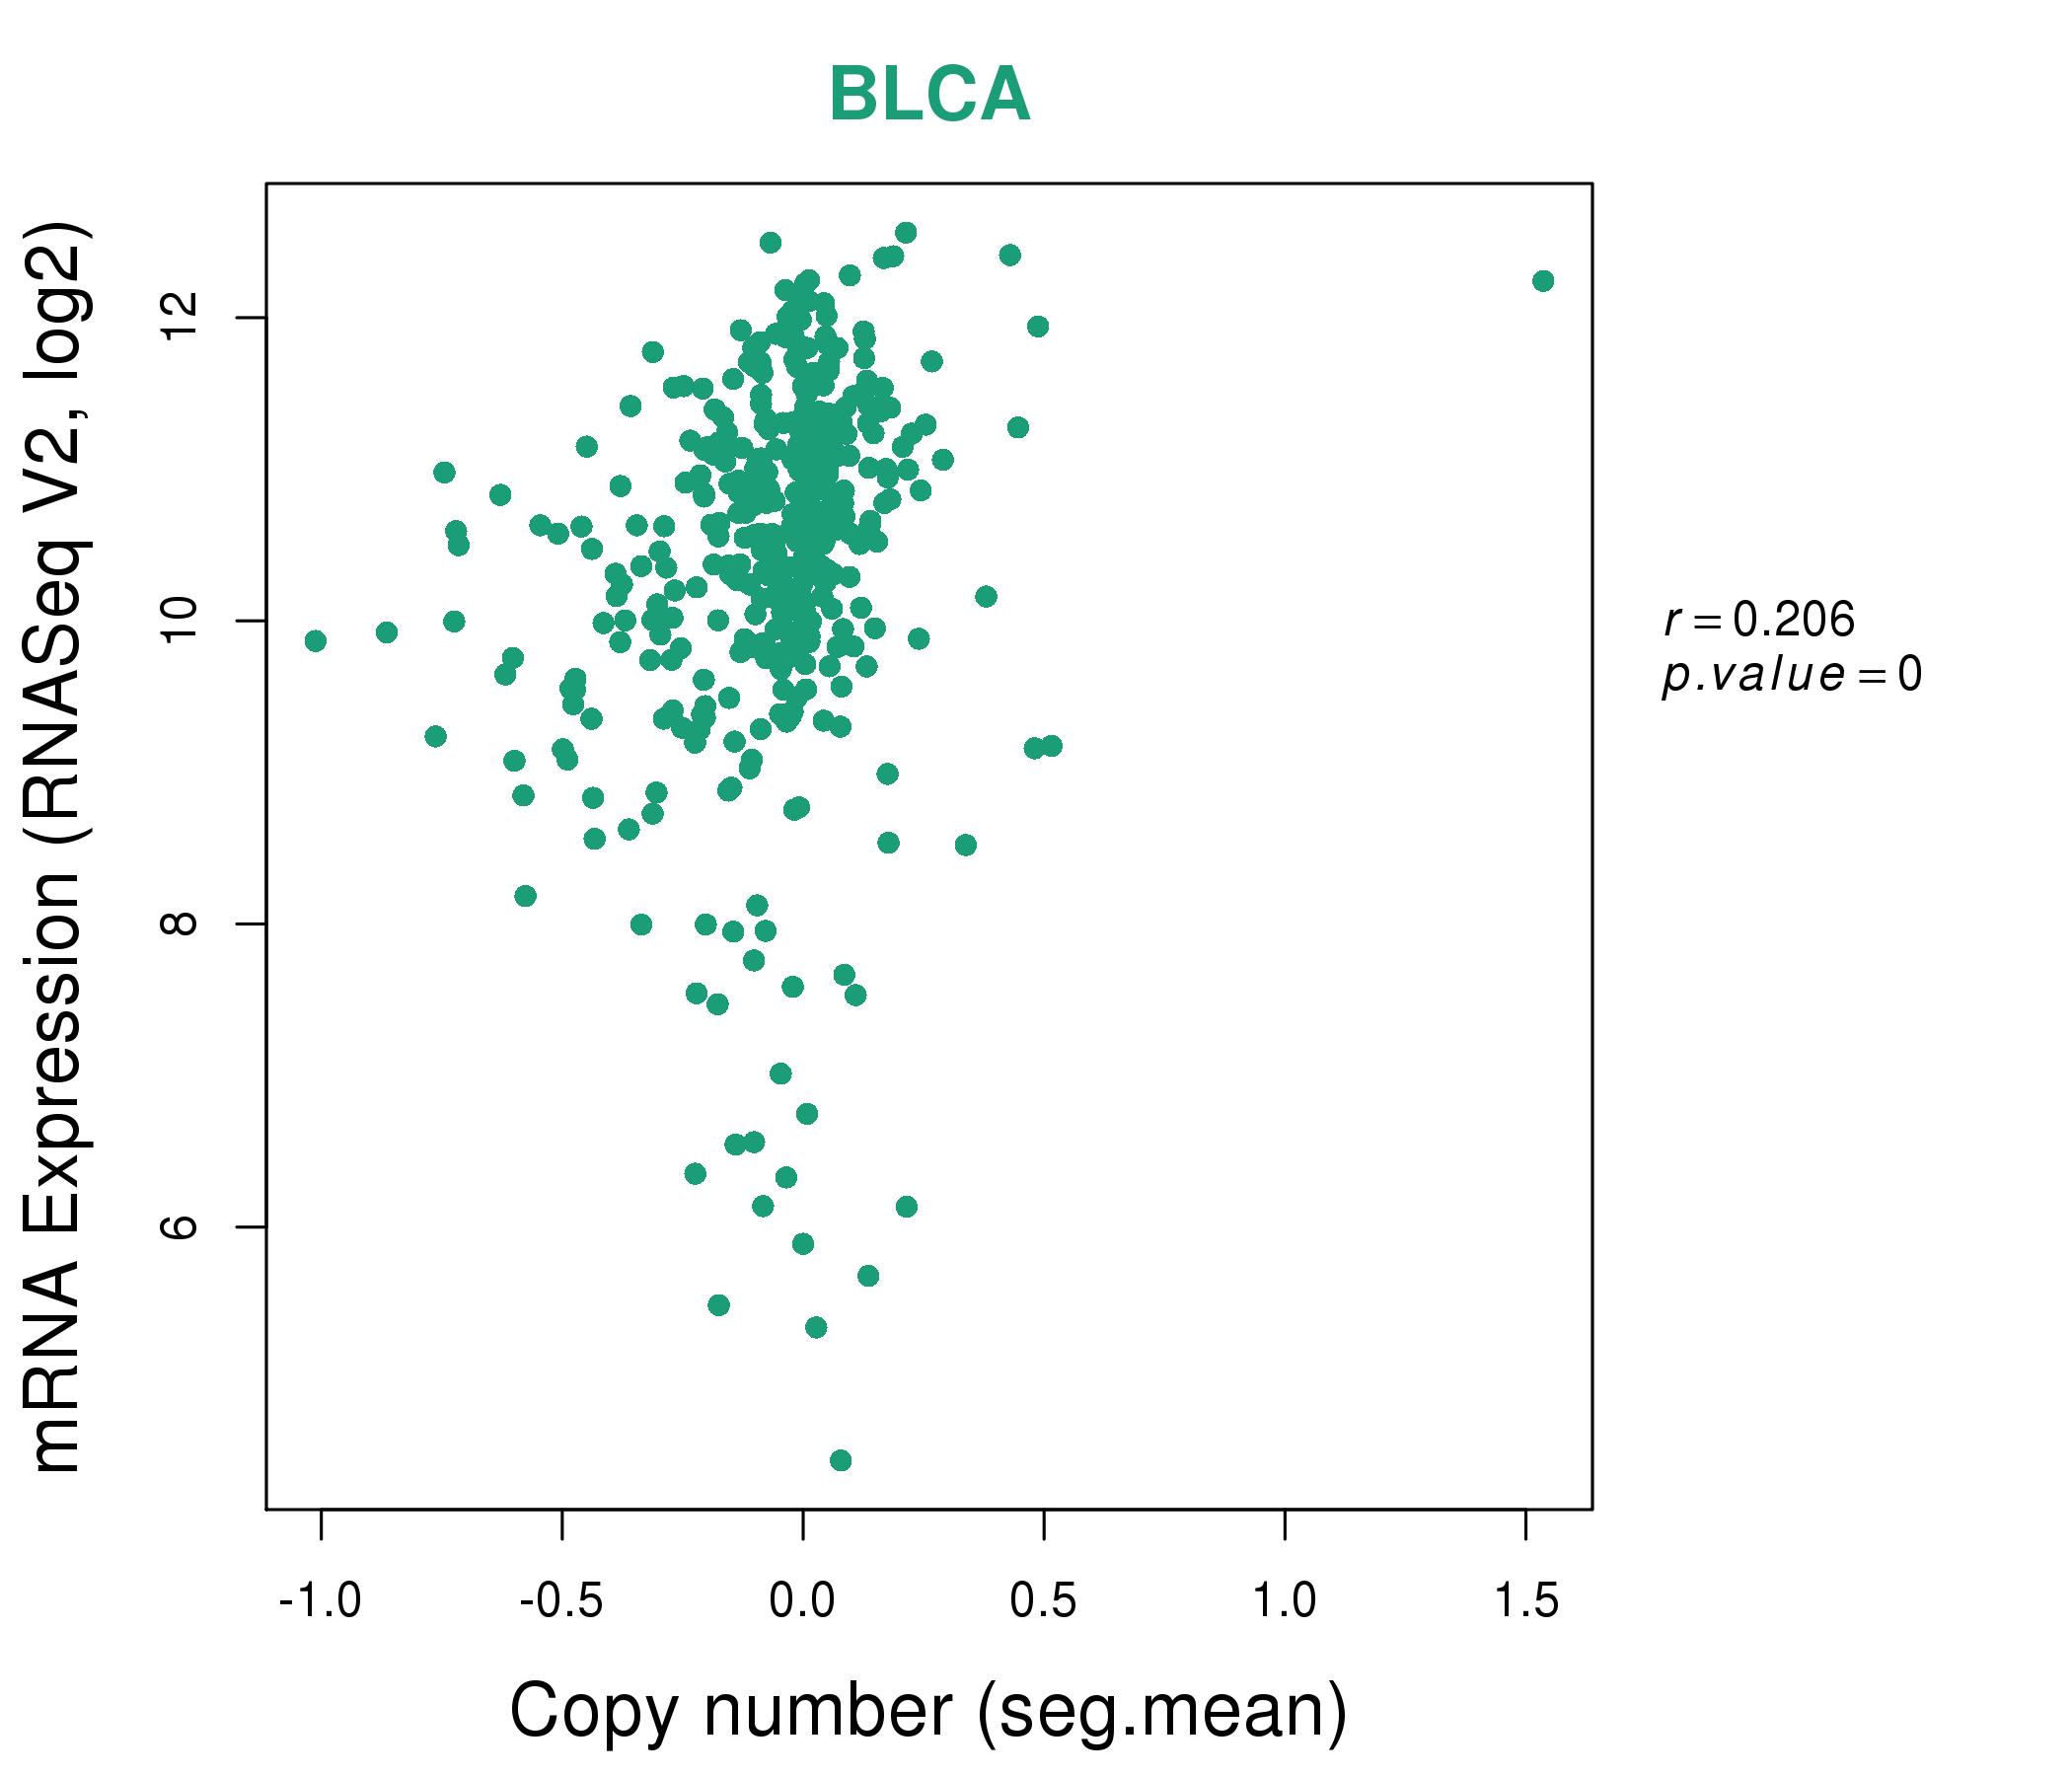
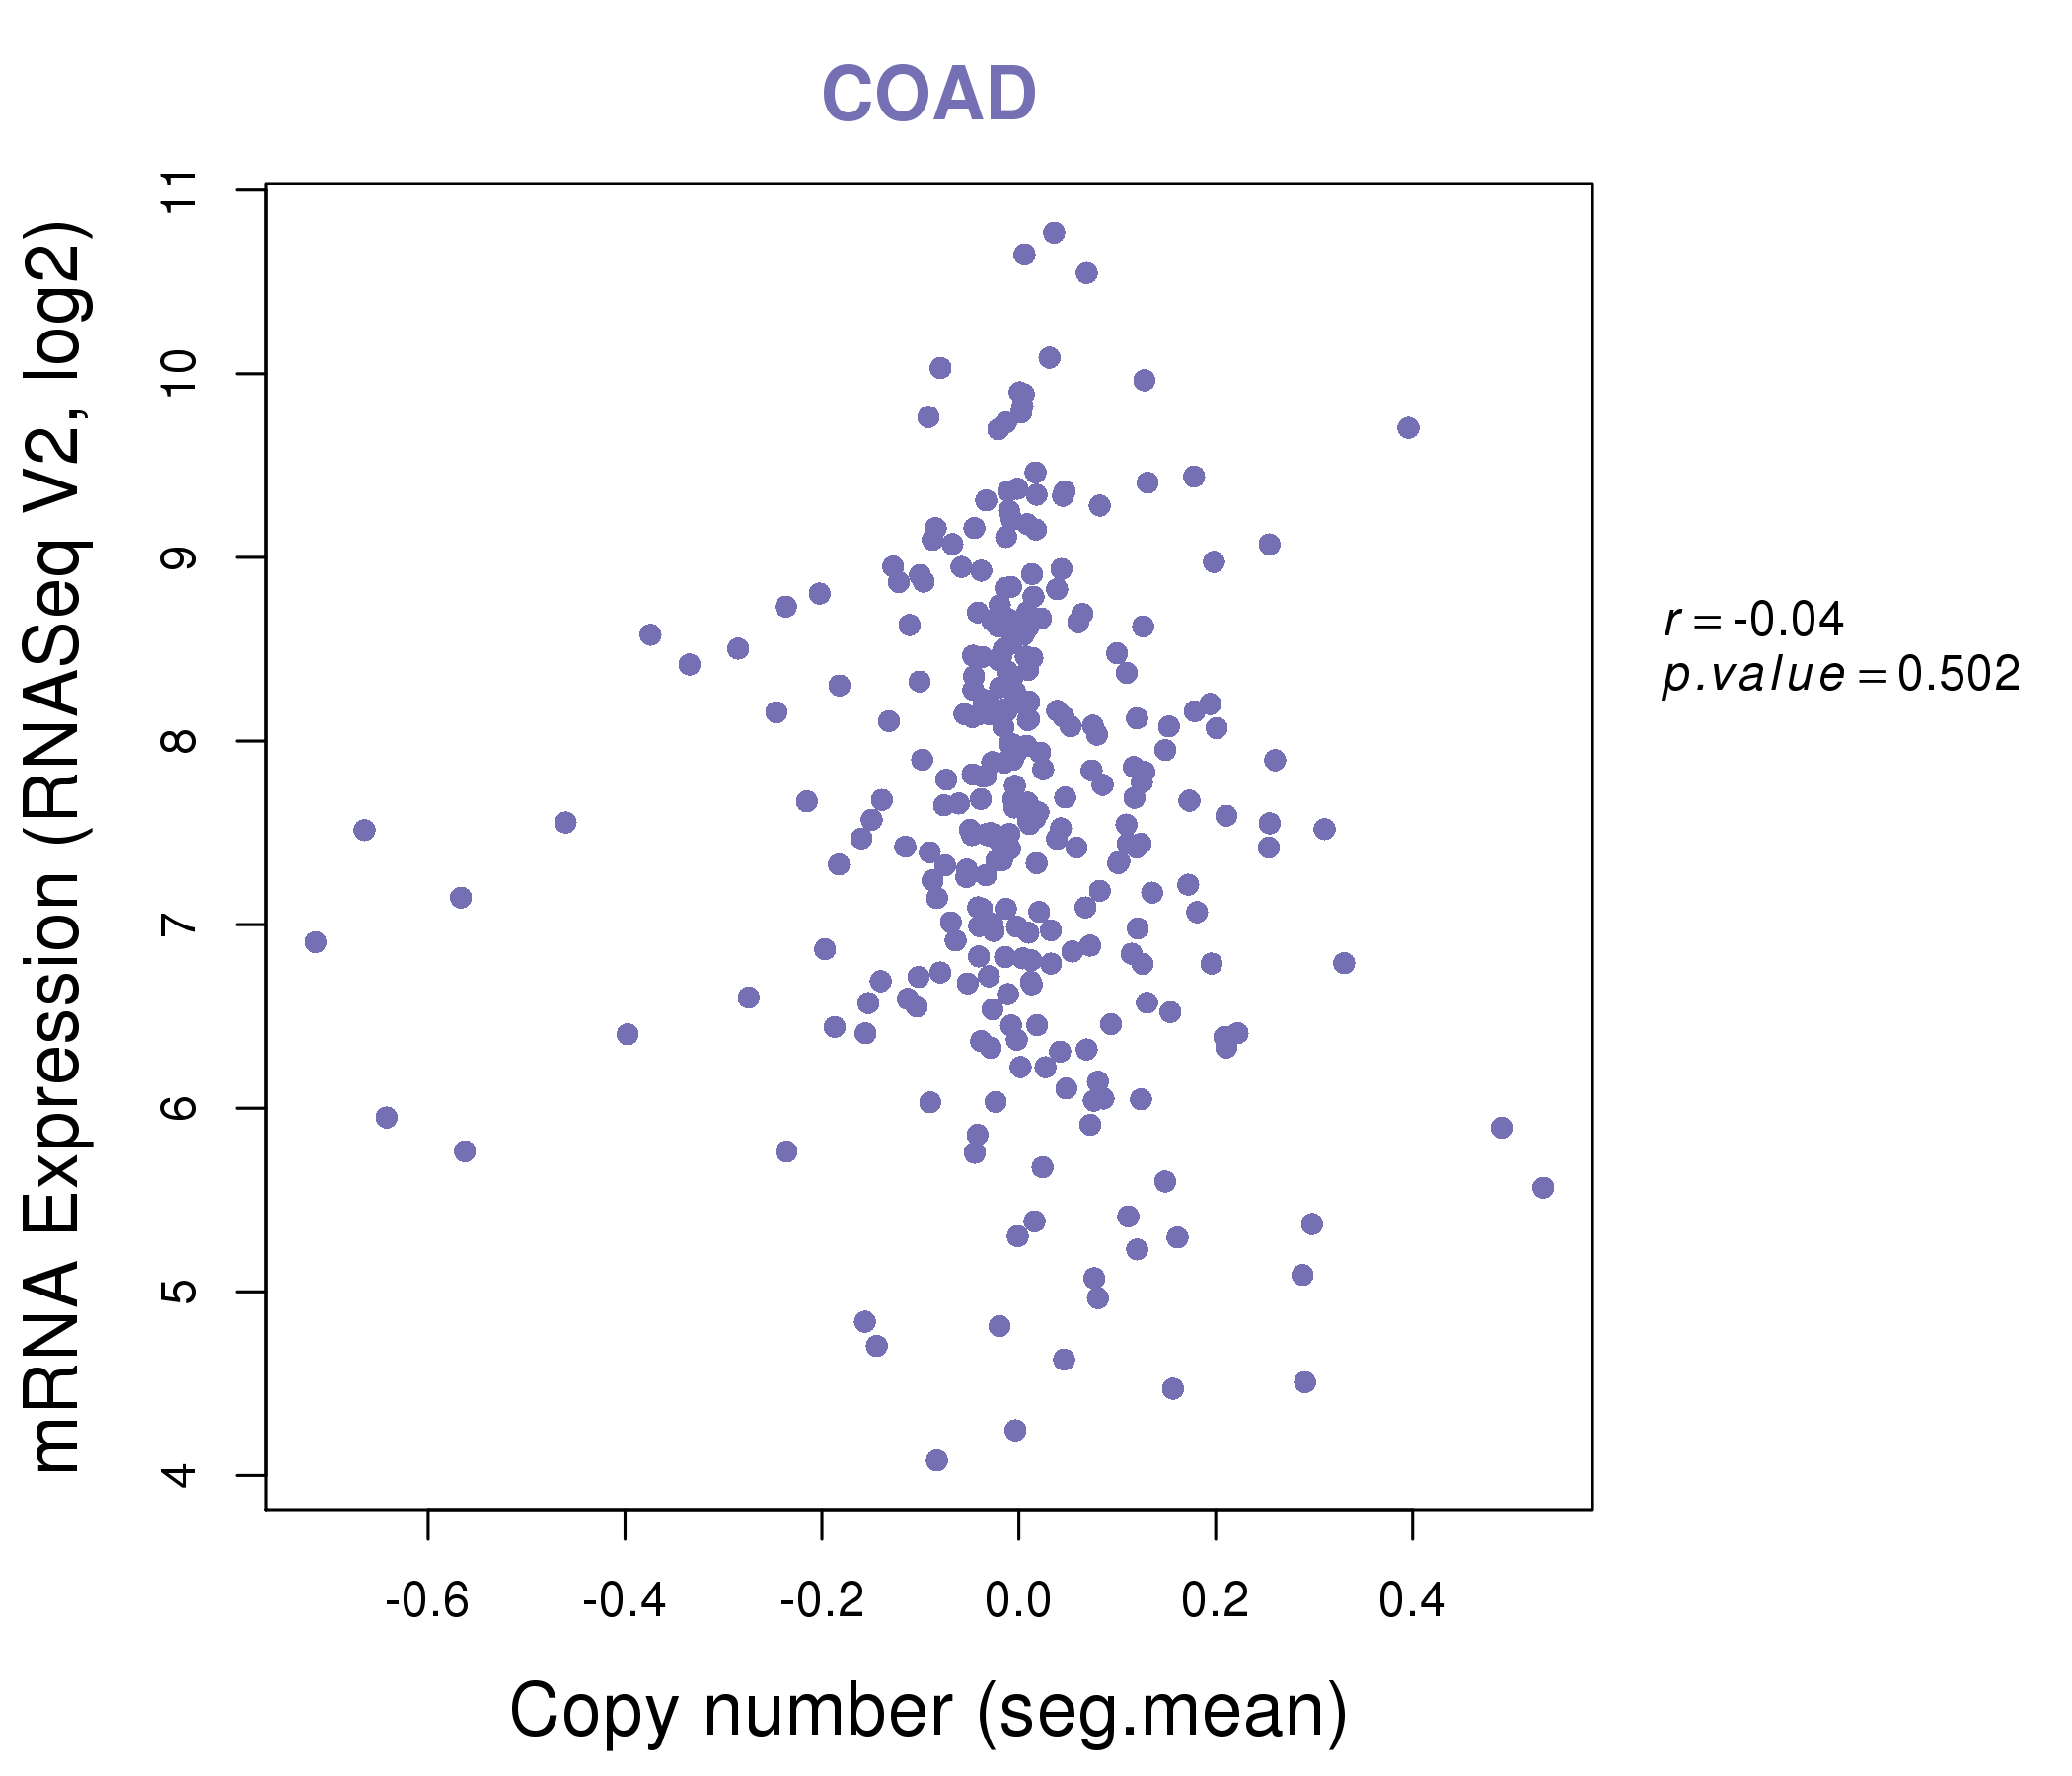
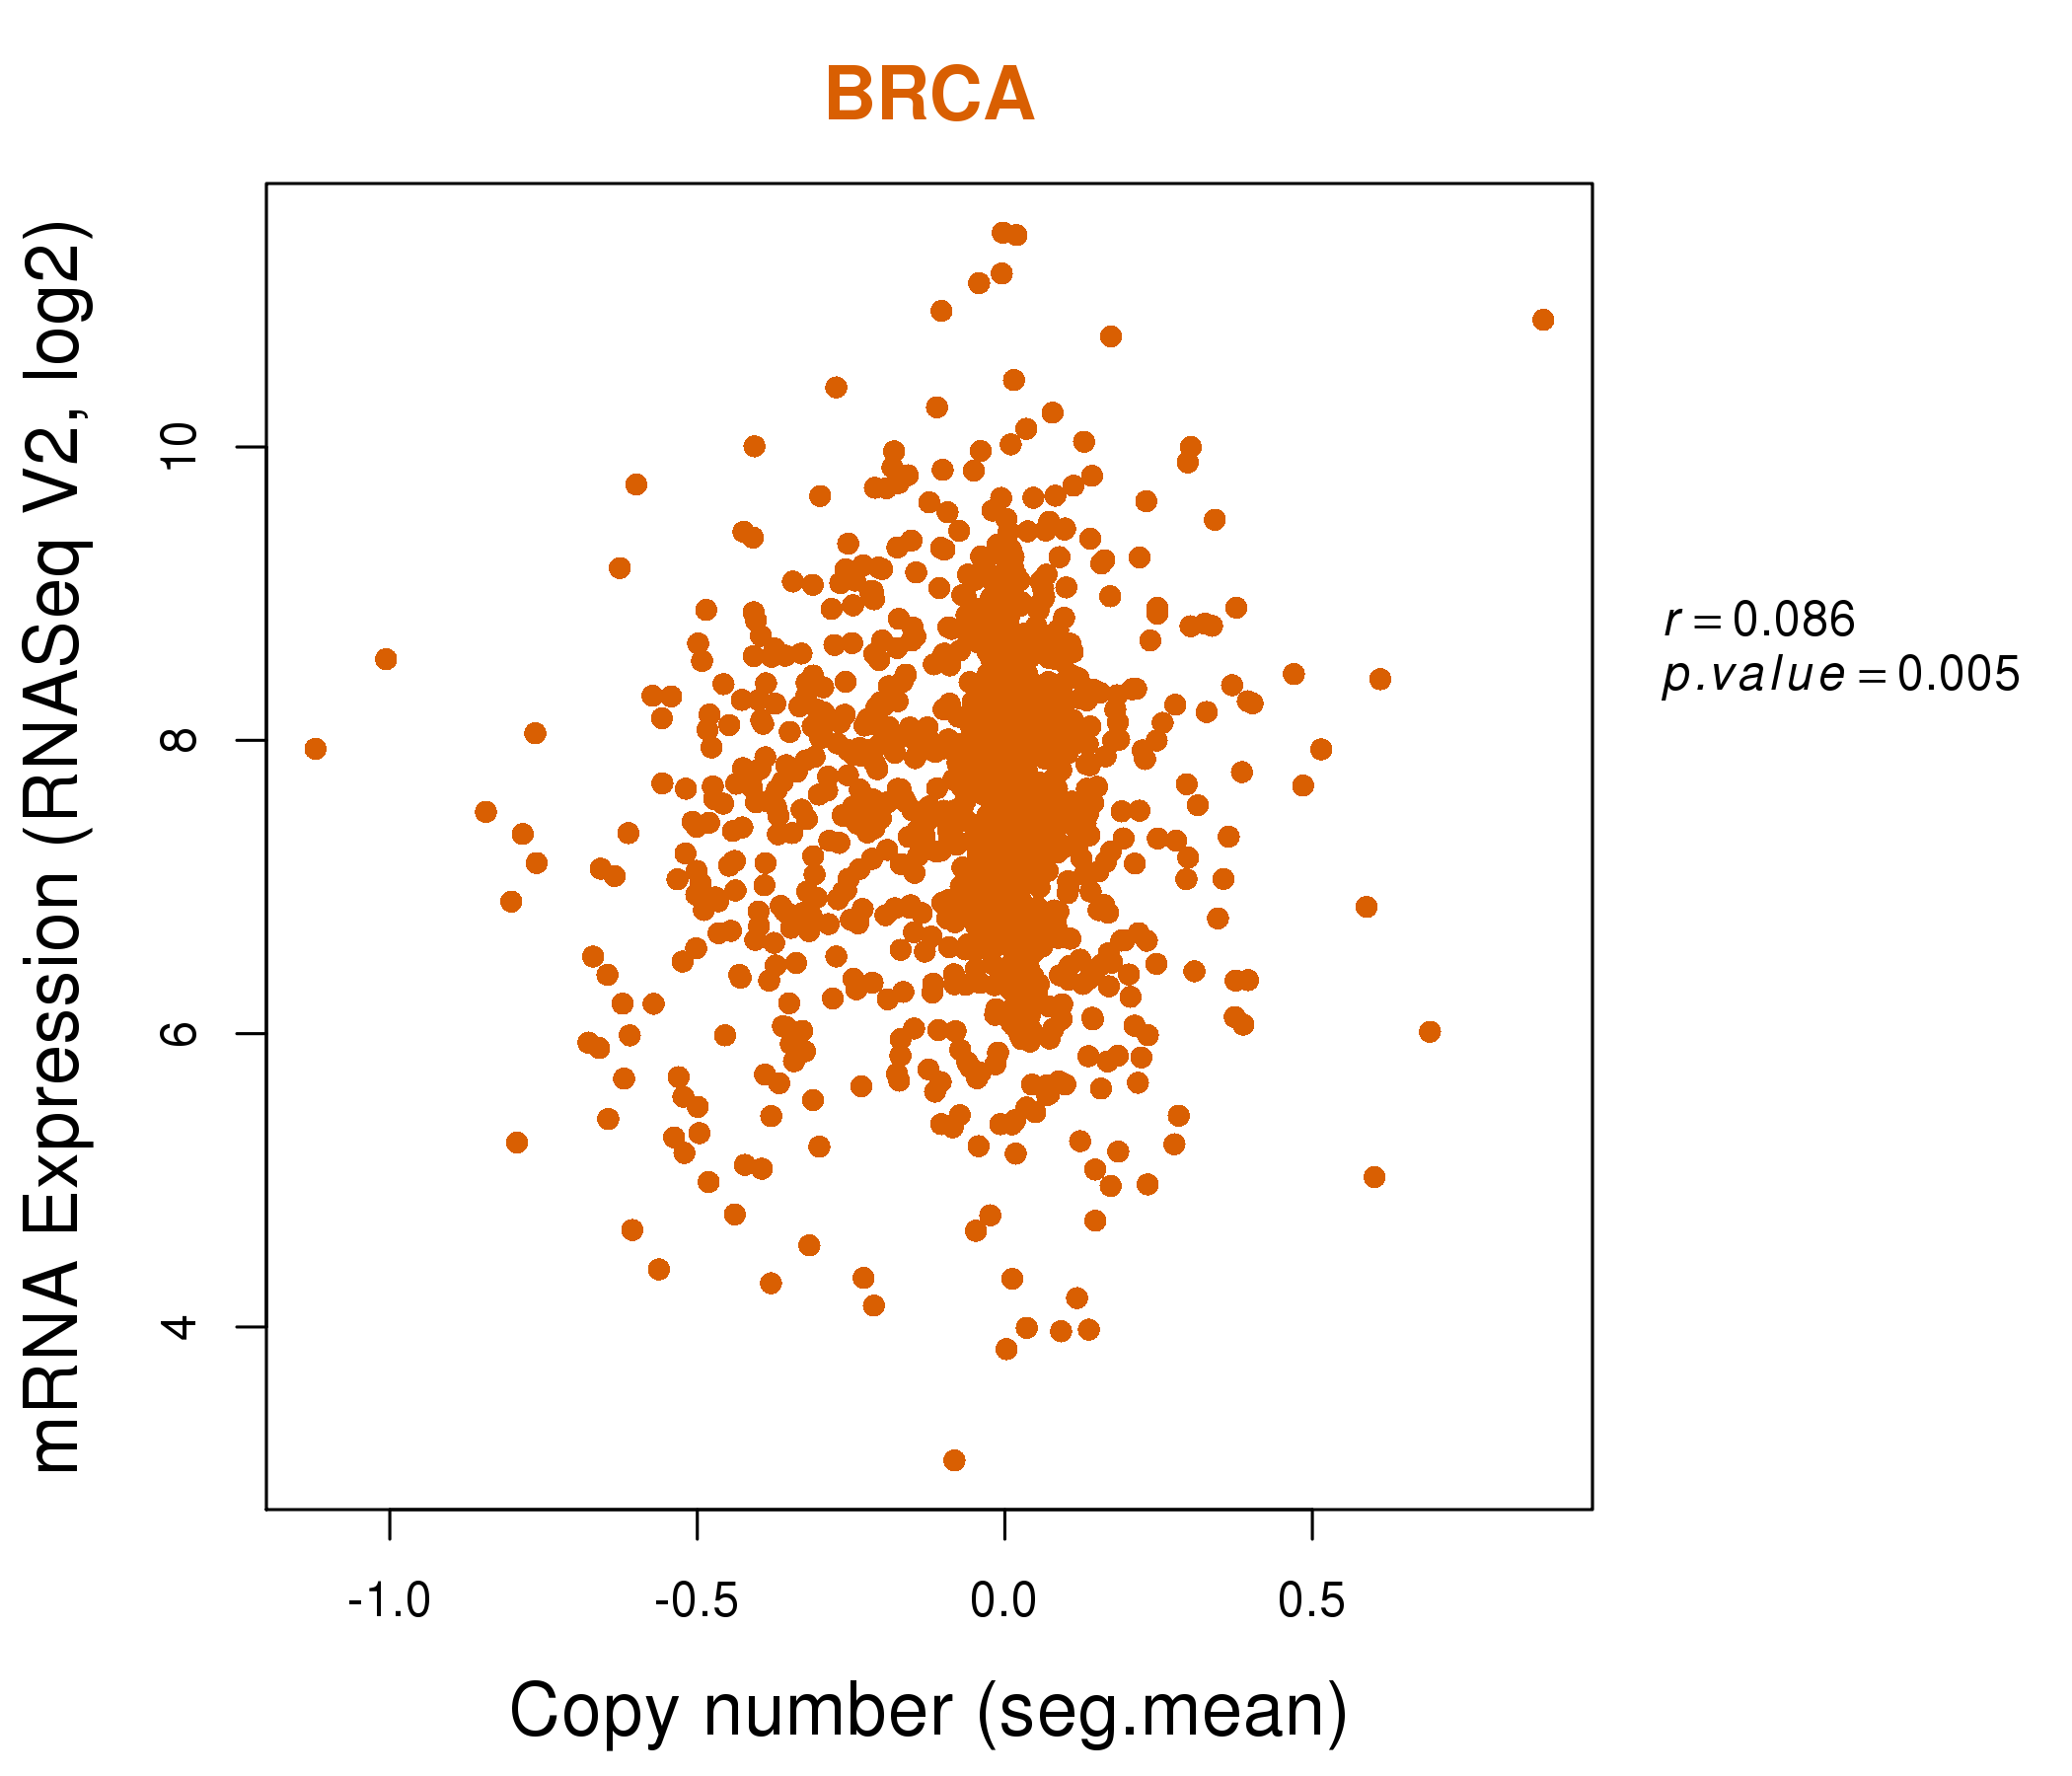
| * This plots show the correlation between CNV and gene expression. |
: Open all plots for all cancer types
 |
|
 |
|

| Top |
| Gene-Gene Network Information |
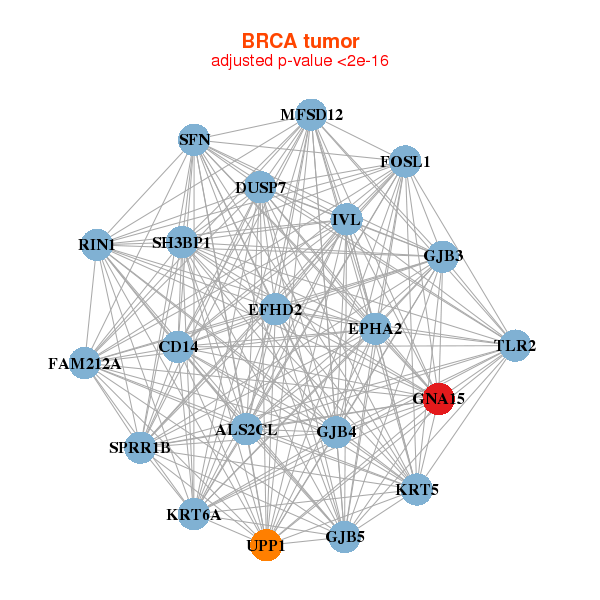
| * Co-Expression network figures were drawn using R package igraph. Only the top 20 genes with the highest correlations were shown. Red circle: input gene, orange circle: cell metabolism gene, sky circle: other gene |
: Open all plots for all cancer types
 |
|
| ALS2CL,MFSD12,FAM212A,CD14,DUSP7,EFHD2,EPHA2, FOSL1,GJB3,GJB4,GJB5,GNA15,IVL,KRT5, KRT6A,RIN1,SFN,SH3BP1,SPRR1B,TLR2,UPP1 | ADAP1,BAX,C17orf62,C19orf10,MFSD12,CFL1,CLN6, CNPY3,CORO7,CYBA,EFHD2,GALK1,GNA15,PFN1, PYCARD,RGS19,SDF2L1,SHKBP1,TIMP1,TMED9,UNC93B1 |
 |
|
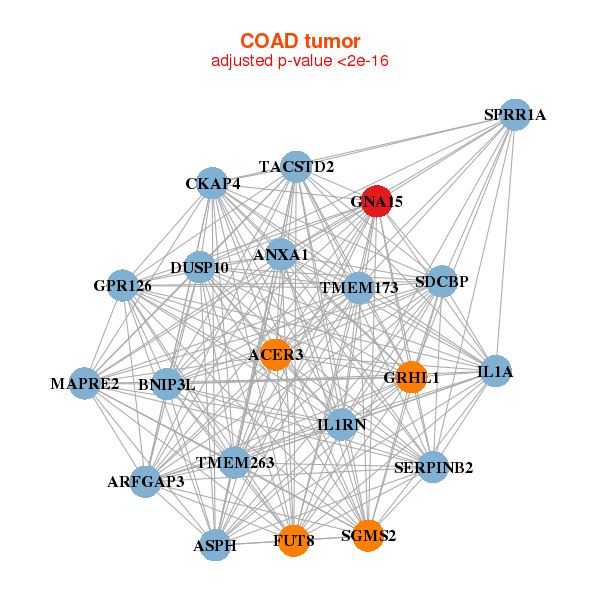
| ACER3,ANXA1,ARFGAP3,ASPH,BNIP3L,TMEM263,CKAP4, DUSP10,FUT8,GNA15,GPR126,GRHL1,IL1A,IL1RN, MAPRE2,SDCBP,SERPINB2,SGMS2,SPRR1A,TACSTD2,TMEM173 | AGTRAP,C4BPB,CCR1,CD164L2,CD1B,CSF2,CTSB, GNA15,INSL4,KYNU,LILRA3,LILRB2,LRRC25,NRROS, MMP3,PDCD1LG2,PILRA,SLC6A14,TMEM106A,TNIP3,TSTA3 |
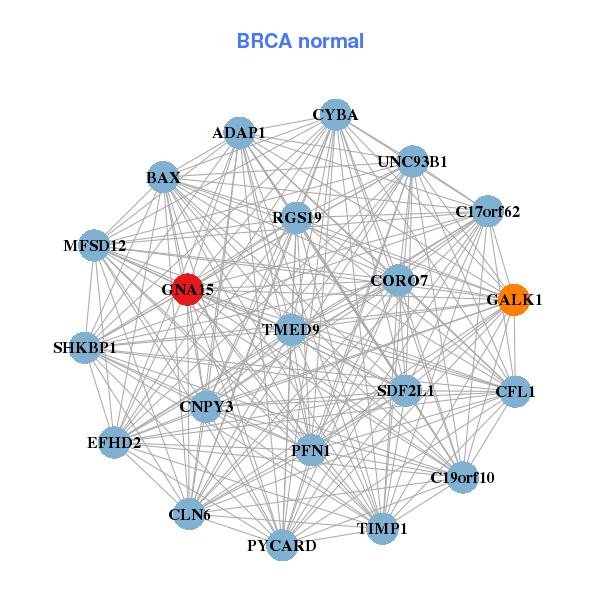
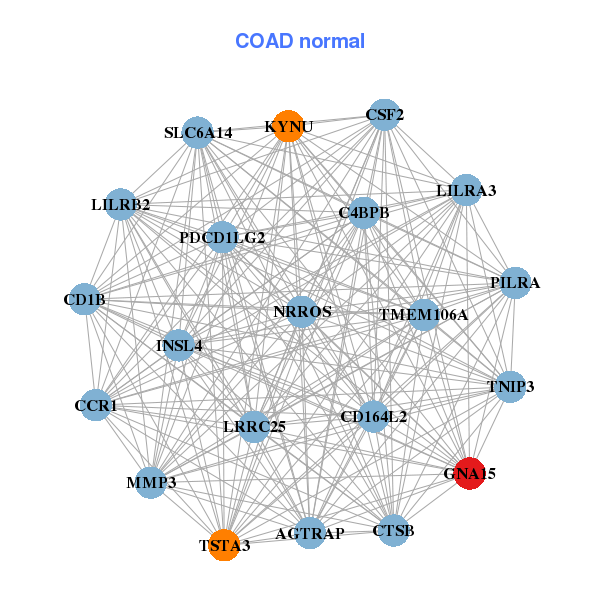
| * Co-Expression network figures were drawn using R package igraph. Only the top 20 genes with the highest correlations were shown. Red circle: input gene, orange circle: cell metabolism gene, sky circle: other gene |
: Open all plots for all cancer types
| Top |
: Open all interacting genes' information including KEGG pathway for all interacting genes from DAVID
| Top |
| Pharmacological Information for GNA15 |
| There's no related Drug. |
| Top |
| Cross referenced IDs for GNA15 |
| * We obtained these cross-references from Uniprot database. It covers 150 different DBs, 18 categories. http://www.uniprot.org/help/cross_references_section |
: Open all cross reference information
|
Copyright © 2016-Present - The Univsersity of Texas Health Science Center at Houston @ |