|
|||||||||||||||||||||||||||||||||||||||||||||||||||||||||||||||||||||||||||||||||||||||||||||||||||||||||||||||||||||||||||||||||||||||||||||||||||||||||||||||||||||||||||||||||||||||||||||||||||||||||||||||||||||||||||||||||||||||||||||||||||||||||||||||||||||||||||||||||||||||||||||||||||||||||||||||||||||||||||||||||||||||||||||||||||||||||||||||||||||||||||||||||||||||
| |
| Phenotypic Information (metabolism pathway, cancer, disease, phenome) |
| |
| |
| Gene-Gene Network Information: Co-Expression Network, Interacting Genes & KEGG |
| |
|


| Gene Summary for GNAQ |
| Basic gene info. | Gene symbol | GNAQ |
| Gene name | guanine nucleotide binding protein (G protein), q polypeptide | |
| Synonyms | CMC1|G-ALPHA-q|GAQ|SWS | |
| Cytomap | UCSC genome browser: 9q21 | |
| Genomic location | chr9 :80335190-80646219 | |
| Type of gene | protein-coding | |
| RefGenes | NM_002072.4, | |
| Ensembl id | ENSG00000156052 | |
| Description | guanine nucleotide-binding protein G(q) subunit alphaguanine nucleotide-binding protein alpha-q | |
| Modification date | 20141222 | |
| dbXrefs | MIM : 600998 | |
| HGNC : HGNC | ||
| Ensembl : ENSG00000156052 | ||
| HPRD : 02998 | ||
| Vega : OTTHUMG00000020059 | ||
| Protein | UniProt: P50148 go to UniProt's Cross Reference DB Table | |
| Expression | CleanEX: HS_GNAQ | |
| BioGPS: 2776 | ||
| Gene Expression Atlas: ENSG00000156052 | ||
| The Human Protein Atlas: ENSG00000156052 | ||
| Pathway | NCI Pathway Interaction Database: GNAQ | |
| KEGG: GNAQ | ||
| REACTOME: GNAQ | ||
| ConsensusPathDB | ||
| Pathway Commons: GNAQ | ||
| Metabolism | MetaCyc: GNAQ | |
| HUMANCyc: GNAQ | ||
| Regulation | Ensembl's Regulation: ENSG00000156052 | |
| miRBase: chr9 :80,335,190-80,646,219 | ||
| TargetScan: NM_002072 | ||
| cisRED: ENSG00000156052 | ||
| Context | iHOP: GNAQ | |
| cancer metabolism search in PubMed: GNAQ | ||
| UCL Cancer Institute: GNAQ | ||
| Assigned class in ccmGDB | B - This gene belongs to cancer gene. | |
| Top |
| Phenotypic Information for GNAQ(metabolism pathway, cancer, disease, phenome) |
| Cancer | CGAP: GNAQ |
| Familial Cancer Database: GNAQ | |
| * This gene is included in those cancer gene databases. |
|
|
|
|
|
| . | |||||||||||||||||||||||||||||||||||||||||||||||||||||||||||||||||||||||||||||||||||||||||||||||||||||||||||||||||||||||||||||||||||||||||||||||||||||||||||||||||||||||||||||||||||||||||||||||||||||||||||||||||||||||||||||||||||||||||||||||||||||||||||||||||||||||||||||||||||||||||||||||||||||||||||||||||||||||||||||||||||||||||||||||||||||||||||||||||||||||||||||||||
Oncogene 1 | Significant driver gene in | ||||||||||||||||||||||||||||||||||||||||||||||||||||||||||||||||||||||||||||||||||||||||||||||||||||||||||||||||||||||||||||||||||||||||||||||||||||||||||||||||||||||||||||||||||||||||||||||||||||||||||||||||||||||||||||||||||||||||||||||||||||||||||||||||||||||||||||||||||||||||||||||||||||||||||||||||||||||||||||||||||||||||||||||||||||||||||||||||||||||||||||||||||||||
| cf) number; DB name 1 Oncogene; http://nar.oxfordjournals.org/content/35/suppl_1/D721.long, 2 Tumor Suppressor gene; https://bioinfo.uth.edu/TSGene/, 3 Cancer Gene Census; http://www.nature.com/nrc/journal/v4/n3/abs/nrc1299.html, 4 CancerGenes; http://nar.oxfordjournals.org/content/35/suppl_1/D721.long, 5 Network of Cancer Gene; http://ncg.kcl.ac.uk/index.php, 1Therapeutic Vulnerabilities in Cancer; http://cbio.mskcc.org/cancergenomics/statius/ |
| REACTOME_INTEGRATION_OF_ENERGY_METABOLISM | |
| OMIM | 163000; phenotype. 185300; phenotype. 600998; gene. |
| Orphanet | 3205; Sturge-Weber syndrome. 624; Familial multiple nevi flammei. |
| Disease | KEGG Disease: GNAQ |
| MedGen: GNAQ (Human Medical Genetics with Condition) | |
| ClinVar: GNAQ | |
| Phenotype | MGI: GNAQ (International Mouse Phenotyping Consortium) |
| PhenomicDB: GNAQ | |
| Mutations for GNAQ |
| * Under tables are showing count per each tissue to give us broad intuition about tissue specific mutation patterns.You can go to the detailed page for each mutation database's web site. |
| - Statistics for Tissue and Mutation type | Top |
 |
| - For Inter-chromosomal Variations |
| * Inter-chromosomal variantions includes 'interchromosomal amplicon to amplicon', 'interchromosomal amplicon to non-amplified dna', 'interchromosomal insertion', 'Interchromosomal unknown type'. |
 |
| - For Intra-chromosomal Variations |
| * Intra-chromosomal variantions includes 'intrachromosomal amplicon to amplicon', 'intrachromosomal amplicon to non-amplified dna', 'intrachromosomal deletion', 'intrachromosomal fold-back inversion', 'intrachromosomal inversion', 'intrachromosomal tandem duplication', 'Intrachromosomal unknown type', 'intrachromosomal with inverted orientation', 'intrachromosomal with non-inverted orientation'. |
 |
| Sample | Symbol_a | Chr_a | Start_a | End_a | Symbol_b | Chr_b | Start_b | End_b |
| breast | GNAQ | chr9 | 80492783 | 80492783 | GNAQ | chr9 | 80501228 | 80501228 |
| ovary | GNAQ | chr9 | 80352015 | 80352035 | GNAQ | chr9 | 80352506 | 80352526 |
| ovary | GNAQ | chr9 | 80392265 | 80392285 | chr9 | 80327175 | 80327195 | |
| ovary | GNAQ | chr9 | 80502310 | 80502330 | chr9 | 80306205 | 80306225 | |
| ovary | GNAQ | chr9 | 80591730 | 80591750 | chr9 | 80795426 | 80795446 | |
| pancreas | GNAQ | chr9 | 80480443 | 80480463 | TMTC1 | chr12 | 29709562 | 29709582 |
| pancreas | GNAQ | chr9 | 80480828 | 80480848 | chr12 | 25412911 | 25412931 | |
| pancreas | GNAQ | chr9 | 80480829 | 80480849 | chr12 | 25412911 | 25412931 | |
| pancreas | GNAQ | chr9 | 80500861 | 80500881 | chr9 | 81422186 | 81422206 | |
| pancreas | GNAQ | chr9 | 80515497 | 80515517 | GNAQ | chr9 | 80506374 | 80506394 |
| cf) Tissue number; Tissue name (1;Breast, 2;Central_nervous_system, 3;Haematopoietic_and_lymphoid_tissue, 4;Large_intestine, 5;Liver, 6;Lung, 7;Ovary, 8;Pancreas, 9;Prostate, 10;Skin, 11;Soft_tissue, 12;Upper_aerodigestive_tract) |
| * From mRNA Sanger sequences, Chitars2.0 arranged chimeric transcripts. This table shows GNAQ related fusion information. |
| ID | Head Gene | Tail Gene | Accession | Gene_a | qStart_a | qEnd_a | Chromosome_a | tStart_a | tEnd_a | Gene_a | qStart_a | qEnd_a | Chromosome_a | tStart_a | tEnd_a |
| DB494590 | PALM2 | 1 | 162 | 9 | 112629822 | 112642962 | GNAQ | 160 | 508 | 9 | 80430521 | 80537263 | |
| DA490542 | GNAQ | 1 | 319 | 9 | 80333440 | 80333757 | DYNC1I2 | 311 | 550 | 2 | 172571855 | 172582473 | |
| AA729462 | GNAQ | 8 | 210 | 9 | 80490274 | 80490477 | GNAQ | 206 | 304 | 9 | 80490470 | 80490568 | |
| BI021299 | GNAQ | 1 | 326 | 9 | 80589691 | 80590016 | CELF2 | 323 | 405 | 10 | 11288431 | 11288513 | |
| Top |
| Mutation type/ Tissue ID | brca | cns | cerv | endome | haematopo | kidn | Lintest | liver | lung | ns | ovary | pancre | prost | skin | stoma | thyro | urina | |||
| Total # sample | 1 | 1 | 2 | 1 | ||||||||||||||||
| GAIN (# sample) | 1 | 1 | 1 | |||||||||||||||||
| LOSS (# sample) | 2 |
| cf) Tissue ID; Tissue type (1; Breast, 2; Central_nervous_system, 3; Cervix, 4; Endometrium, 5; Haematopoietic_and_lymphoid_tissue, 6; Kidney, 7; Large_intestine, 8; Liver, 9; Lung, 10; NS, 11; Ovary, 12; Pancreas, 13; Prostate, 14; Skin, 15; Stomach, 16; Thyroid, 17; Urinary_tract) |
| Top |
|
 |
| Top |
| Stat. for Non-Synonymous SNVs (# total SNVs=344) | (# total SNVs=7) |
 |  |
(# total SNVs=2) | (# total SNVs=0) |
 |
| Top |
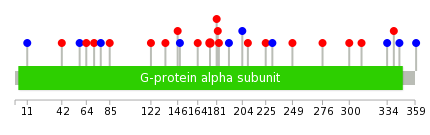
| * When you move the cursor on each content, you can see more deailed mutation information on the Tooltip. Those are primary_site,primary_histology,mutation(aa),pubmedID. |
| GRCh37 position | Mutation(aa) | Unique sampleID count |
| chr9:80409488-80409488 | p.Q209P | 233 |
| chr9:80412493-80412493 | p.R183Q | 11 |
| chr9:80409488-80409489 | p.Q209L | 6 |
| chr9:80409487-80409487 | p.Q209H | 3 |
| chr9:80537092-80537092 | p.K102N | 2 |
| chr9:80537112-80537112 | p.T96S | 2 |
| chr9:80412517-80412517 | p.T175M | 2 |
| chr9:80412518-80412518 | p.T175S | 2 |
| chr9:80336317-80336317 | p.T334T | 2 |
| chr9:80336249-80336249 | p.N357S | 1 |
| Top |
|
 |
| Point Mutation/ Tissue ID | 1 | 2 | 3 | 4 | 5 | 6 | 7 | 8 | 9 | 10 | 11 | 12 | 13 | 14 | 15 | 16 | 17 | 18 | 19 | 20 |
| # sample | 1 | 10 | 1 | 2 | 1 | 1 | 5 | 4 | 5 | |||||||||||
| # mutation | 1 | 9 | 1 | 2 | 1 | 1 | 5 | 4 | 5 | |||||||||||
| nonsynonymous SNV | 1 | 8 | 2 | 1 | 4 | 1 | 2 | |||||||||||||
| synonymous SNV | 1 | 1 | 1 | 1 | 3 | 3 |
| cf) Tissue ID; Tissue type (1; BLCA[Bladder Urothelial Carcinoma], 2; BRCA[Breast invasive carcinoma], 3; CESC[Cervical squamous cell carcinoma and endocervical adenocarcinoma], 4; COAD[Colon adenocarcinoma], 5; GBM[Glioblastoma multiforme], 6; Glioma Low Grade, 7; HNSC[Head and Neck squamous cell carcinoma], 8; KICH[Kidney Chromophobe], 9; KIRC[Kidney renal clear cell carcinoma], 10; KIRP[Kidney renal papillary cell carcinoma], 11; LAML[Acute Myeloid Leukemia], 12; LUAD[Lung adenocarcinoma], 13; LUSC[Lung squamous cell carcinoma], 14; OV[Ovarian serous cystadenocarcinoma ], 15; PAAD[Pancreatic adenocarcinoma], 16; PRAD[Prostate adenocarcinoma], 17; SKCM[Skin Cutaneous Melanoma], 18:STAD[Stomach adenocarcinoma], 19:THCA[Thyroid carcinoma], 20:UCEC[Uterine Corpus Endometrial Carcinoma]) |
| Top |
| * We represented just top 10 SNVs. When you move the cursor on each content, you can see more deailed mutation information on the Tooltip. Those are primary_site, primary_histology, mutation(aa), pubmedID. |
| Genomic Position | Mutation(aa) | Unique sampleID count |
| chr9:80412518 | p.T175S | 2 |
| chr9:80336301 | p.K311T | 1 |
| chr9:80412493 | p.L135V | 1 |
| chr9:80537187 | p.R300K | 1 |
| chr9:80336317 | p.S122F | 1 |
| chr9:80412496 | p.K276E | 1 |
| chr9:80537207 | p.T85M | 1 |
| chr9:80336387 | p.E249K | 1 |
| chr9:80412499 | p.K77K | 1 |
| chr9:80537224 | p.A231A | 1 |
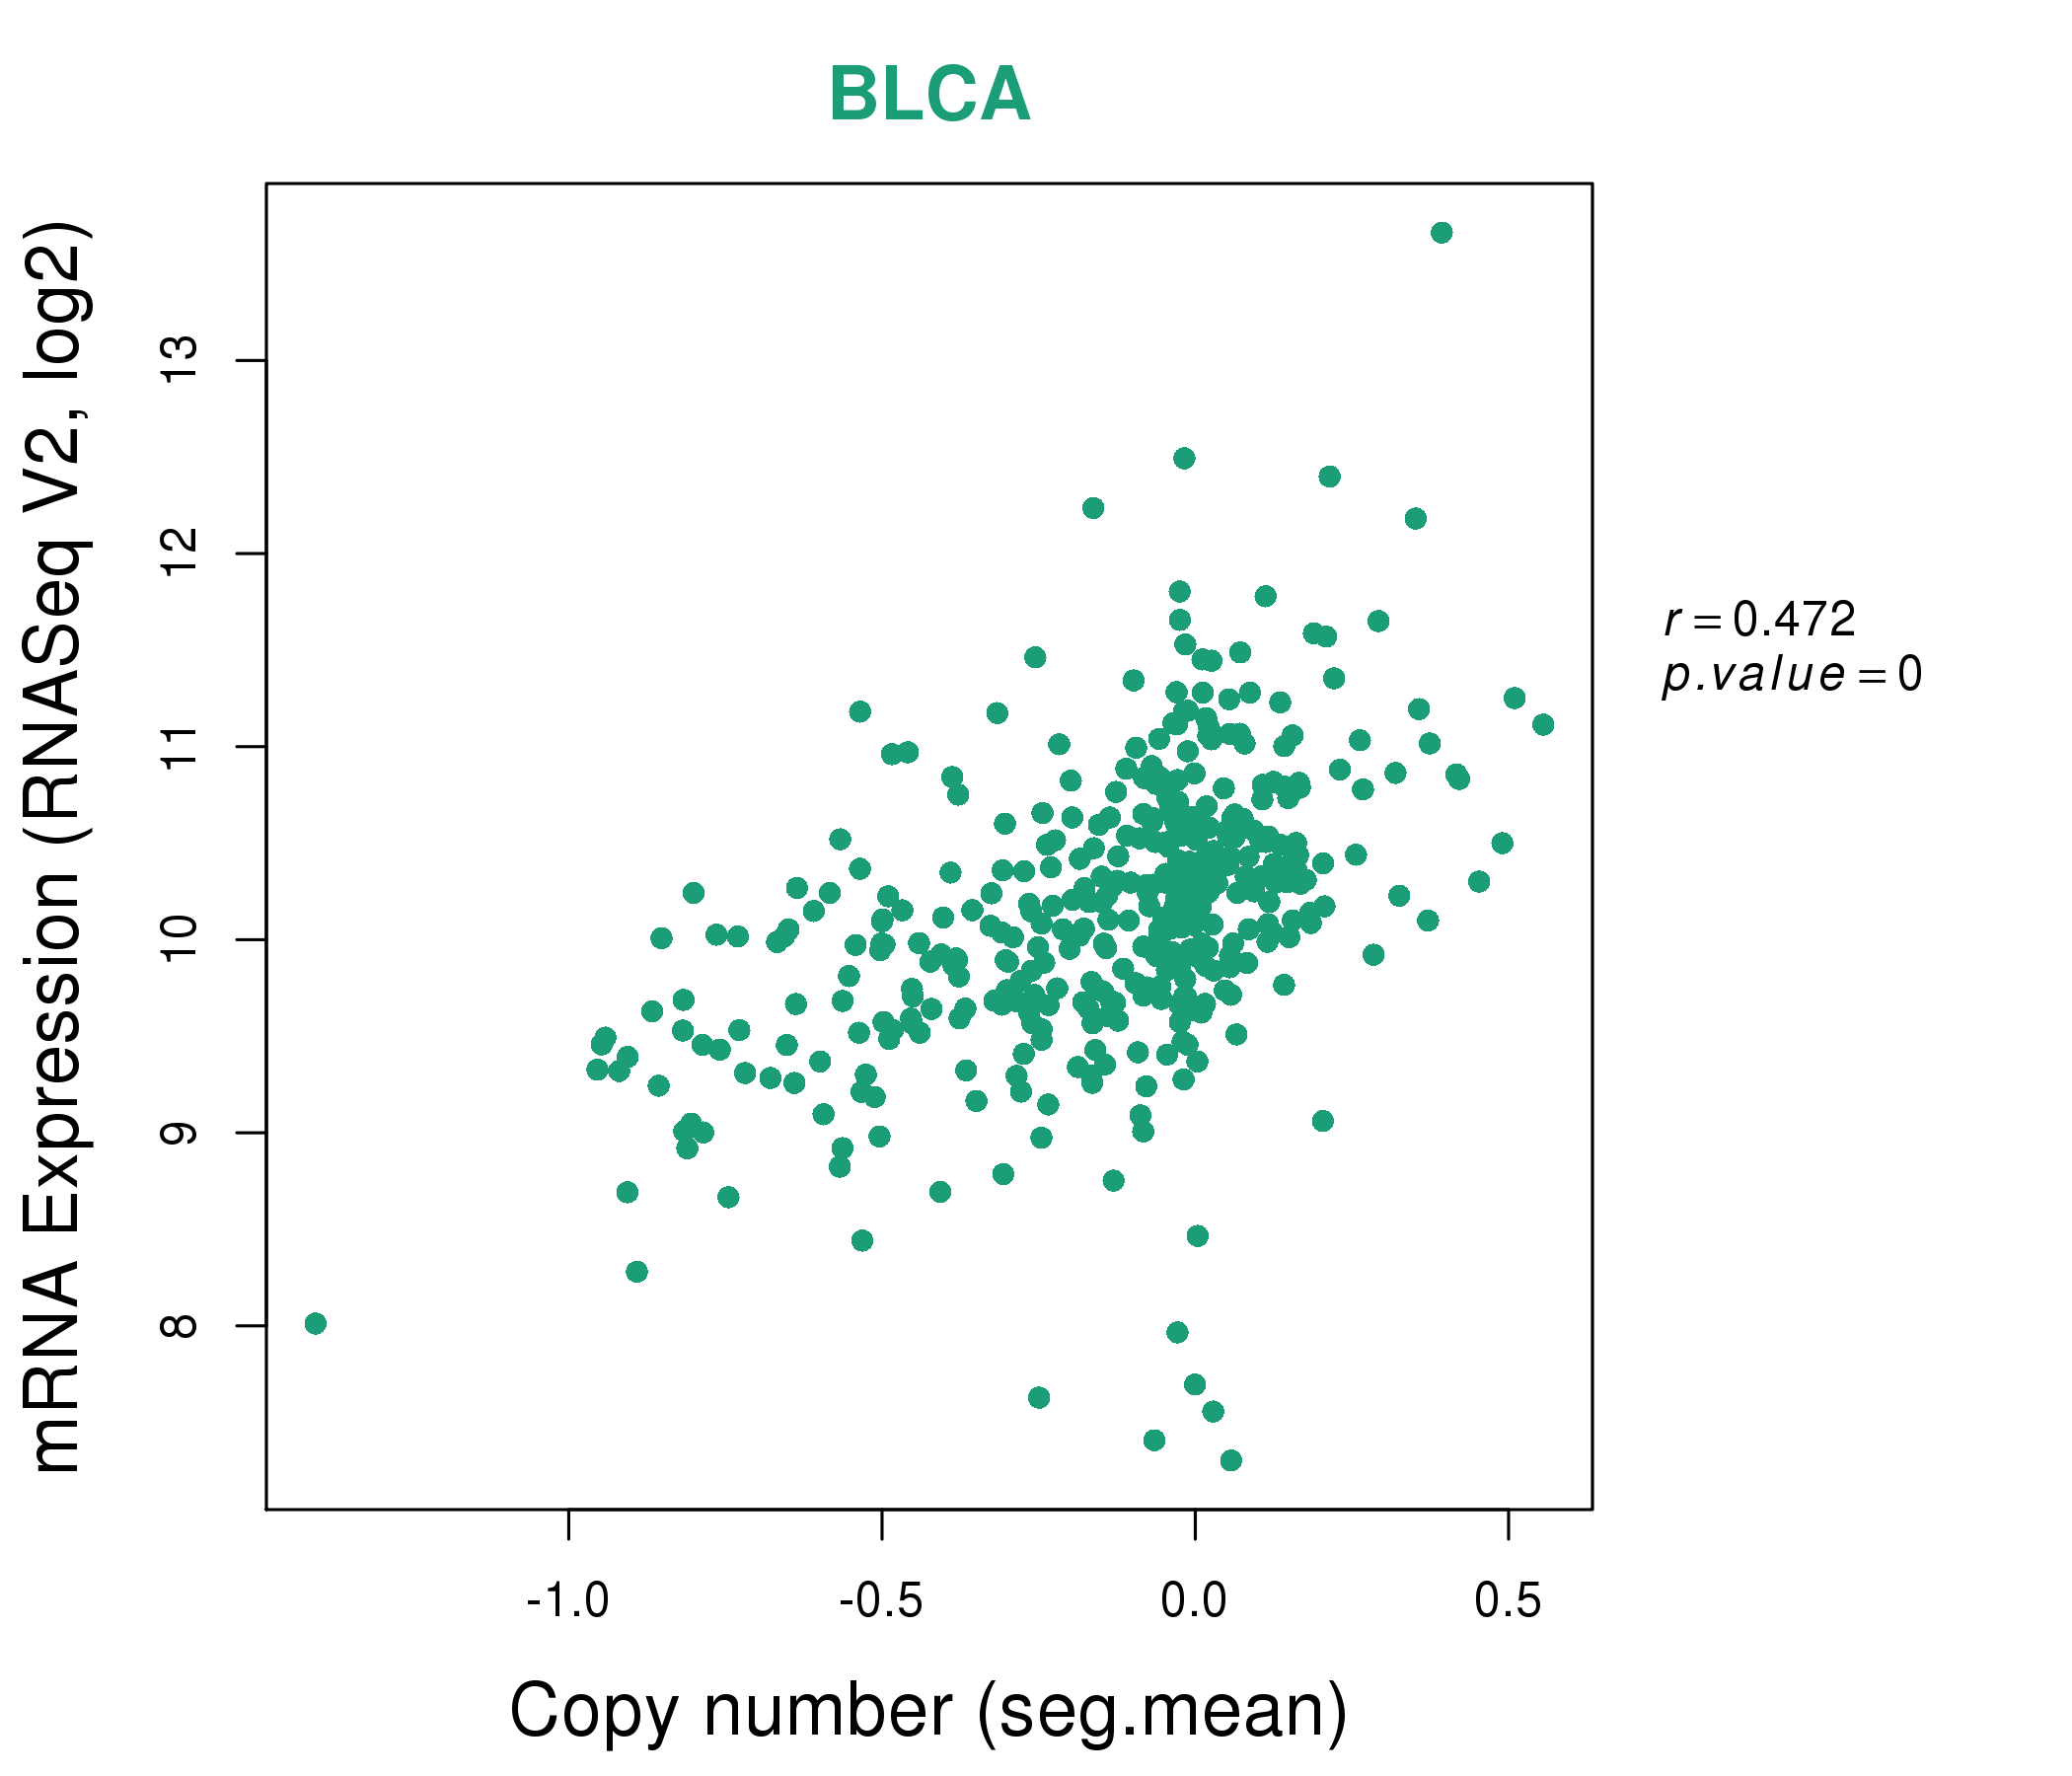
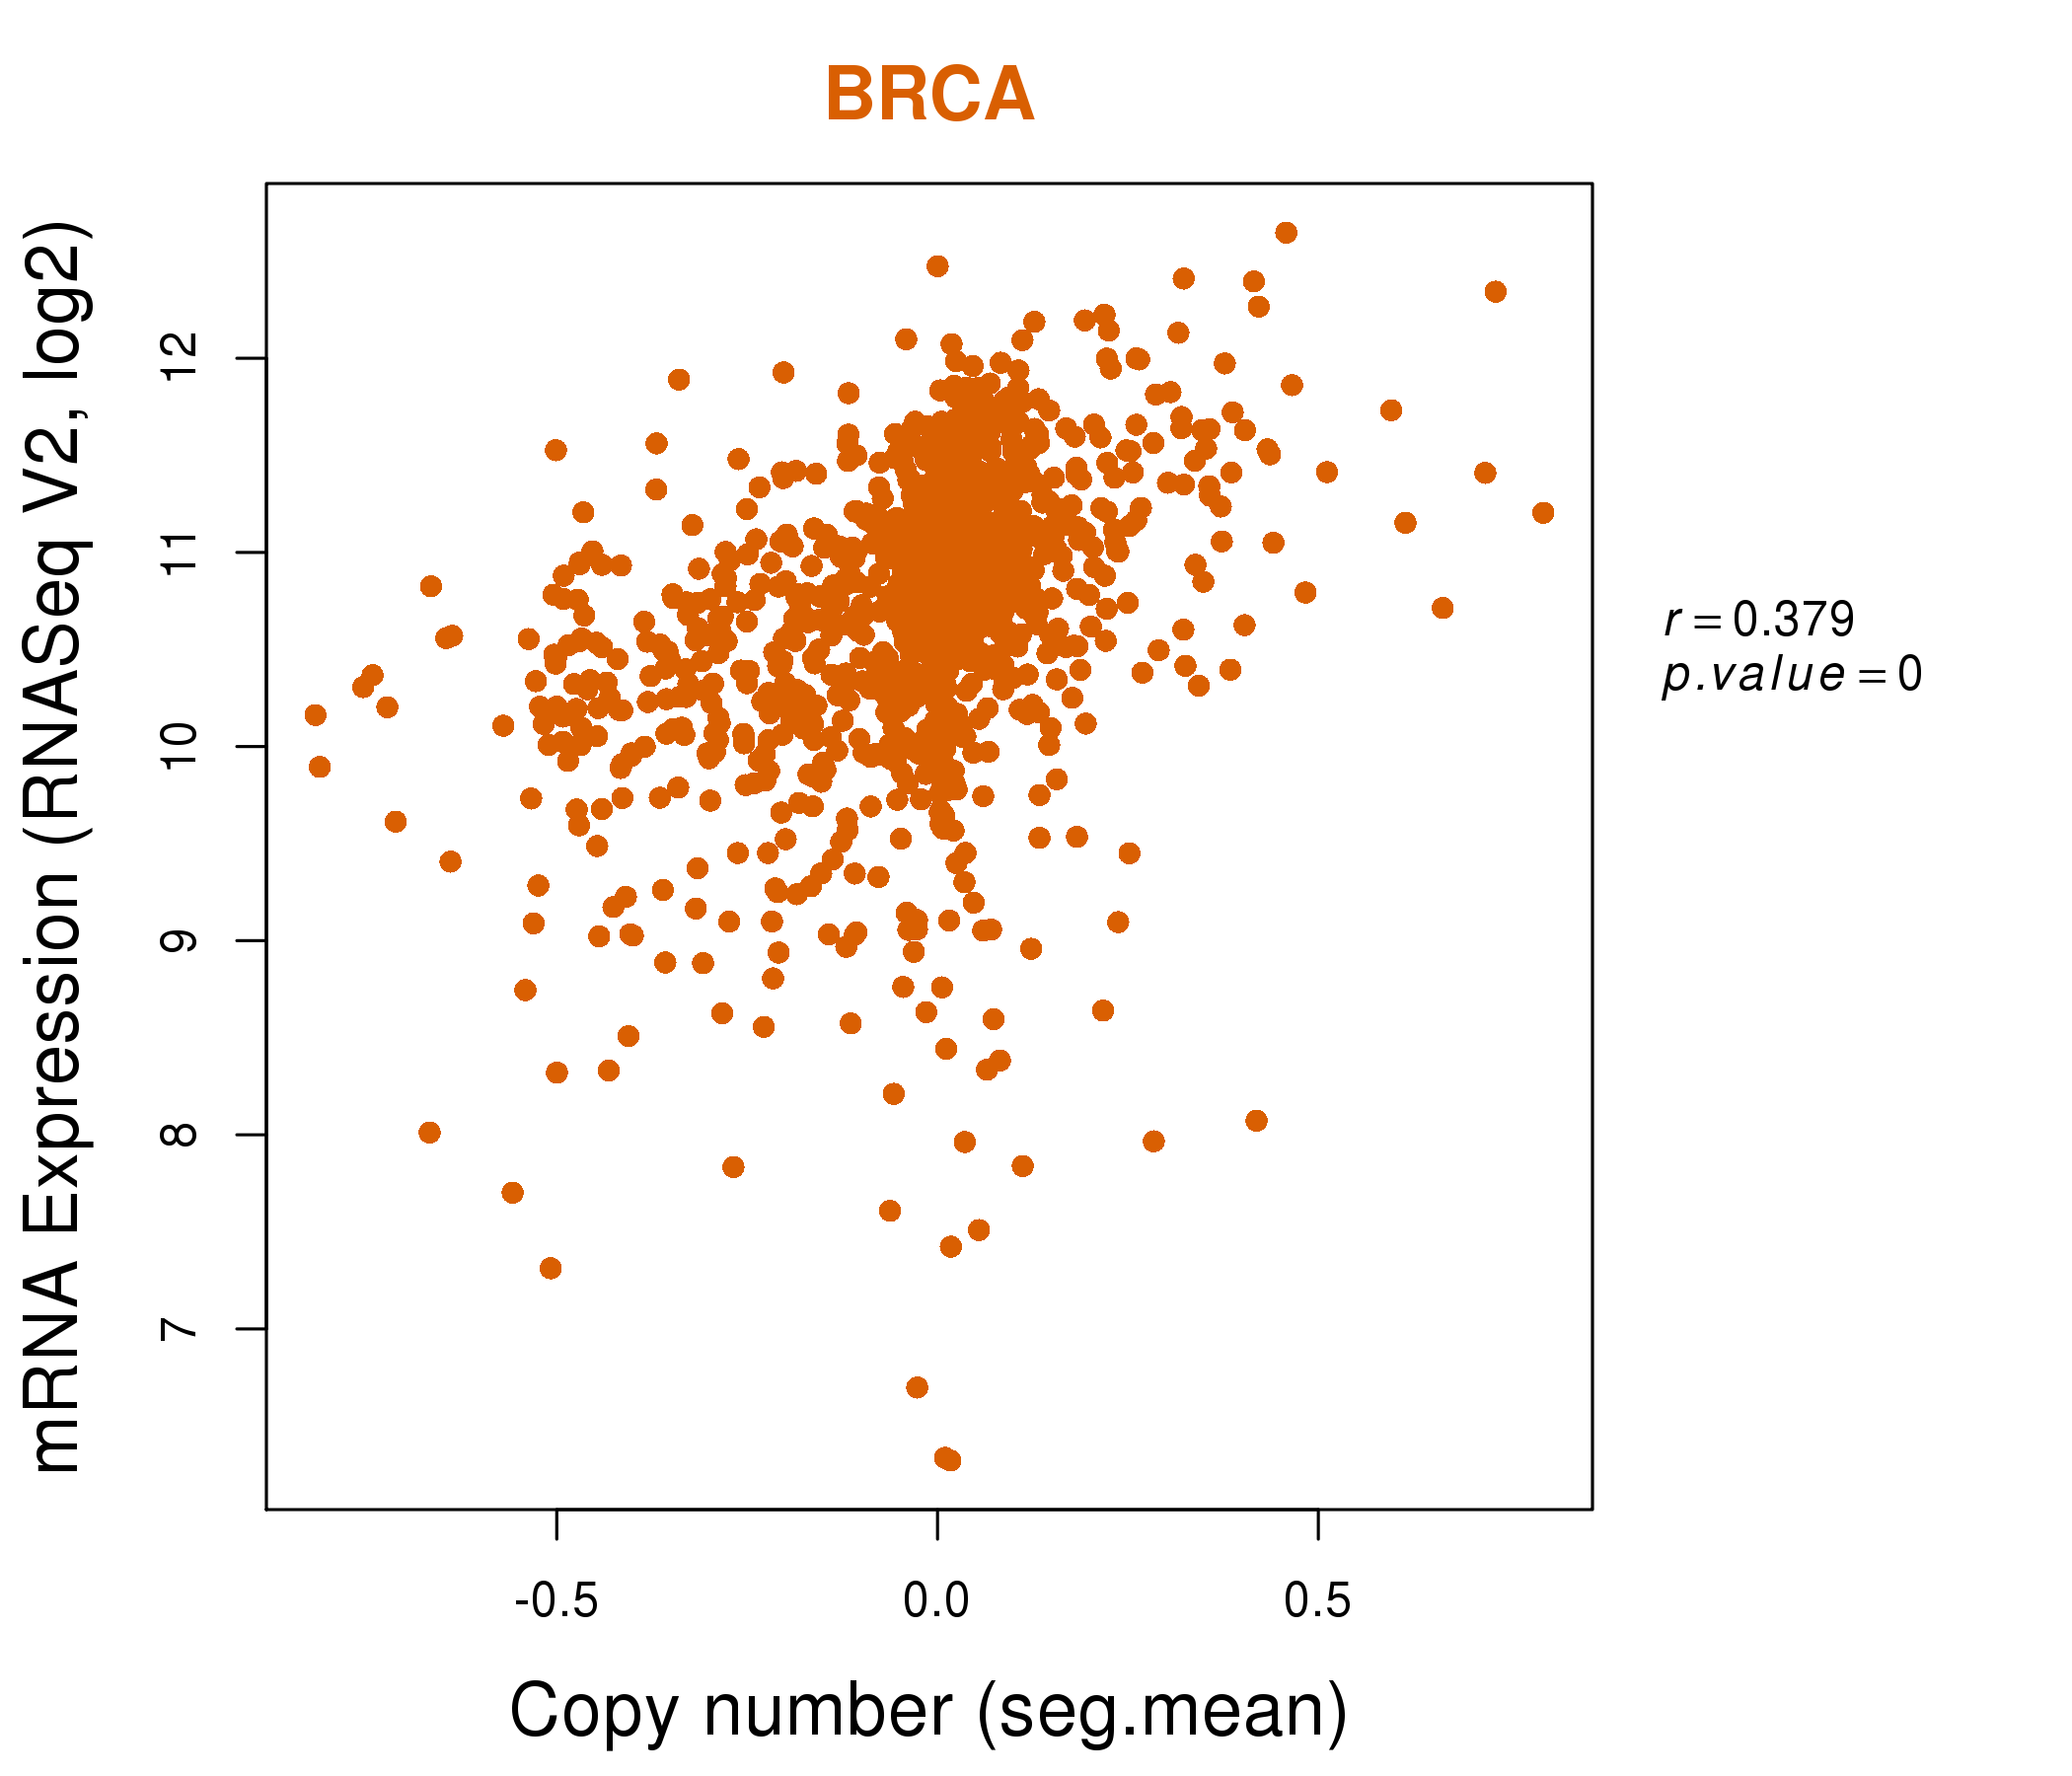
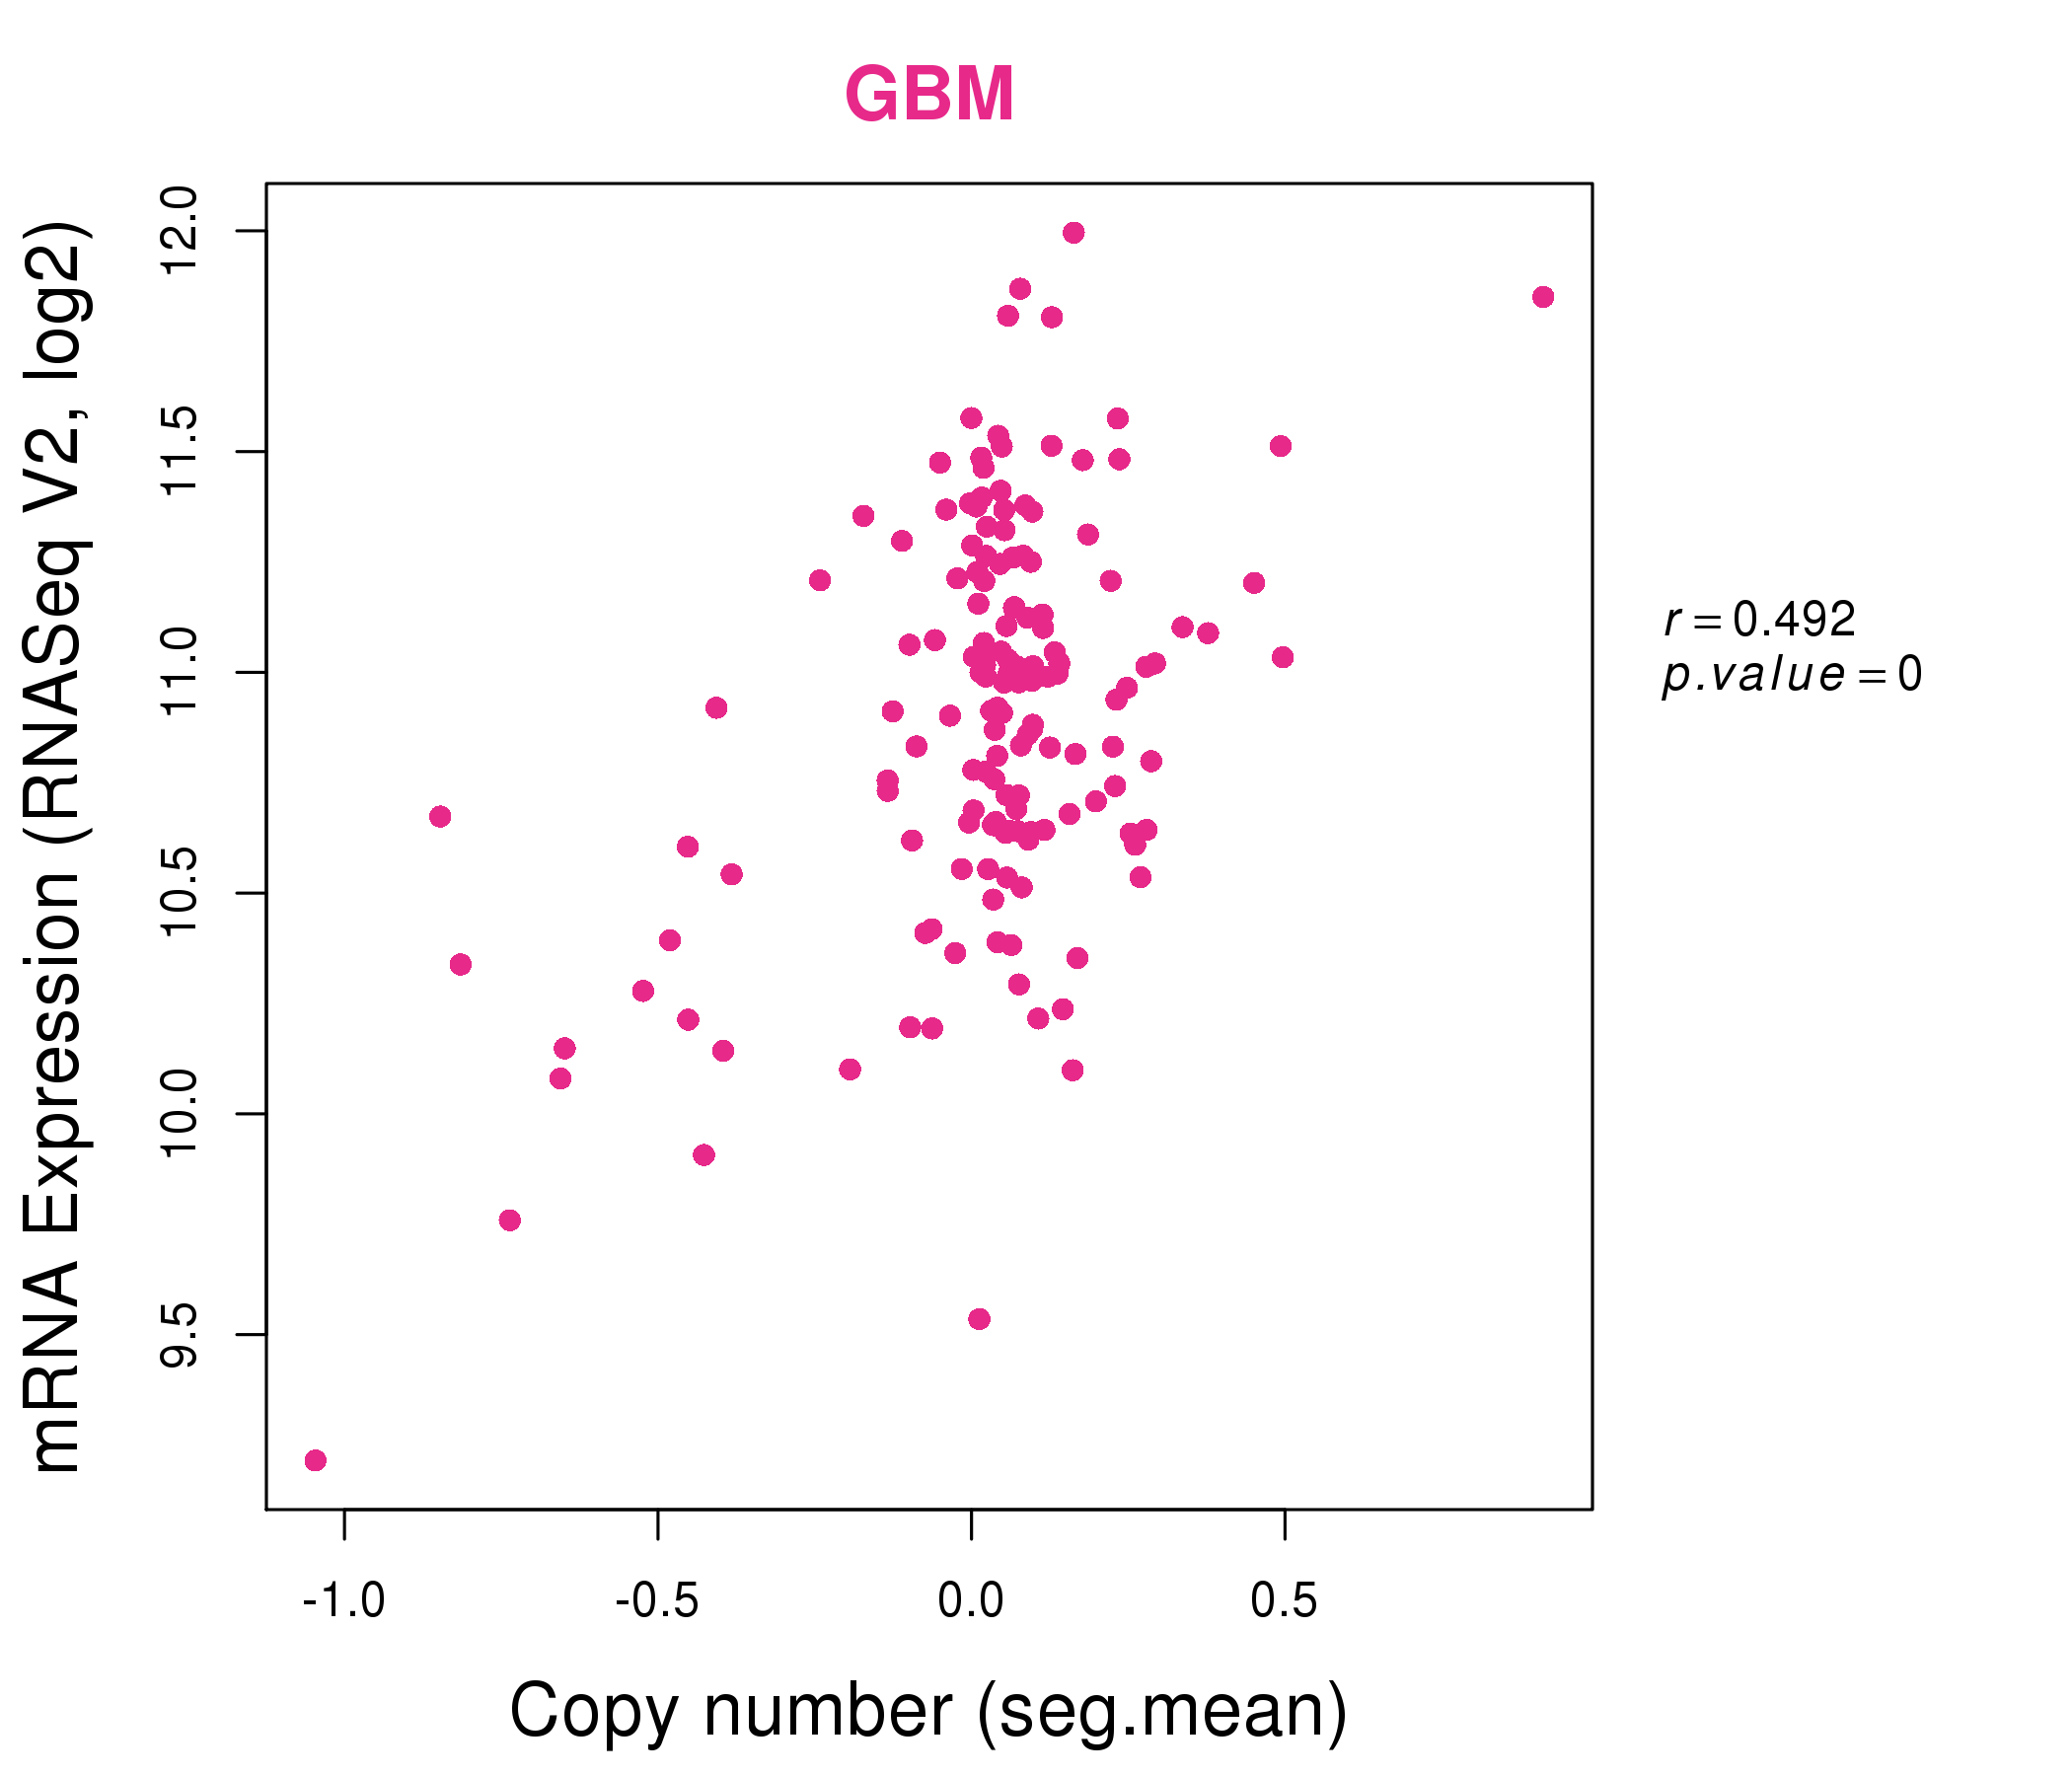
| * Copy number data were extracted from TCGA using R package TCGA-Assembler. The URLs of all public data files on TCGA DCC data server were gathered on Jan-05-2015. Function ProcessCNAData in TCGA-Assembler package was used to obtain gene-level copy number value which is calculated as the average copy number of the genomic region of a gene. |
 |
| cf) Tissue ID[Tissue type]: BLCA[Bladder Urothelial Carcinoma], BRCA[Breast invasive carcinoma], CESC[Cervical squamous cell carcinoma and endocervical adenocarcinoma], COAD[Colon adenocarcinoma], GBM[Glioblastoma multiforme], Glioma Low Grade, HNSC[Head and Neck squamous cell carcinoma], KICH[Kidney Chromophobe], KIRC[Kidney renal clear cell carcinoma], KIRP[Kidney renal papillary cell carcinoma], LAML[Acute Myeloid Leukemia], LUAD[Lung adenocarcinoma], LUSC[Lung squamous cell carcinoma], OV[Ovarian serous cystadenocarcinoma ], PAAD[Pancreatic adenocarcinoma], PRAD[Prostate adenocarcinoma], SKCM[Skin Cutaneous Melanoma], STAD[Stomach adenocarcinoma], THCA[Thyroid carcinoma], UCEC[Uterine Corpus Endometrial Carcinoma] |
| Top |
| Gene Expression for GNAQ |
| * CCLE gene expression data were extracted from CCLE_Expression_Entrez_2012-10-18.res: Gene-centric RMA-normalized mRNA expression data. |
 |
| * Normalized gene expression data of RNASeqV2 was extracted from TCGA using R package TCGA-Assembler. The URLs of all public data files on TCGA DCC data server were gathered at Jan-05-2015. Only eight cancer types have enough normal control samples for differential expression analysis. (t test, adjusted p<0.05 (using Benjamini-Hochberg FDR)) |
 |
| Top |
| * This plots show the correlation between CNV and gene expression. |
: Open all plots for all cancer types
 |
|
 |
|
| Top |
| Gene-Gene Network Information |
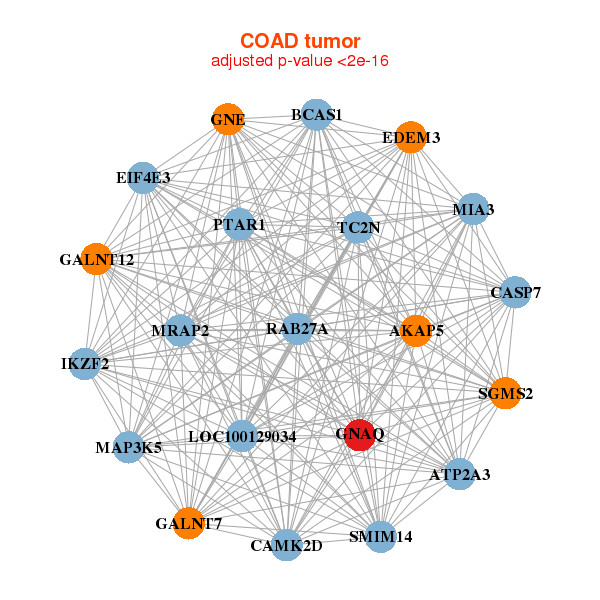
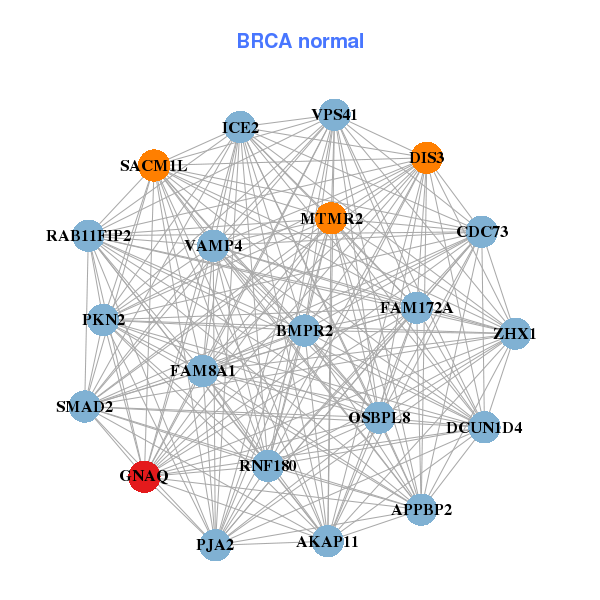
| * Co-Expression network figures were drawn using R package igraph. Only the top 20 genes with the highest correlations were shown. Red circle: input gene, orange circle: cell metabolism gene, sky circle: other gene |
: Open all plots for all cancer types
 |
| ||||
| ATF7,BAZ2B,BMPR2,PCNXL4,ERCC6L2,TMEM245,INIP, CREB1,DMXL1,FAM122A,GNAQ,ISCA1,RAB14,SP1, SPIN1,SPTLC1,STAM2,TSTD2,VPS13A,ZNF484,ZNF510 | AKAP11,APPBP2,BMPR2,CDC73,DCUN1D4,DIS3,FAM172A, FAM8A1,GNAQ,MTMR2,ICE2,OSBPL8,PJA2,PKN2, RAB11FIP2,RNF180,SACM1L,SMAD2,VAMP4,VPS41,ZHX1 | ||||
 |
| ||||
| AKAP5,ATP2A3,BCAS1,SMIM14,CAMK2D,CASP7,EDEM3, EIF4E3,GALNT12,GALNT7,GNAQ,GNE,IKZF2,LOC100129034, MAP3K5,MIA3,MRAP2,PTAR1,RAB27A,SGMS2,TC2N | AAK1,AFF4,B4GALT5,CLTC,CTNND1,CXorf23,ETV6, FNDC3B,FOXO3,GNAQ,HERC3,MAPK1,MED13,MXI1, NPEPPS,PAFAH1B1,PAK2,RAPGEF2,SLC38A1,SMCHD1,VCPIP1 |

| * Co-Expression network figures were drawn using R package igraph. Only the top 20 genes with the highest correlations were shown. Red circle: input gene, orange circle: cell metabolism gene, sky circle: other gene |
: Open all plots for all cancer types
| Top |
: Open all interacting genes' information including KEGG pathway for all interacting genes from DAVID
| Top |
| Pharmacological Information for GNAQ |
| DB Category | DB Name | DB's ID and Url link |
| Organism-specific databases | PharmGKB | PA174; -. |
| Organism-specific databases | CTD | 2776; -. |
| * Gene Centered Interaction Network. |
 |
| * Drug Centered Interaction Network. |
| DrugBank ID | Target Name | Drug Groups | Generic Name | Drug Centered Network | Drug Structure |
| DB00864 | guanine nucleotide binding protein (G protein), q polypeptide | approved; investigational | Tacrolimus |  |  |
| DB00171 | guanine nucleotide binding protein (G protein), q polypeptide | approved; nutraceutical | Adenosine triphosphate |  |  |
| DB00131 | guanine nucleotide binding protein (G protein), q polypeptide | approved; nutraceutical | Adenosine monophosphate | 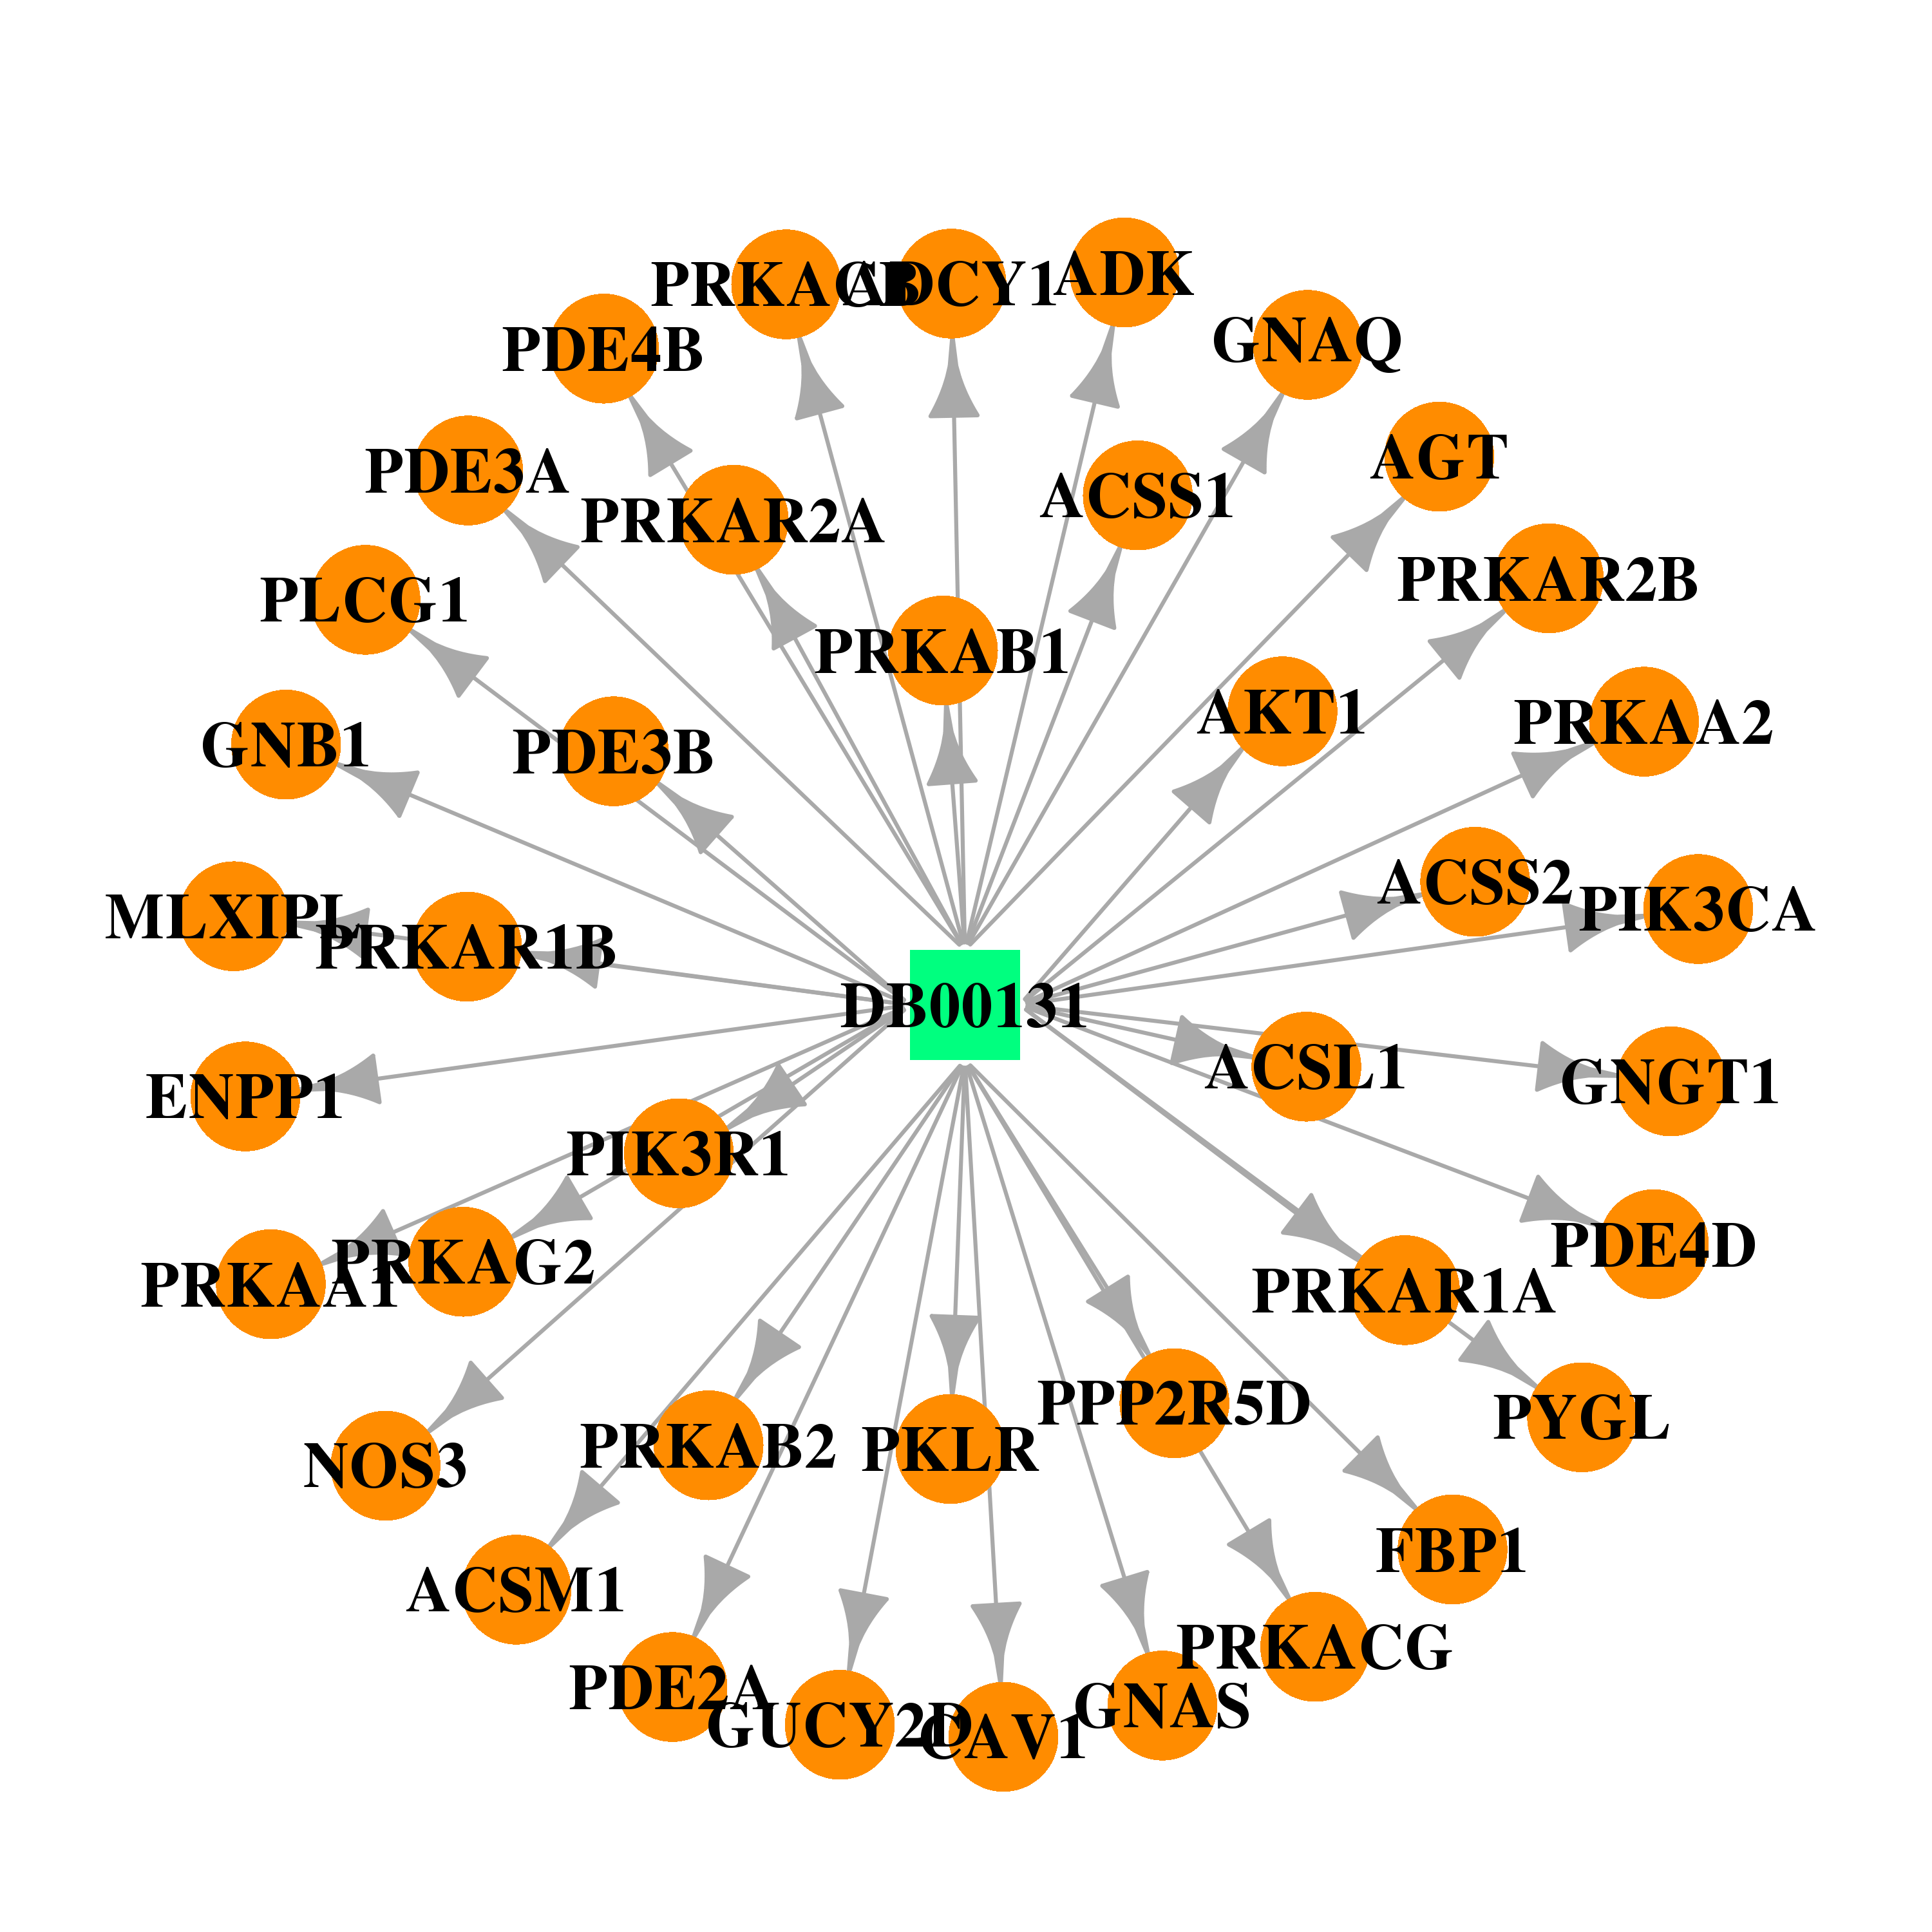 | 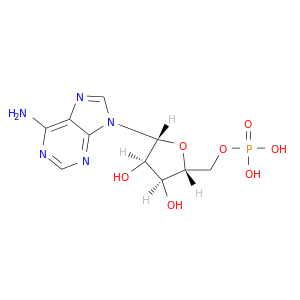 |
| DB00125 | guanine nucleotide binding protein (G protein), q polypeptide | approved; nutraceutical | L-Arginine |  |  |
| DB00155 | guanine nucleotide binding protein (G protein), q polypeptide | approved; nutraceutical | L-Citrulline | 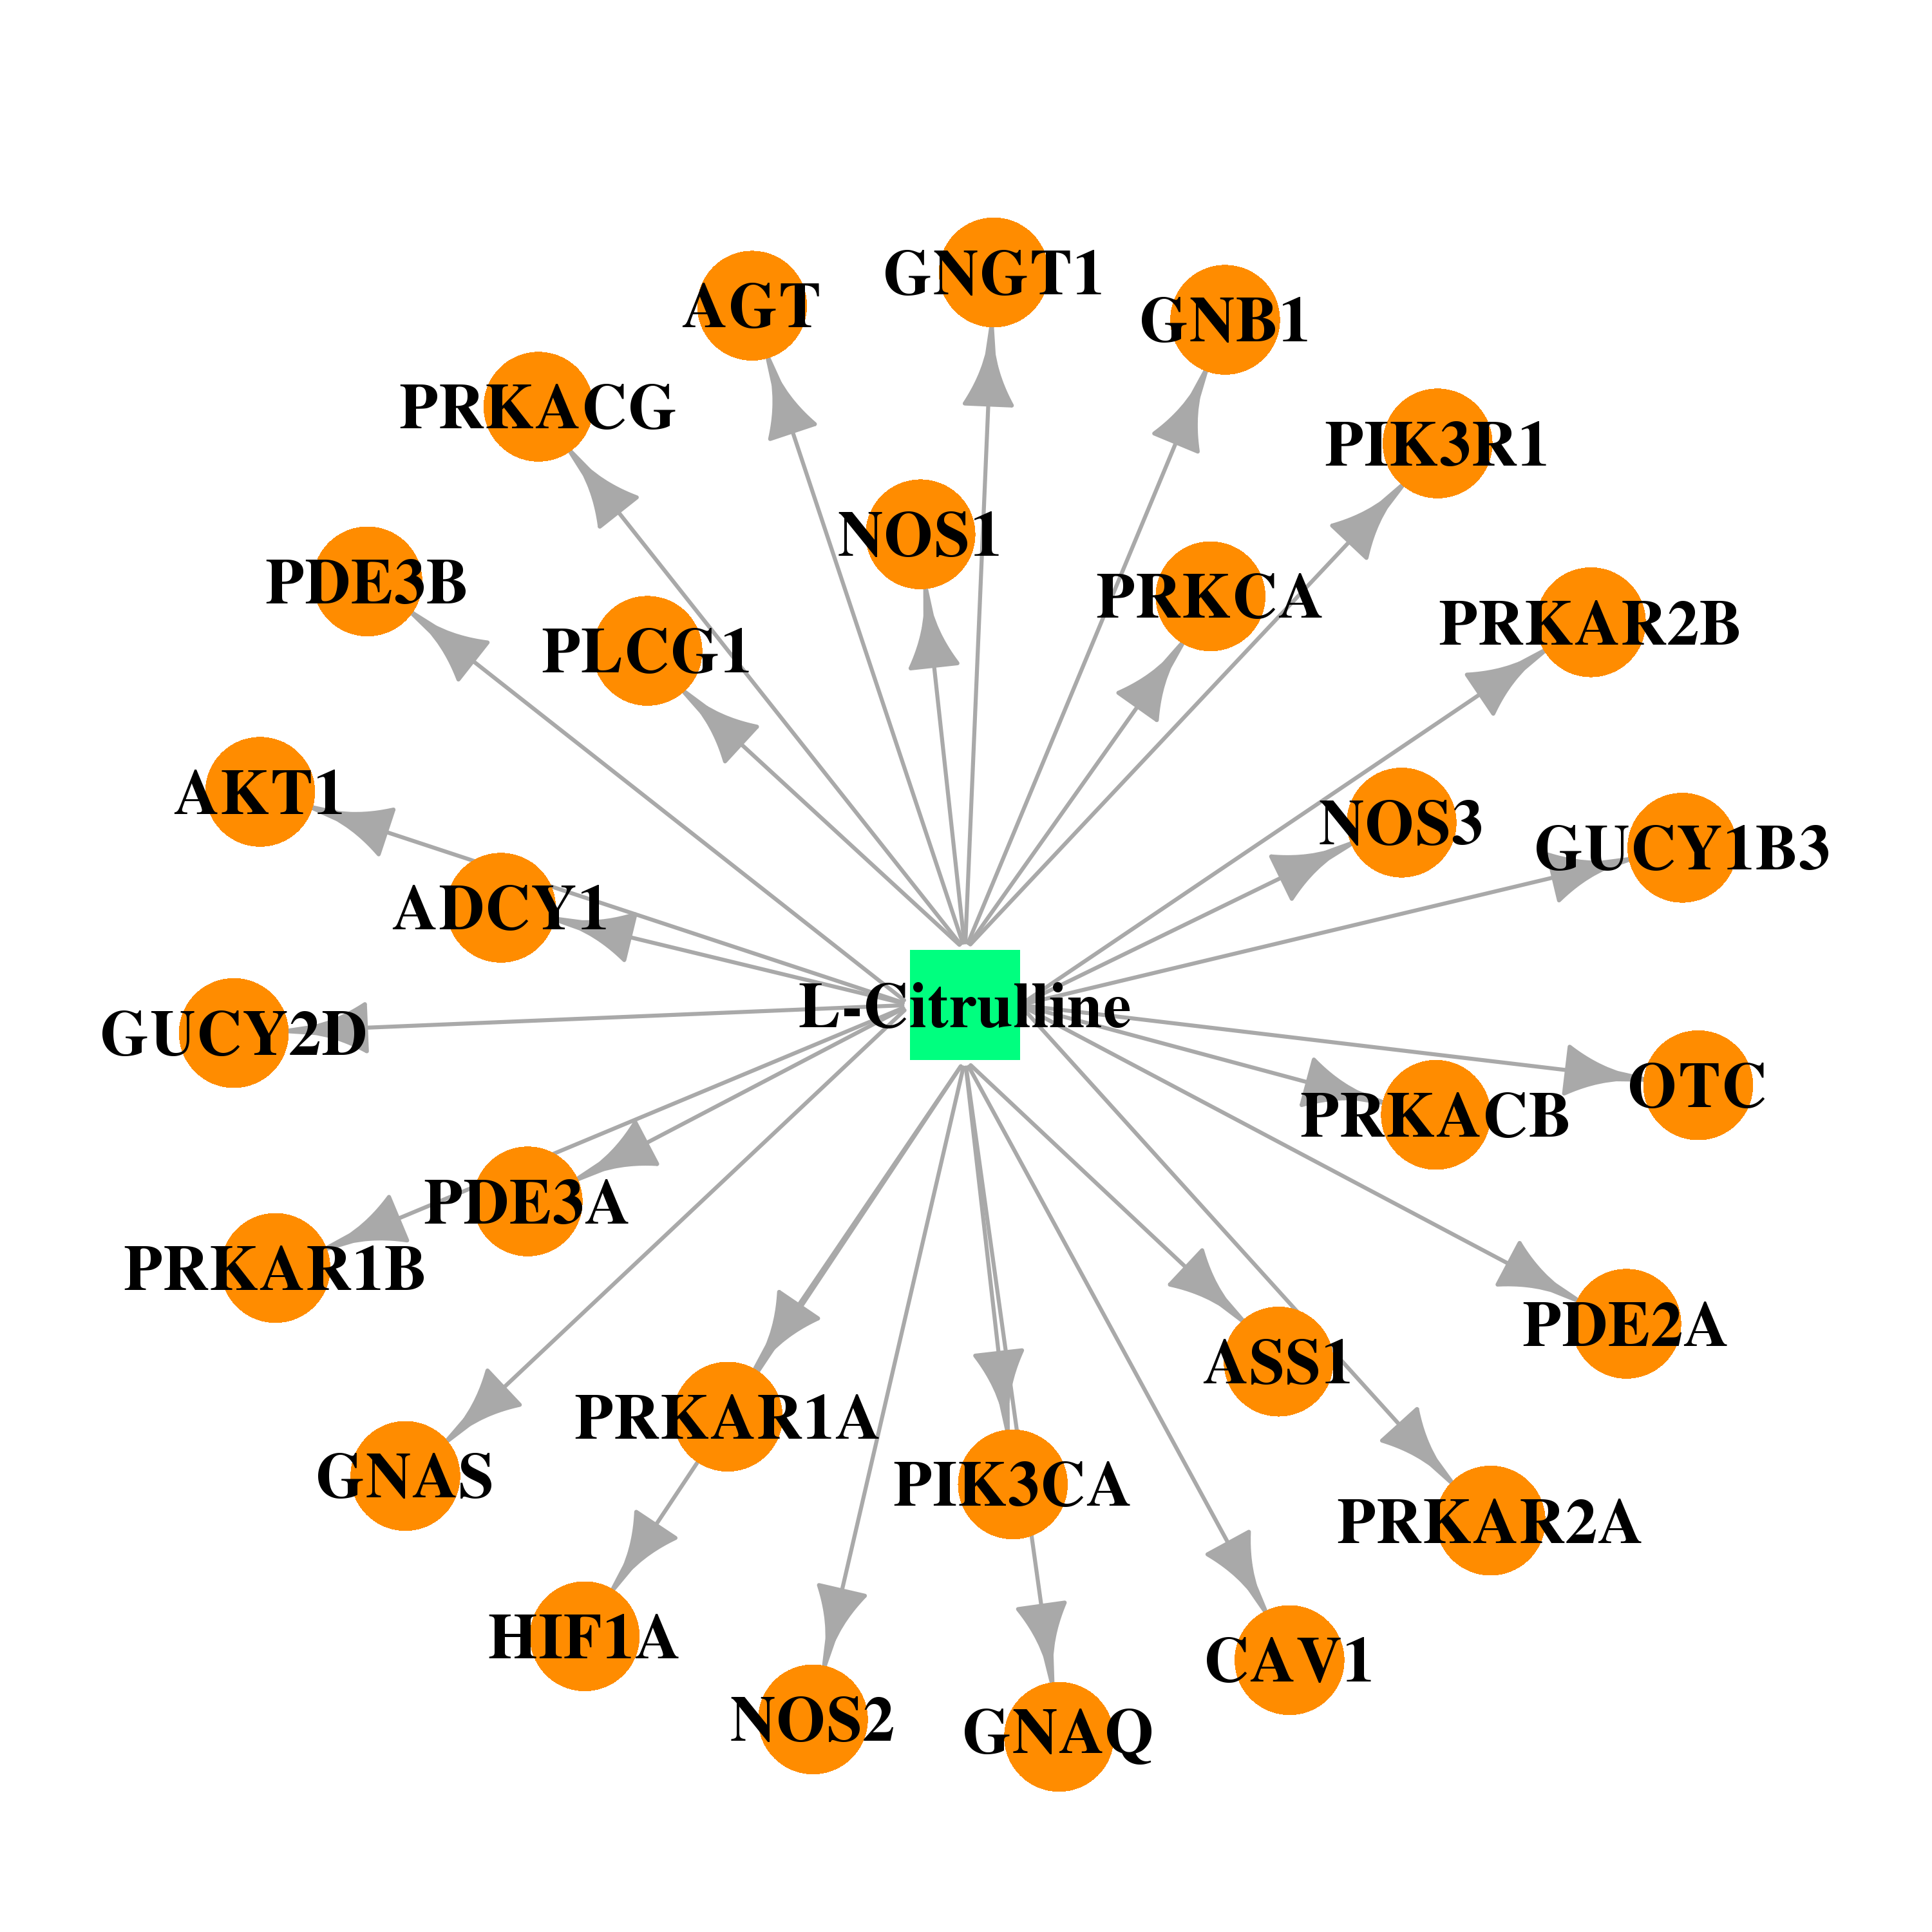 | 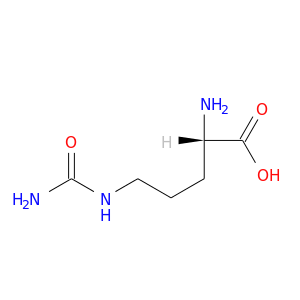 |
| DB00435 | guanine nucleotide binding protein (G protein), q polypeptide | approved | Nitric Oxide | 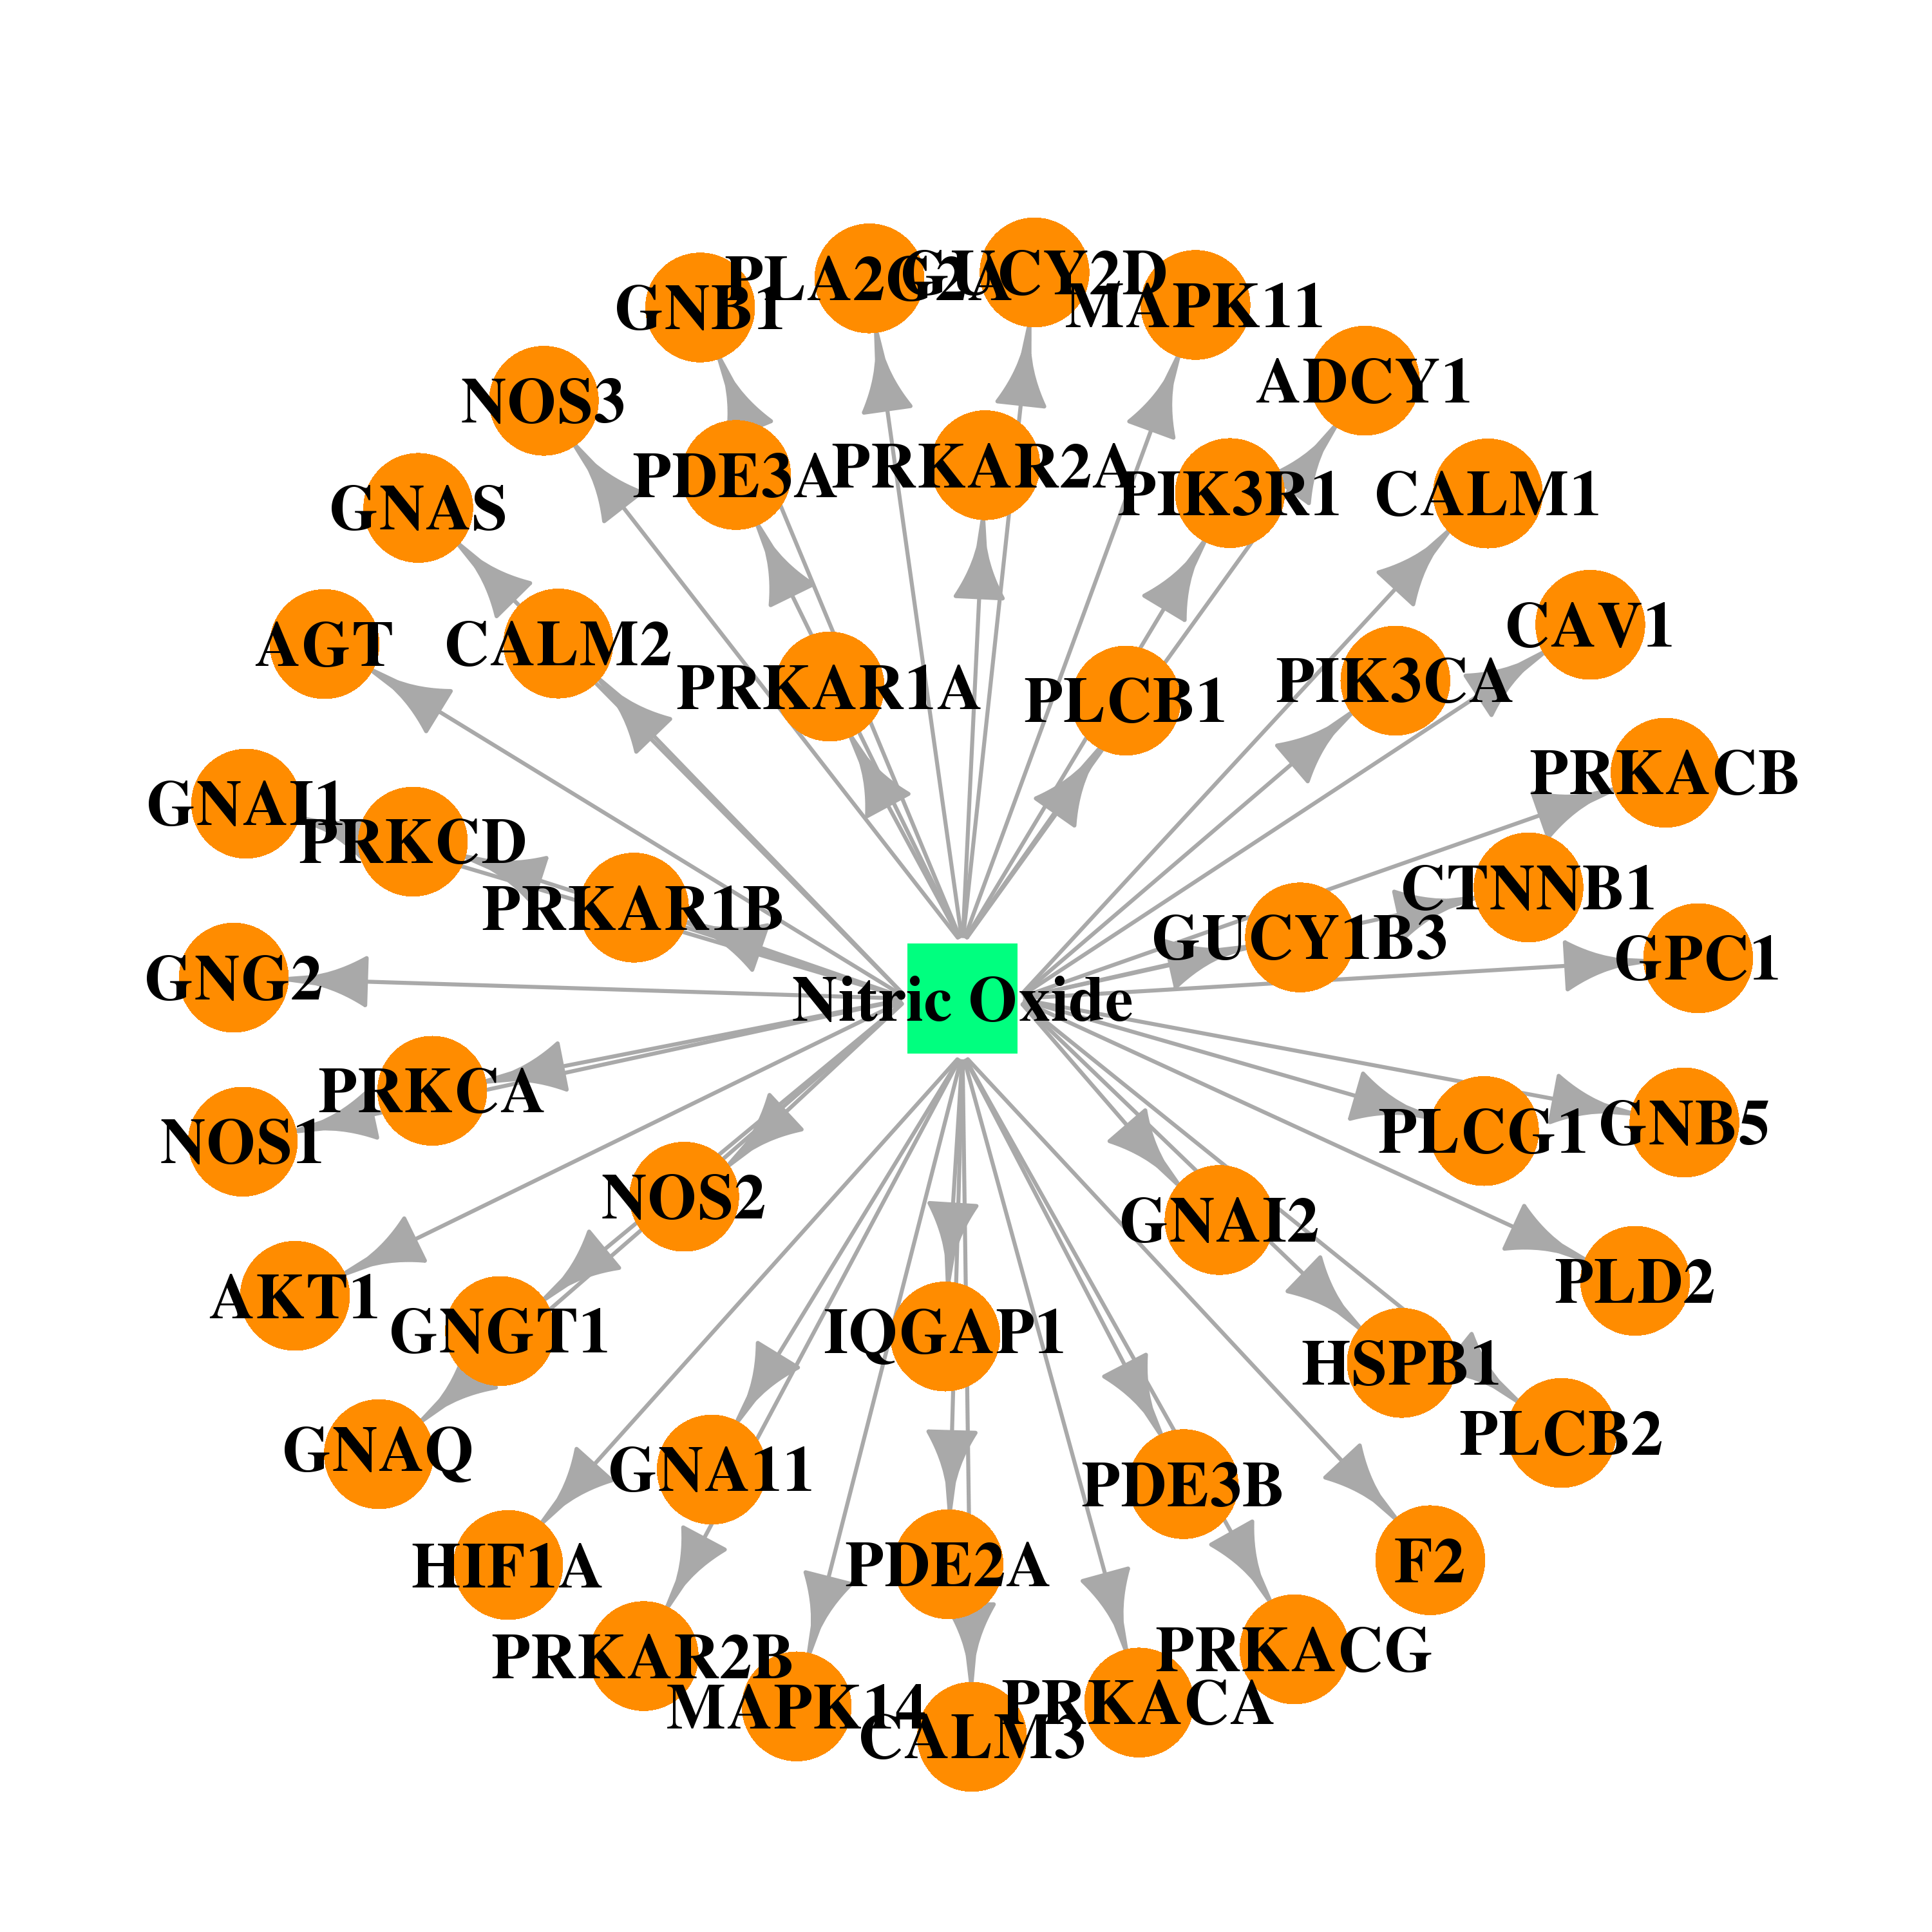 |  |
| DB00608 | guanine nucleotide binding protein (G protein), q polypeptide | approved | Chloroquine |  | 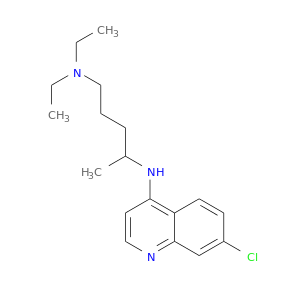 |
| Top |
| Cross referenced IDs for GNAQ |
| * We obtained these cross-references from Uniprot database. It covers 150 different DBs, 18 categories. http://www.uniprot.org/help/cross_references_section |
: Open all cross reference information
|
Copyright © 2016-Present - The Univsersity of Texas Health Science Center at Houston @ |