|
|||||||||||||||||||||||||||||||||||||||||||||||||||||||||||||||||||||||||||||||||||||||||||||||||||||||||||||||||||||||||||||||||||||||||||||||||||||||||||||||||||||||||||||||||||||||||||||||||||||||||||||||||||||||||||||||||||||||||||||||||||||||||||||||||||||||||||||||||||||||||||||||||||||||||||||||||||||||||||||||||||||||||||||||||||||||||||||||||||||||||||||||||||||||||||||||||||||||||||||||||||||||||||||||||||||||||||||||||||||||||||||||||||||||||||||||||||||||||||||||||||||||||||||||||||||||||||||||||||||||||||||
| |
| Phenotypic Information (metabolism pathway, cancer, disease, phenome) |
| |
| |
| Gene-Gene Network Information: Co-Expression Network, Interacting Genes & KEGG |
| |
|


| Gene Summary for GNAS |
| Basic gene info. | Gene symbol | GNAS |
| Gene name | GNAS complex locus | |
| Synonyms | AHO|C20orf45|GNAS1|GPSA|GSA|GSP|NESP|PHP1A|PHP1B|PHP1C|POH | |
| Cytomap | UCSC genome browser: 20q13.3 | |
| Genomic location | chr20 :57466425-57486250 | |
| Type of gene | protein-coding | |
| RefGenes | NM_000516.4, NM_001077488.2,NM_001077489.2,NM_001077490.1,NM_016592.2, NM_080425.2,NM_080426.2,NR_003259.1, | |
| Ensembl id | ENSG00000087460 | |
| Description | adenylate cyclase-stimulating G alpha proteinalternative gene product encoded by XL-exonextra large alphas proteinguanine nucleotide binding protein (G protein), alpha stimulating activity polypeptide 1guanine nucleotide regulatory proteinguanine nuc | |
| Modification date | 20141207 | |
| dbXrefs | MIM : 139320 | |
| HGNC : HGNC | ||
| Ensembl : ENSG00000087460 | ||
| HPRD : 00761 | ||
| Vega : OTTHUMG00000033069 | ||
| Protein | UniProt: O95467 go to UniProt's Cross Reference DB Table | |
| Expression | CleanEX: HS_GNAS | |
| BioGPS: 2778 | ||
| Gene Expression Atlas: ENSG00000087460 | ||
| The Human Protein Atlas: ENSG00000087460 | ||
| Pathway | NCI Pathway Interaction Database: GNAS | |
| KEGG: GNAS | ||
| REACTOME: GNAS | ||
| ConsensusPathDB | ||
| Pathway Commons: GNAS | ||
| Metabolism | MetaCyc: GNAS | |
| HUMANCyc: GNAS | ||
| Regulation | Ensembl's Regulation: ENSG00000087460 | |
| miRBase: chr20 :57,466,425-57,486,250 | ||
| TargetScan: NM_000516 | ||
| cisRED: ENSG00000087460 | ||
| Context | iHOP: GNAS | |
| cancer metabolism search in PubMed: GNAS | ||
| UCL Cancer Institute: GNAS | ||
| Assigned class in ccmGDB | B - This gene belongs to cancer gene. | |
| Top |
| Phenotypic Information for GNAS(metabolism pathway, cancer, disease, phenome) |
| Cancer | CGAP: GNAS |
| Familial Cancer Database: GNAS | |
| * This gene is included in those cancer gene databases. |
|
|
|
|
|
|
| |||||||||||||||||||||||||||||||||||||||||||||||||||||||||||||||||||||||||||||||||||||||||||||||||||||||||||||||||||||||||||||||||||||||||||||||||||||||||||||||||||||||||||||||||||||||||||||||||||||||||||||||||||||||||||||||||||||||||||||||||||||||||||||||||||||||||||||||||||||||||||||||||||||||||||||||||||||||||||||||||||||||||||||||||||||||||||||||||||||||||||||||||||||||||||||||||||||||||||||||||||||||||||||||||||||||||||||||||||||||||||||||||||||||||||||||||||||||||||||||||||||||||||||||||||||||||||||||||||||||
Oncogene 1 | Significant driver gene in | ||||||||||||||||||||||||||||||||||||||||||||||||||||||||||||||||||||||||||||||||||||||||||||||||||||||||||||||||||||||||||||||||||||||||||||||||||||||||||||||||||||||||||||||||||||||||||||||||||||||||||||||||||||||||||||||||||||||||||||||||||||||||||||||||||||||||||||||||||||||||||||||||||||||||||||||||||||||||||||||||||||||||||||||||||||||||||||||||||||||||||||||||||||||||||||||||||||||||||||||||||||||||||||||||||||||||||||||||||||||||||||||||||||||||||||||||||||||||||||||||||||||||||||||||||||||||||||||||||||||||||||
| cf) number; DB name 1 Oncogene; http://nar.oxfordjournals.org/content/35/suppl_1/D721.long, 2 Tumor Suppressor gene; https://bioinfo.uth.edu/TSGene/, 3 Cancer Gene Census; http://www.nature.com/nrc/journal/v4/n3/abs/nrc1299.html, 4 CancerGenes; http://nar.oxfordjournals.org/content/35/suppl_1/D721.long, 5 Network of Cancer Gene; http://ncg.kcl.ac.uk/index.php, 1Therapeutic Vulnerabilities in Cancer; http://cbio.mskcc.org/cancergenomics/statius/ |
| REACTOME_INTEGRATION_OF_ENERGY_METABOLISM | |
| OMIM | 139320; gene+phenotype. 219080; phenotype. 603233; phenotype. |
| Orphanet | |
| Disease | KEGG Disease: GNAS |
| MedGen: GNAS (Human Medical Genetics with Condition) | |
| ClinVar: GNAS | |
| Phenotype | MGI: GNAS (International Mouse Phenotyping Consortium) |
| PhenomicDB: GNAS | |
| Mutations for GNAS |
| * Under tables are showing count per each tissue to give us broad intuition about tissue specific mutation patterns.You can go to the detailed page for each mutation database's web site. |
| There's no structural variation information in COSMIC data for this gene. |
| * From mRNA Sanger sequences, Chitars2.0 arranged chimeric transcripts. This table shows GNAS related fusion information. |
| ID | Head Gene | Tail Gene | Accession | Gene_a | qStart_a | qEnd_a | Chromosome_a | tStart_a | tEnd_a | Gene_a | qStart_a | qEnd_a | Chromosome_a | tStart_a | tEnd_a |
| BP430864 | GNAS | 14 | 179 | 20 | 57484426 | 57484792 | FHIT | 169 | 189 | 3 | 59784430 | 59784450 | |
| BU783722 | SKA2 | 8 | 55 | 17 | 57232489 | 57232536 | GNAS | 52 | 603 | 20 | 57470666 | 57484752 | |
| CB111624 | ENC1 | 1 | 221 | 5 | 73936130 | 73936350 | GNAS | 220 | 349 | 20 | 57470667 | 57478638 | |
| BQ308361 | GNAS | 11 | 90 | 20 | 57485388 | 57485748 | EAF1 | 89 | 546 | 3 | 15469296 | 15475990 | |
| BP430141 | ALG6 | 7 | 356 | 1 | 63836543 | 63868001 | GNAS | 354 | 415 | 20 | 57486111 | 57486172 | |
| BC020762 | FGB | 1 | 932 | 4 | 155484167 | 155490429 | GNAS | 928 | 1599 | 20 | 57485039 | 57486243 | |
| BU159042 | LOC100130331 | 16 | 156 | 1 | 238090260 | 238090399 | GNAS | 150 | 535 | 20 | 57485858 | 57486243 | |
| CA405937 | ZBTB20 | 1 | 168 | 3 | 114693211 | 114819136 | GNAS | 165 | 498 | 20 | 57470665 | 57480476 | |
| BU789739 | GNAS | 16 | 515 | 20 | 57485737 | 57486236 | CHMP2A | 515 | 612 | 19 | 59066354 | 59066451 | |
| CA433888 | NDUFS6 | 18 | 91 | 5 | 1816089 | 1816162 | GNAS | 87 | 296 | 20 | 57485431 | 57485921 | |
| BM802817 | WDR33 | 1 | 139 | 2 | 128568583 | 128568721 | GNAS | 136 | 976 | 20 | 57470666 | 57485430 | |
| BE171170 | GNAS | 26 | 209 | 20 | 57484609 | 57485042 | GNAS | 203 | 268 | 20 | 57485070 | 57485136 | |
| BF934290 | TUBGCP3 | 13 | 178 | 13 | 113200013 | 113200178 | GNAS | 178 | 310 | 20 | 57485050 | 57485434 | |
| BU960781 | GNAS | 175 | 241 | 20 | 57486024 | 57486090 | GNAS | 235 | 410 | 20 | 57486072 | 57486247 | |
| BG992511 | KIAA0319L | 30 | 315 | 1 | 35997268 | 35997554 | GNAS | 310 | 580 | 20 | 57478772 | 57484447 | |
| CN315171 | IRF3 | 3 | 442 | 19 | 50164305 | 50164744 | GNAS | 438 | 749 | 20 | 57478055 | 57478366 | |
| BF339151 | GNAS | 42 | 148 | 20 | 57485746 | 57485852 | GNAS | 146 | 554 | 20 | 57485838 | 57486247 | |
| BF354702 | GNAS | 19 | 107 | 20 | 57476505 | 57476593 | GNAS | 102 | 330 | 20 | 57475136 | 57475363 | |
| AB023182 | GNAS | 1 | 88 | 20 | 57472211 | 57472298 | STK38L | 86 | 5181 | 12 | 27397078 | 27478888 | |
| AW377567 | LAPTM4A | 1 | 422 | 2 | 20234103 | 20240703 | GNAS | 418 | 655 | 20 | 57484577 | 57485064 | |
| AA773408 | PTGS1 | 1 | 203 | 9 | 125155143 | 125155344 | GNAS | 203 | 422 | 20 | 57470930 | 57471148 | |
| CN403028 | HAPLN1 | 1 | 143 | 5 | 83016606 | 83016748 | GNAS | 140 | 600 | 20 | 57470665 | 57484459 | |
| BU070138 | GNAS | 39 | 276 | 20 | 57485045 | 57485815 | TRIM61 | 277 | 522 | 4 | 165878136 | 165878381 | |
| BQ720919 | GNAS | 1 | 167 | 20 | 57466514 | 57466681 | GNAS | 158 | 367 | 20 | 57466767 | 57470722 | |
| CV809249 | LOC728190 | 1 | 83 | 10 | 89048197 | 89086413 | GNAS | 70 | 469 | 20 | 57470659 | 57480532 | |
| BF087649 | HEG1 | 1 | 251 | 3 | 124756747 | 124756997 | GNAS | 251 | 491 | 20 | 57484473 | 57485060 | |
| BP388116 | PTPRN | 1 | 213 | 2 | 220154365 | 220154577 | GNAS | 214 | 311 | 20 | 57485990 | 57486087 | |
| BP249353 | CUX1 | 1 | 460 | 7 | 101813761 | 101838885 | GNAS | 458 | 581 | 20 | 57470666 | 57478633 | |
| Top |
| Mutation type/ Tissue ID | brca | cns | cerv | endome | haematopo | kidn | Lintest | liver | lung | ns | ovary | pancre | prost | skin | stoma | thyro | urina | |||
| Total # sample | 3 | 1 | ||||||||||||||||||
| GAIN (# sample) | 3 | |||||||||||||||||||
| LOSS (# sample) | 1 |
| cf) Tissue ID; Tissue type (1; Breast, 2; Central_nervous_system, 3; Cervix, 4; Endometrium, 5; Haematopoietic_and_lymphoid_tissue, 6; Kidney, 7; Large_intestine, 8; Liver, 9; Lung, 10; NS, 11; Ovary, 12; Pancreas, 13; Prostate, 14; Skin, 15; Stomach, 16; Thyroid, 17; Urinary_tract) |
| Top |
|
 |
| Top |
| Stat. for Non-Synonymous SNVs (# total SNVs=645) | (# total SNVs=13) |
 |  |
(# total SNVs=0) | (# total SNVs=3) |
 |
| Top |
| * When you move the cursor on each content, you can see more deailed mutation information on the Tooltip. Those are primary_site,primary_histology,mutation(aa),pubmedID. |
| GRCh37 position | Mutation(aa) | Unique sampleID count |
| chr20:57484420-57484420 | p.R201C | 436 |
| chr20:57484421-57484421 | p.R201H | 309 |
| chr20:57484596-57484596 | p.Q227L | 25 |
| chr20:57485134-57485134 | p.D323A | 11 |
| chr20:57484597-57484597 | p.Q227H | 8 |
| chr20:57478836-57478836 | p.D141G | 6 |
| chr20:57480483-57480483 | p.R160C | 6 |
| chr20:57480494-57480494 | p.Y163* | 5 |
| chr20:57485819-57485819 | p.R374C | 4 |
| chr20:57485864-57485864 | p.R389C | 3 |
| Top |
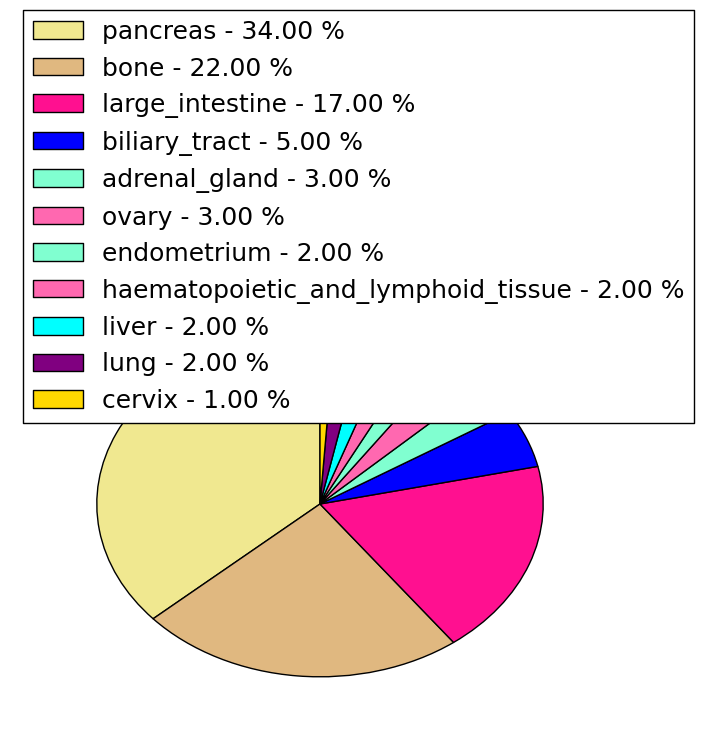
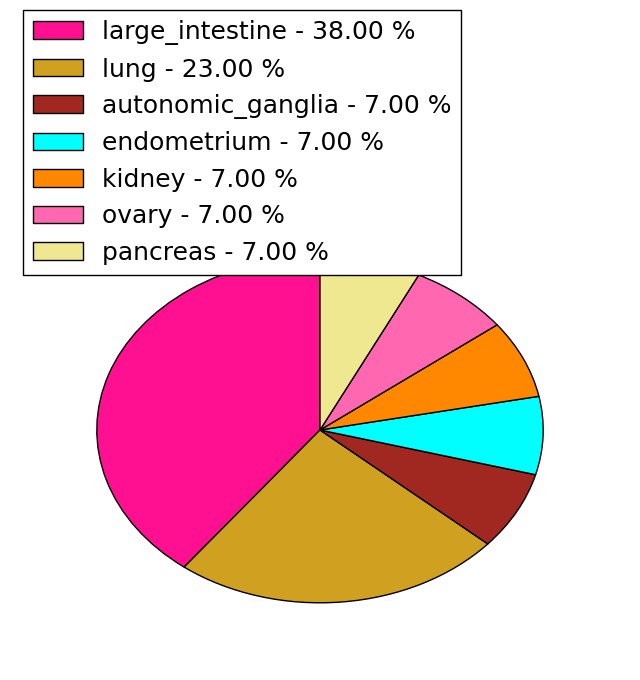
|
 |
| Point Mutation/ Tissue ID | 1 | 2 | 3 | 4 | 5 | 6 | 7 | 8 | 9 | 10 | 11 | 12 | 13 | 14 | 15 | 16 | 17 | 18 | 19 | 20 |
| # sample | 5 | 3 | 26 | 2 | 5 | 4 | 19 | 11 | 3 | 1 | 1 | 23 | 22 | 3 | 20 | |||||
| # mutation | 5 | 3 | 22 | 3 | 6 | 4 | 19 | 11 | 3 | 1 | 1 | 27 | 28 | 3 | 27 | |||||
| nonsynonymous SNV | 4 | 3 | 18 | 3 | 6 | 3 | 14 | 7 | 2 | 1 | 21 | 23 | 3 | 25 | ||||||
| synonymous SNV | 1 | 4 | 1 | 5 | 4 | 1 | 1 | 6 | 5 | 2 |
| cf) Tissue ID; Tissue type (1; BLCA[Bladder Urothelial Carcinoma], 2; BRCA[Breast invasive carcinoma], 3; CESC[Cervical squamous cell carcinoma and endocervical adenocarcinoma], 4; COAD[Colon adenocarcinoma], 5; GBM[Glioblastoma multiforme], 6; Glioma Low Grade, 7; HNSC[Head and Neck squamous cell carcinoma], 8; KICH[Kidney Chromophobe], 9; KIRC[Kidney renal clear cell carcinoma], 10; KIRP[Kidney renal papillary cell carcinoma], 11; LAML[Acute Myeloid Leukemia], 12; LUAD[Lung adenocarcinoma], 13; LUSC[Lung squamous cell carcinoma], 14; OV[Ovarian serous cystadenocarcinoma ], 15; PAAD[Pancreatic adenocarcinoma], 16; PRAD[Prostate adenocarcinoma], 17; SKCM[Skin Cutaneous Melanoma], 18:STAD[Stomach adenocarcinoma], 19:THCA[Thyroid carcinoma], 20:UCEC[Uterine Corpus Endometrial Carcinoma]) |
| Top |
| * We represented just top 10 SNVs. When you move the cursor on each content, you can see more deailed mutation information on the Tooltip. Those are primary_site, primary_histology, mutation(aa), pubmedID. |
| Genomic Position | Mutation(aa) | Unique sampleID count |
| chr20:57478836 | p.D126G,GNAS | 5 |
| chr20:57429085 | p.S193L | 3 |
| chr20:57474005 | p.E74E,GNAS | 2 |
| chr20:57415590 | p.R341C,GNAS | 2 |
| chr20:57484420 | p.P206S,GNAS | 2 |
| chr20:57415311 | p.F107F | 2 |
| chr20:57415891 | p.R359C,GNAS | 2 |
| chr20:57485765 | p.R374C,GNAS | 2 |
| chr20:57484421 | p.R145C,GNAS | 2 |
| chr20:57415482 | p.R244C | 2 |
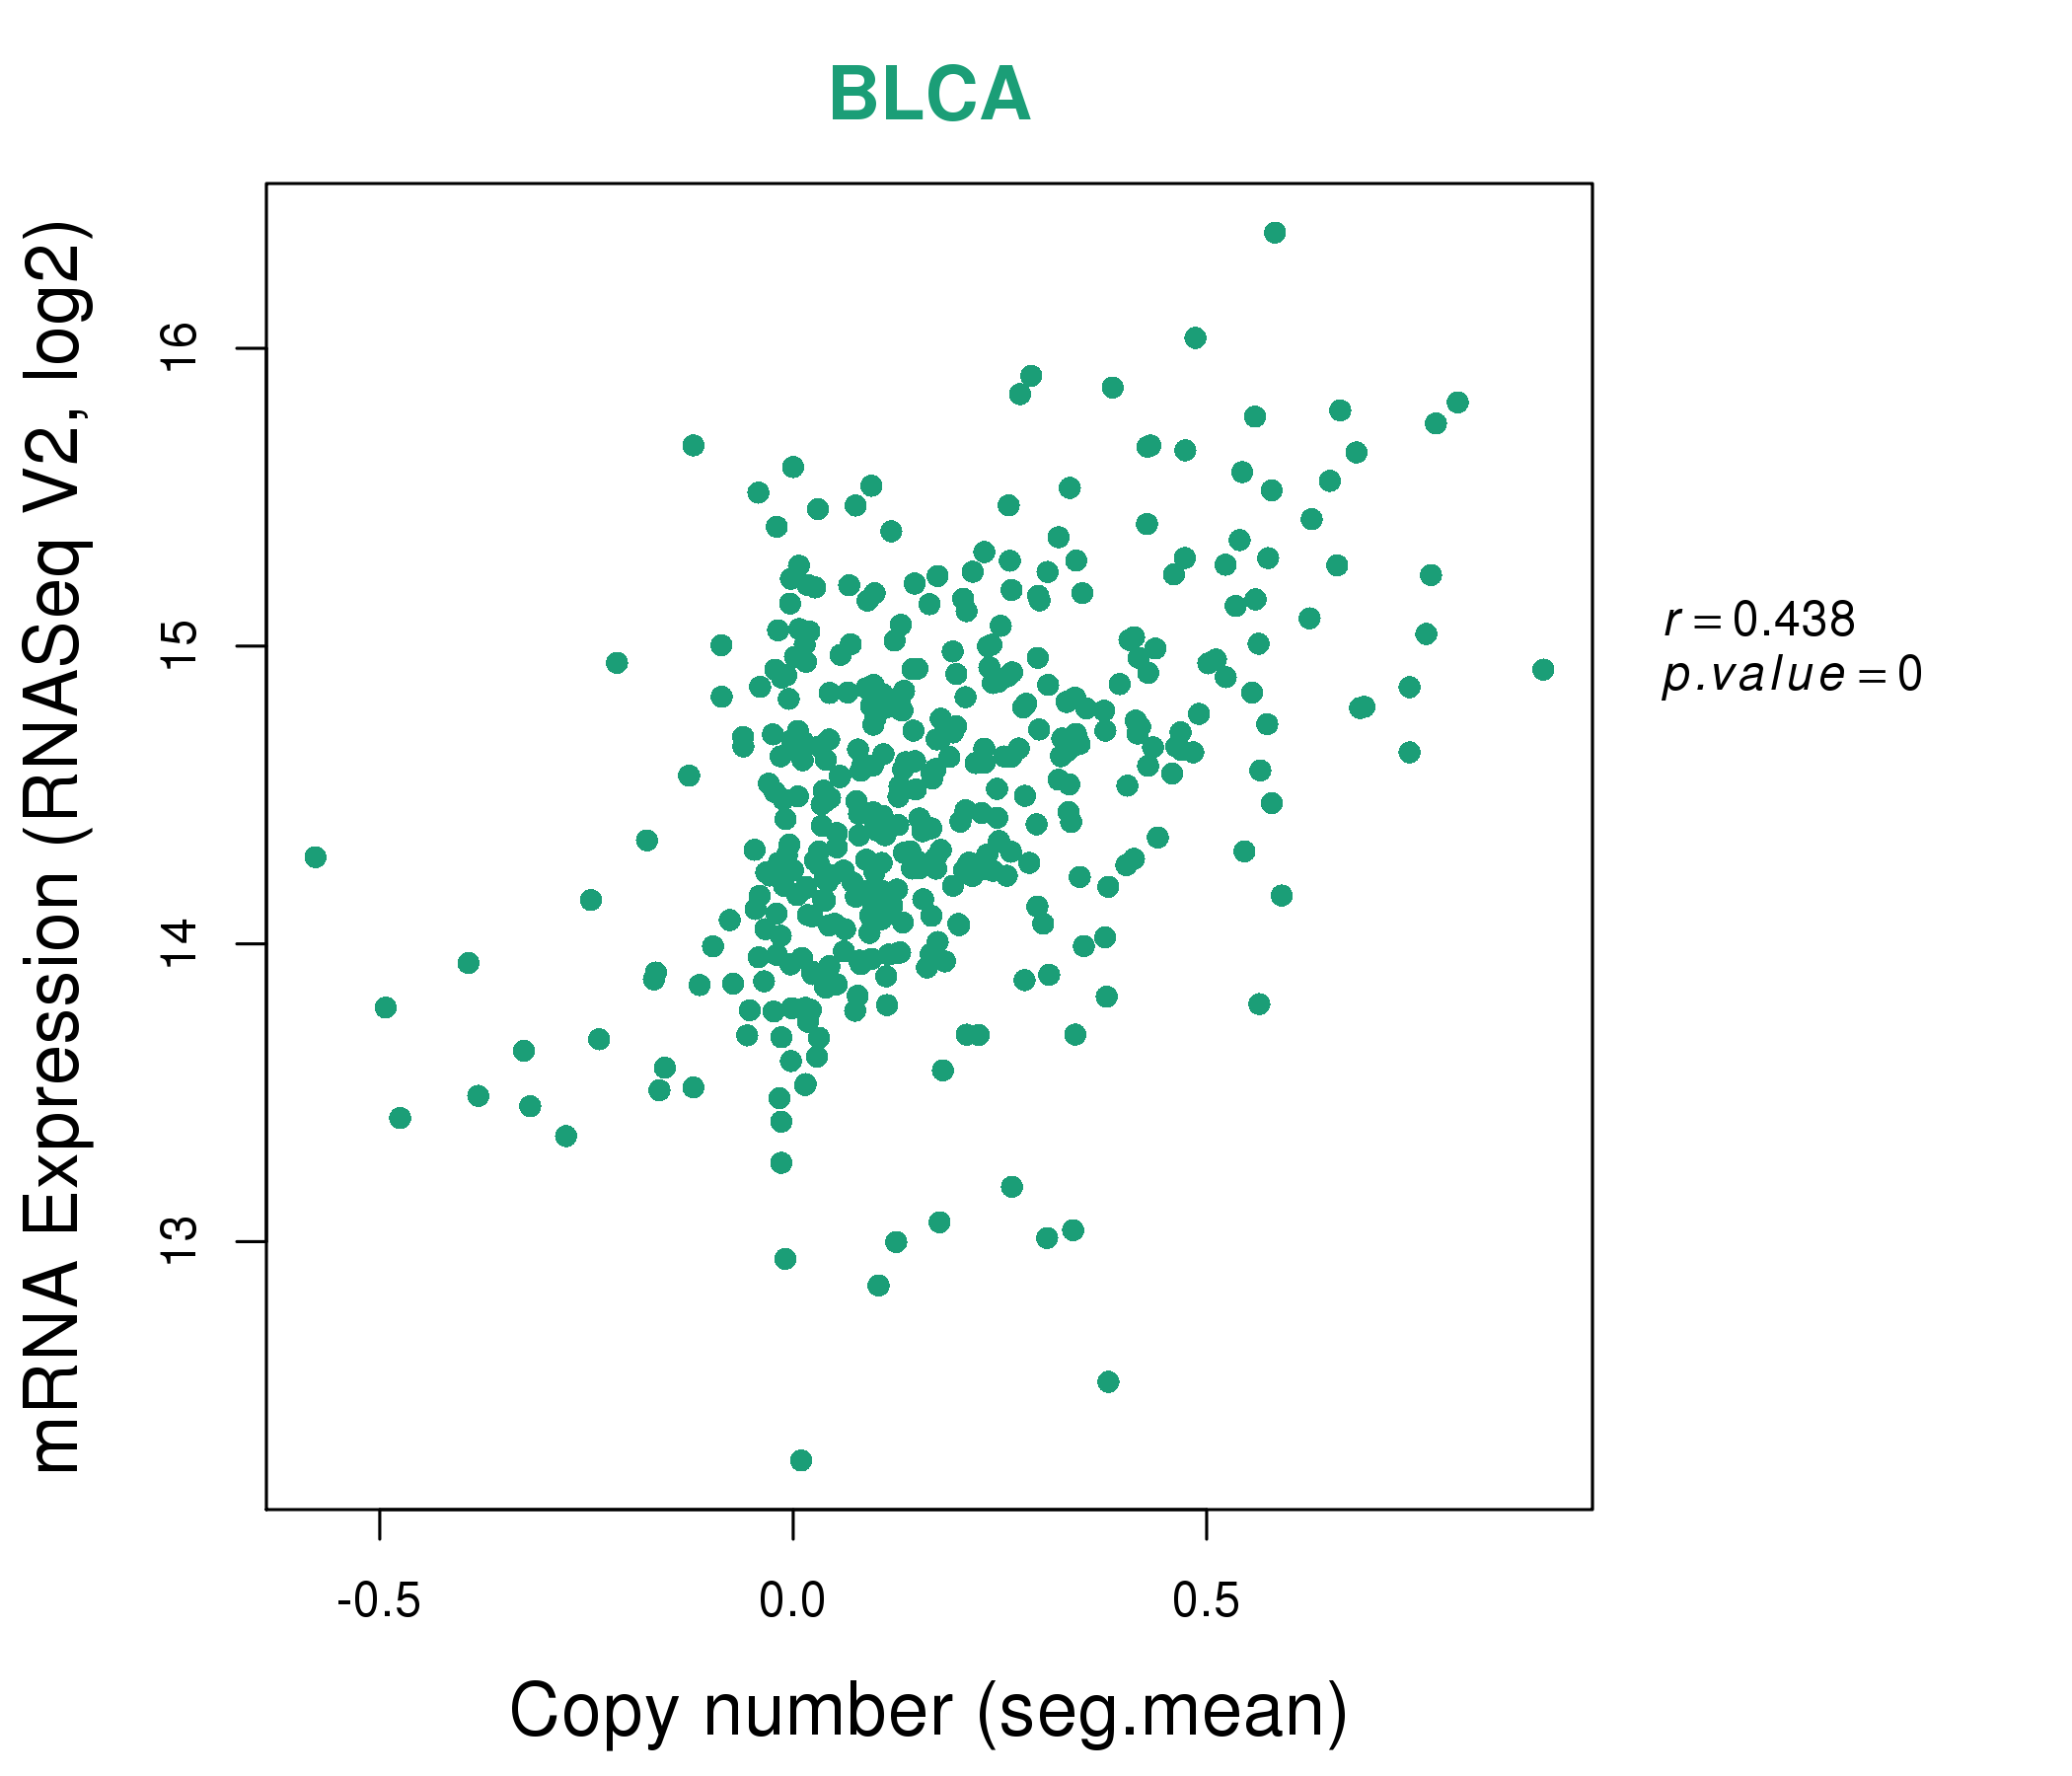
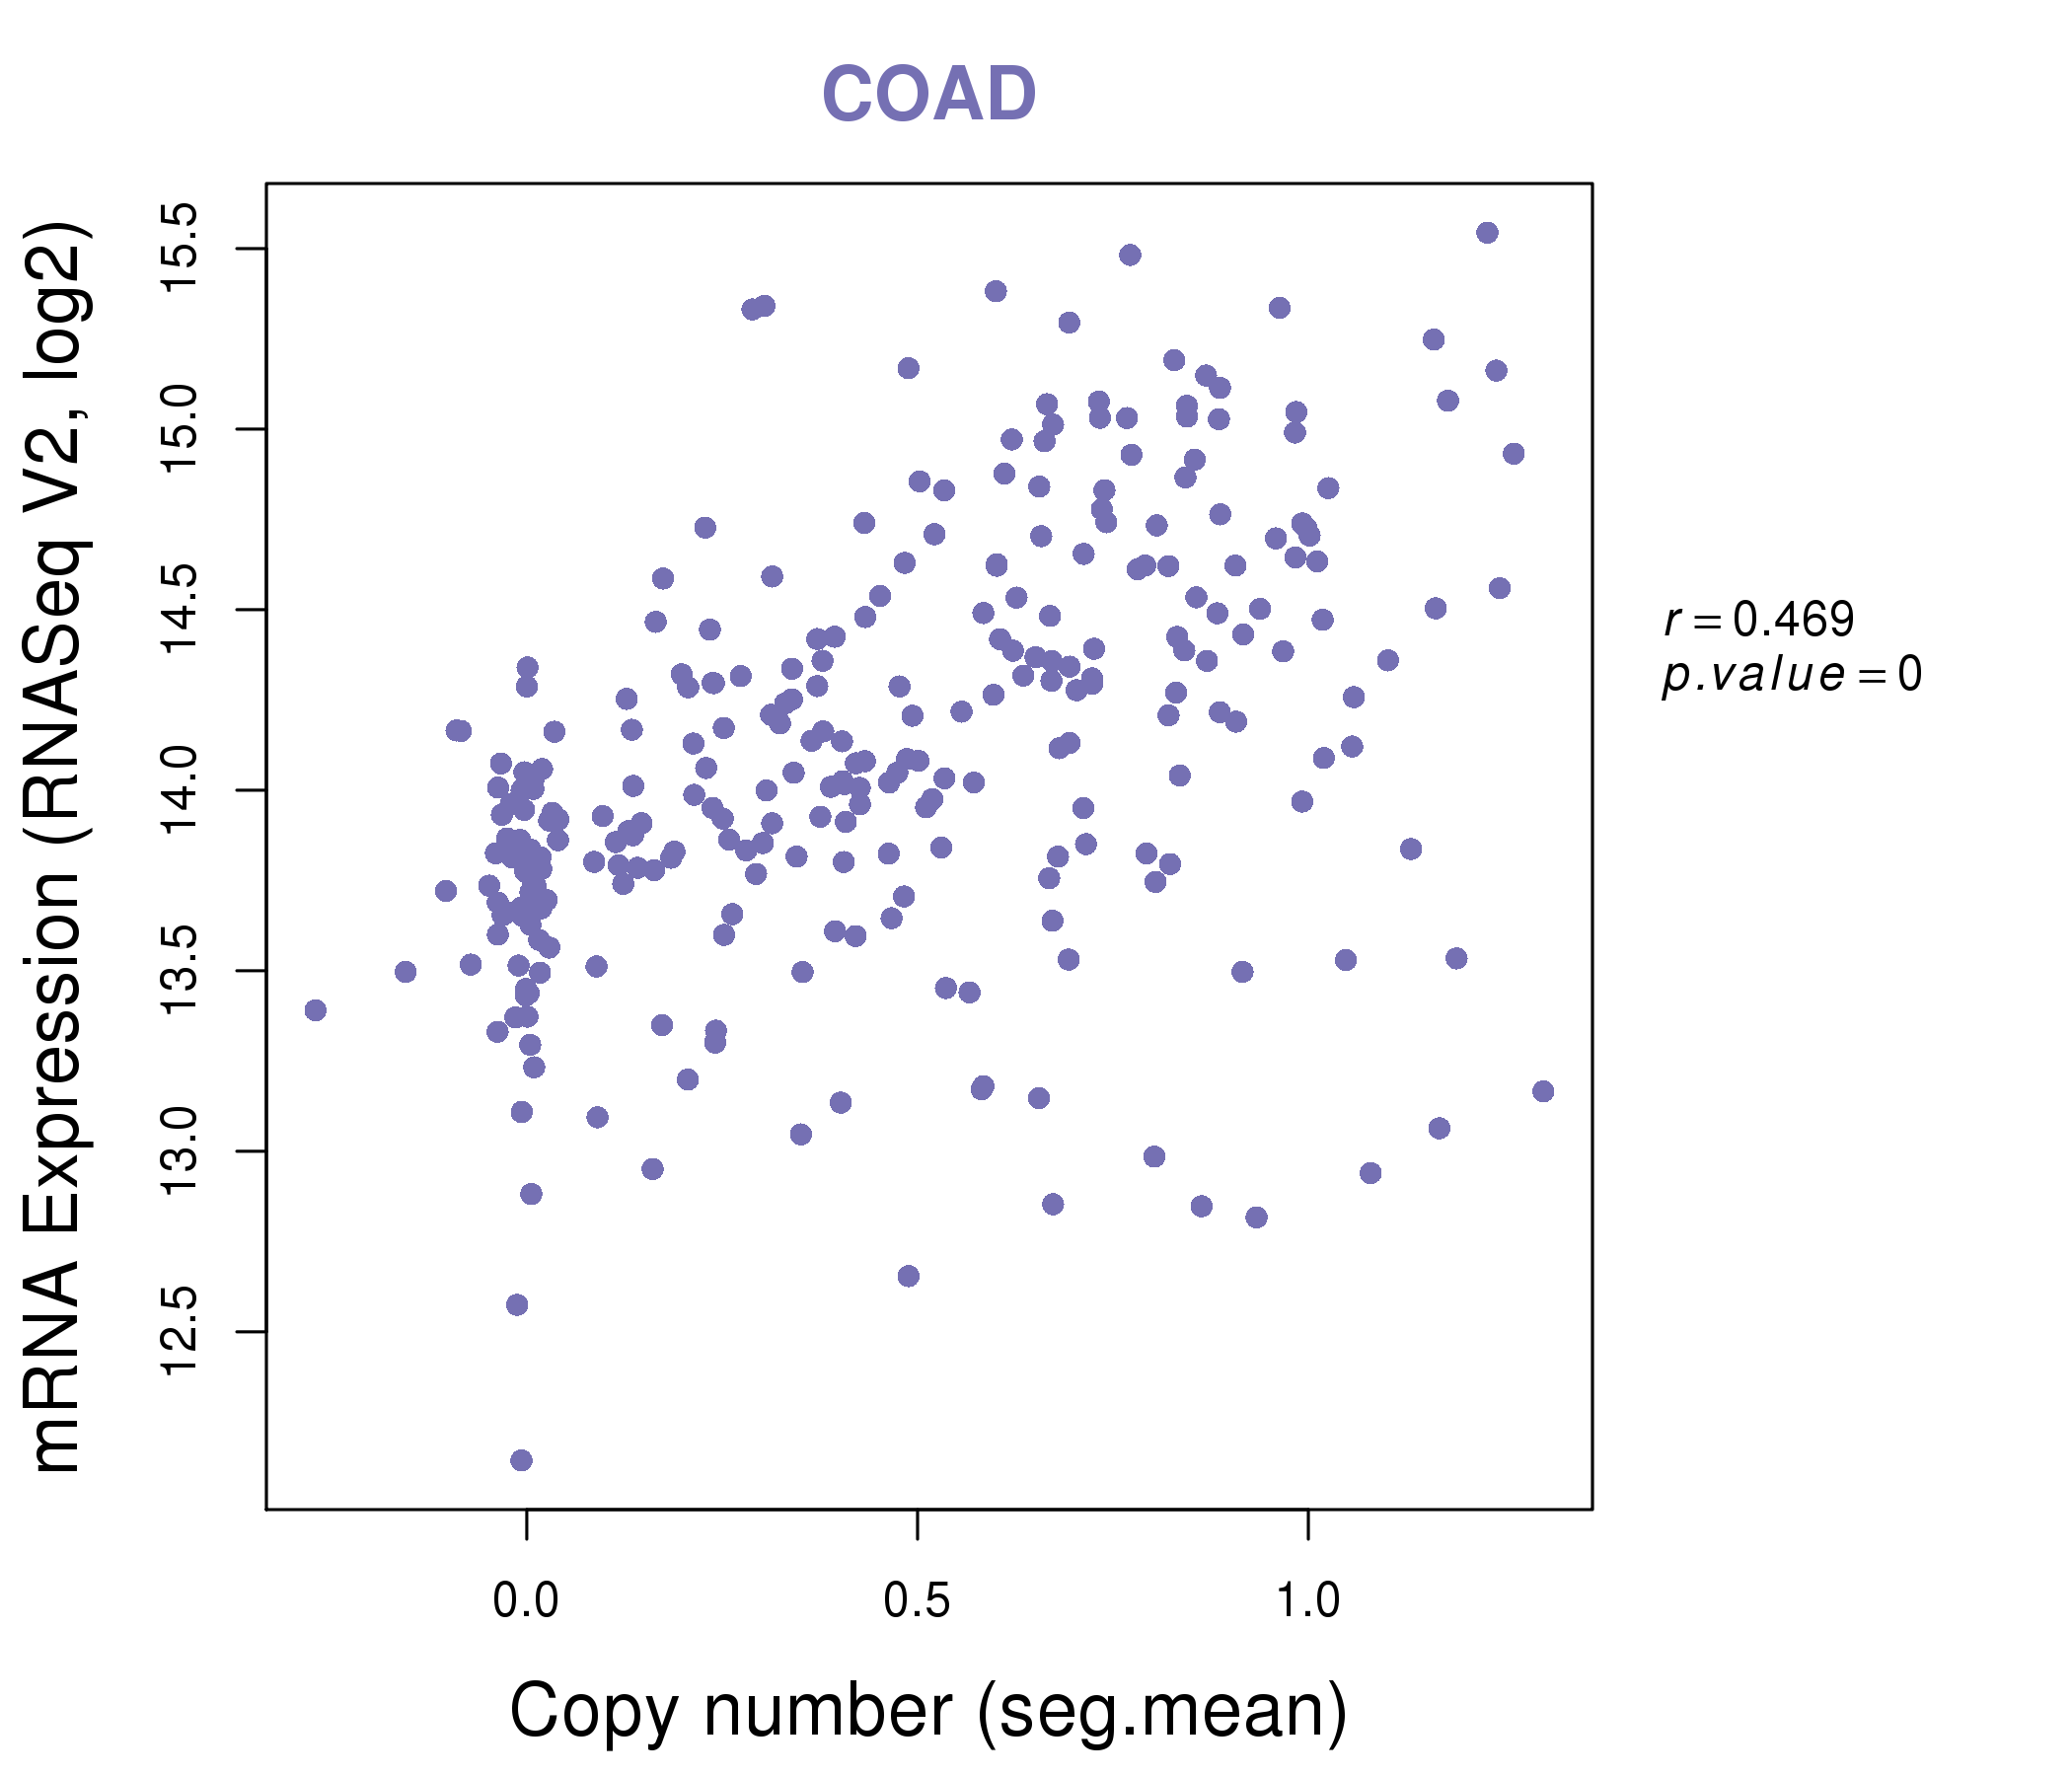
| * Copy number data were extracted from TCGA using R package TCGA-Assembler. The URLs of all public data files on TCGA DCC data server were gathered on Jan-05-2015. Function ProcessCNAData in TCGA-Assembler package was used to obtain gene-level copy number value which is calculated as the average copy number of the genomic region of a gene. |
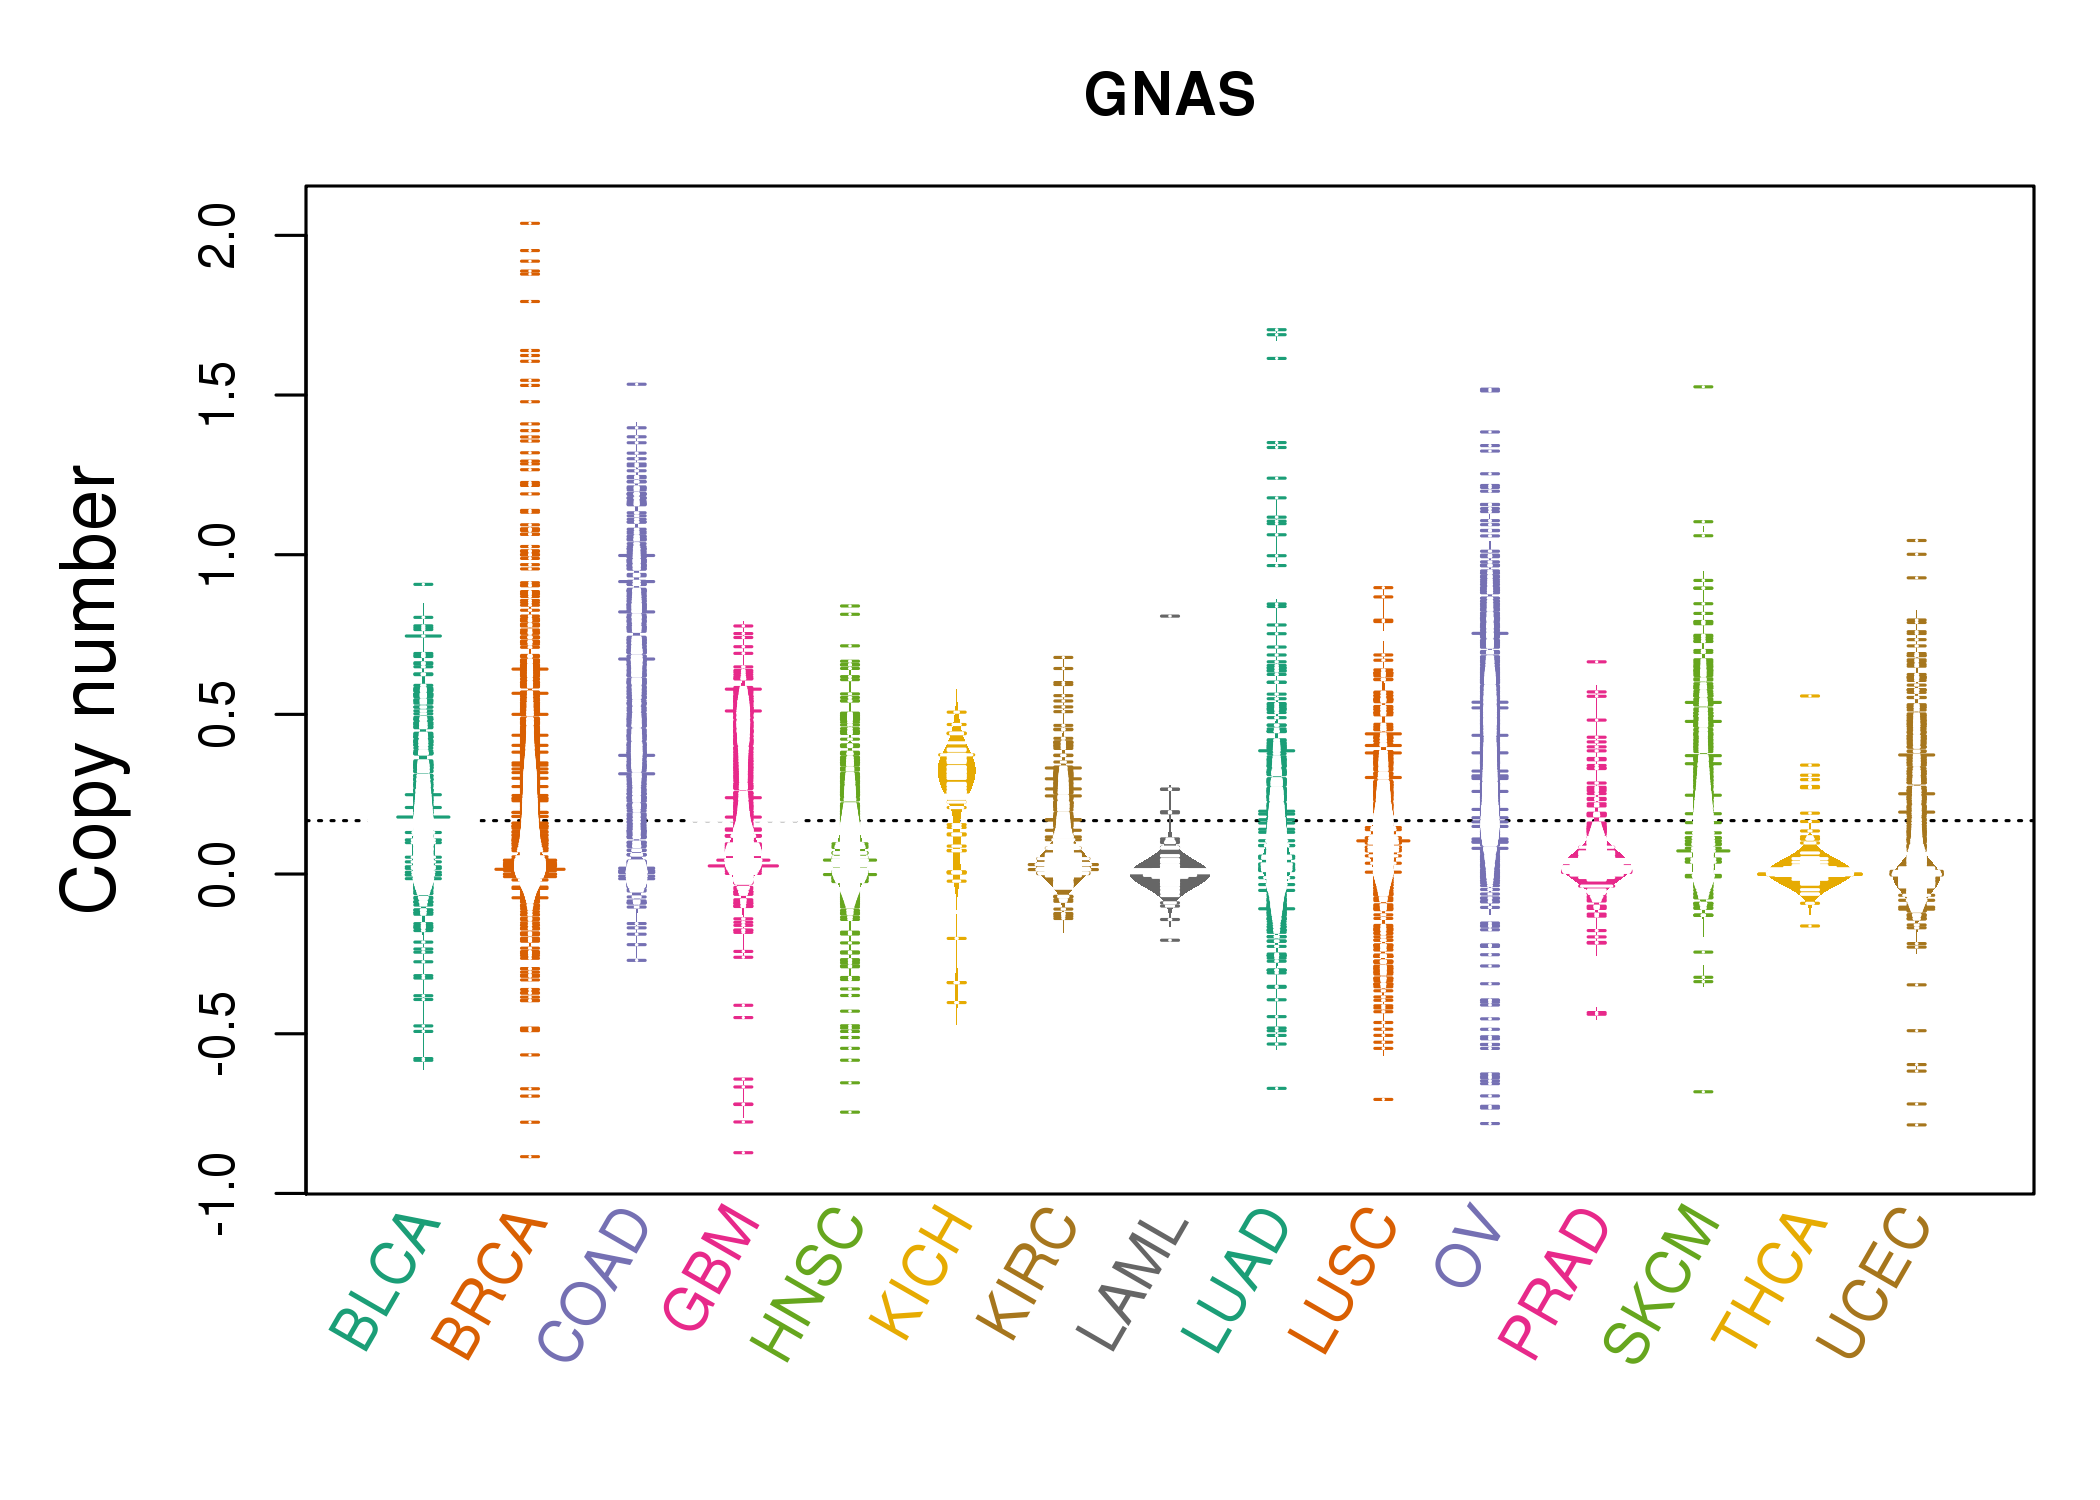 |
| cf) Tissue ID[Tissue type]: BLCA[Bladder Urothelial Carcinoma], BRCA[Breast invasive carcinoma], CESC[Cervical squamous cell carcinoma and endocervical adenocarcinoma], COAD[Colon adenocarcinoma], GBM[Glioblastoma multiforme], Glioma Low Grade, HNSC[Head and Neck squamous cell carcinoma], KICH[Kidney Chromophobe], KIRC[Kidney renal clear cell carcinoma], KIRP[Kidney renal papillary cell carcinoma], LAML[Acute Myeloid Leukemia], LUAD[Lung adenocarcinoma], LUSC[Lung squamous cell carcinoma], OV[Ovarian serous cystadenocarcinoma ], PAAD[Pancreatic adenocarcinoma], PRAD[Prostate adenocarcinoma], SKCM[Skin Cutaneous Melanoma], STAD[Stomach adenocarcinoma], THCA[Thyroid carcinoma], UCEC[Uterine Corpus Endometrial Carcinoma] |
| Top |
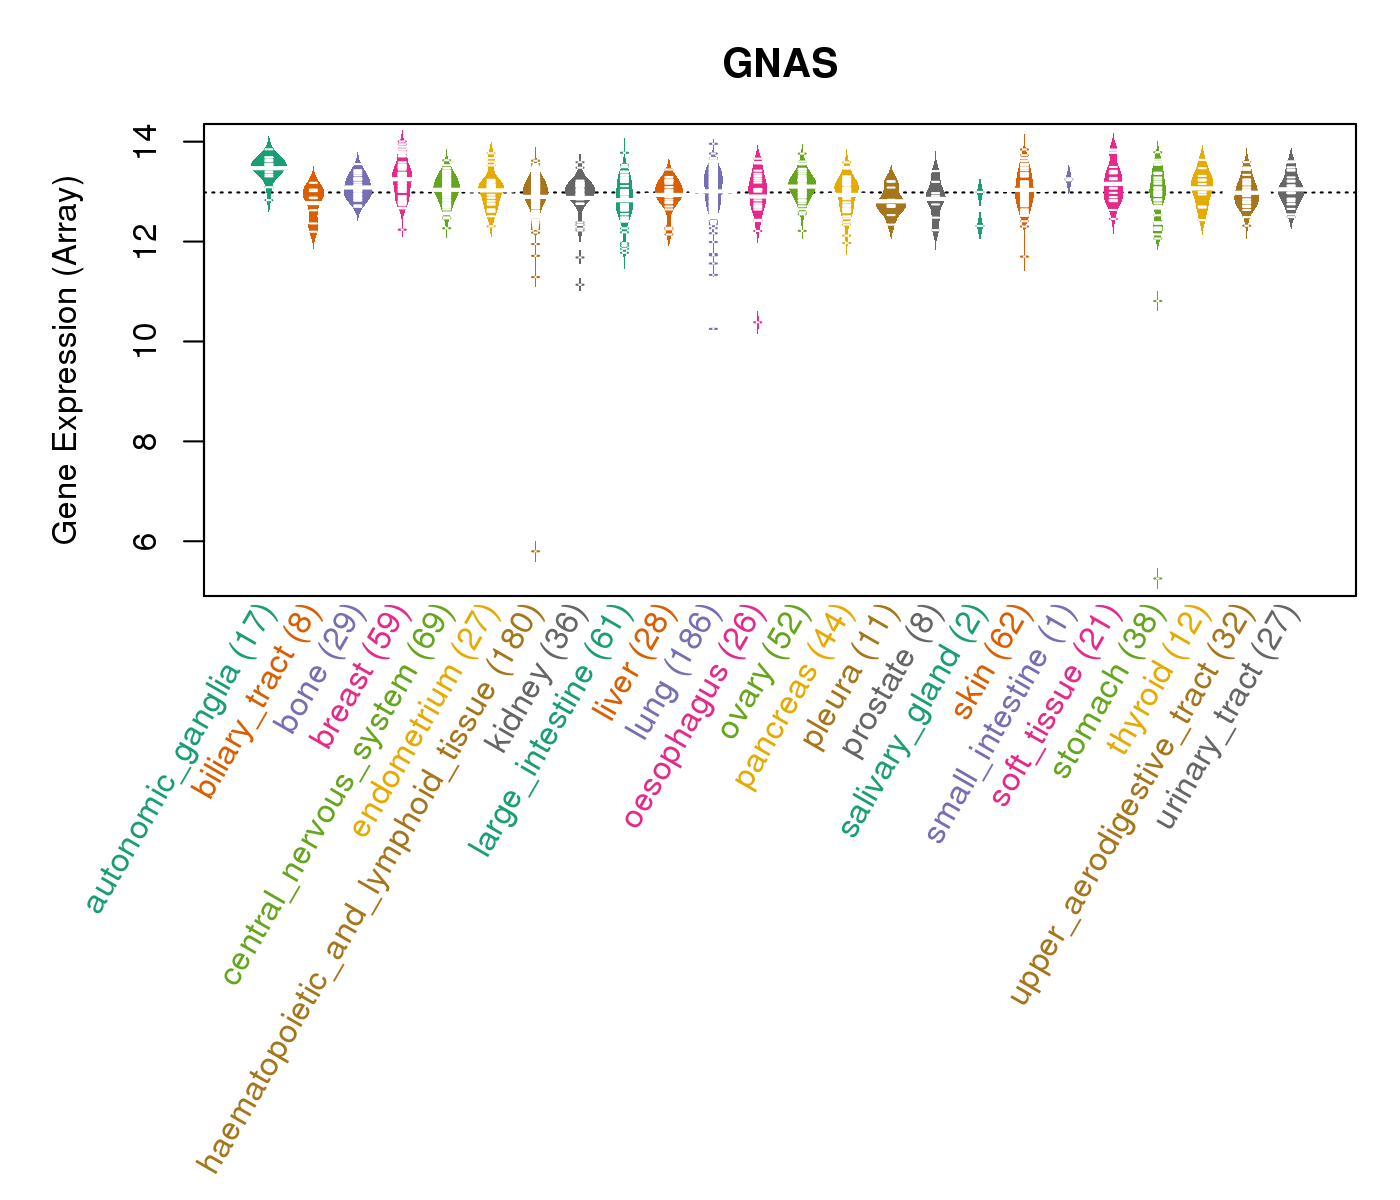
| Gene Expression for GNAS |
| * CCLE gene expression data were extracted from CCLE_Expression_Entrez_2012-10-18.res: Gene-centric RMA-normalized mRNA expression data. |
 |
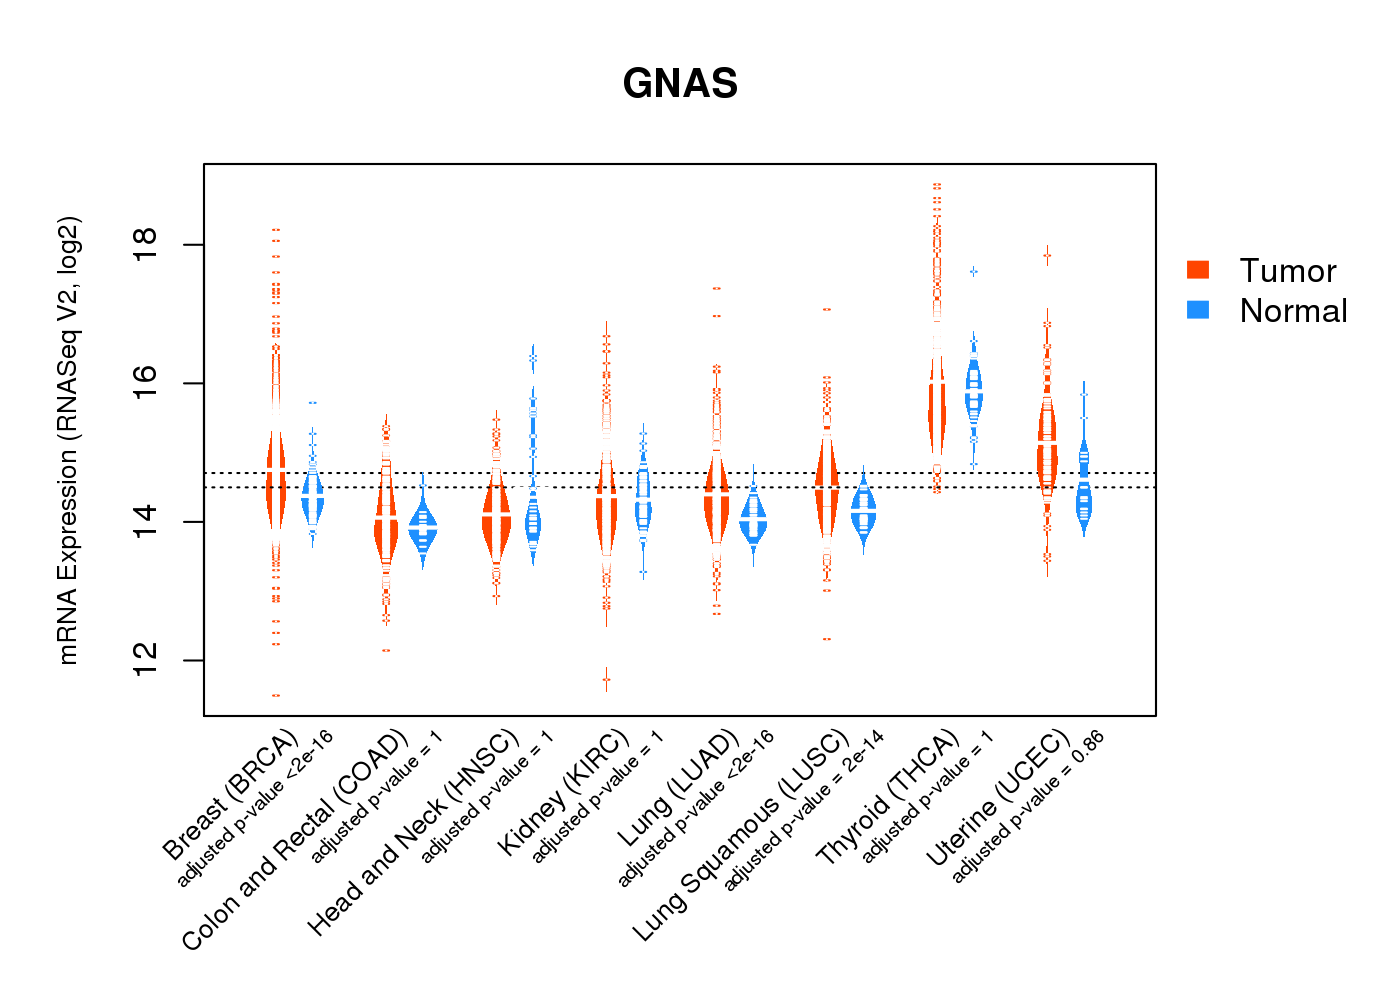
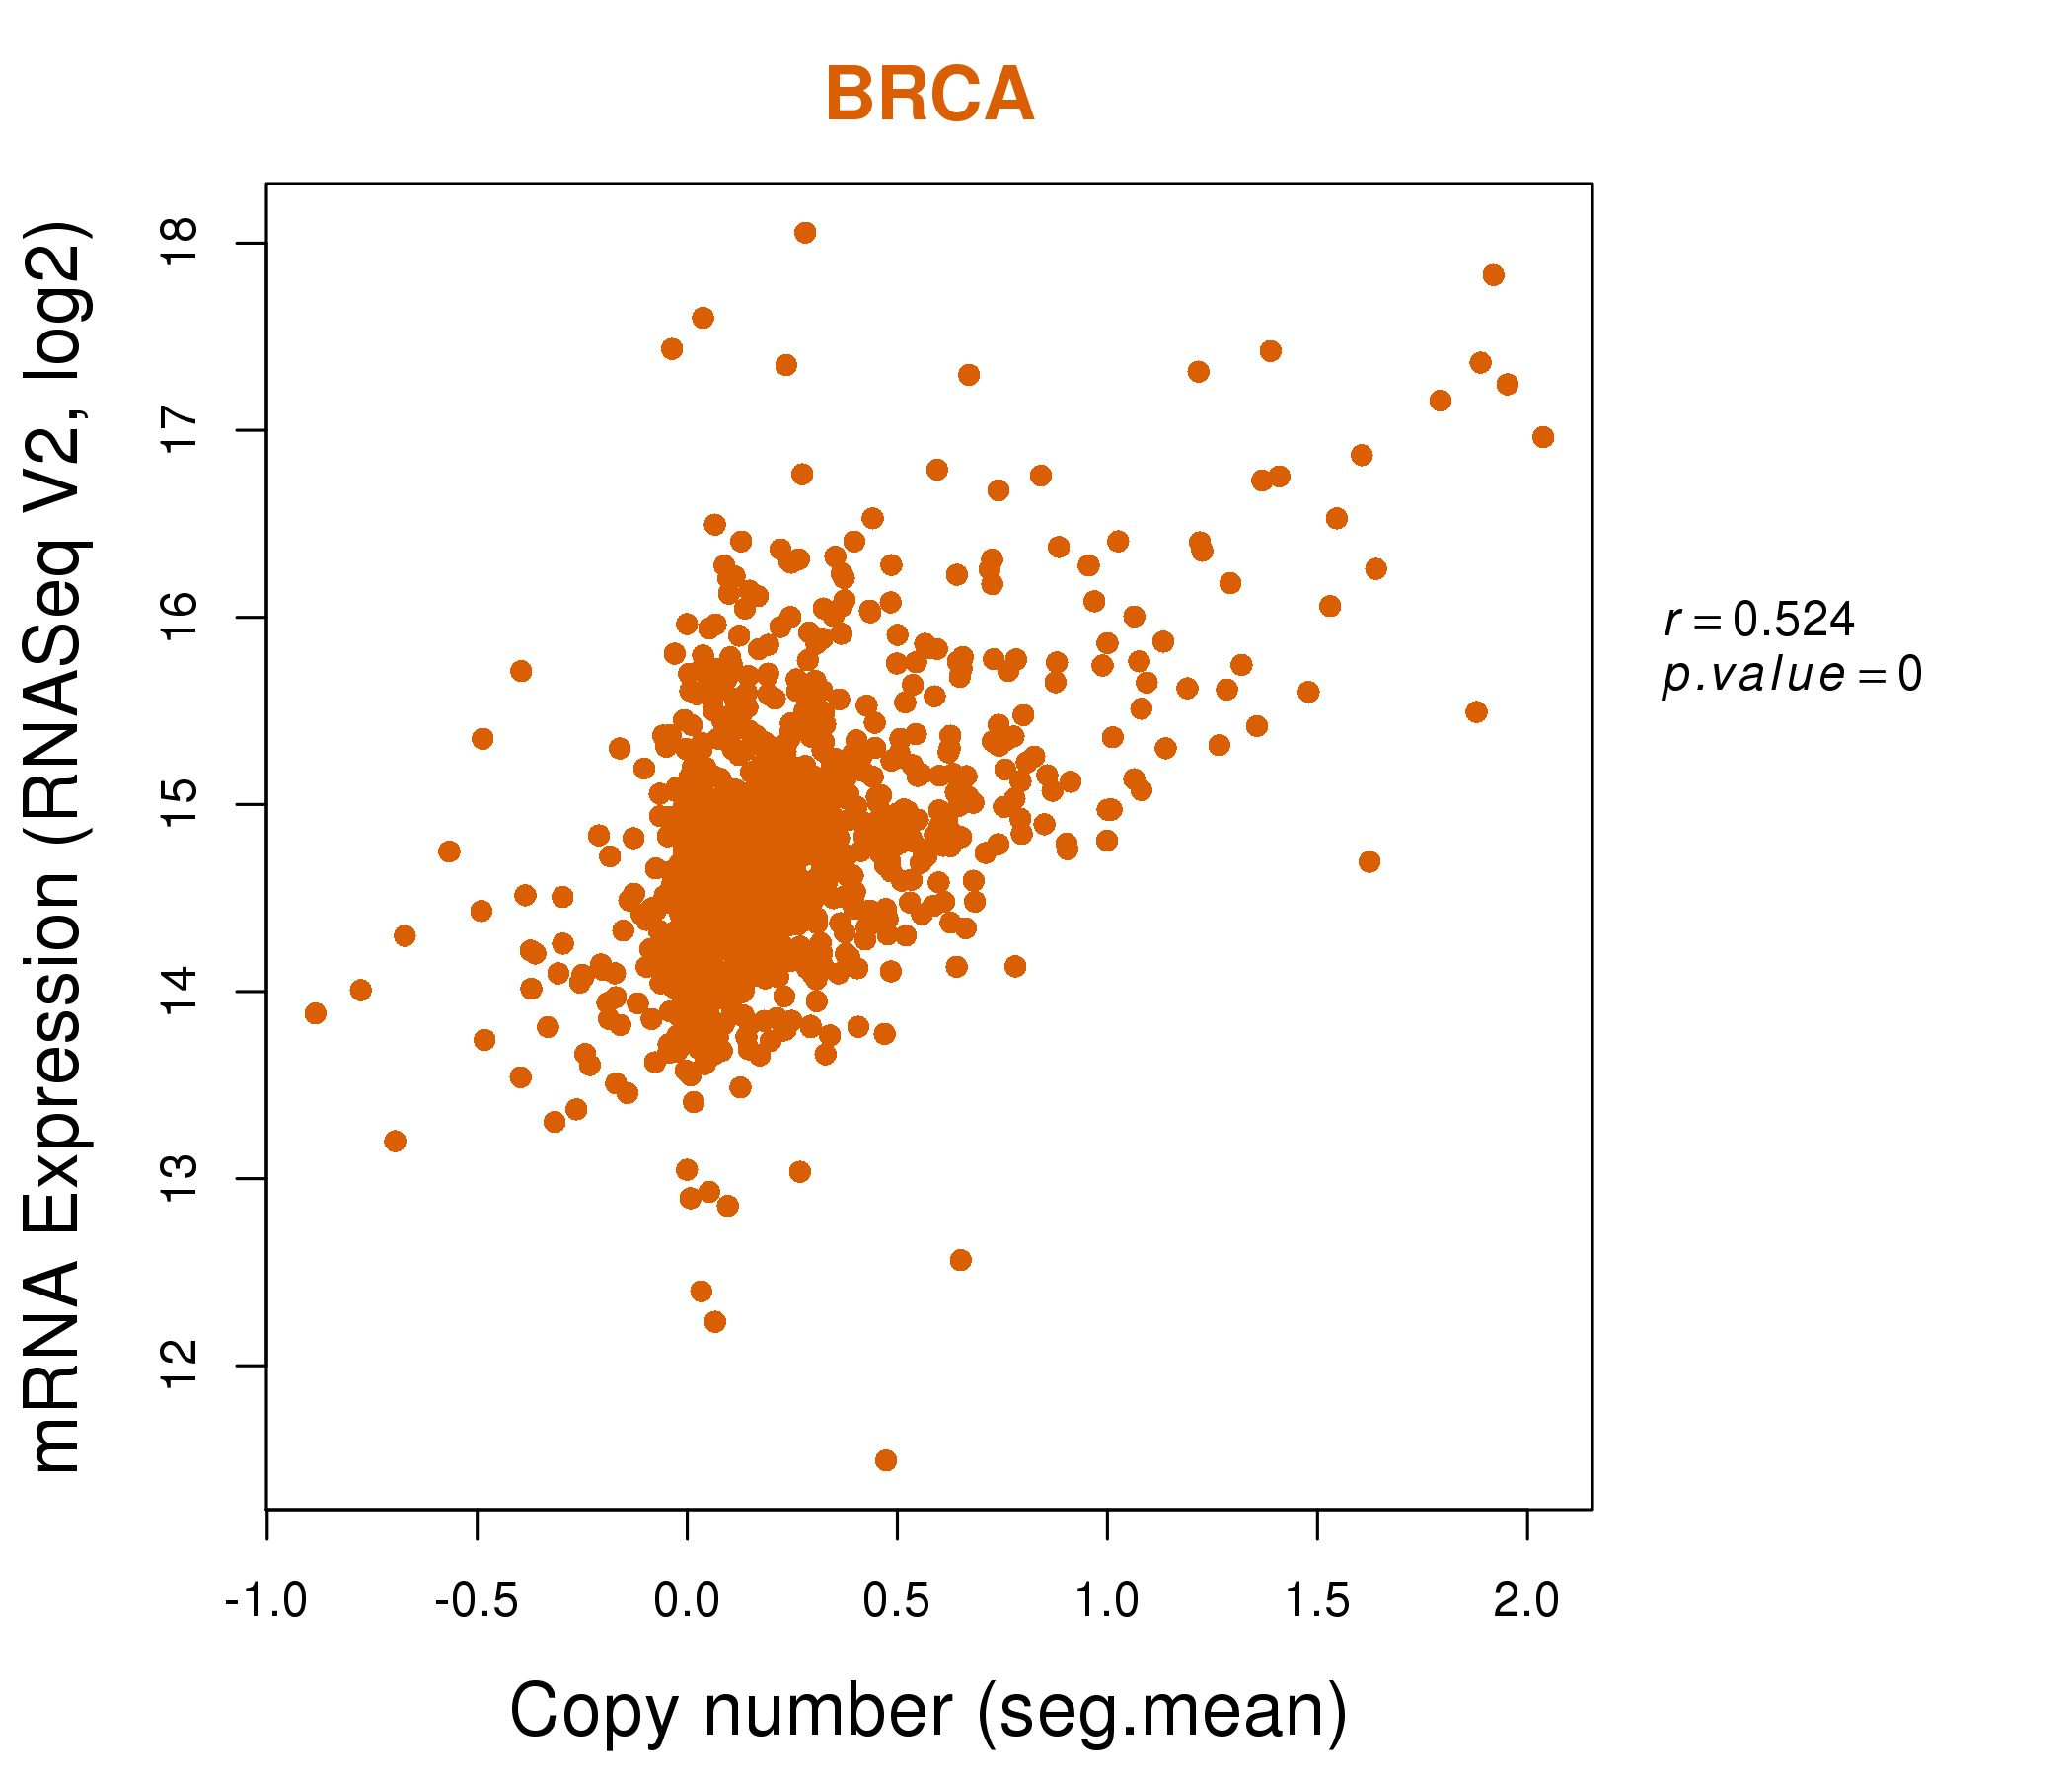
| * Normalized gene expression data of RNASeqV2 was extracted from TCGA using R package TCGA-Assembler. The URLs of all public data files on TCGA DCC data server were gathered at Jan-05-2015. Only eight cancer types have enough normal control samples for differential expression analysis. (t test, adjusted p<0.05 (using Benjamini-Hochberg FDR)) |
 |
| Top |
| * This plots show the correlation between CNV and gene expression. |
: Open all plots for all cancer types
 |
|
 |
|

| Top |
| Gene-Gene Network Information |
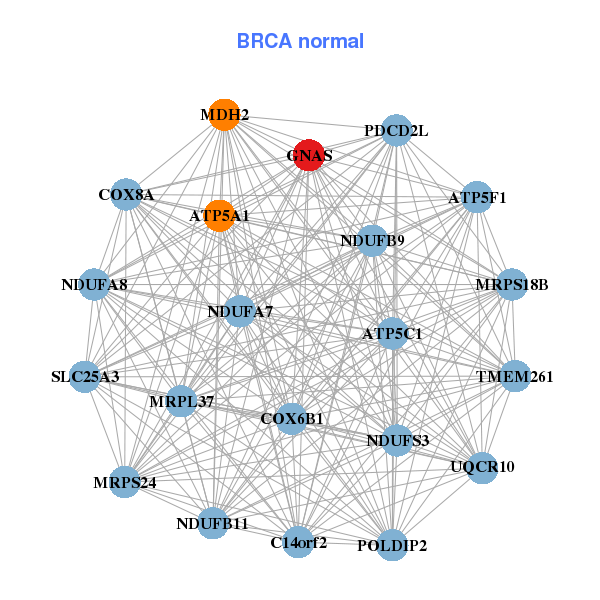
| * Co-Expression network figures were drawn using R package igraph. Only the top 20 genes with the highest correlations were shown. Red circle: input gene, orange circle: cell metabolism gene, sky circle: other gene |
: Open all plots for all cancer types
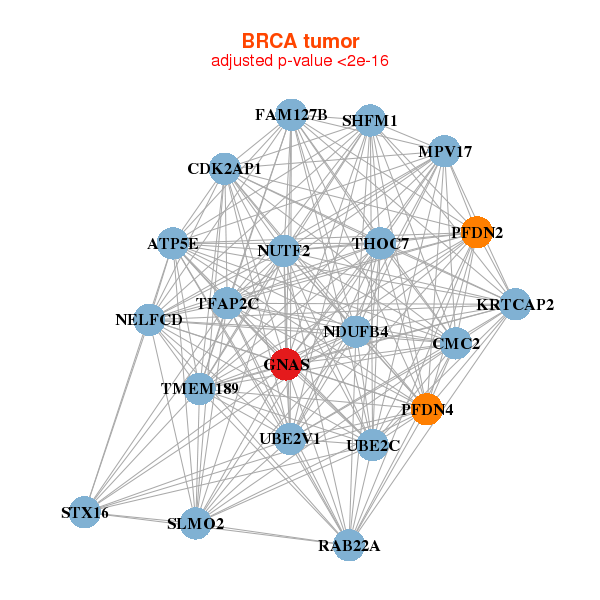 |
| ||||
| ATP5E,CMC2,CDK2AP1,FAM127B,GNAS,KRTCAP2,MPV17, NDUFB4,NUTF2,PFDN2,PFDN4,RAB22A,SHFM1,SLMO2, STX16,TFAP2C,NELFCD,THOC7,TMEM189,UBE2C,UBE2V1 | ATP5A1,ATP5C1,ATP5F1,C14orf2,TMEM261,COX6B1,COX8A, GNAS,MDH2,MRPL37,MRPS18B,MRPS24,NDUFA7,NDUFA8, NDUFB11,NDUFB9,NDUFS3,PDCD2L,POLDIP2,SLC25A3,UQCR10 | ||||
 |
| ||||
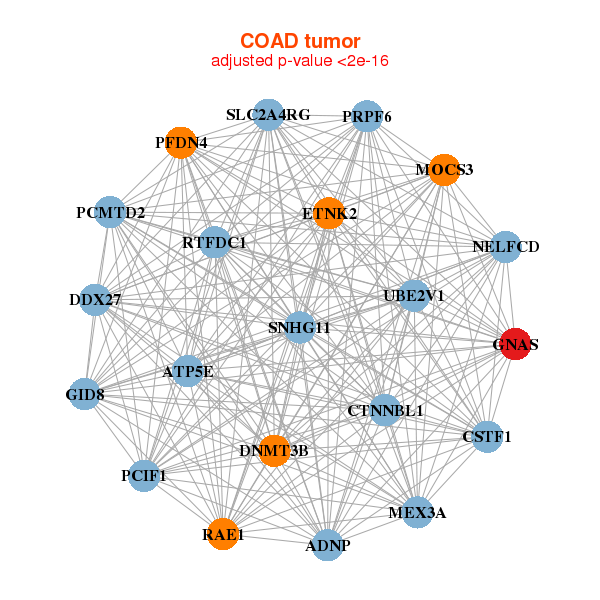
| ADNP,ATP5E,GID8,RTFDC1,CSTF1,CTNNBL1,DDX27, DNMT3B,ETNK2,GNAS,MEX3A,MOCS3,PCIF1,PCMTD2, PFDN4,PRPF6,RAE1,SLC2A4RG,SNHG11,NELFCD,UBE2V1 | ABHD8,ENKD1,CCDC103,DPF2,EMILIN3,FAM117A,GNAS, LIX1L,MAGED4B,MYO16,LINC00094,NRM,PFKM,PJA1, PKN1,RGS9BP,SOX12,TAF6,UFSP2,USP27X,USP44 |
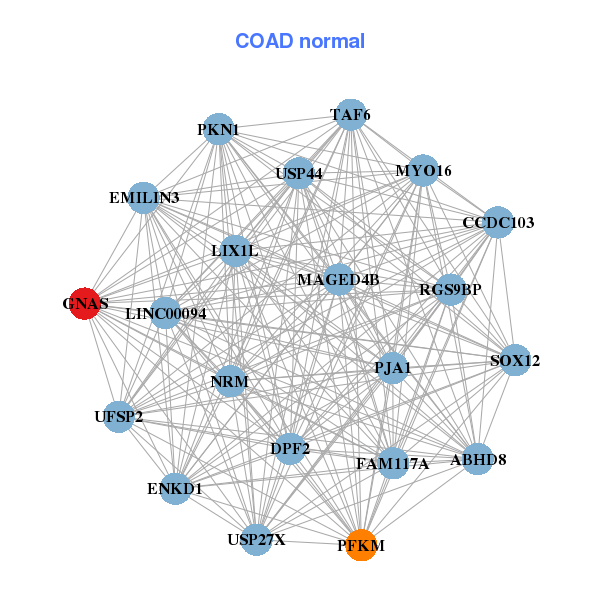
| * Co-Expression network figures were drawn using R package igraph. Only the top 20 genes with the highest correlations were shown. Red circle: input gene, orange circle: cell metabolism gene, sky circle: other gene |
: Open all plots for all cancer types
| Top |
: Open all interacting genes' information including KEGG pathway for all interacting genes from DAVID
| Top |
| Pharmacological Information for GNAS |
| DB Category | DB Name | DB's ID and Url link |
| Organism-specific databases | PharmGKB | PA175; -. |
| Organism-specific databases | CTD | 2778; -. |
| * Gene Centered Interaction Network. |
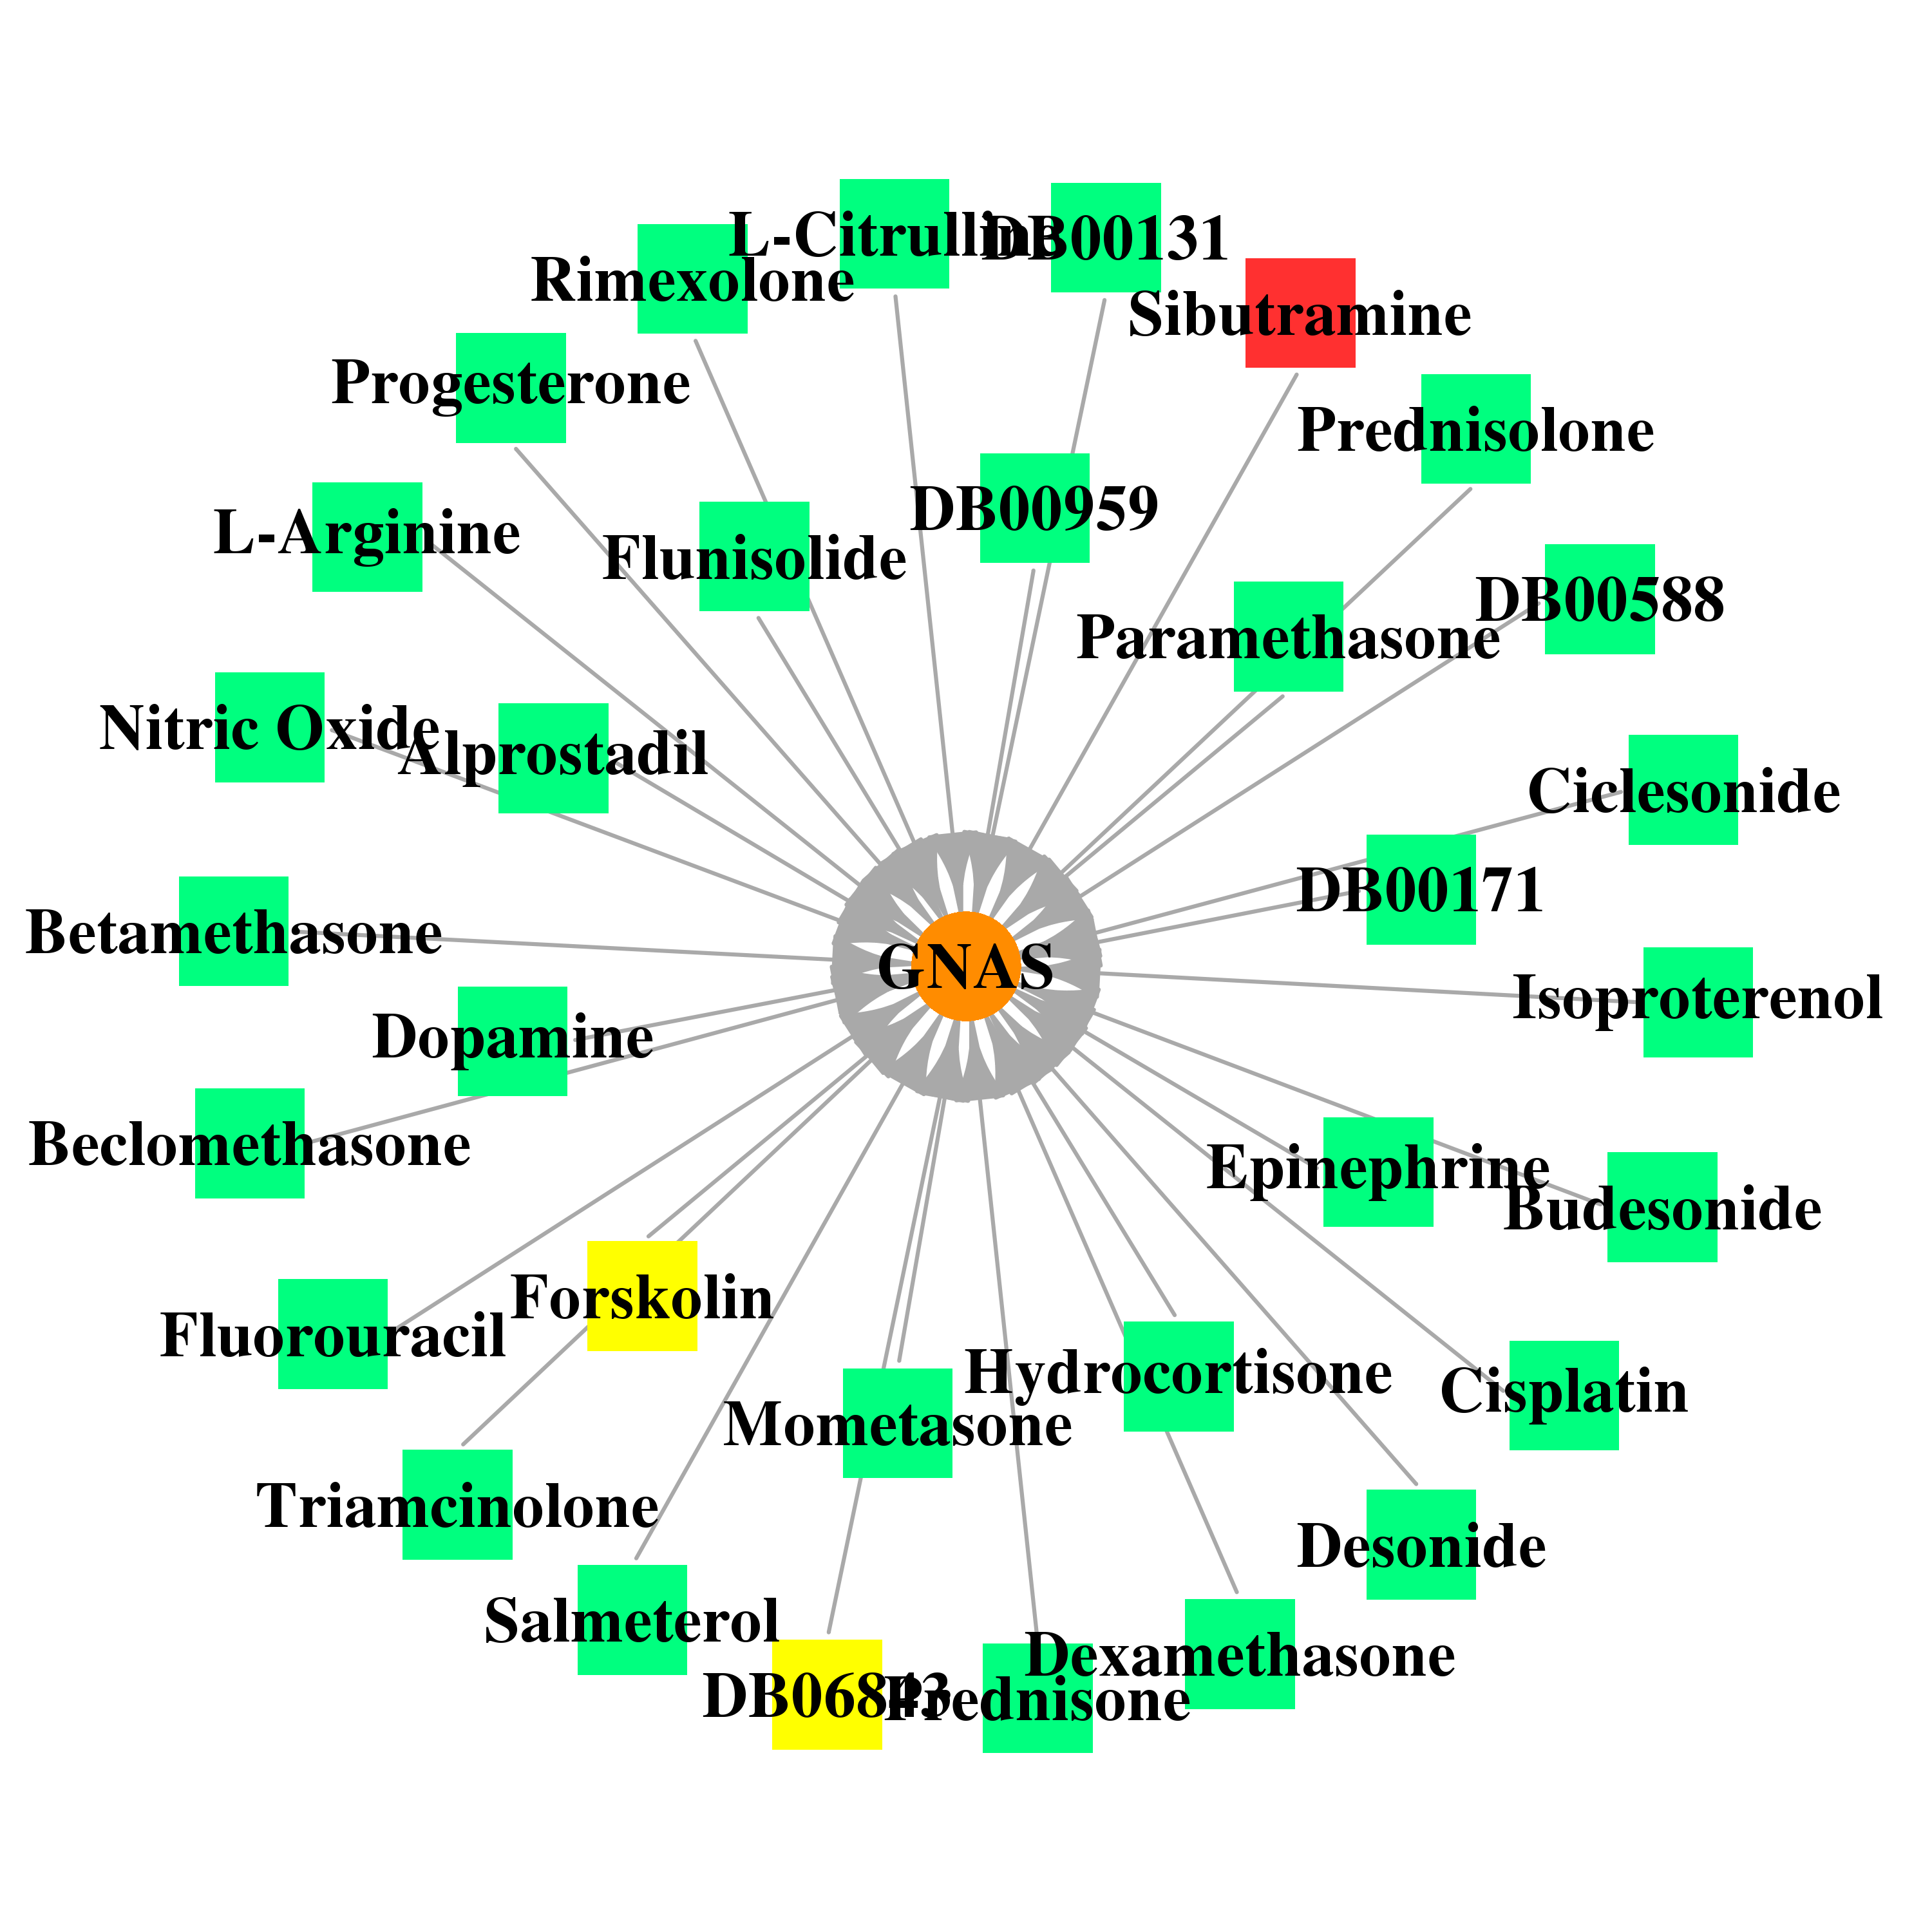 |
| * Drug Centered Interaction Network. |
| DrugBank ID | Target Name | Drug Groups | Generic Name | Drug Centered Network | Drug Structure |
| DB02587 | GNAS complex locus | experimental | Forskolin | 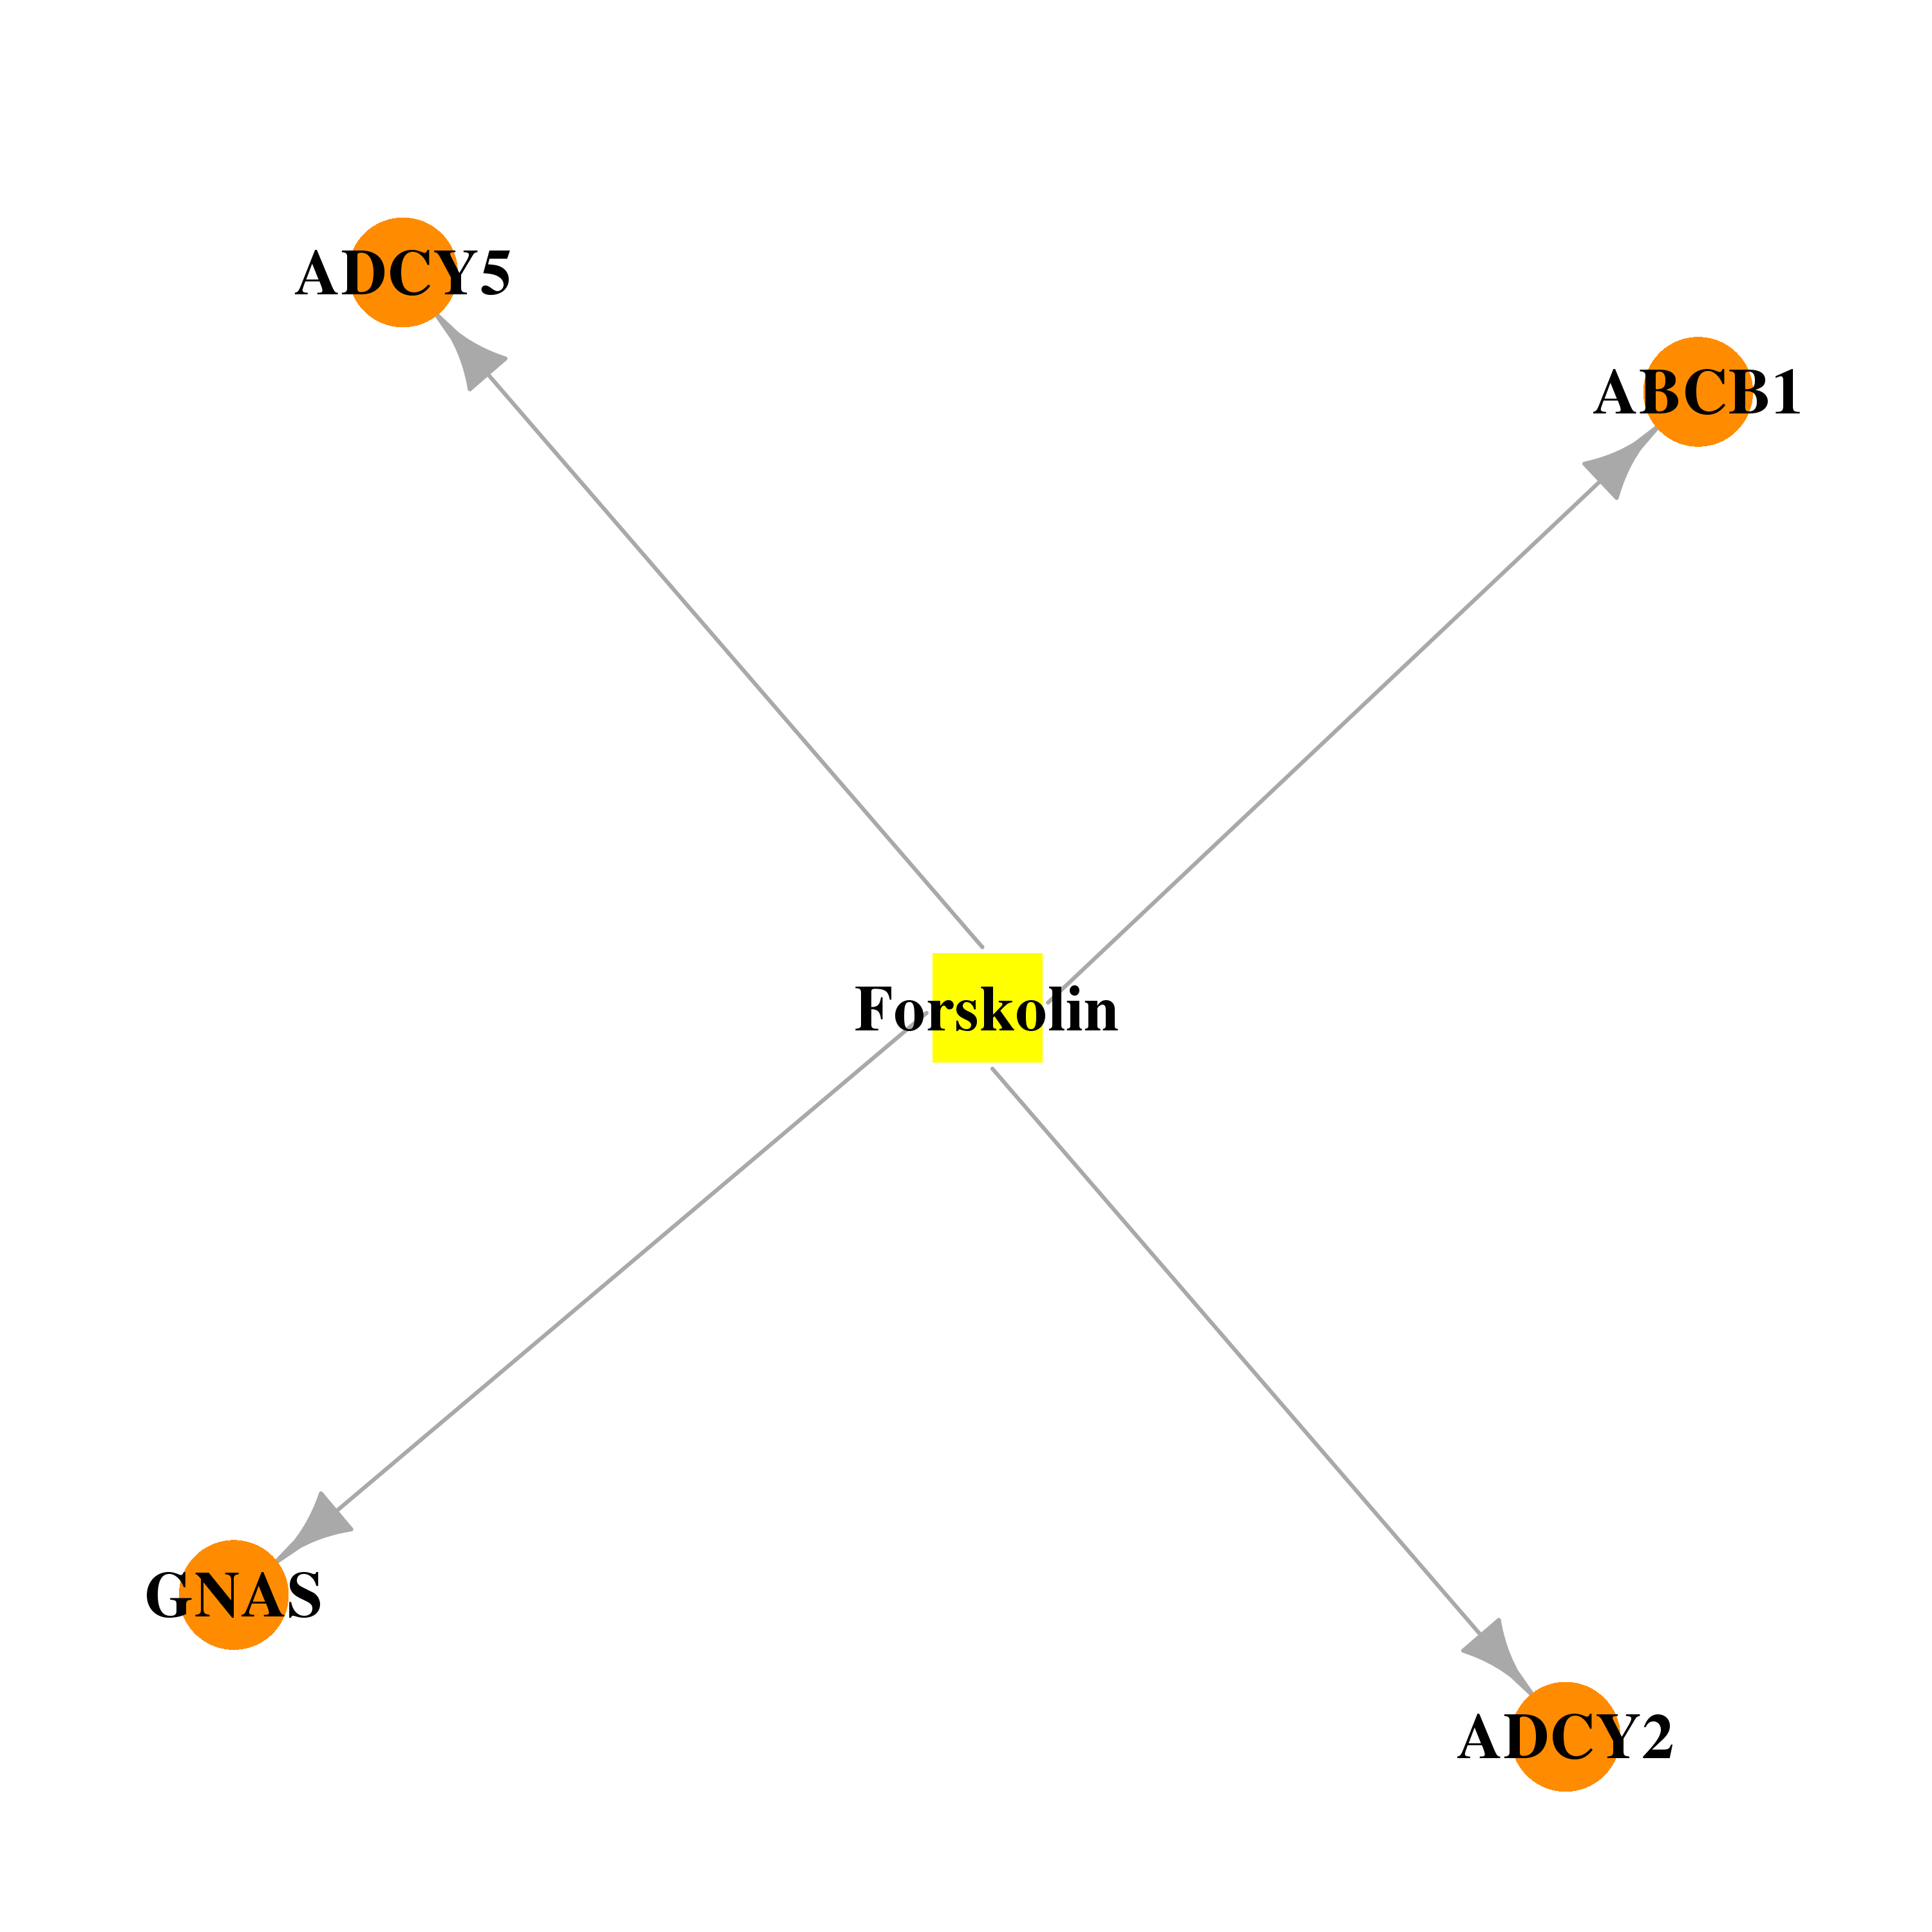 |  |
| DB06843 | GNAS complex locus | experimental | 2',5'-DIDEOXY-ADENOSINE 3'-MONOPHOSPHATE | 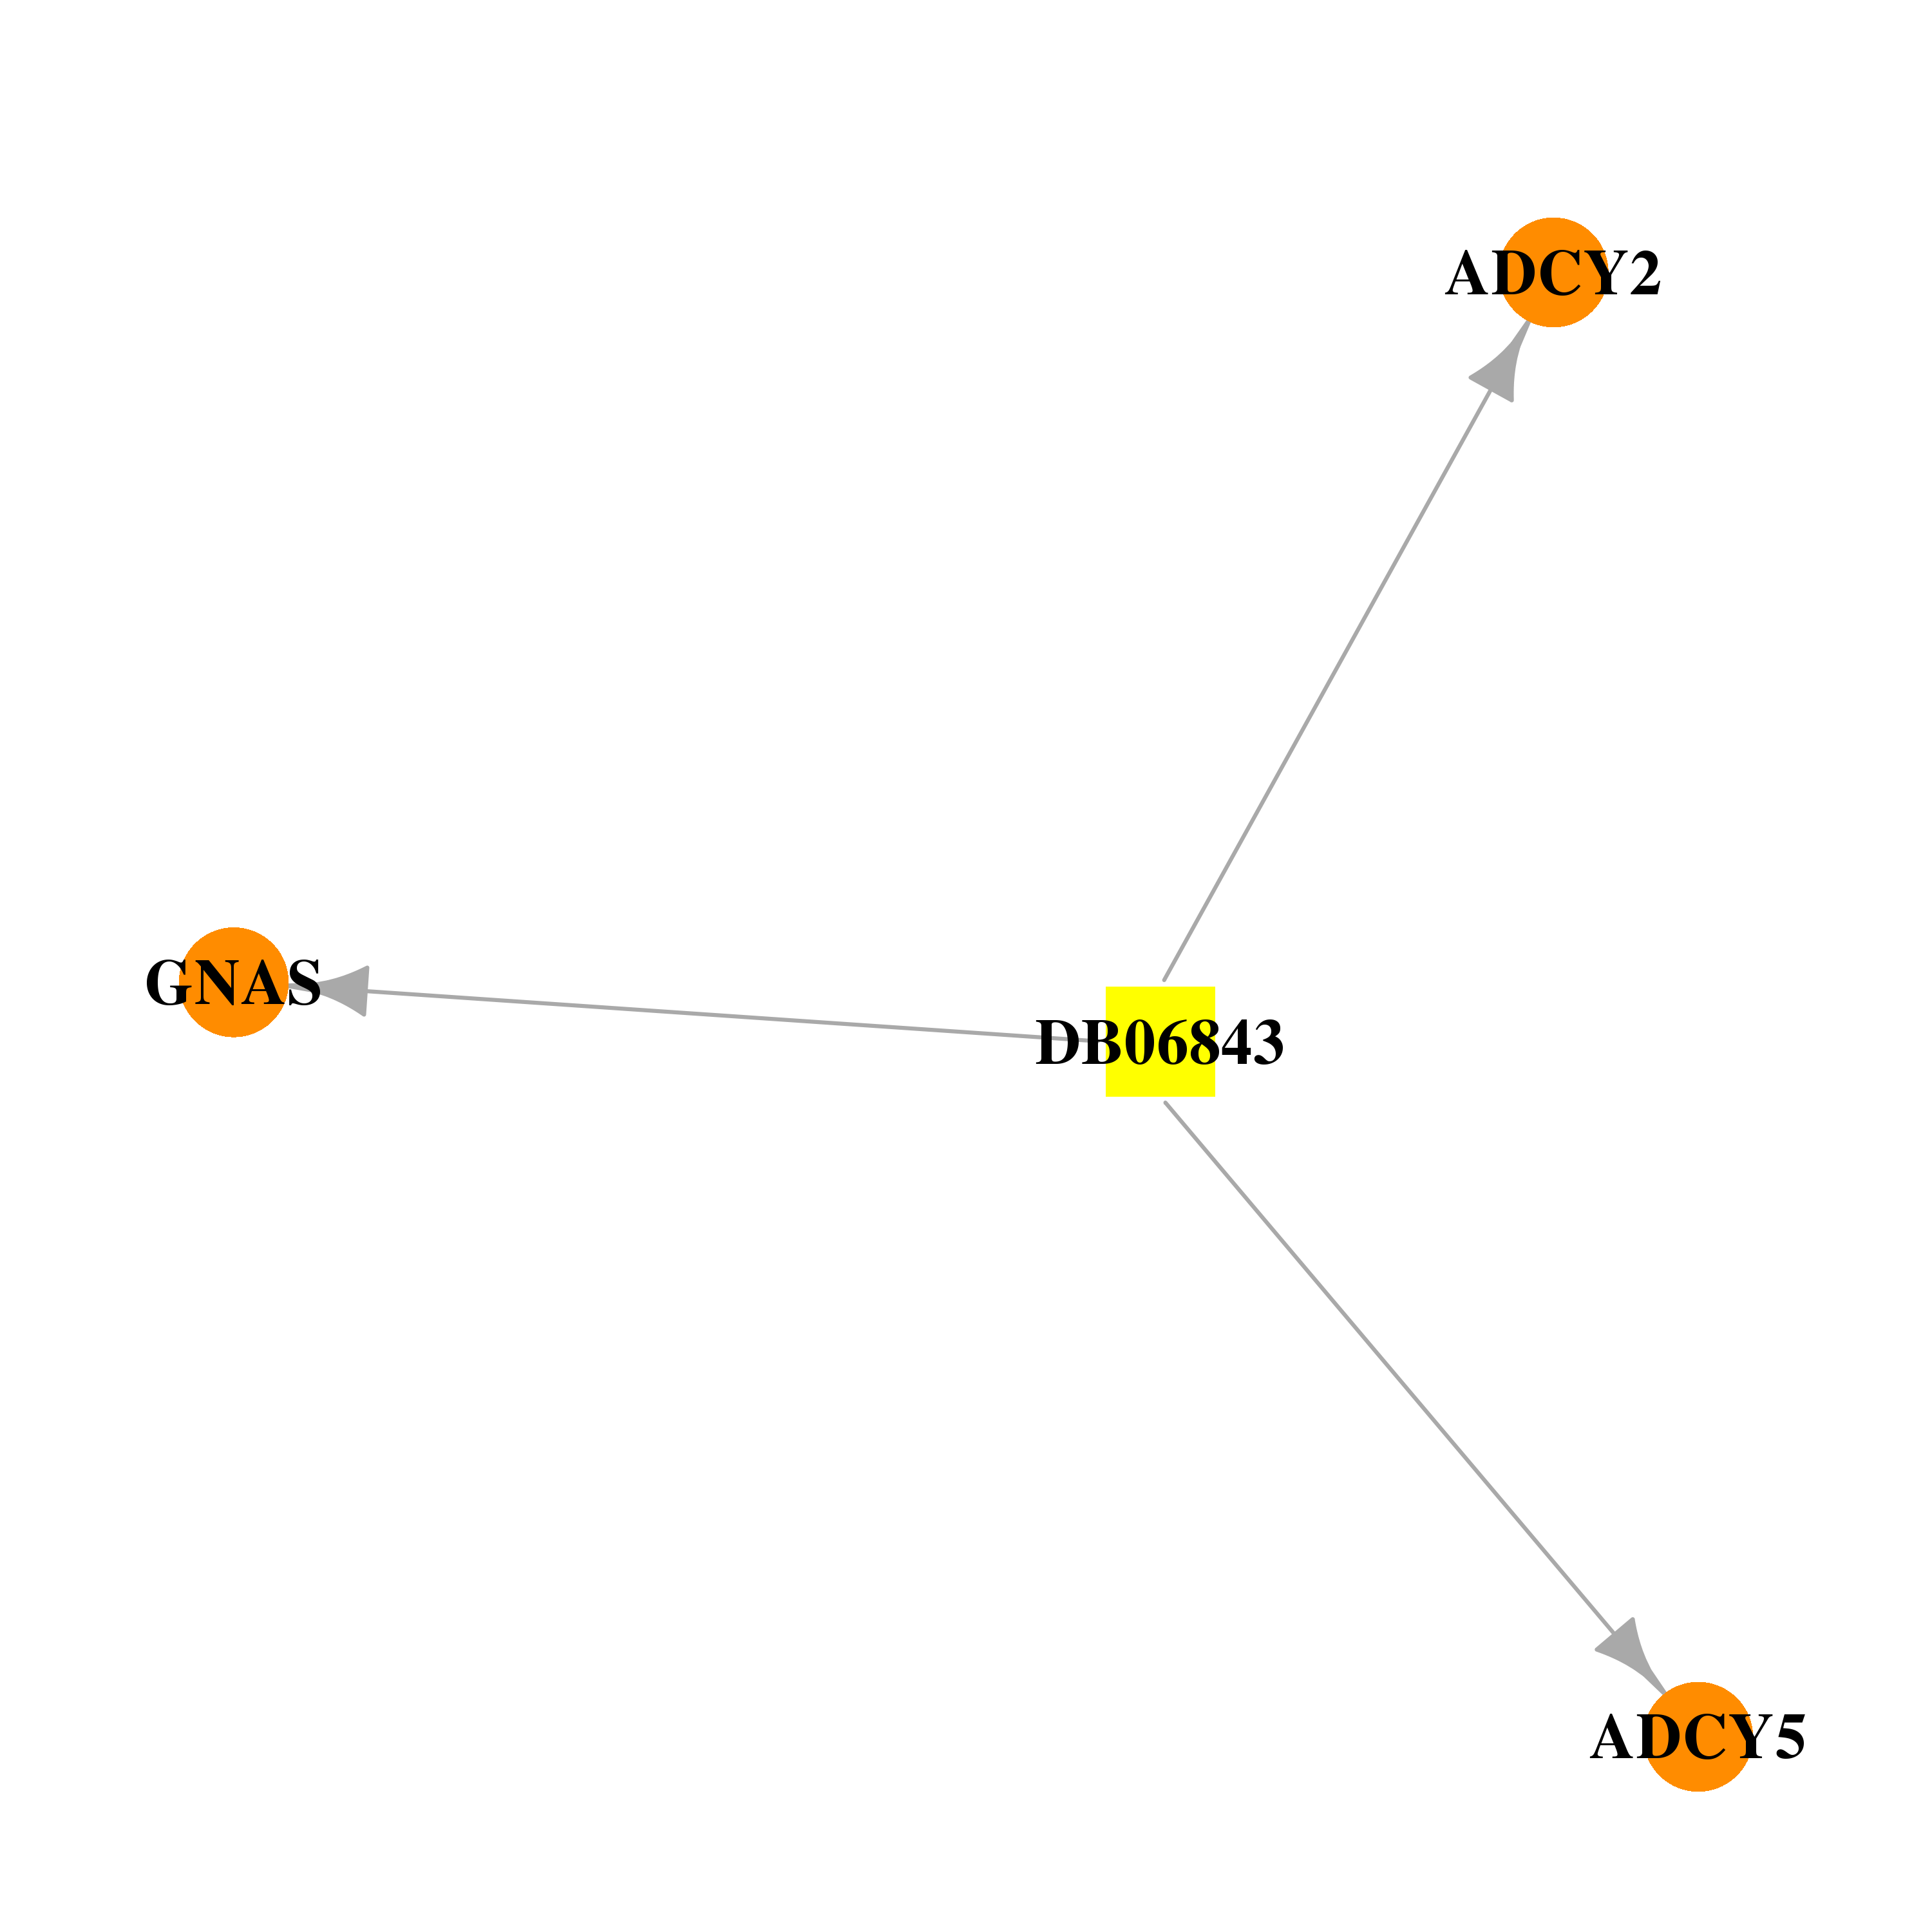 |  |
| DB00515 | GNAS complex locus | approved | Cisplatin |  |  |
| DB00544 | GNAS complex locus | approved | Fluorouracil |  |  |
| DB00394 | GNAS complex locus | approved | Beclomethasone | 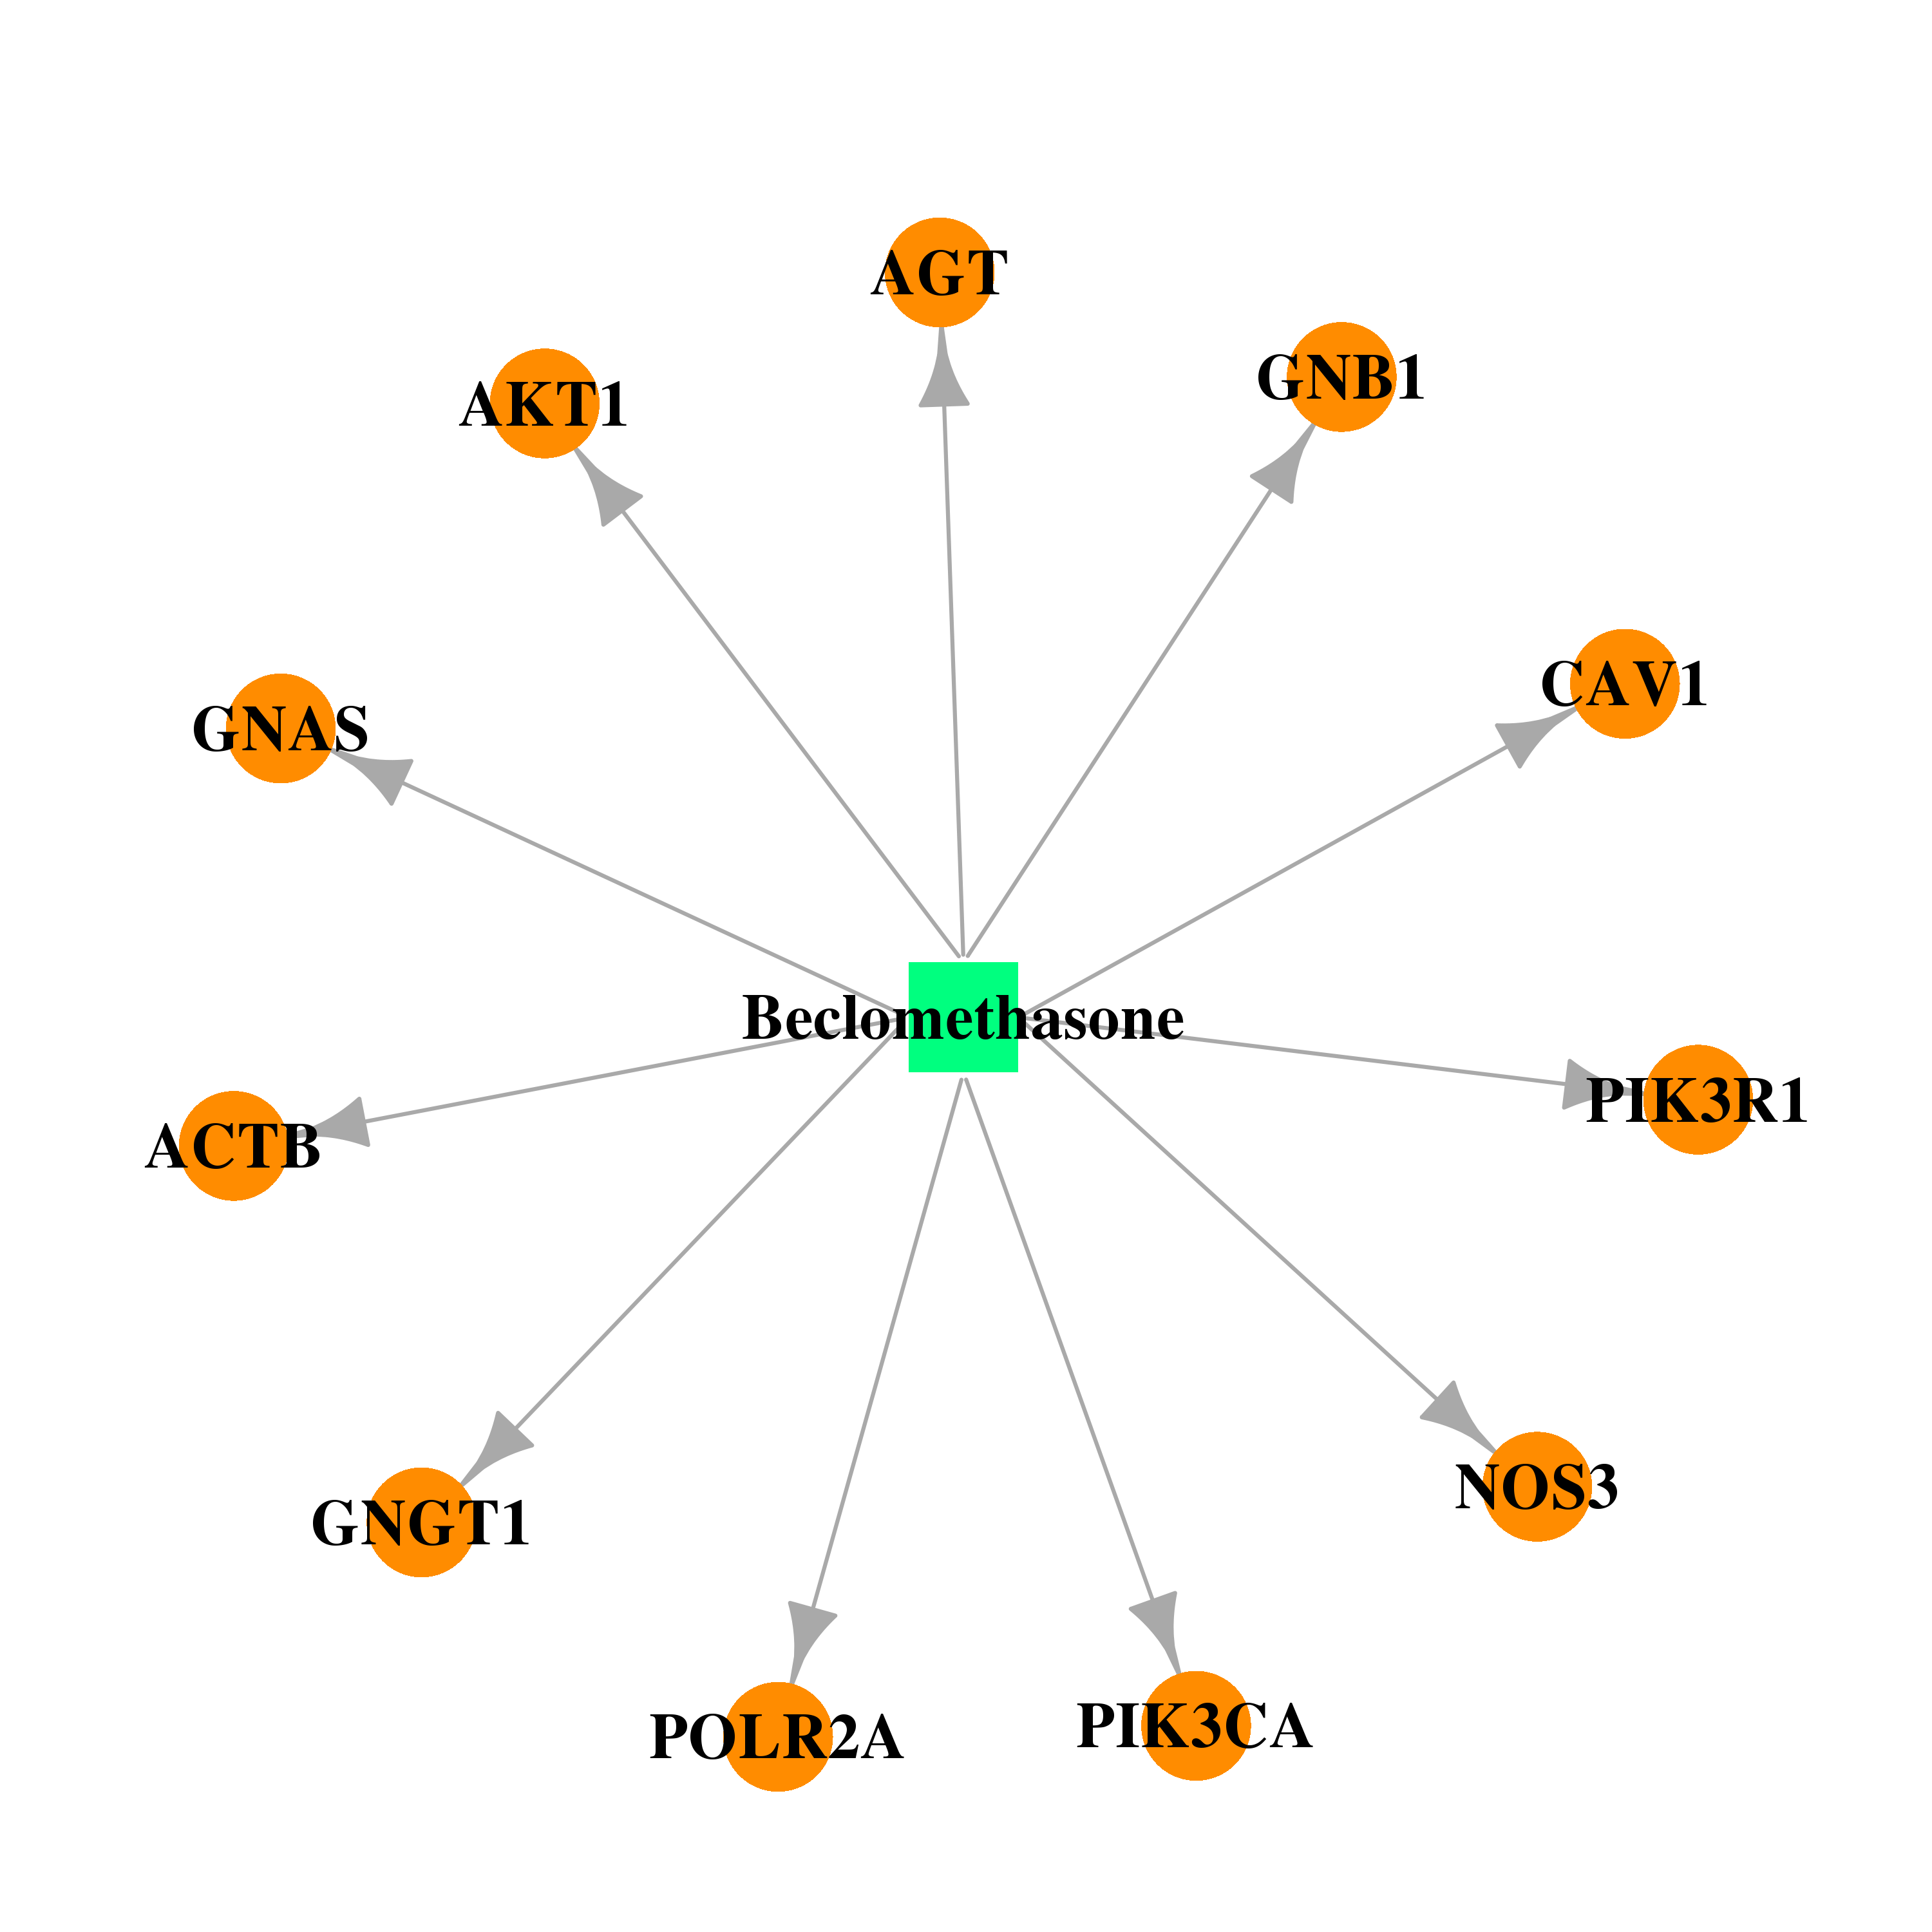 |  |
| DB00443 | GNAS complex locus | approved | Betamethasone |  |  |
| DB01222 | GNAS complex locus | approved; investigational | Budesonide |  |  |
| DB01410 | GNAS complex locus | approved; investigational | Ciclesonide | 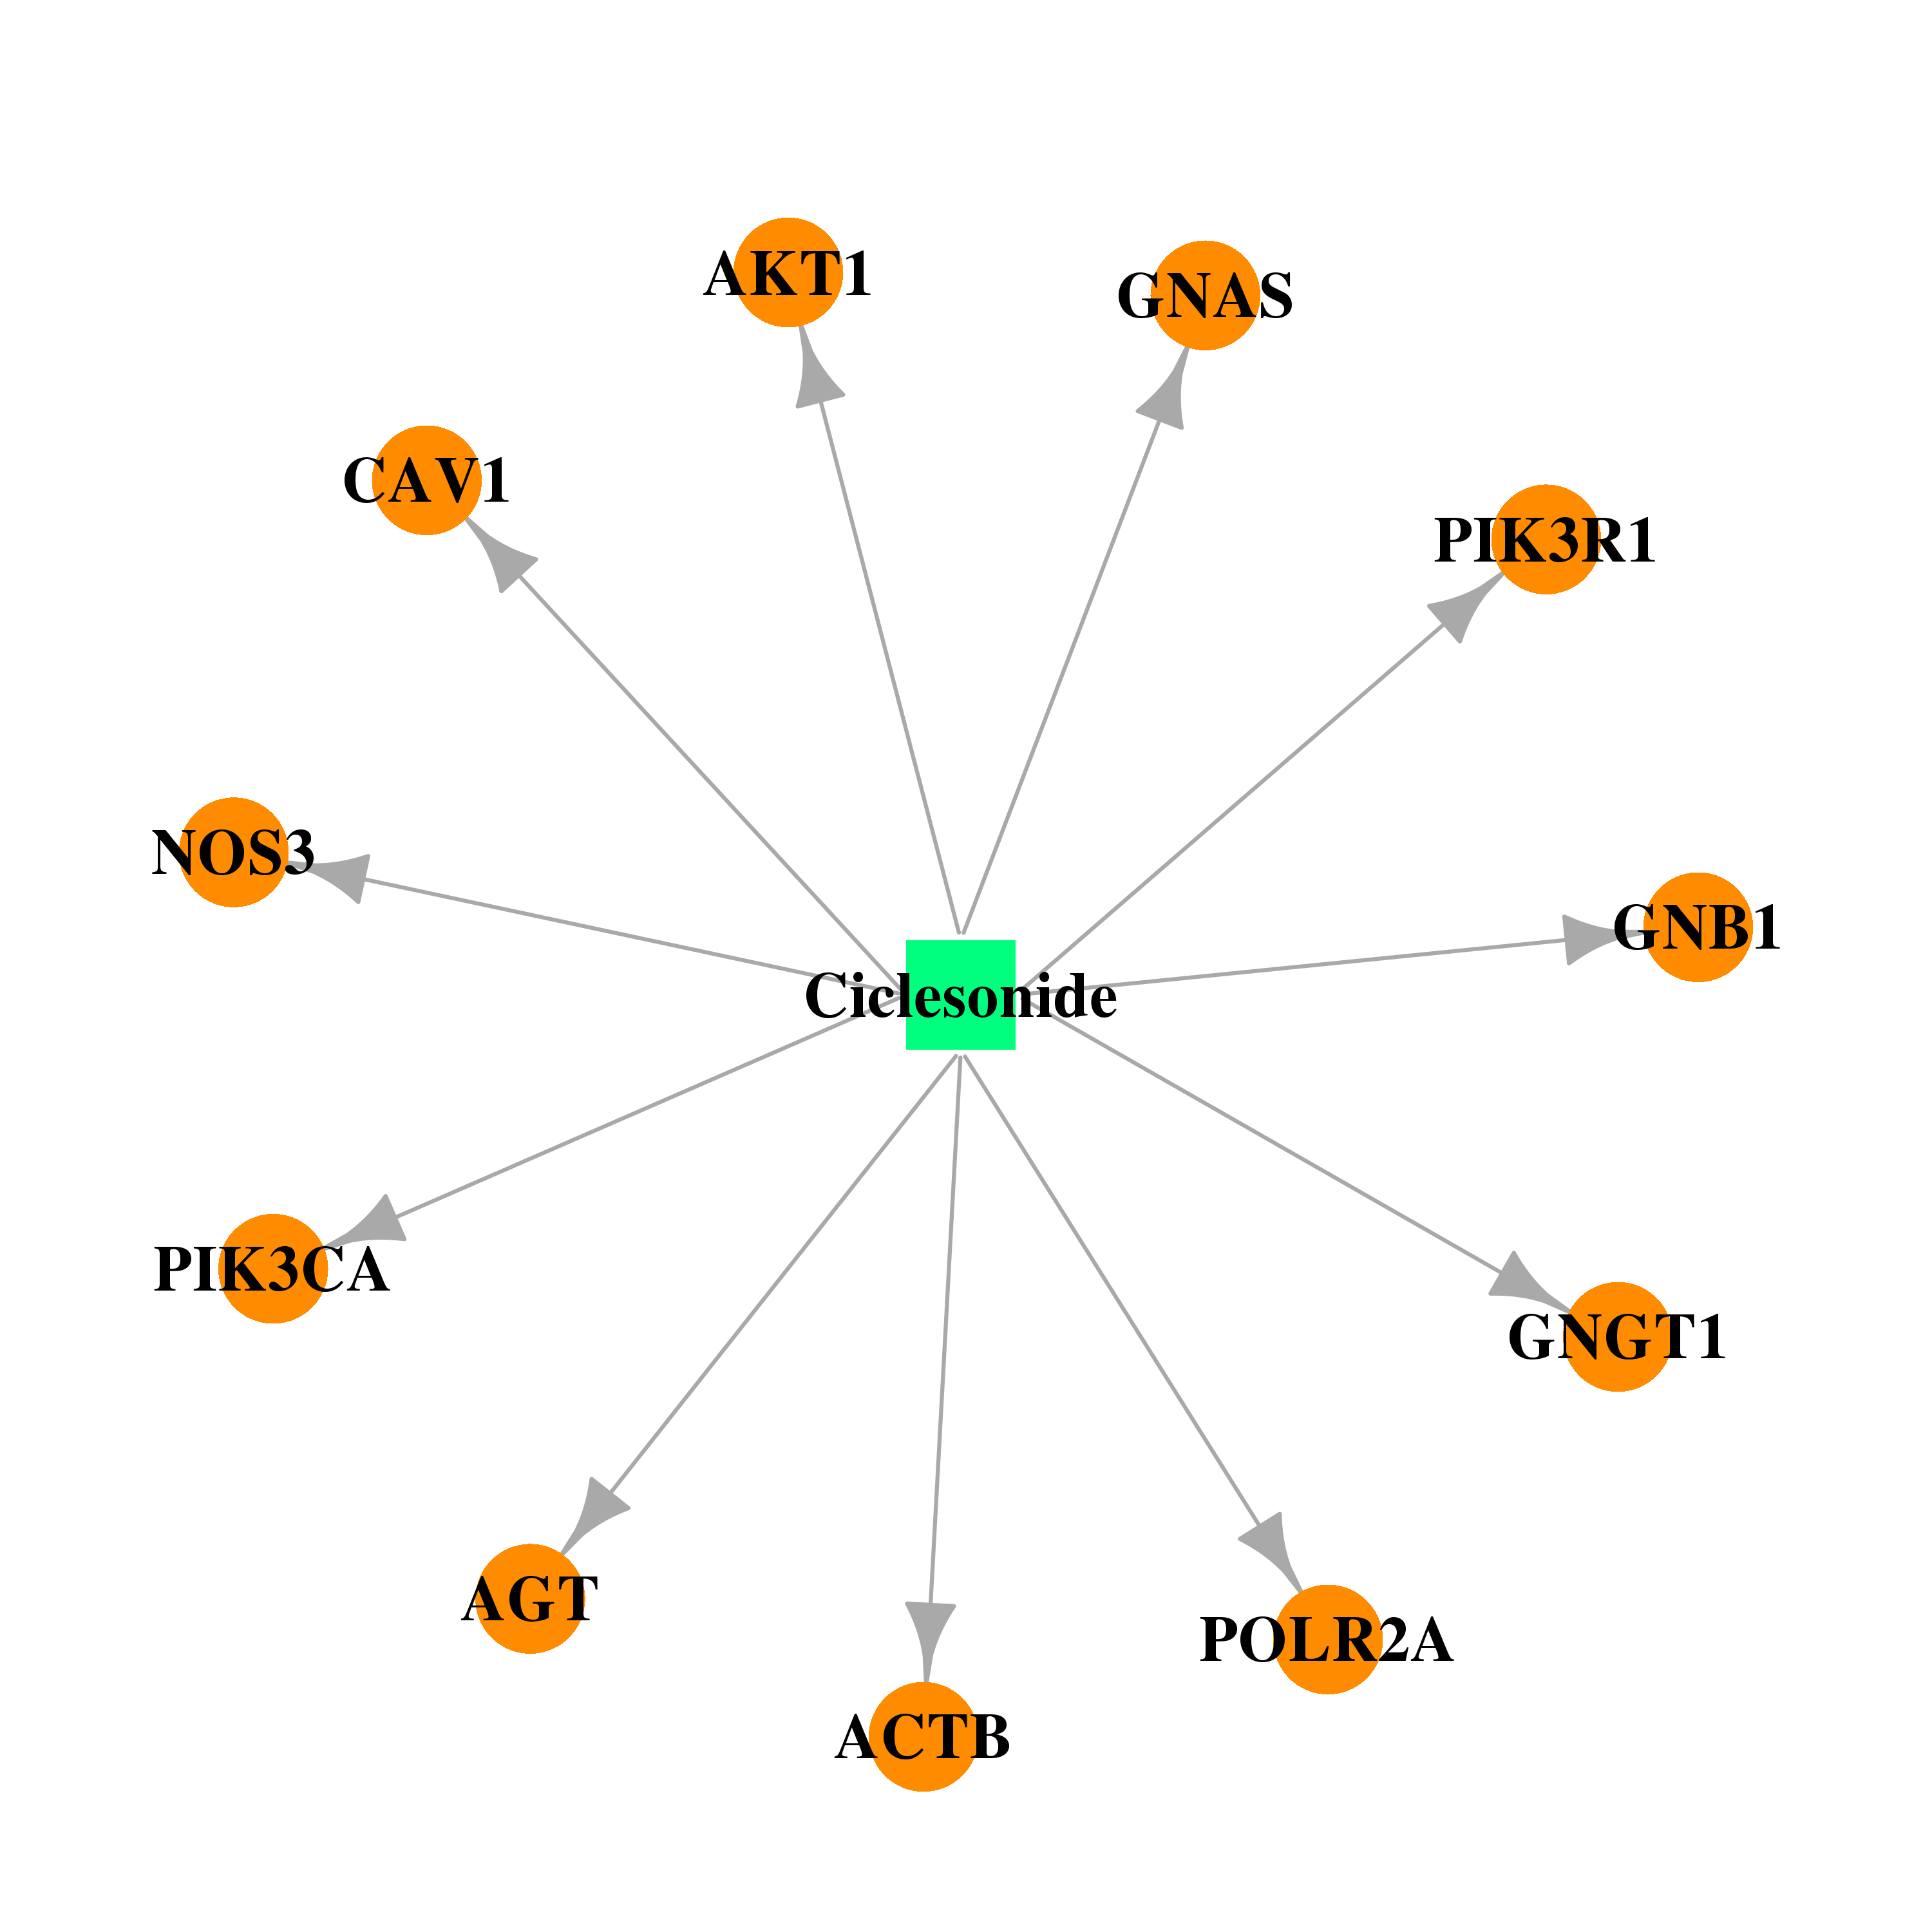 |  |
| DB01260 | GNAS complex locus | approved; investigational | Desonide |  |  |
| DB01234 | GNAS complex locus | approved; investigational | Dexamethasone | 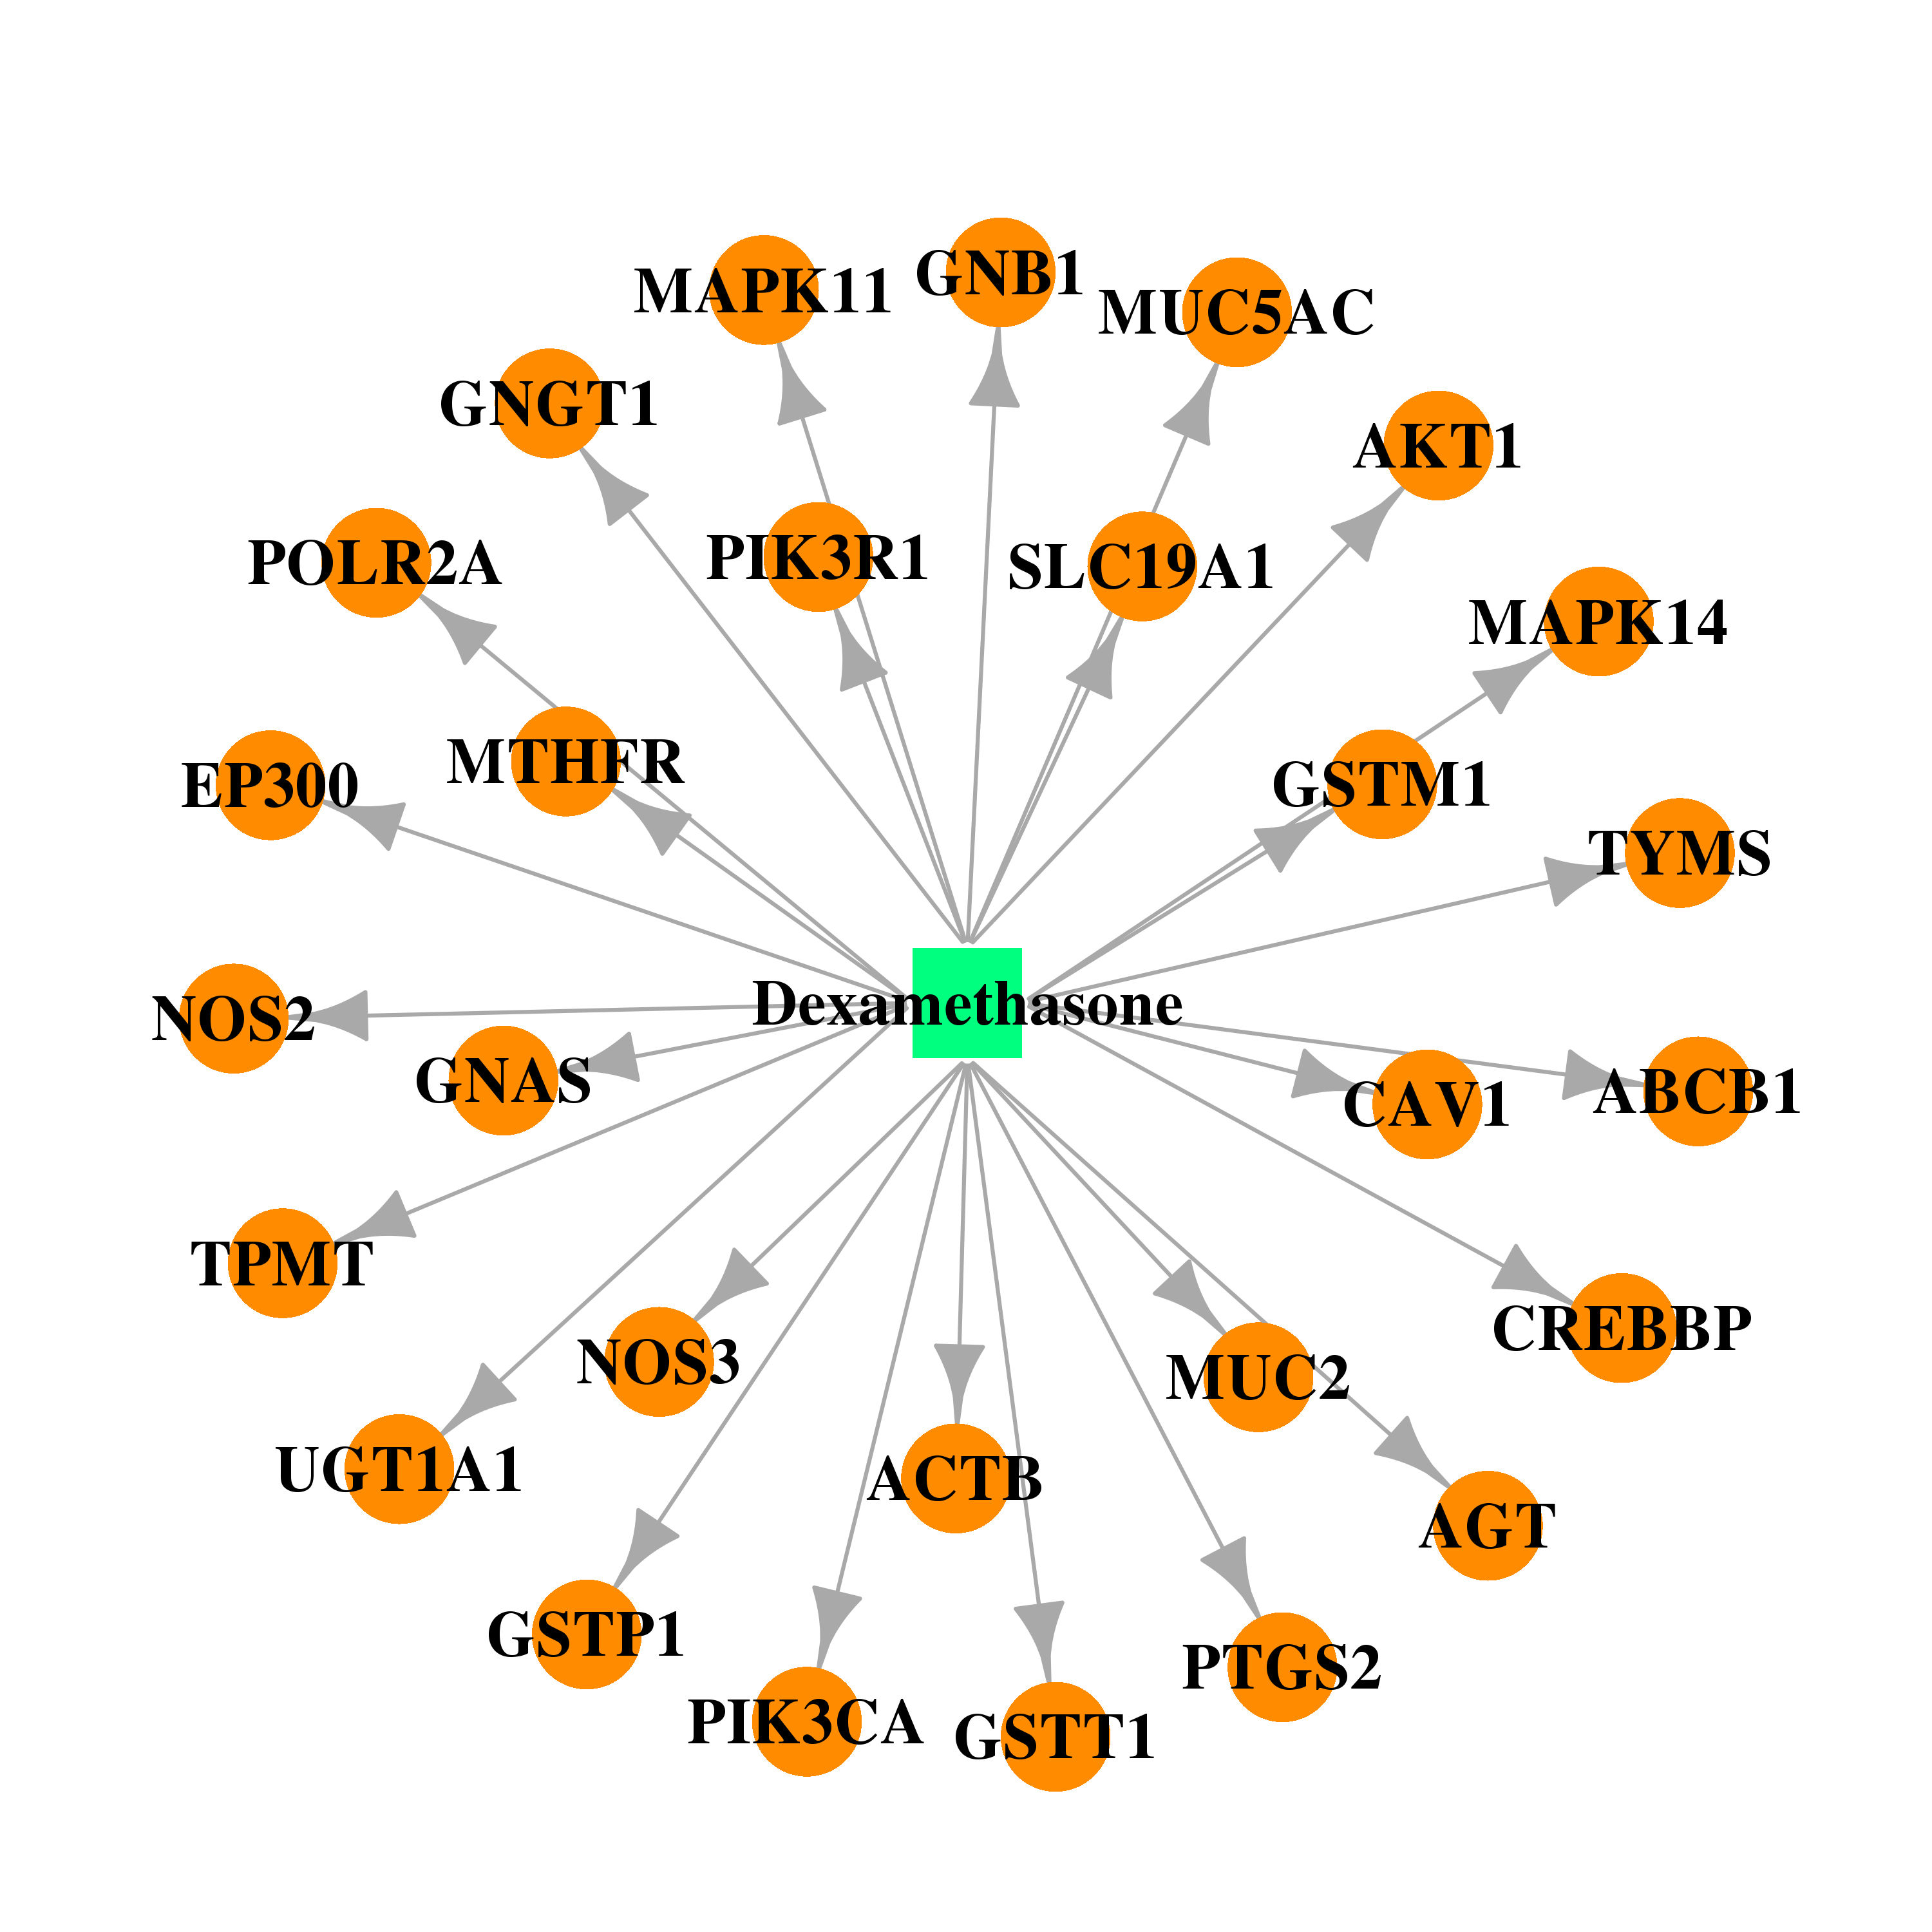 |  |
| DB00180 | GNAS complex locus | approved; investigational | Flunisolide | 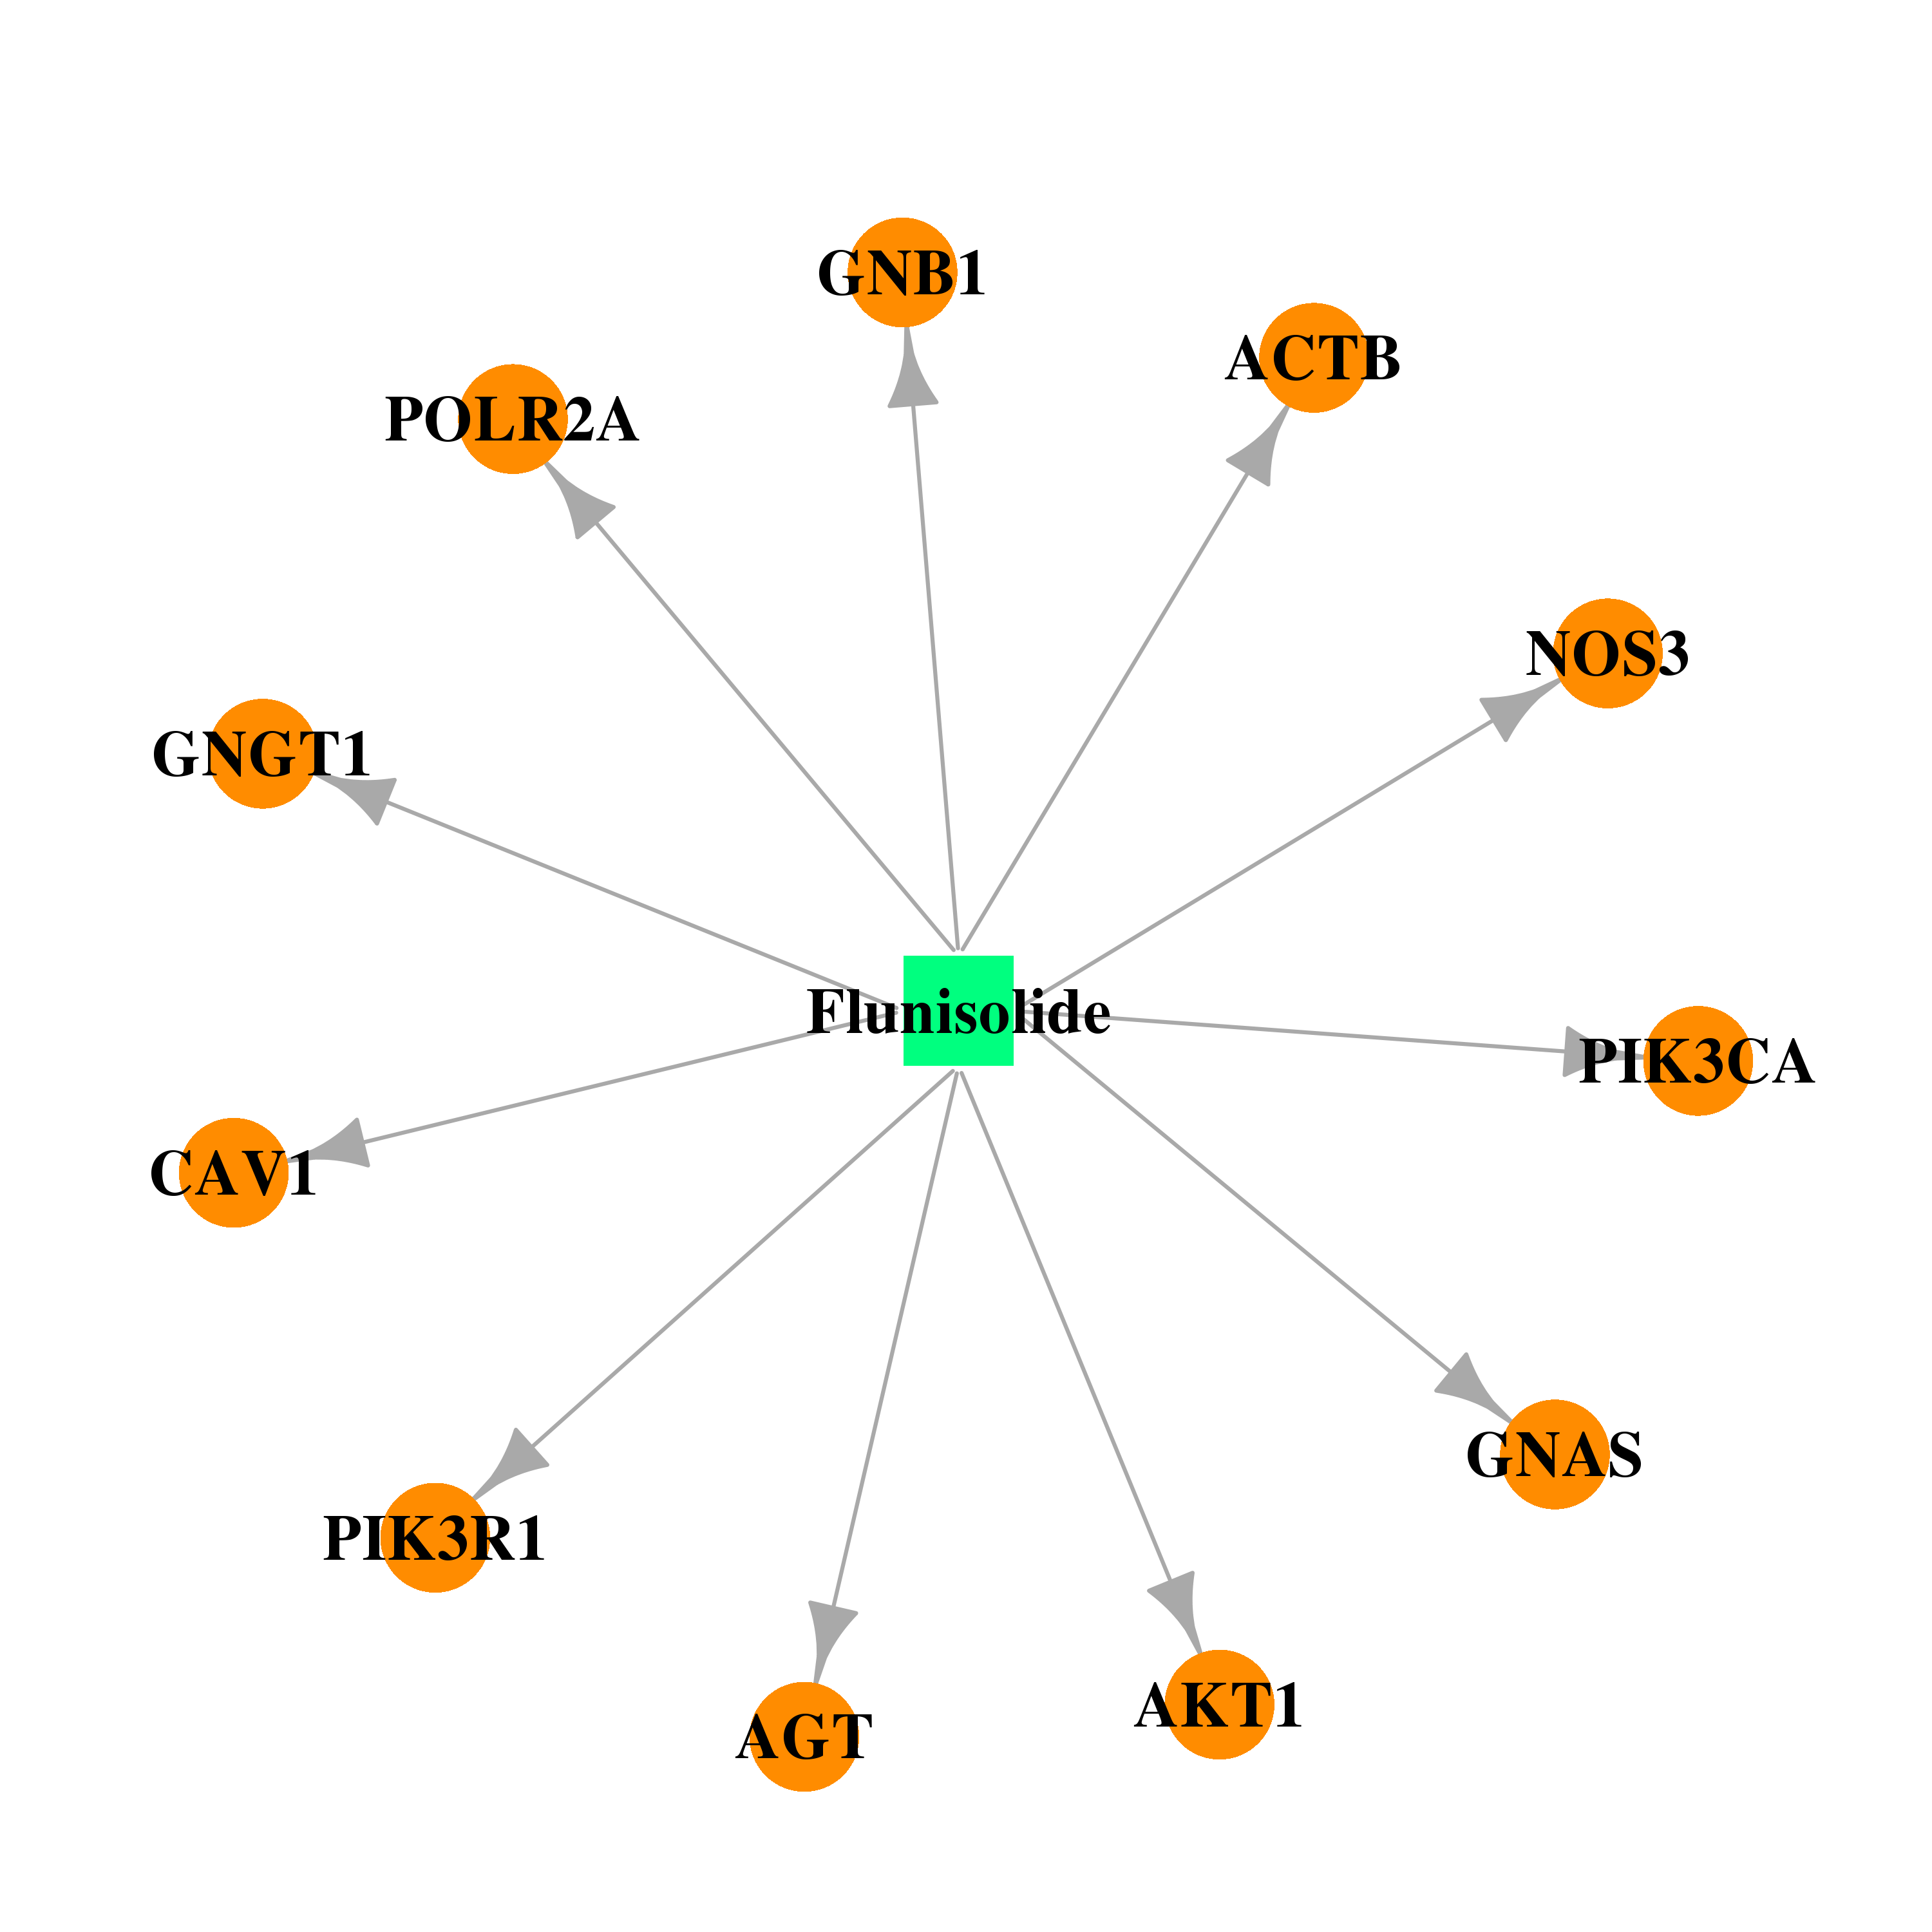 |  |
| DB00588 | GNAS complex locus | approved; investigational | Fluticasone Propionate | 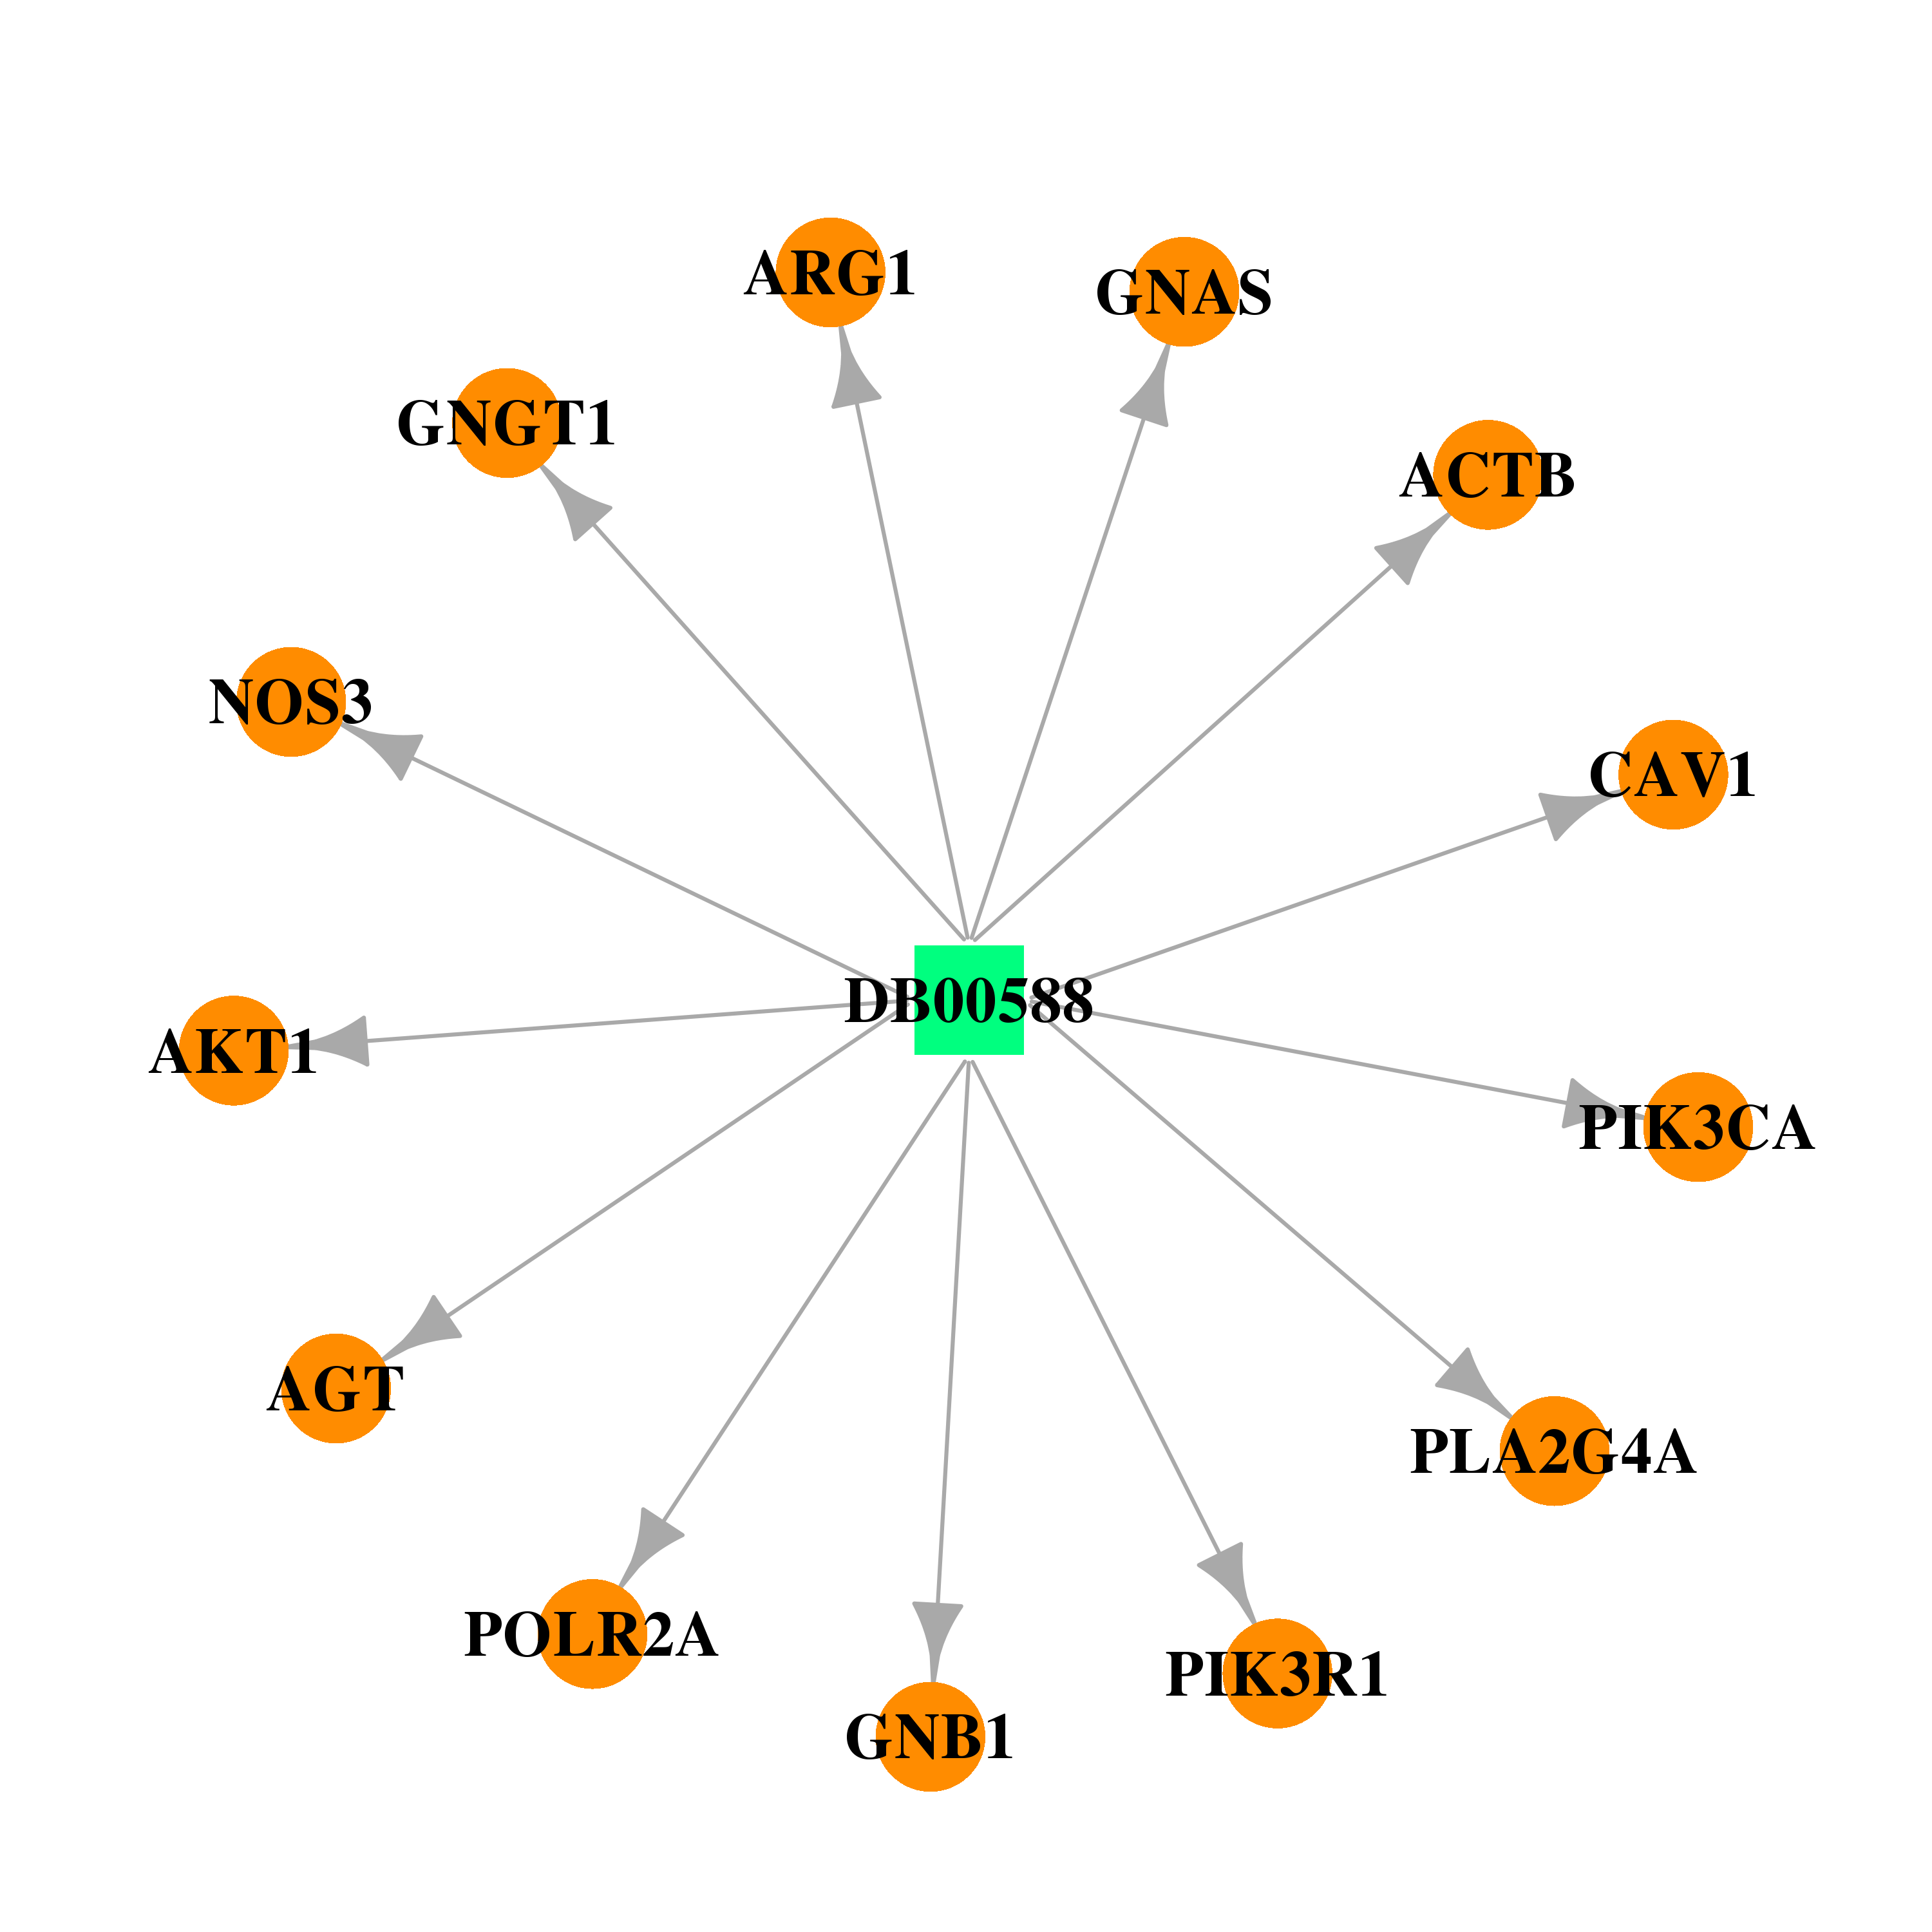 |  |
| DB00741 | GNAS complex locus | approved | Hydrocortisone |  |  |
| DB00959 | GNAS complex locus | approved | Methylprednisolone |  |  |
| DB00764 | GNAS complex locus | approved | Mometasone | 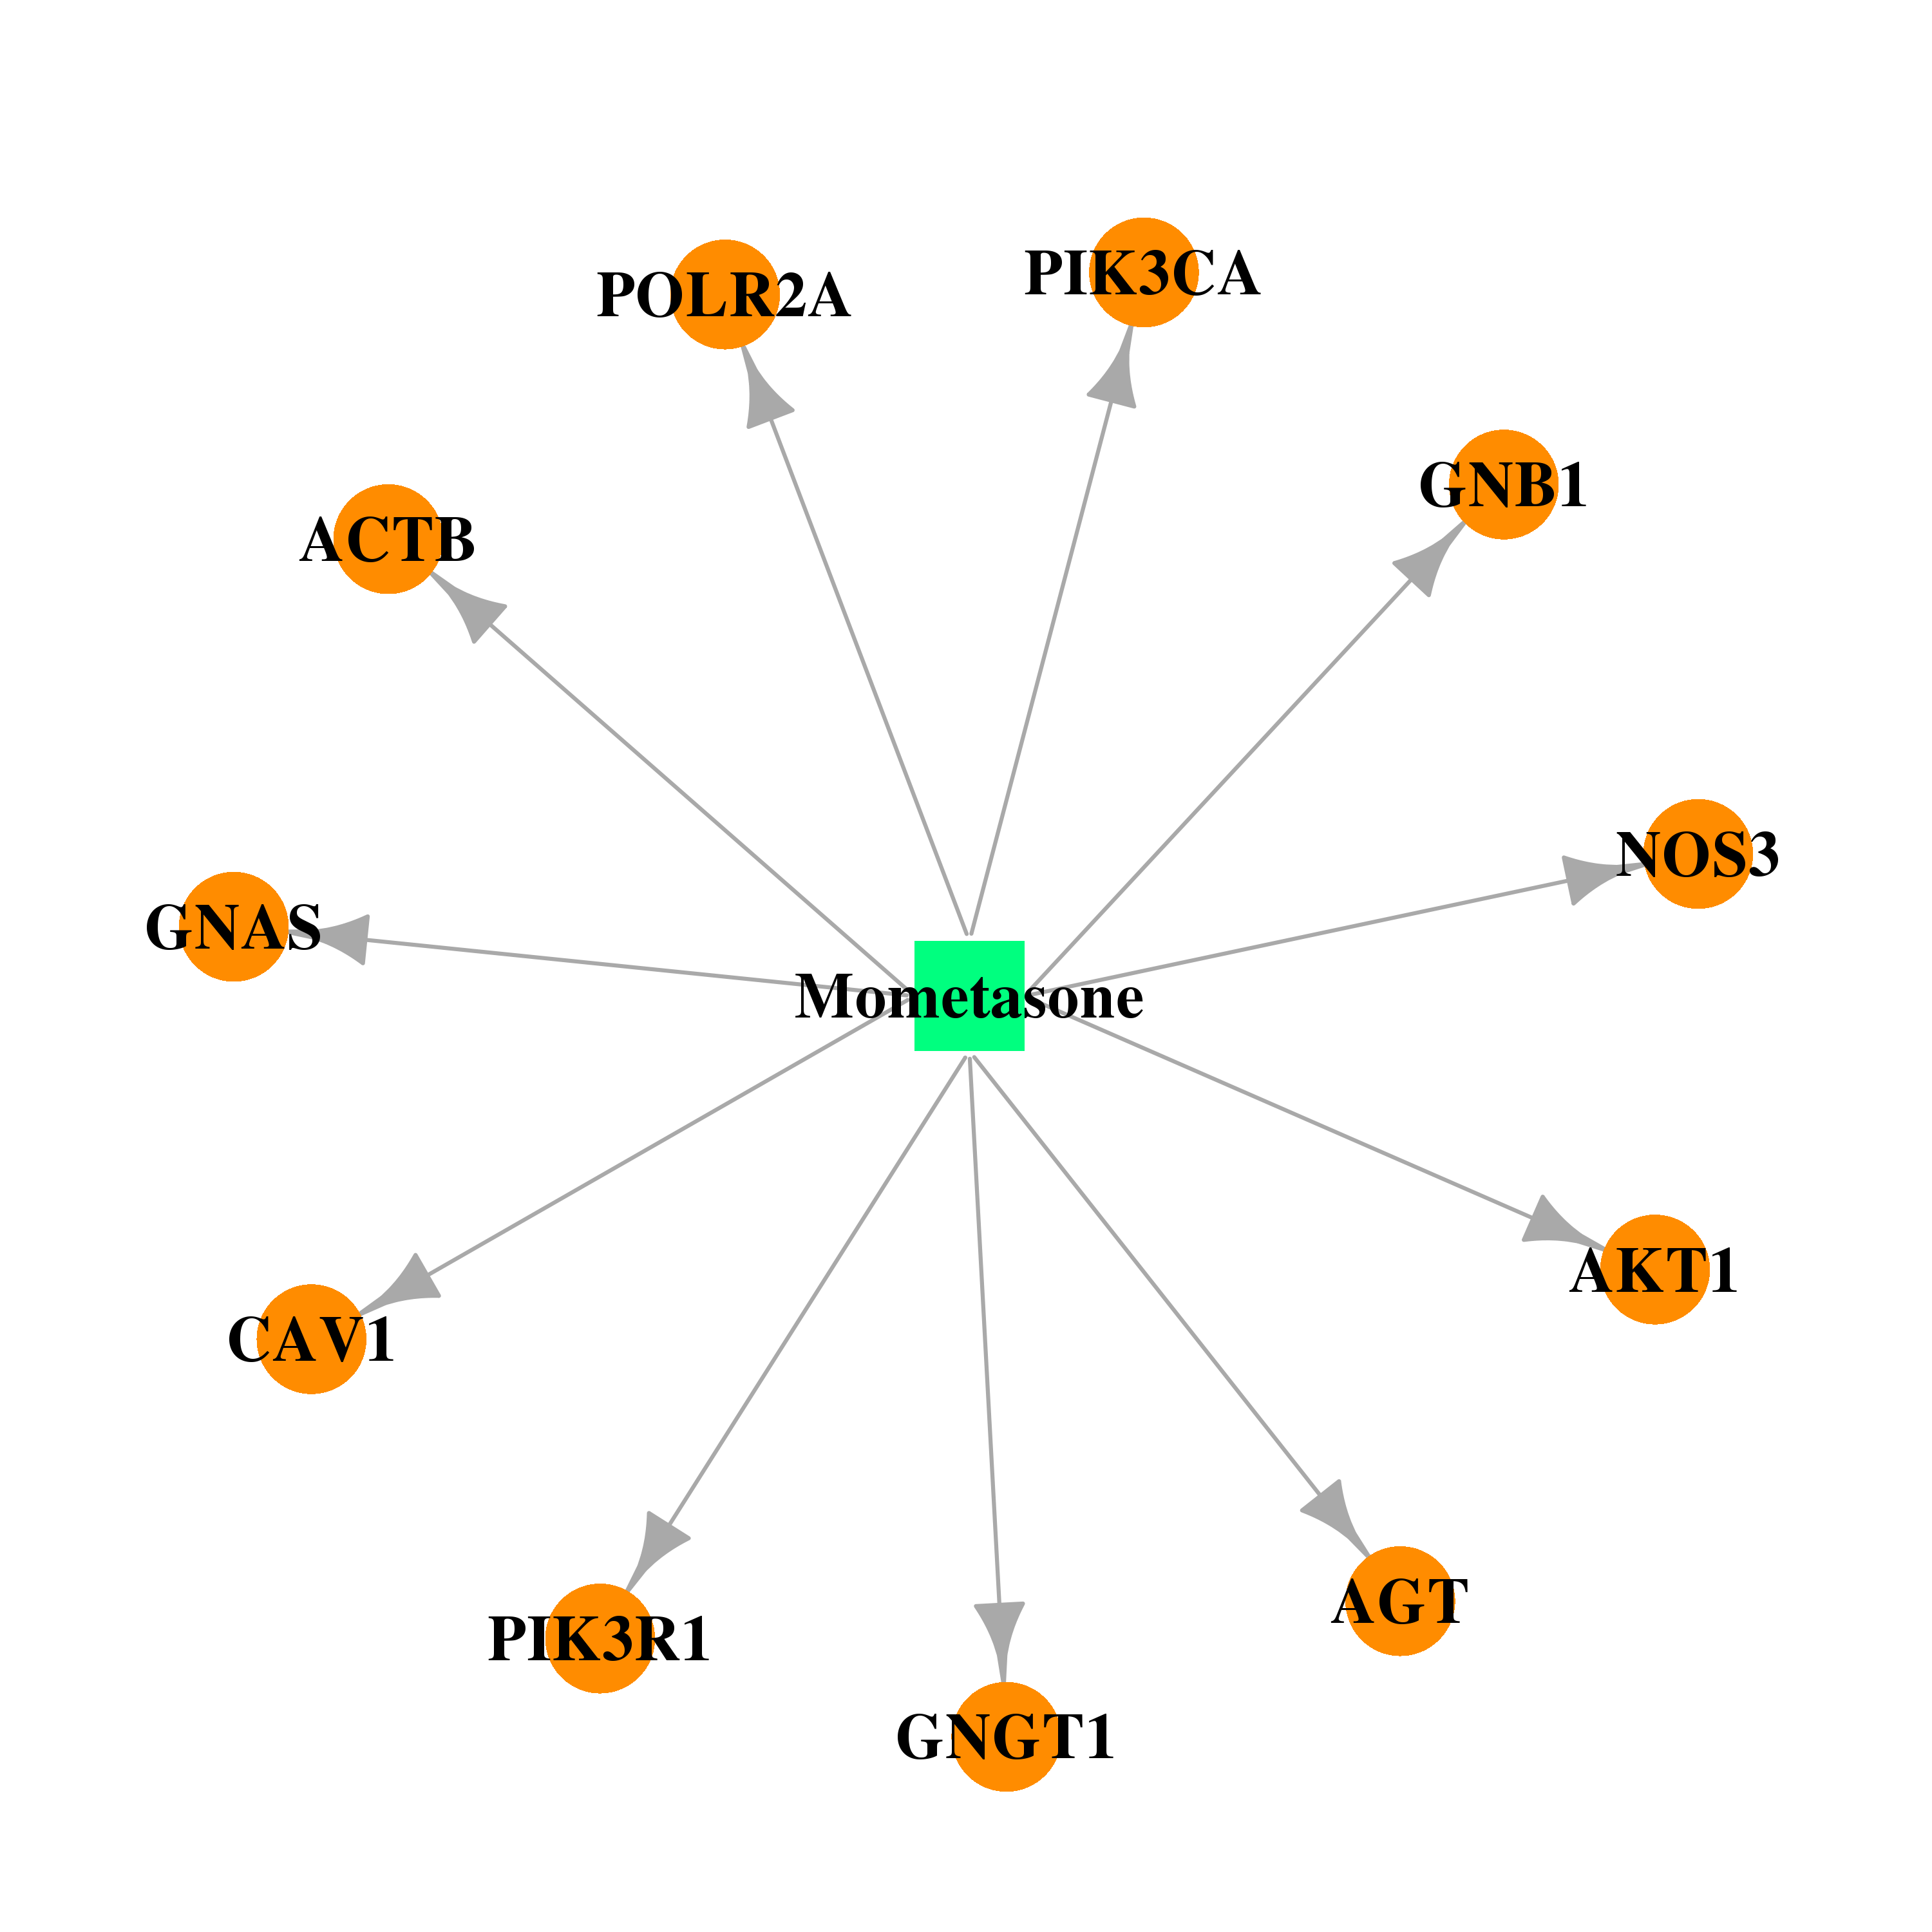 |  |
| DB01384 | GNAS complex locus | approved | Paramethasone | 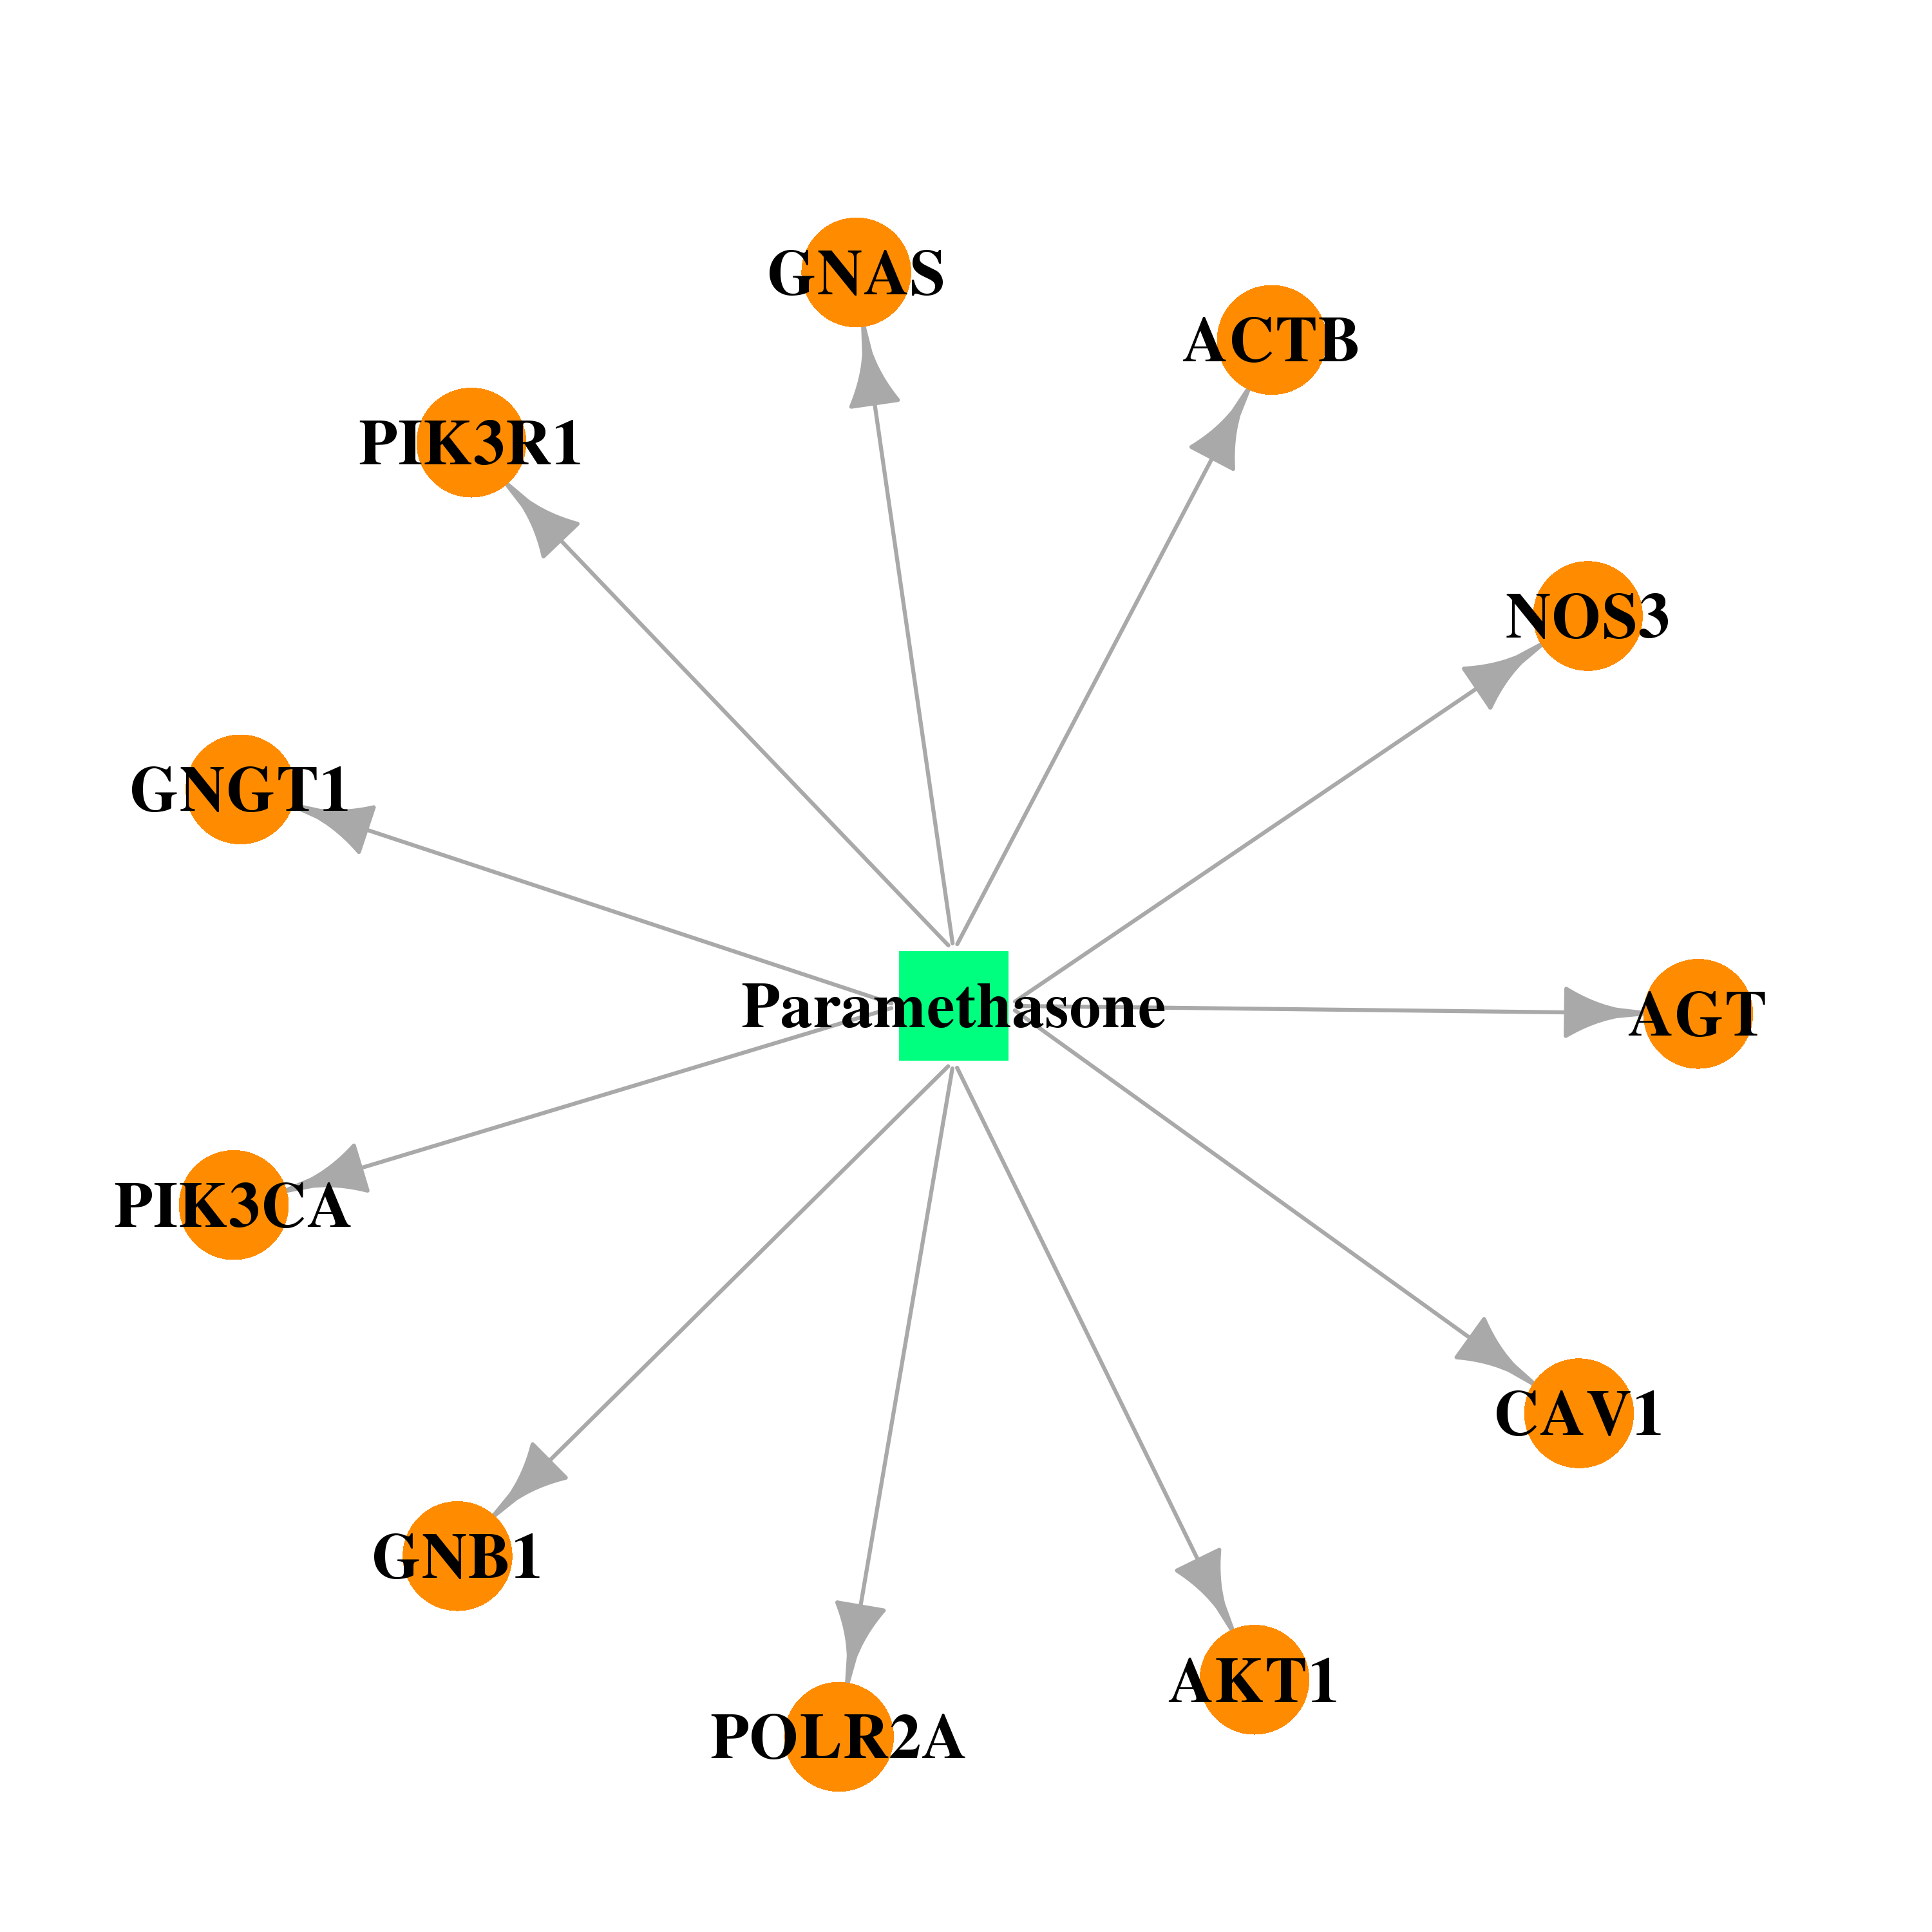 | 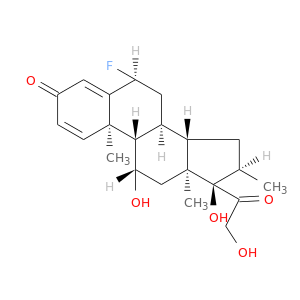 |
| DB00860 | GNAS complex locus | approved | Prednisolone | 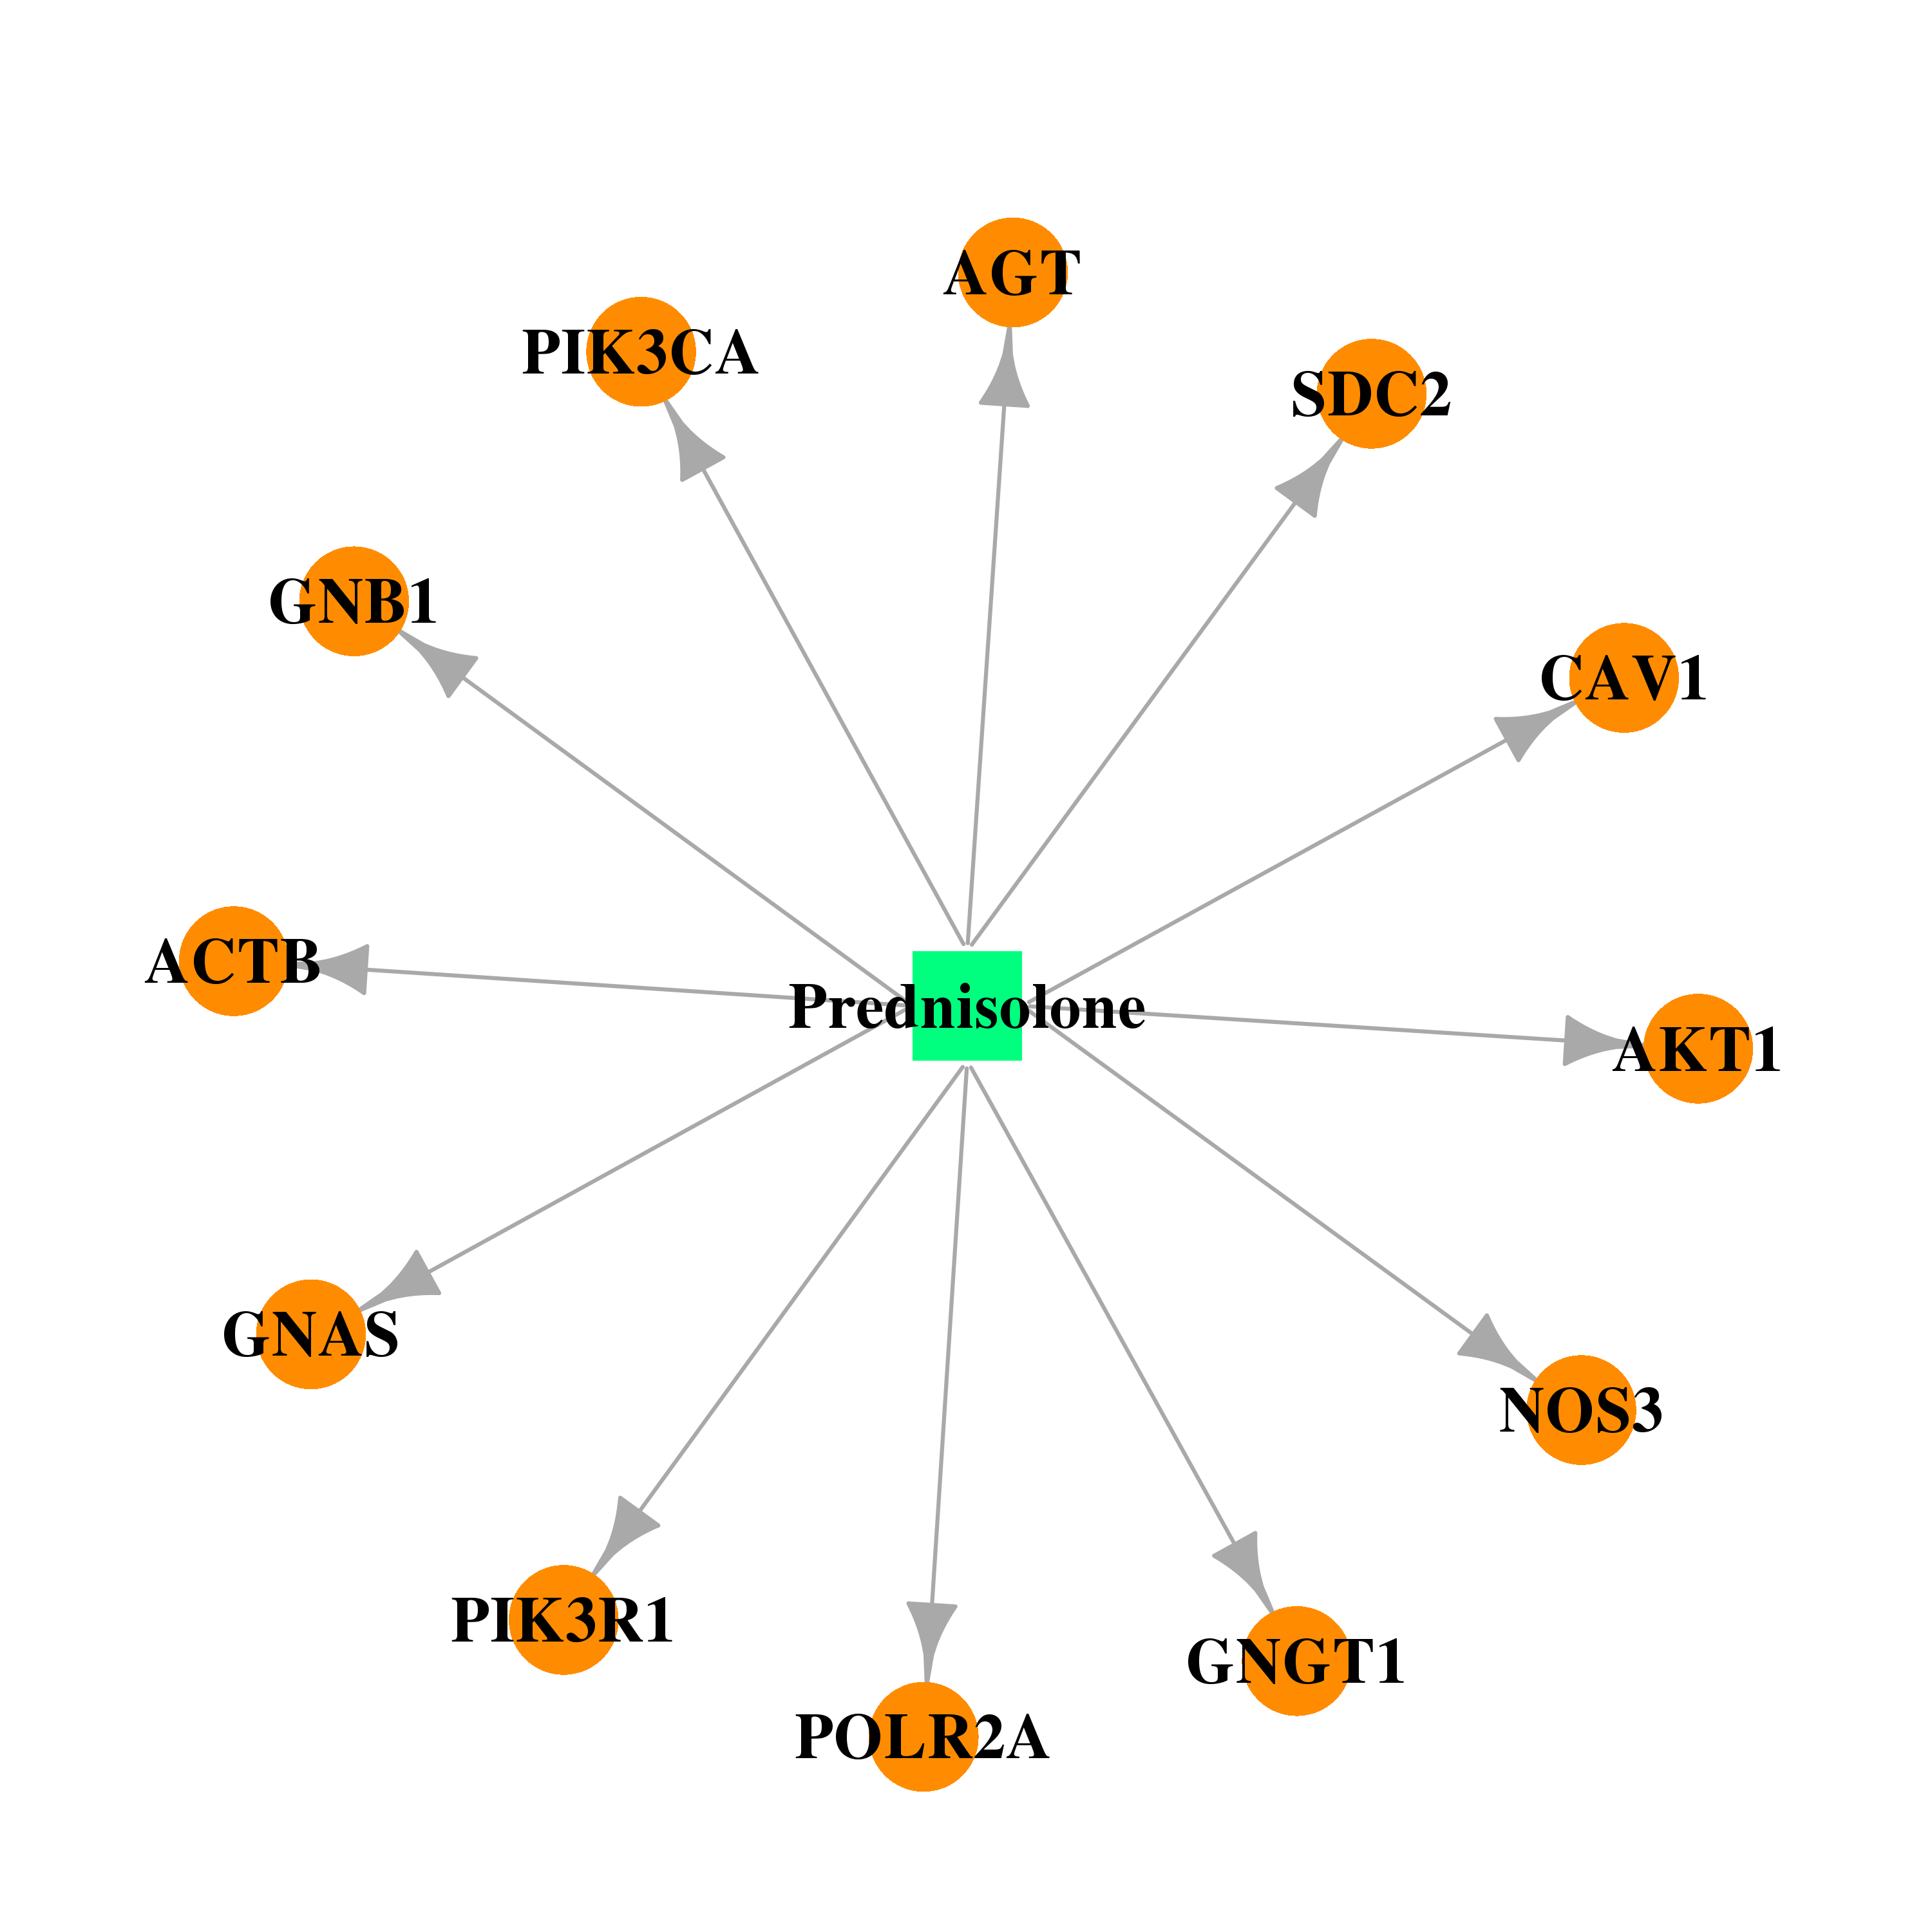 |  |
| DB00635 | GNAS complex locus | approved | Prednisone | 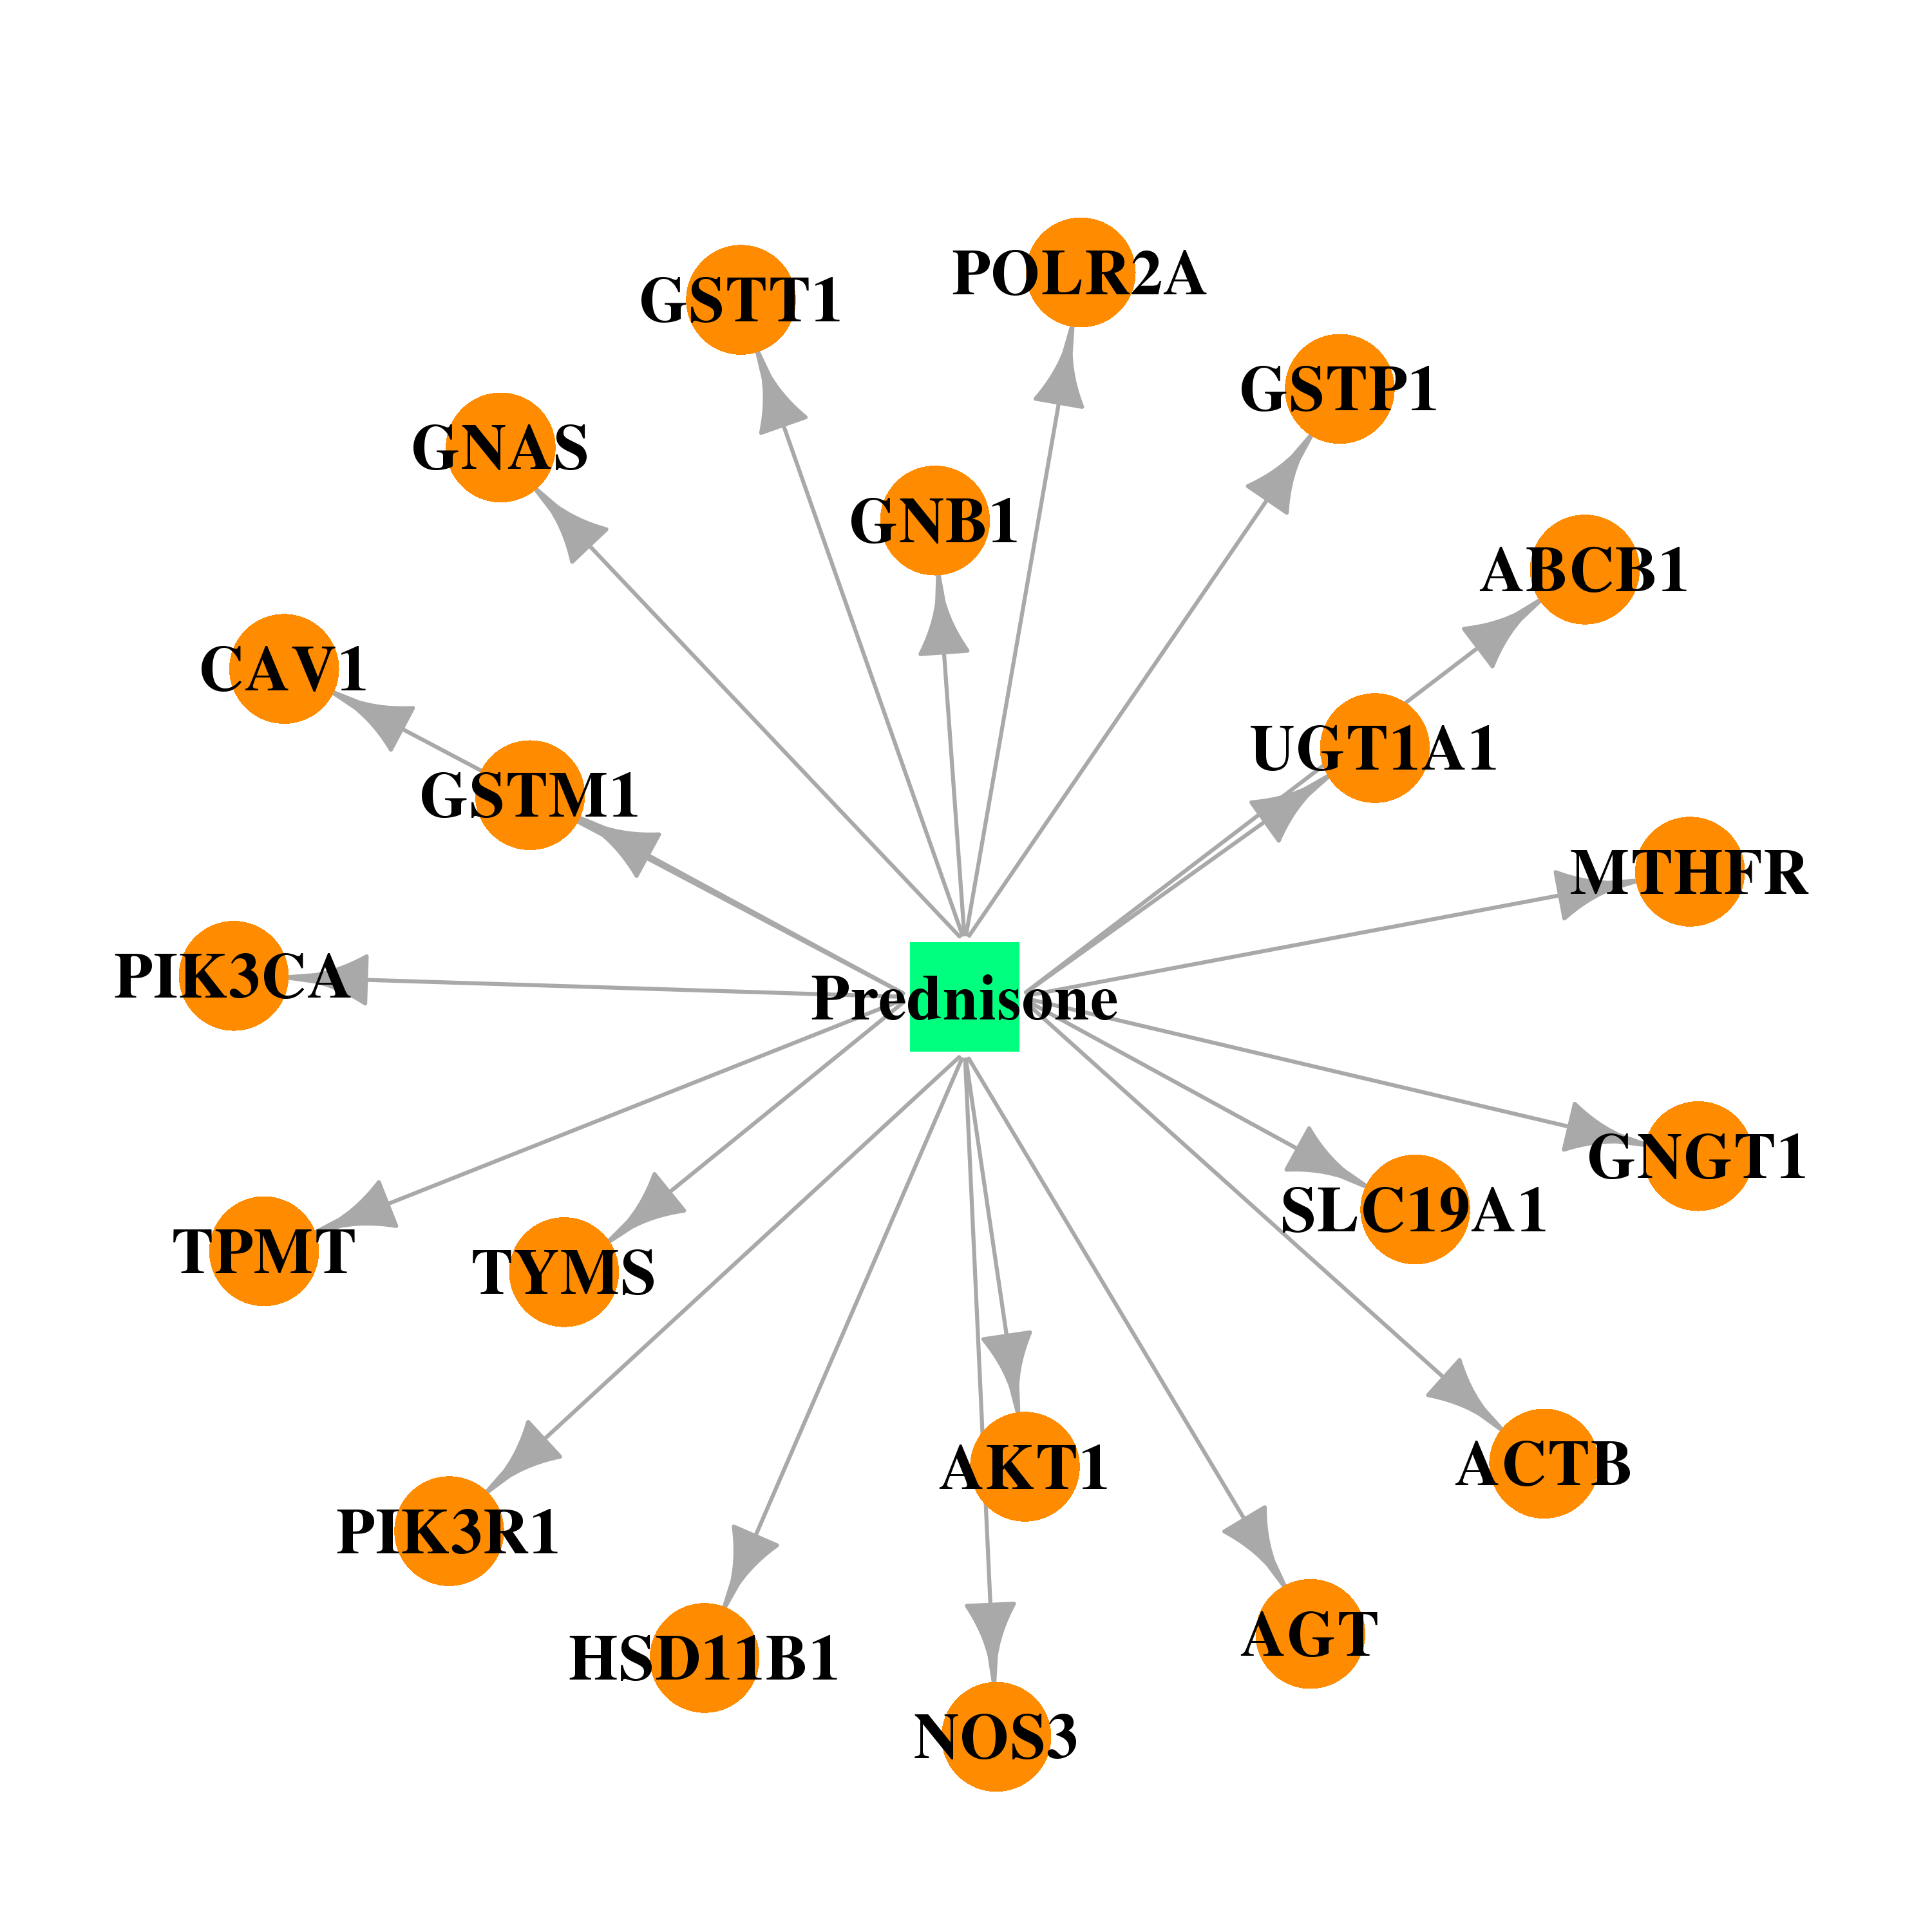 |  |
| DB00896 | GNAS complex locus | approved | Rimexolone |  |  |
| DB00620 | GNAS complex locus | approved | Triamcinolone |  |  |
| DB00125 | GNAS complex locus | approved; nutraceutical | L-Arginine |  |  |
| DB00155 | GNAS complex locus | approved; nutraceutical | L-Citrulline | 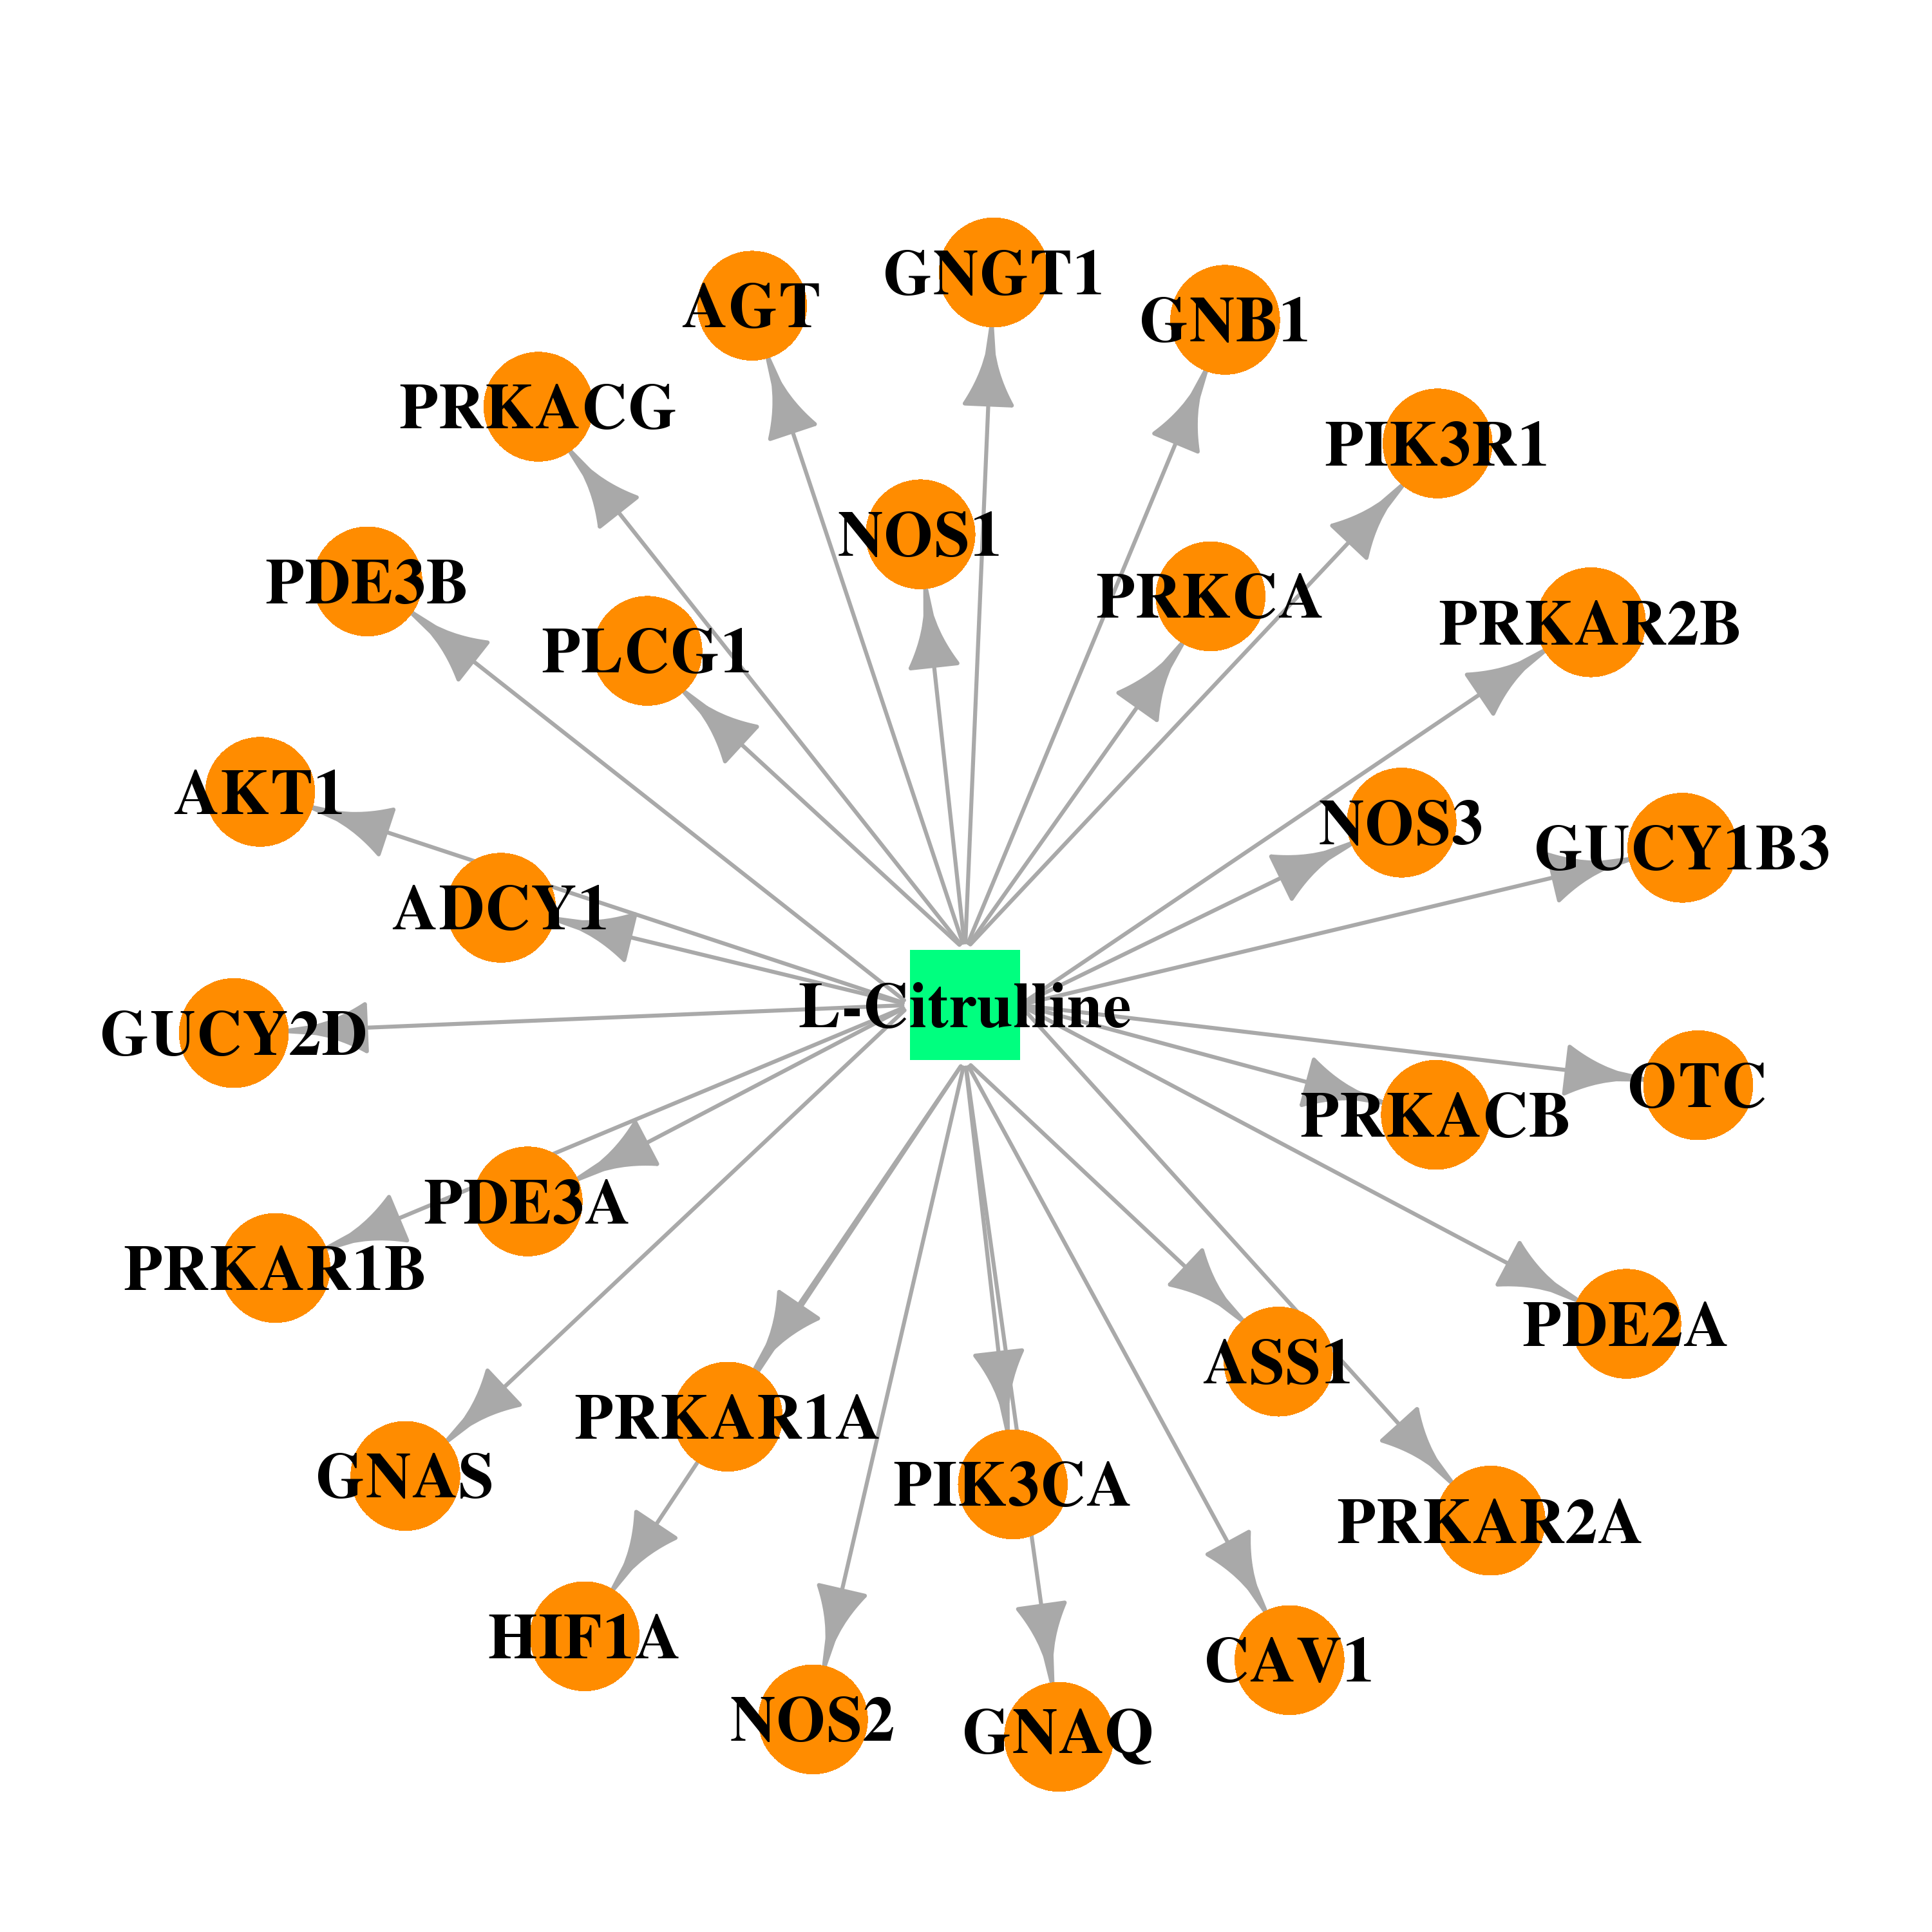 |  |
| DB00435 | GNAS complex locus | approved | Nitric Oxide | 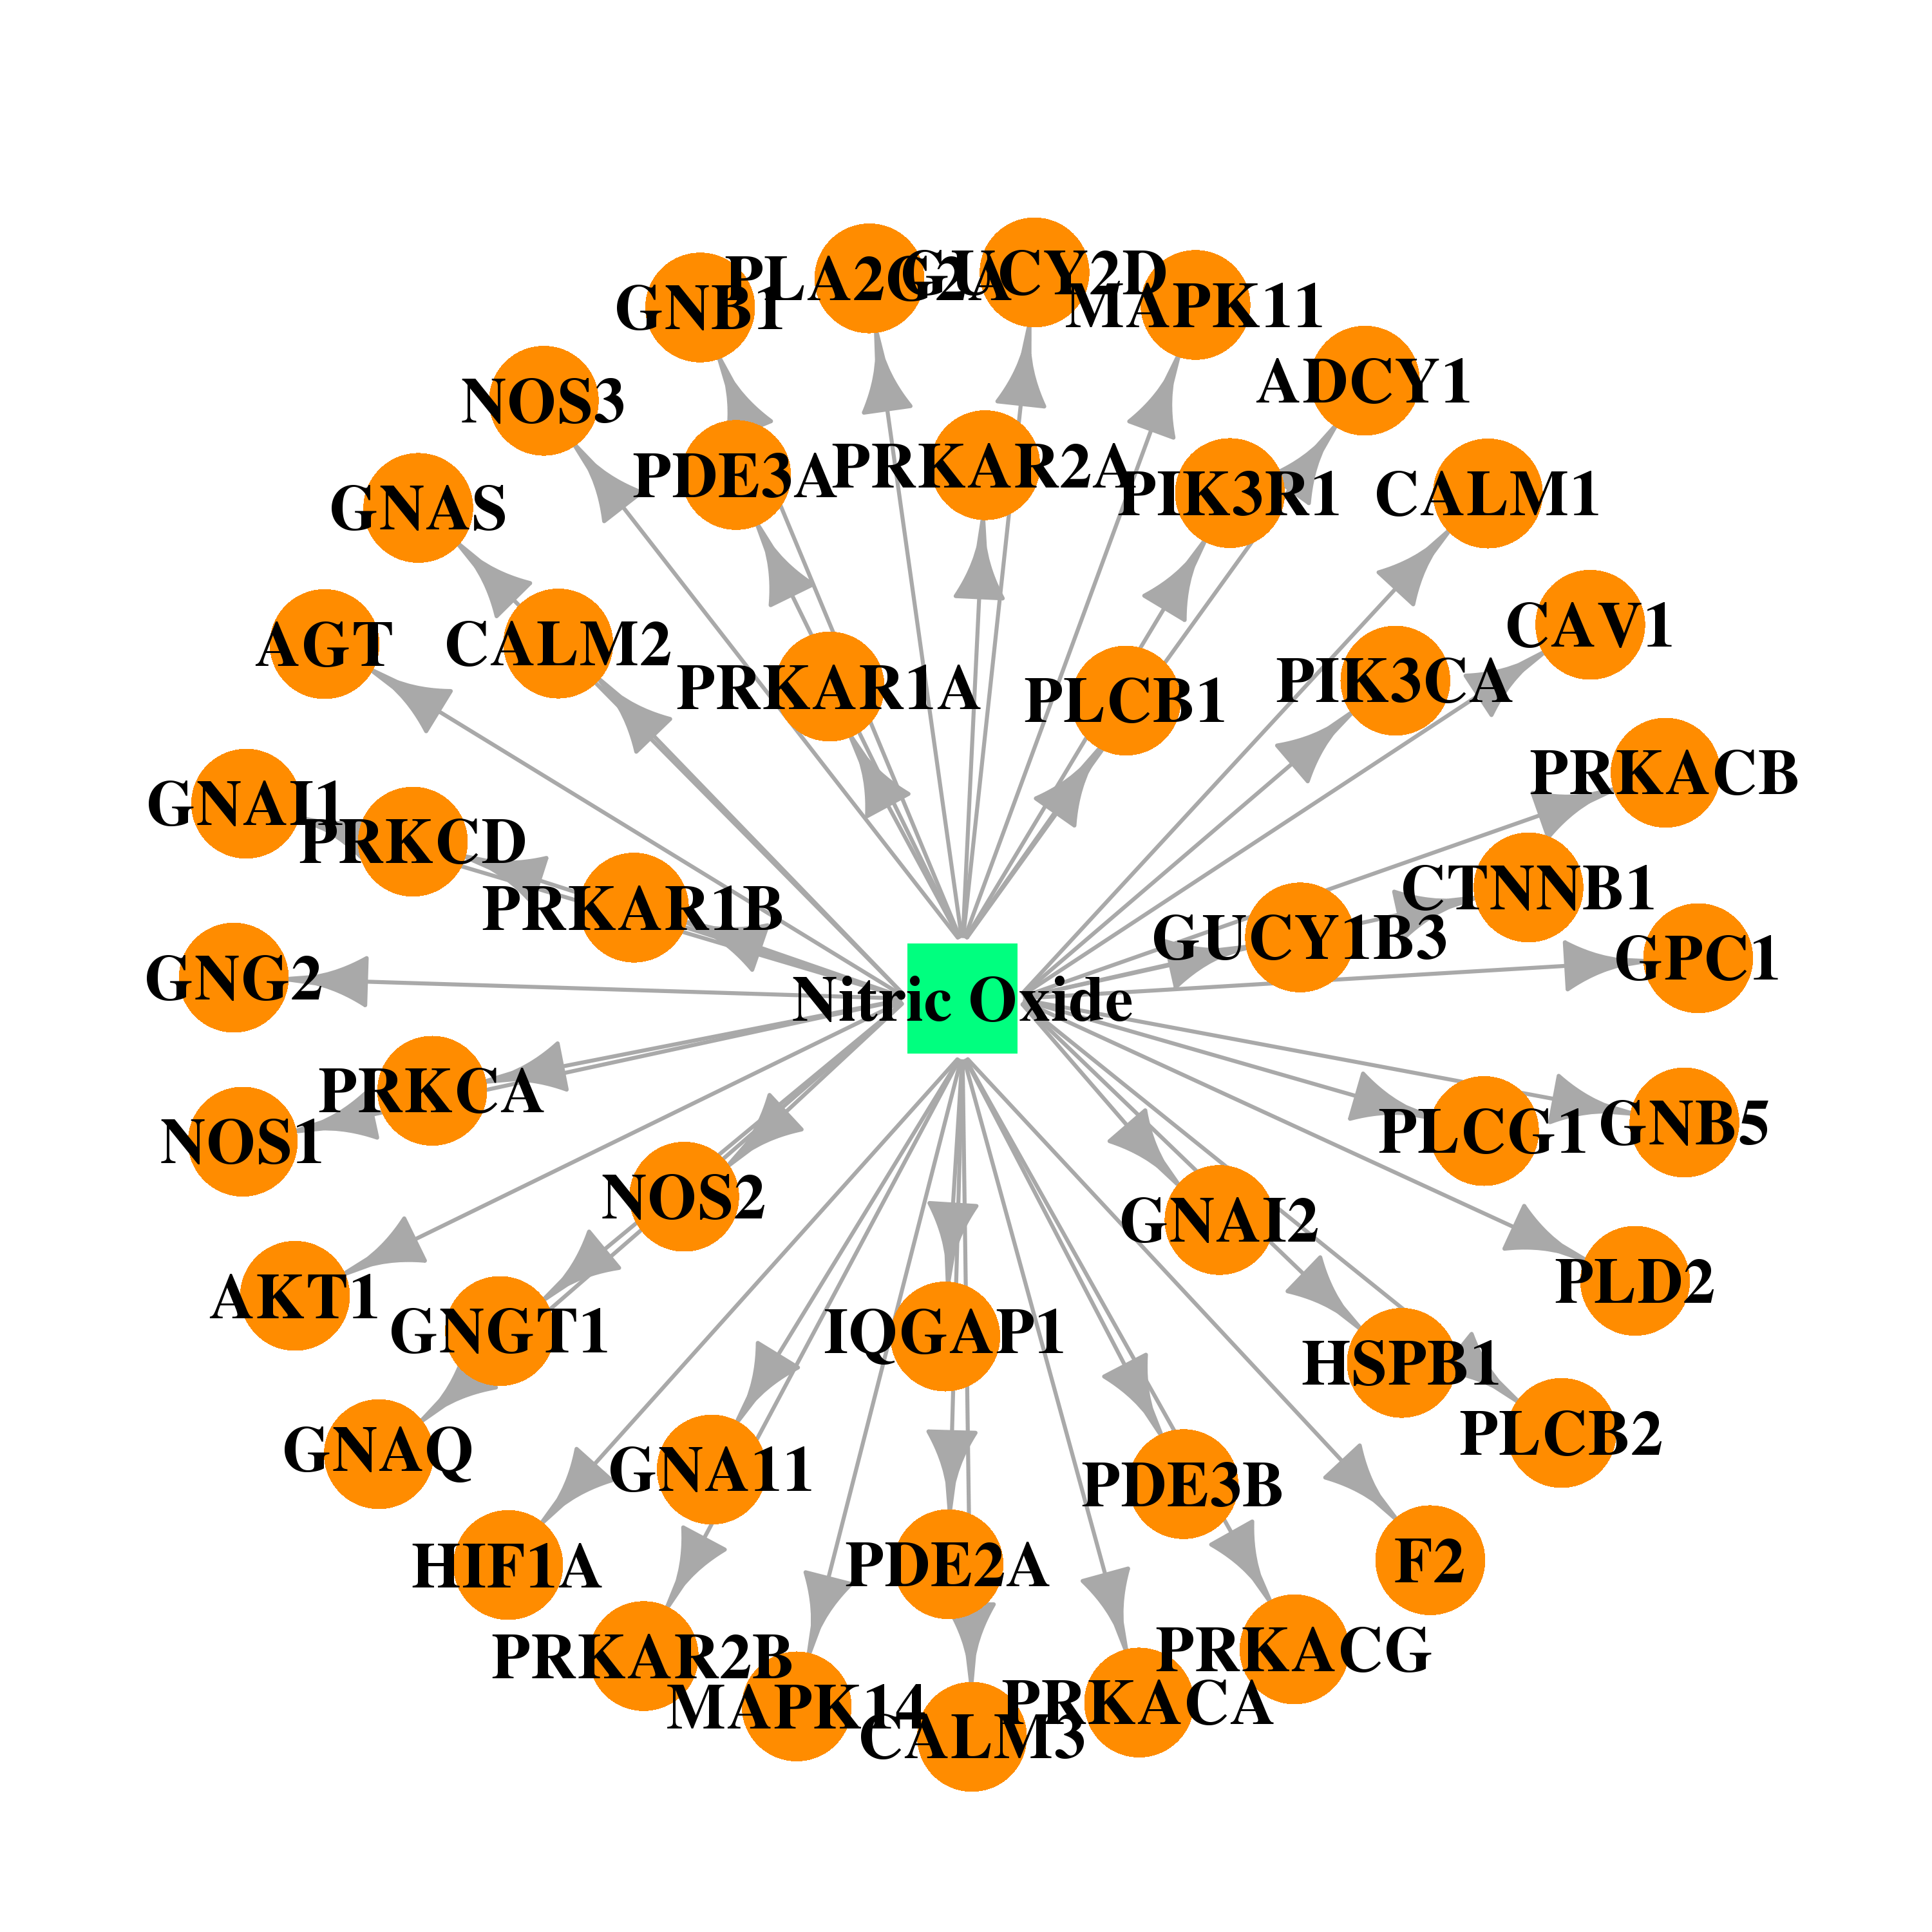 |  |
| DB00988 | GNAS complex locus | approved | Dopamine | 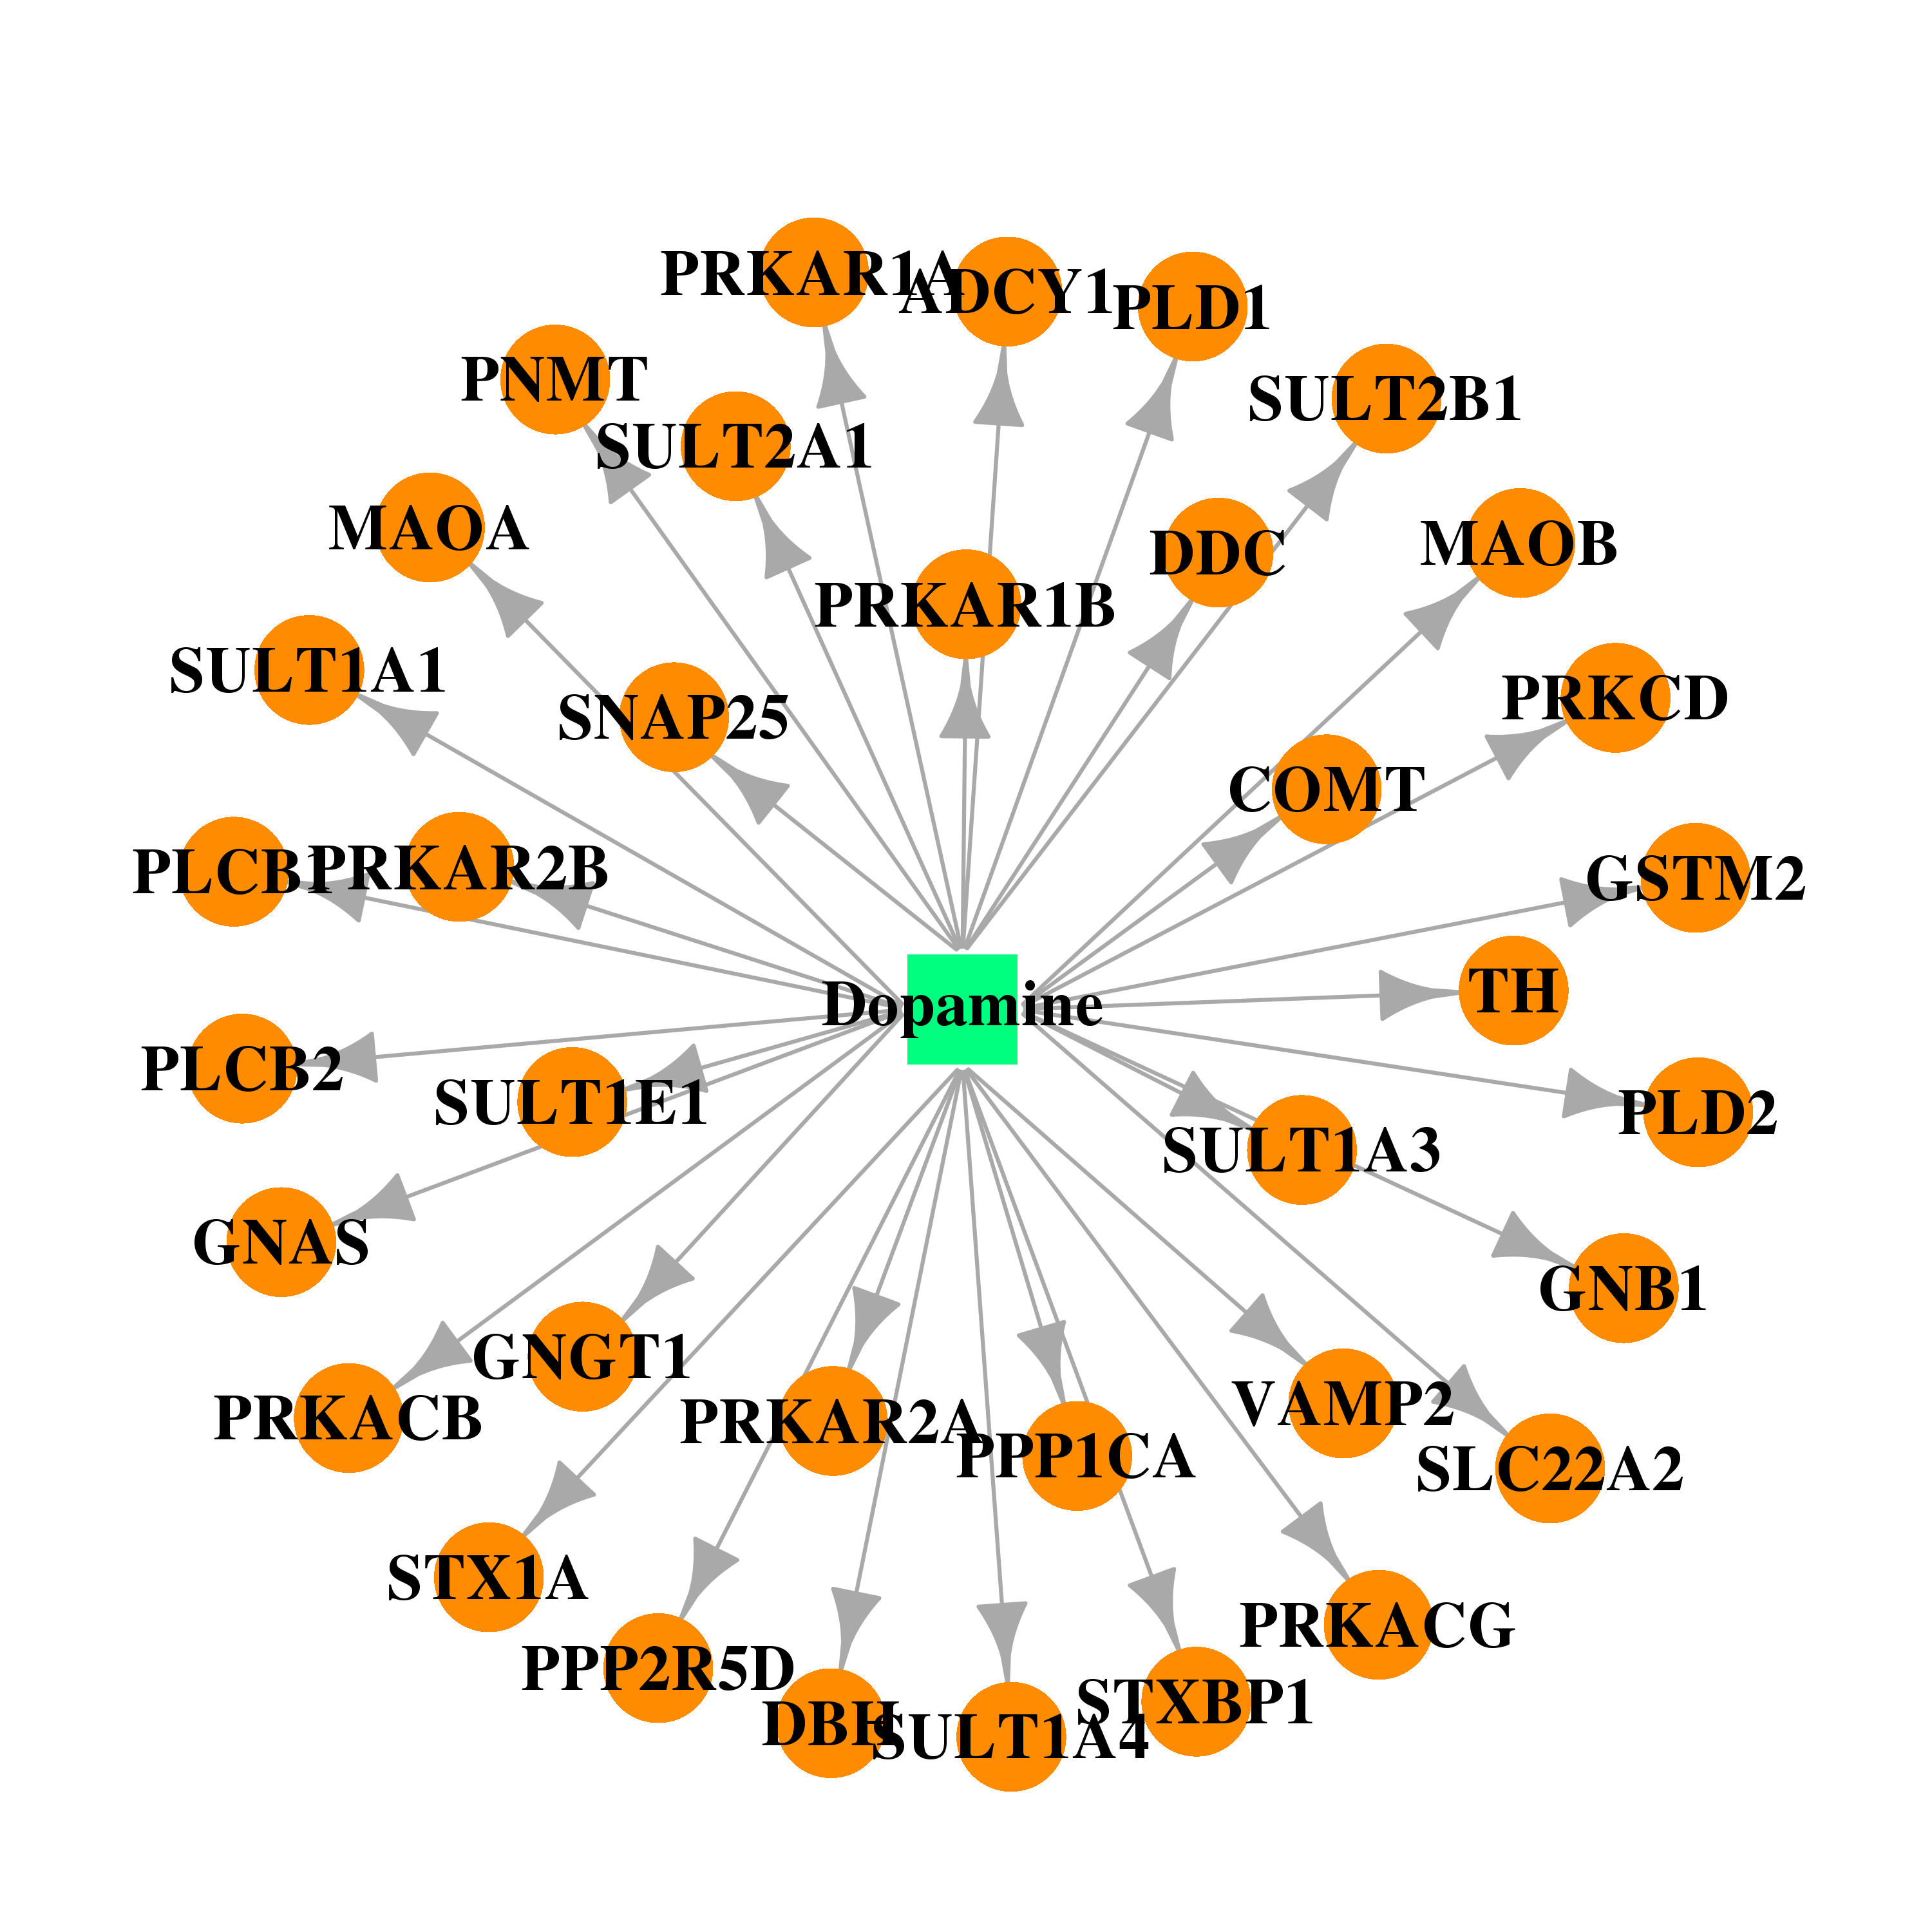 | 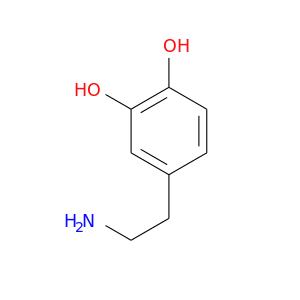 |
| DB00131 | GNAS complex locus | approved; nutraceutical | Adenosine monophosphate | 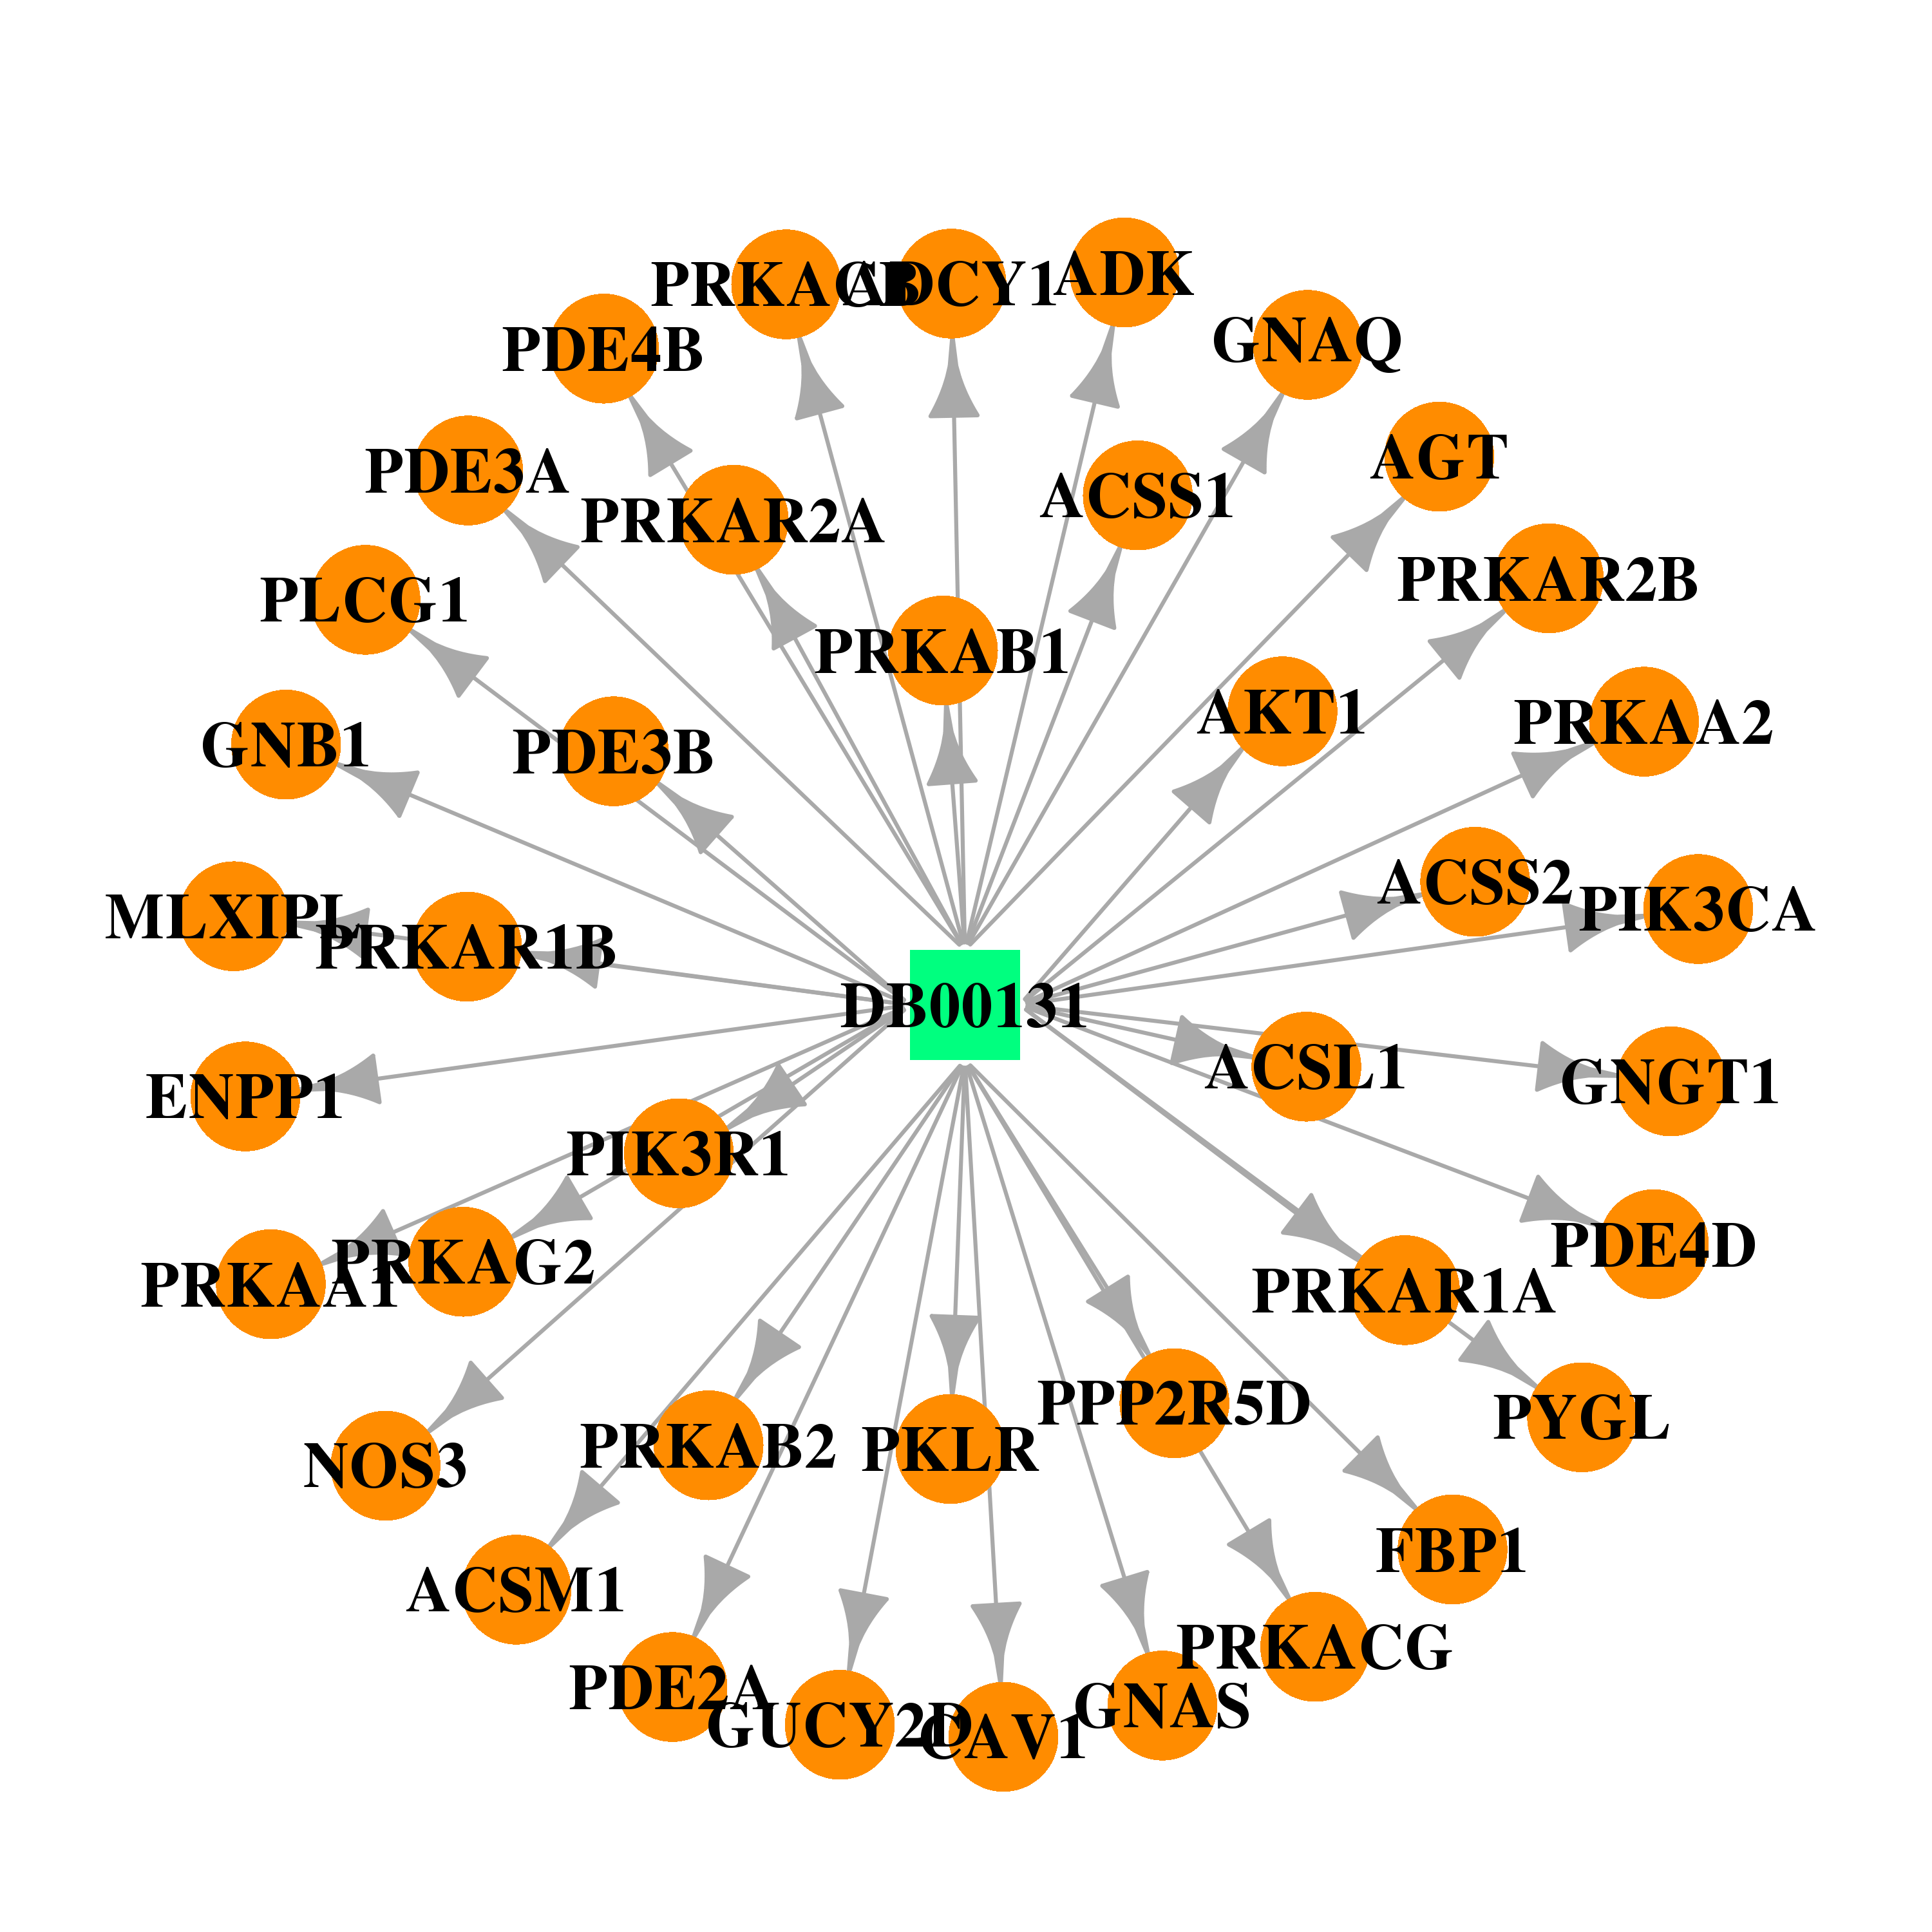 | 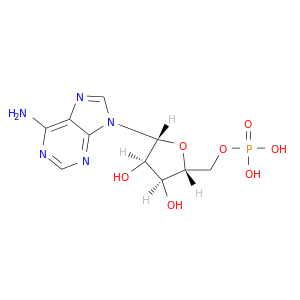 |
| DB00171 | GNAS complex locus | approved; nutraceutical | Adenosine triphosphate |  |  |
| DB00770 | GNAS complex locus | approved; investigational | Alprostadil | 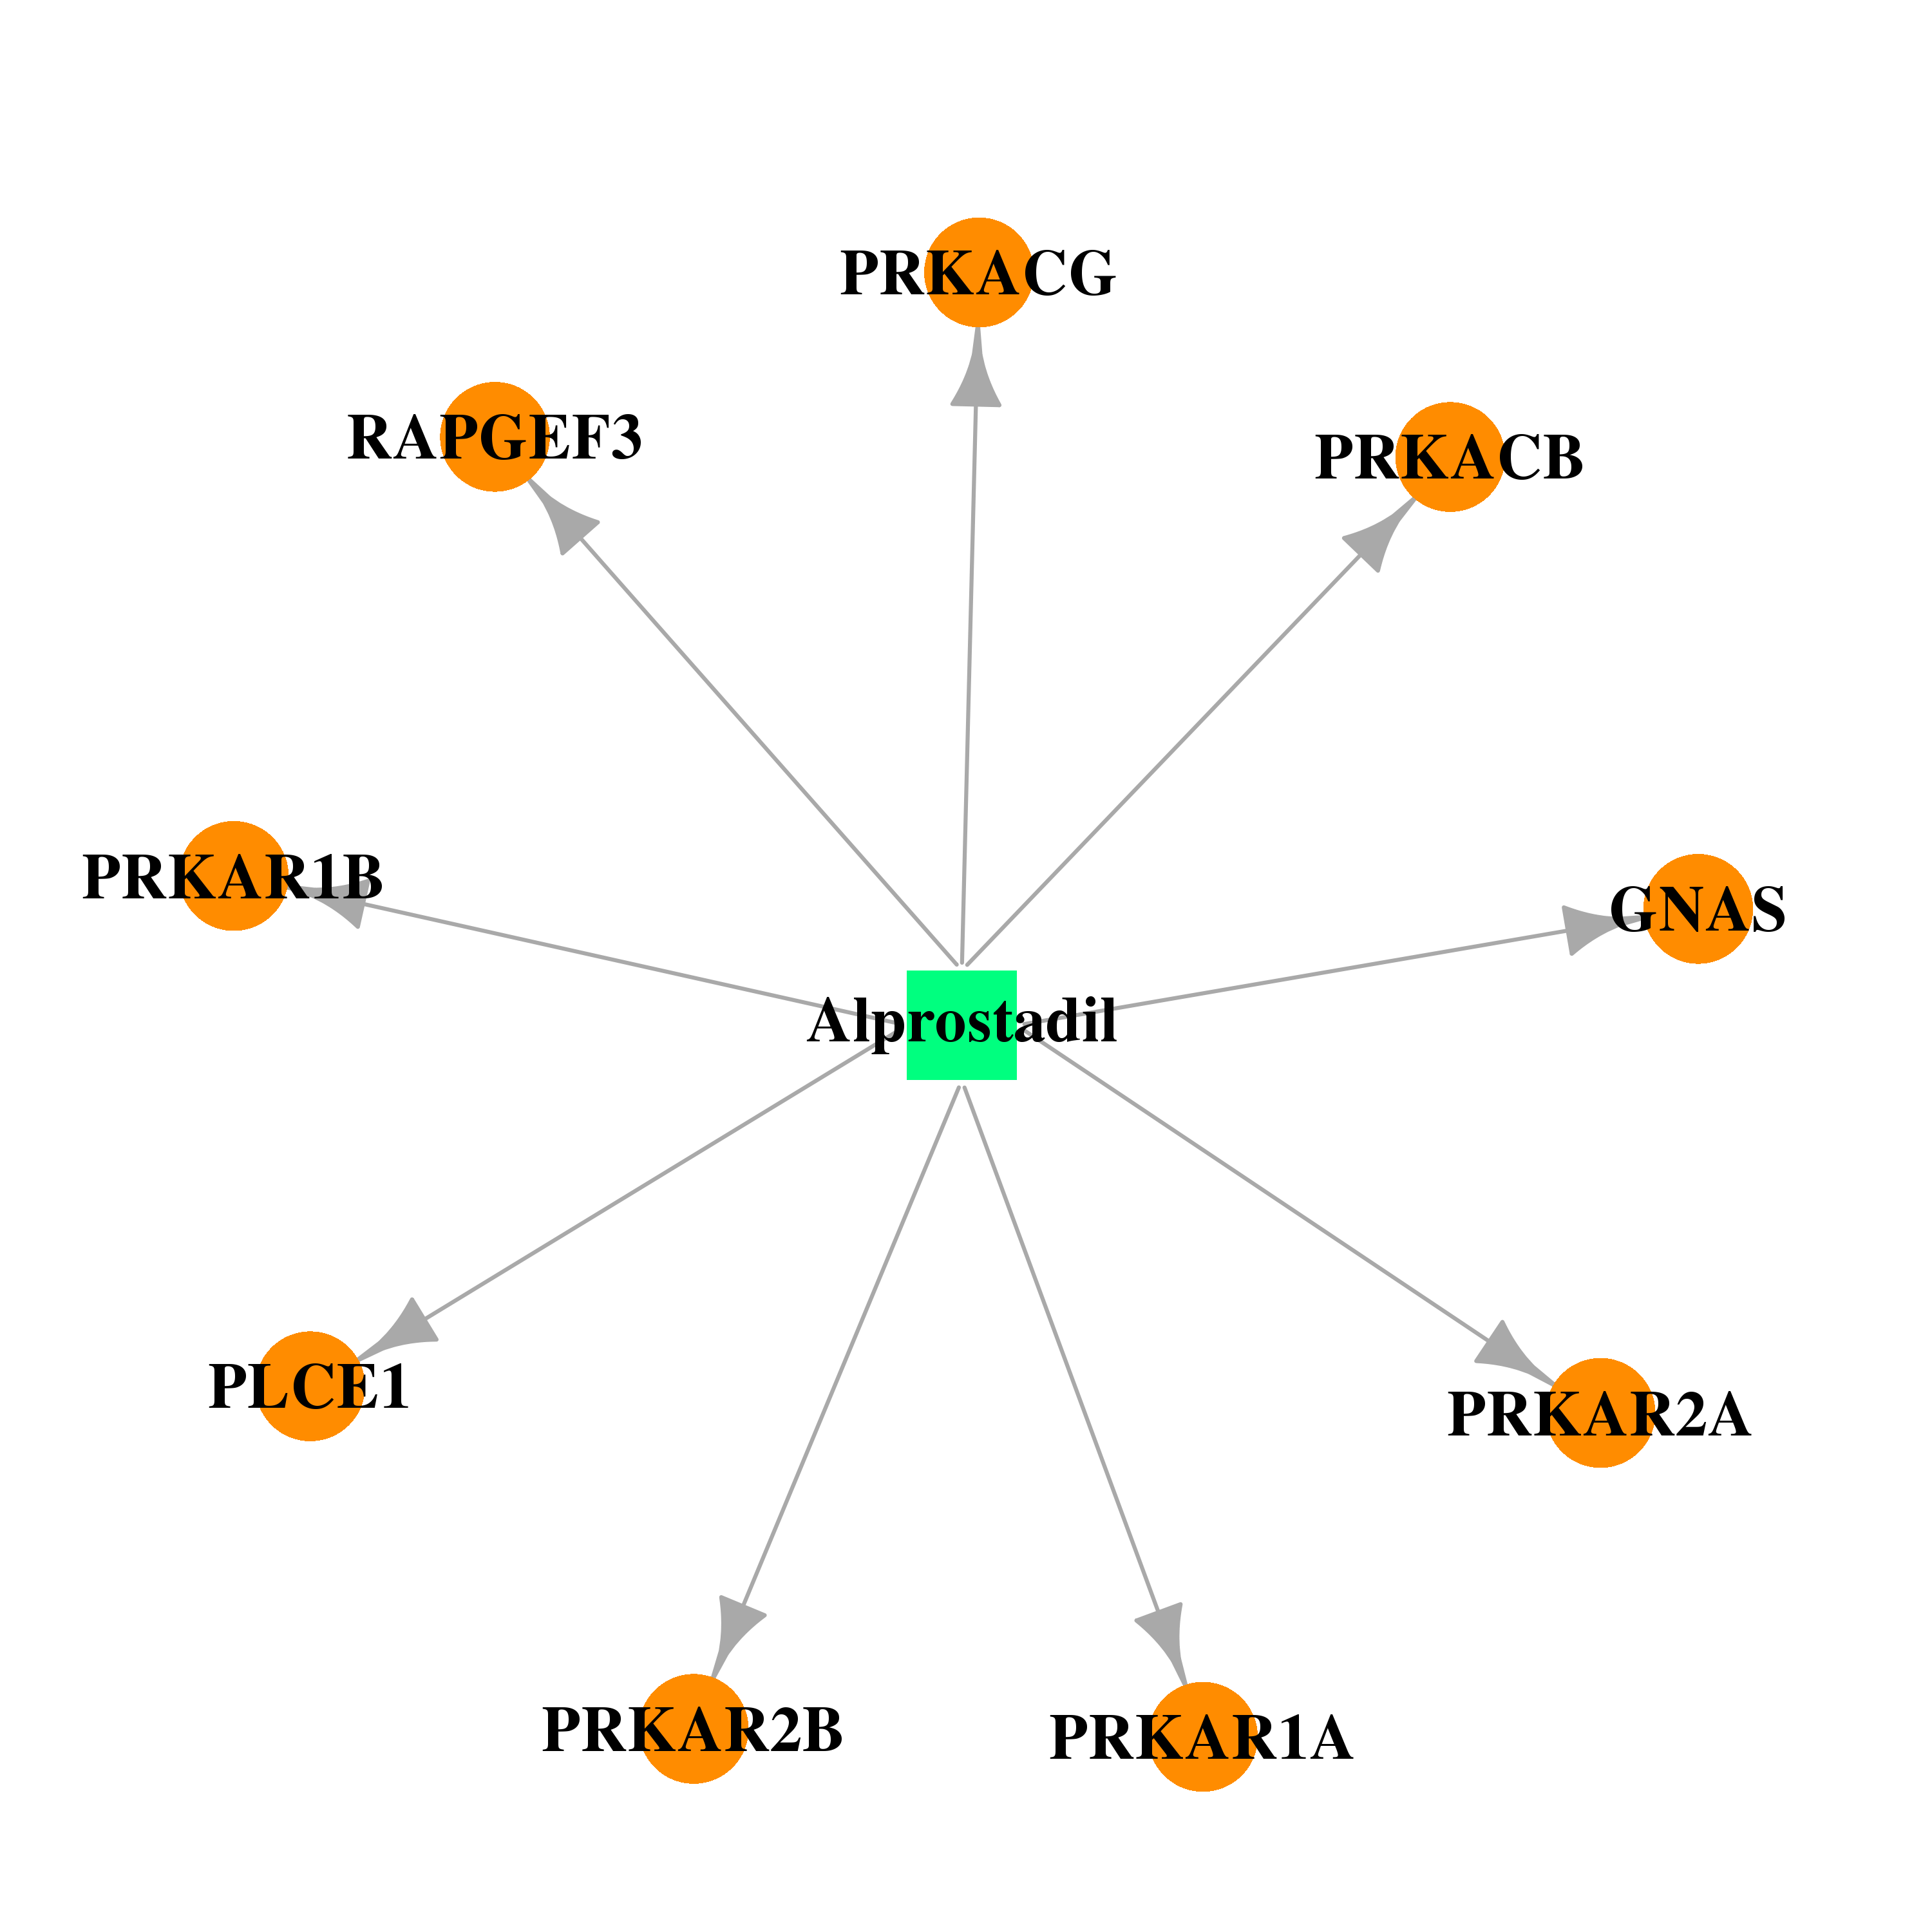 | 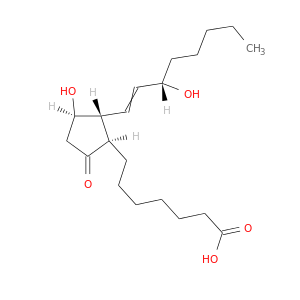 |
| DB00668 | GNAS complex locus | approved | Epinephrine | 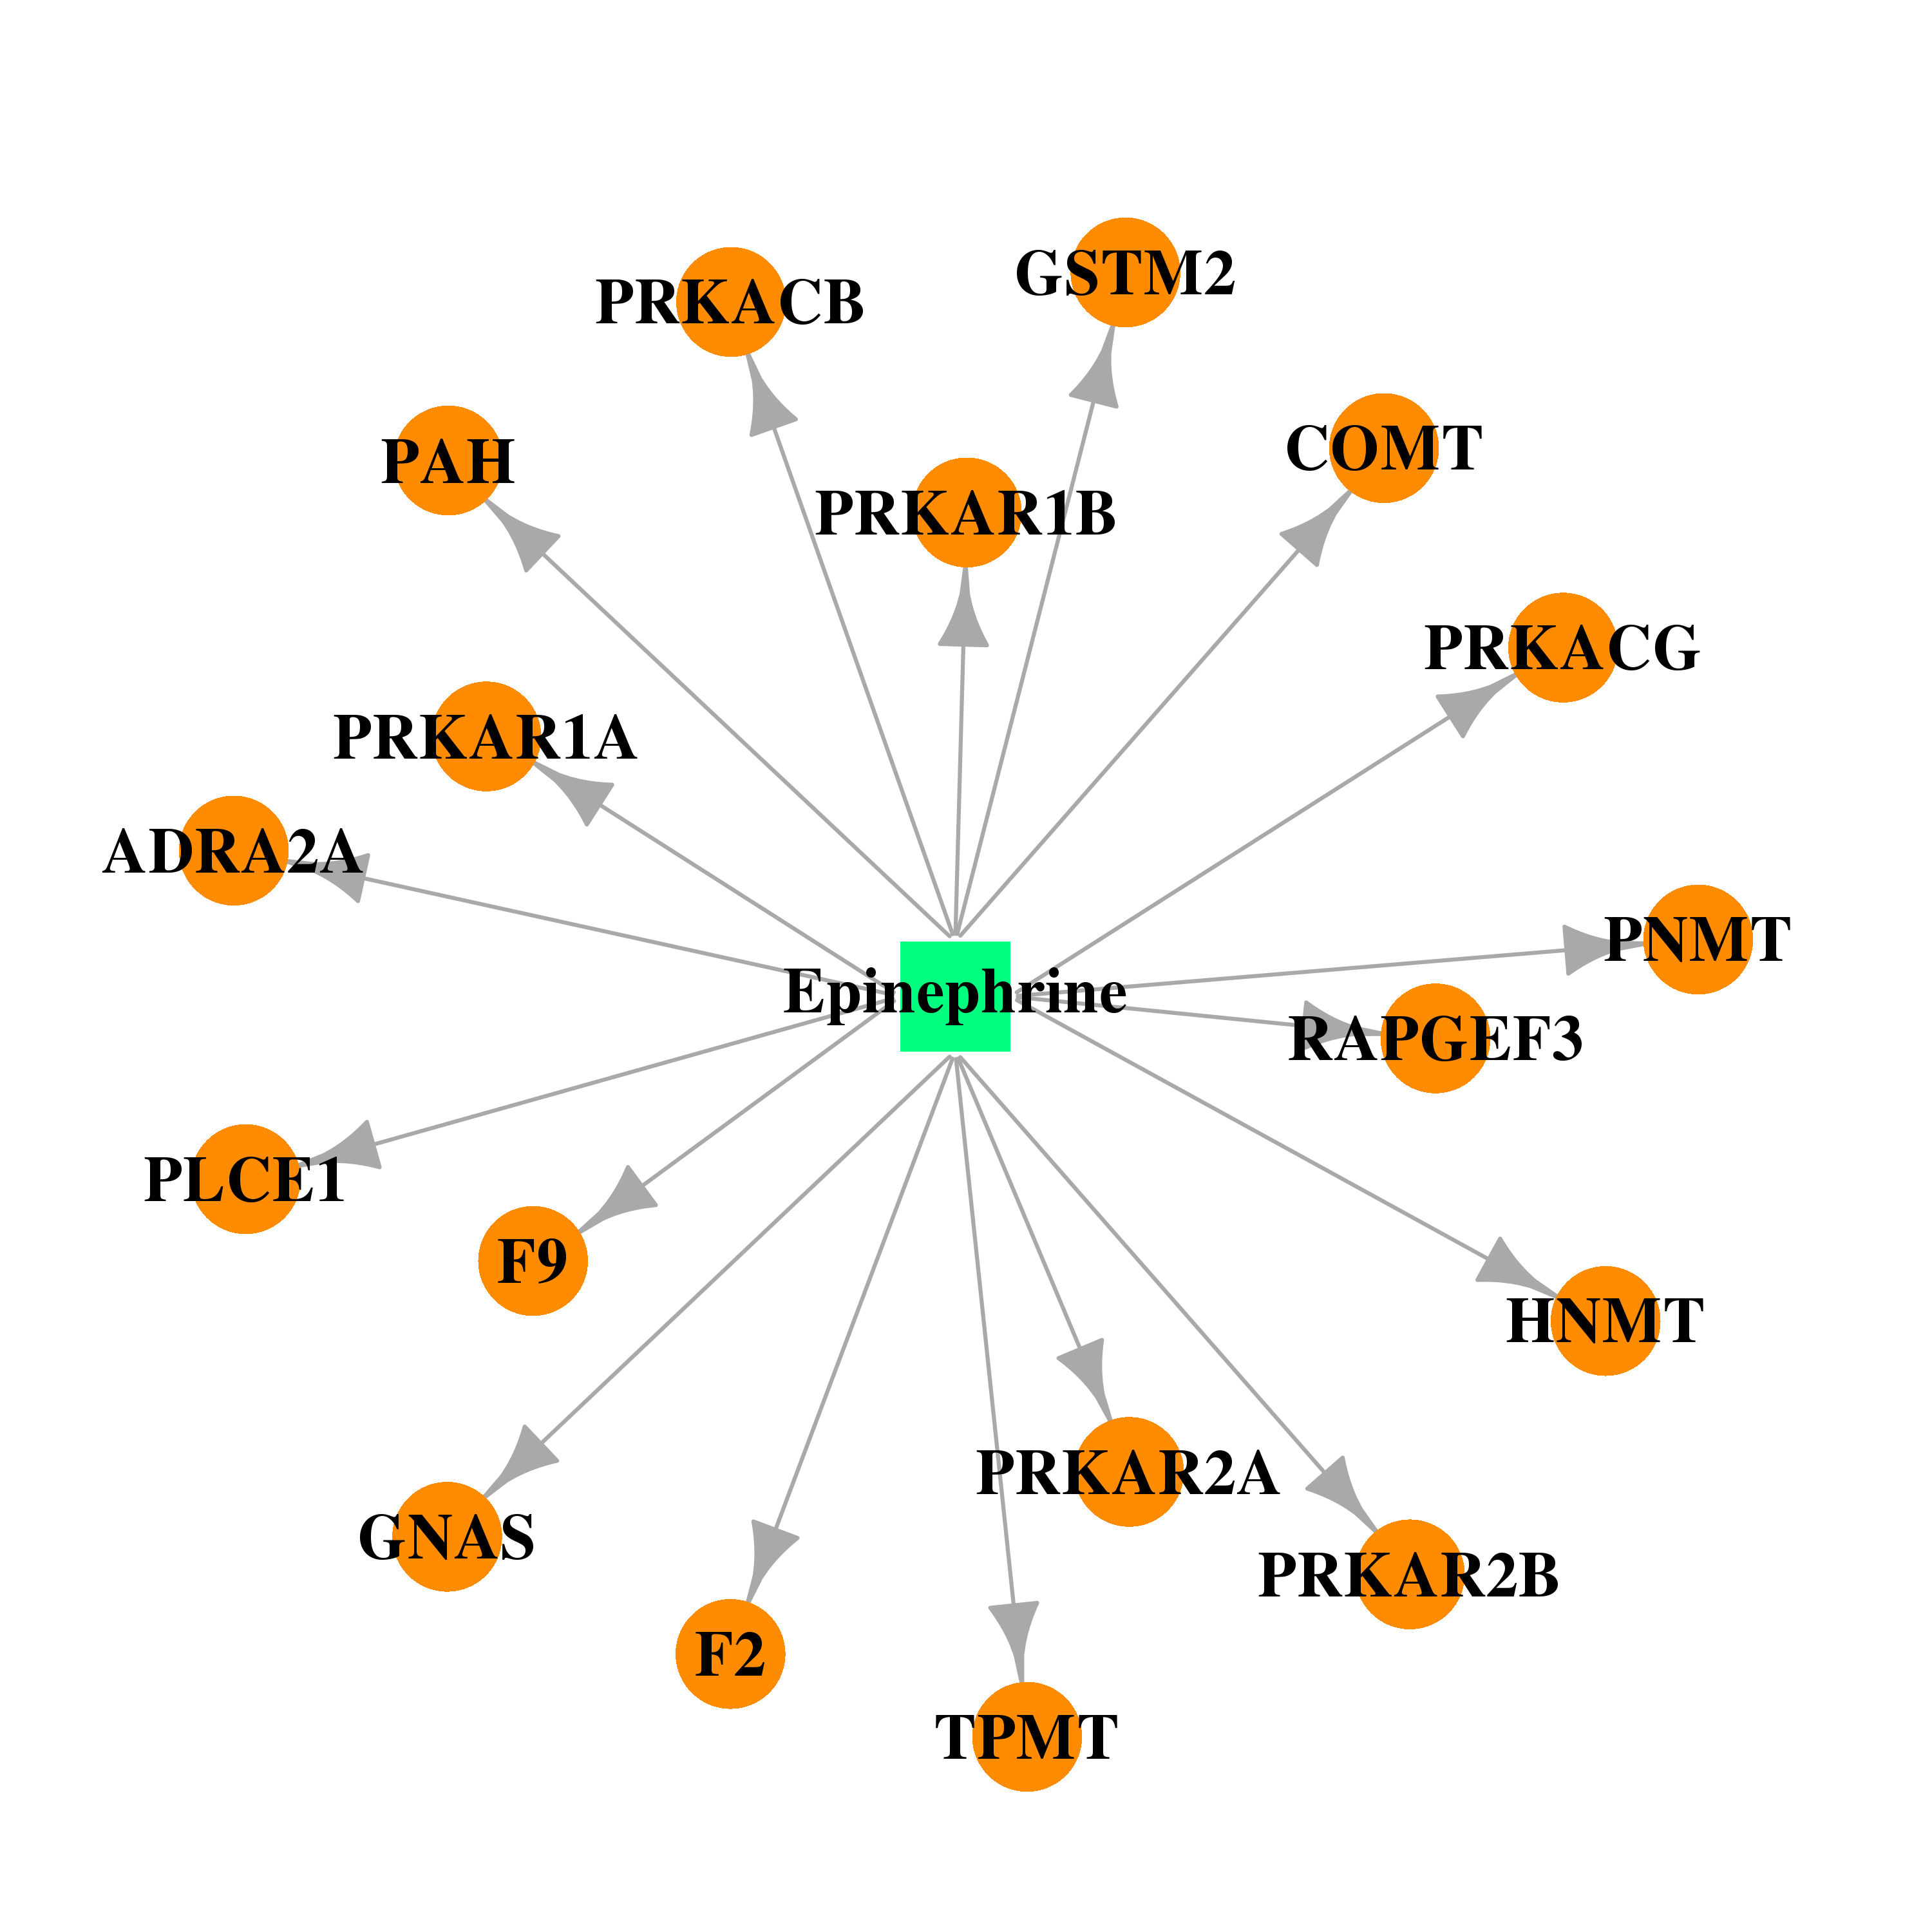 |  |
| DB00396 | GNAS complex locus | approved | Progesterone | 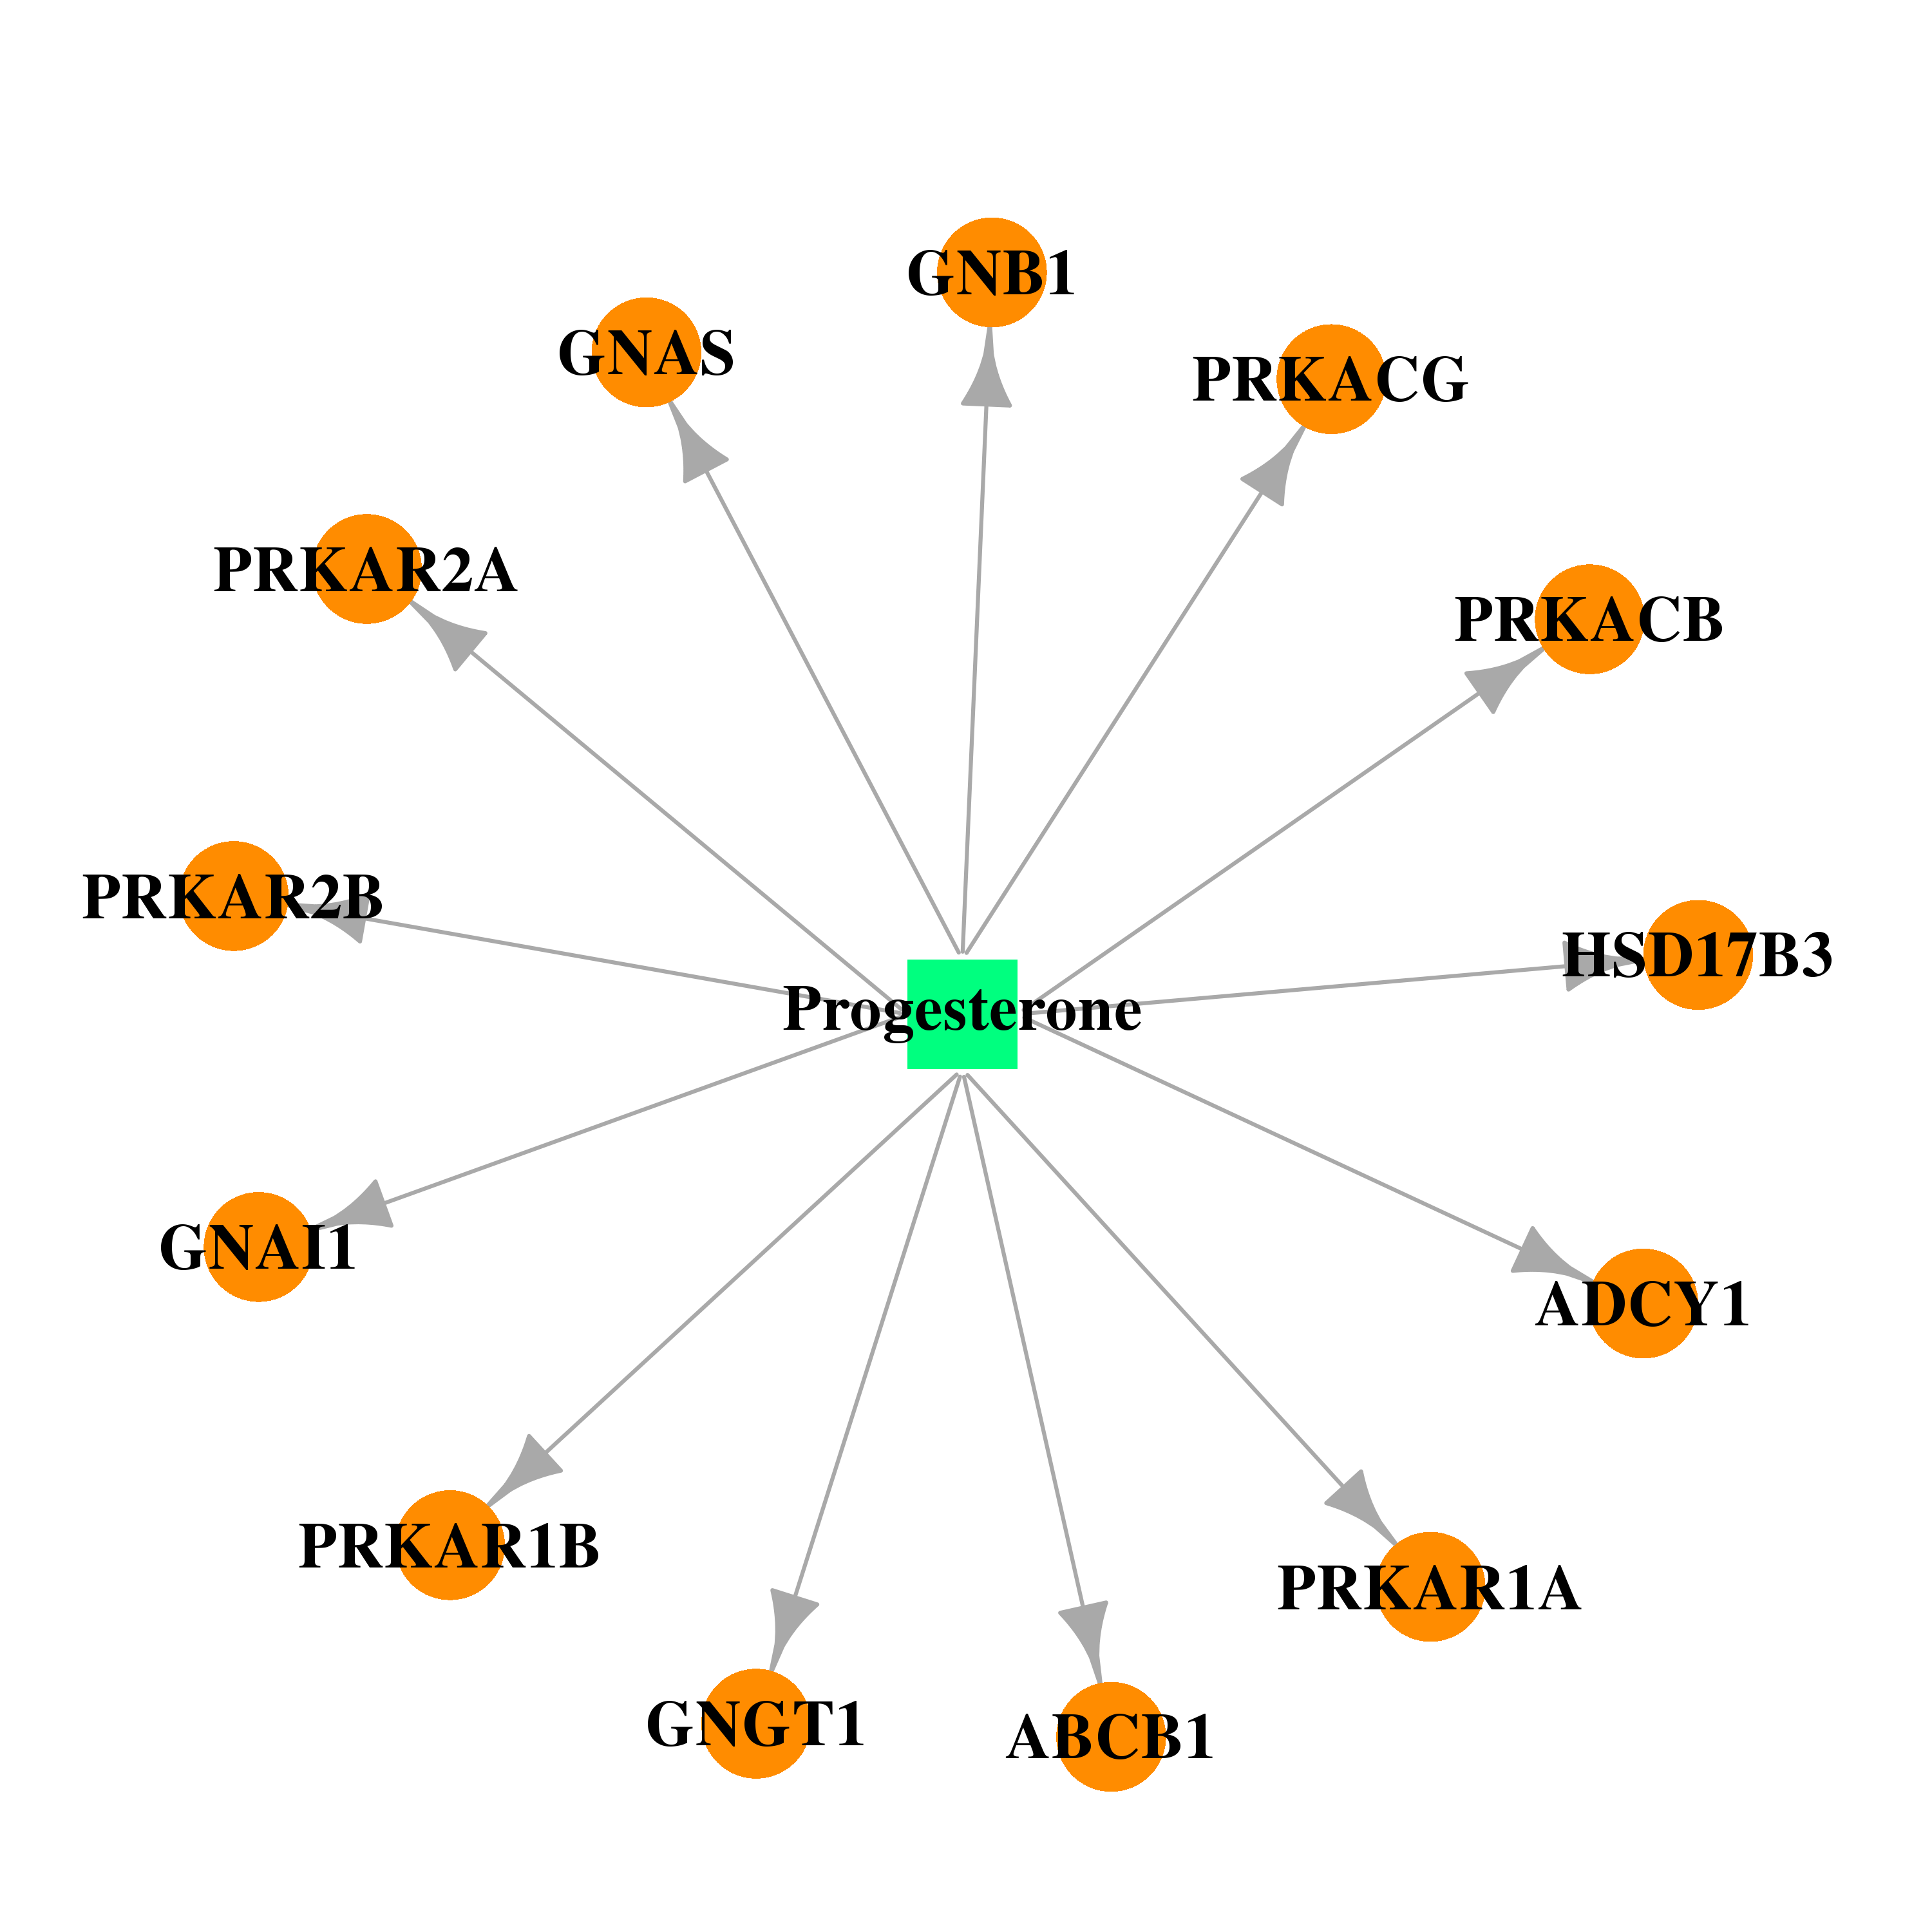 |  |
| DB01064 | GNAS complex locus | approved | Isoproterenol | 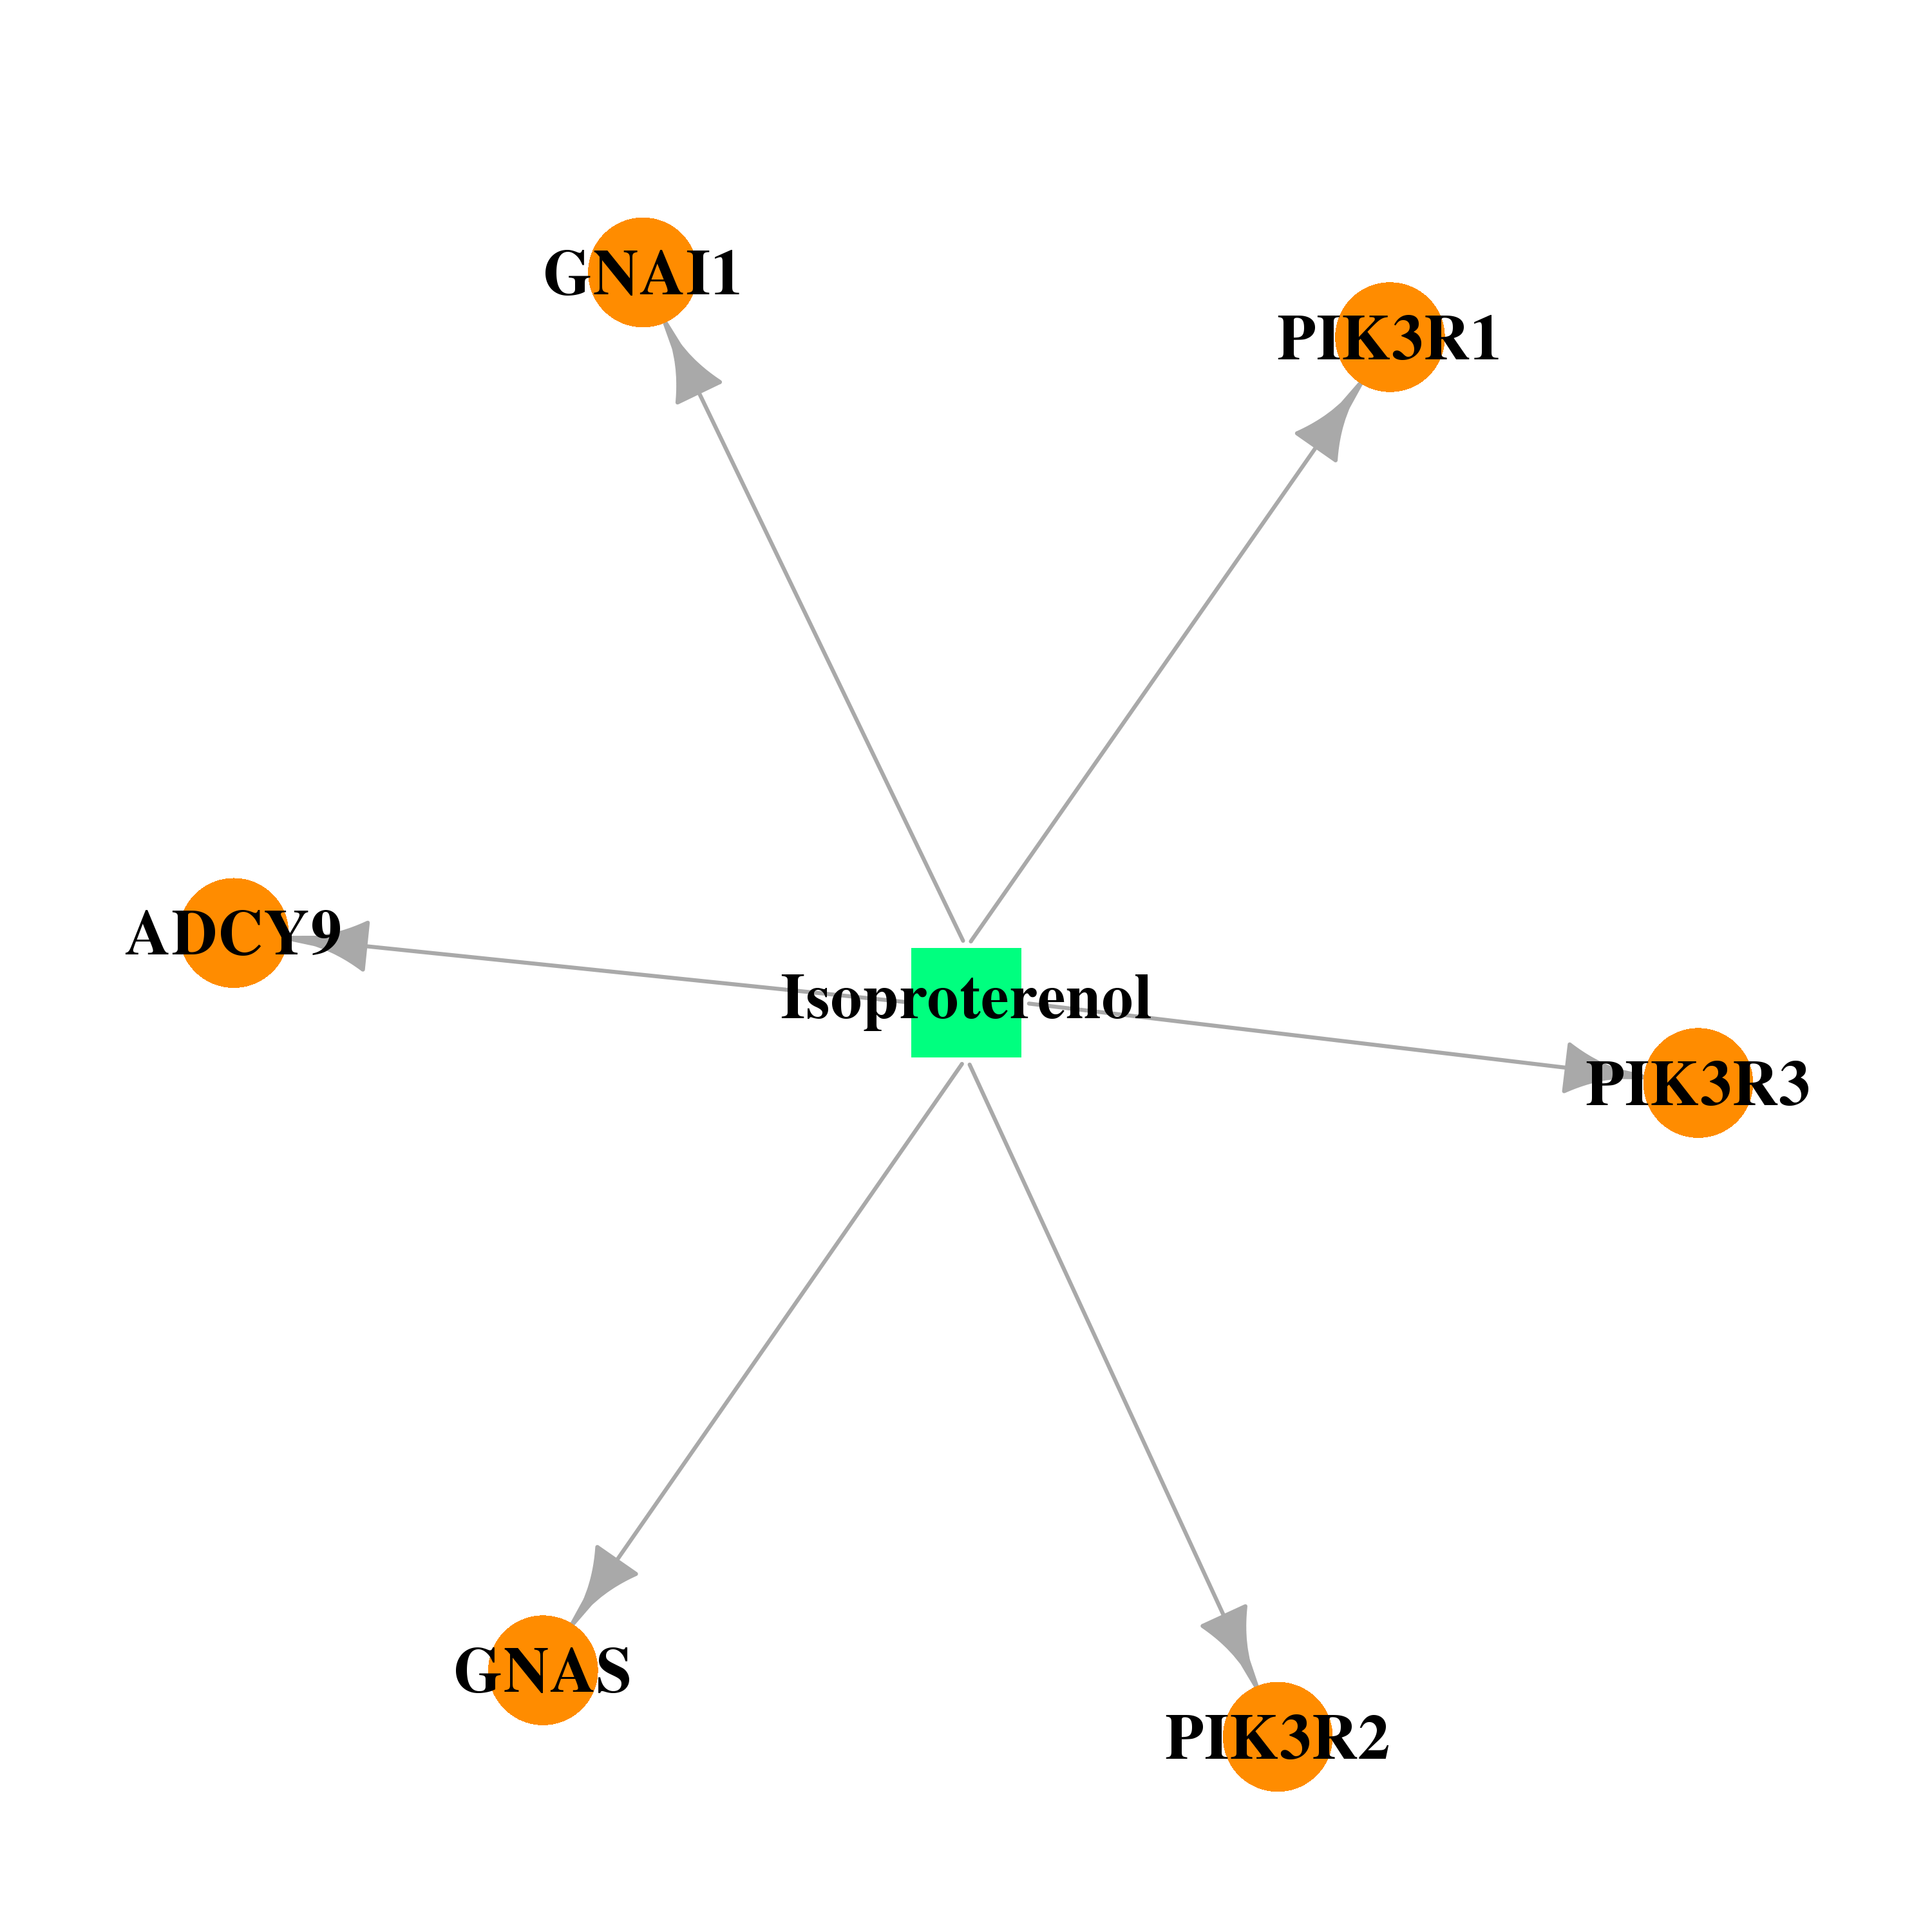 |  |
| DB01105 | GNAS complex locus | illicit; approved; withdrawn; investigational | Sibutramine |  |  |
| DB00938 | GNAS complex locus | approved | Salmeterol | 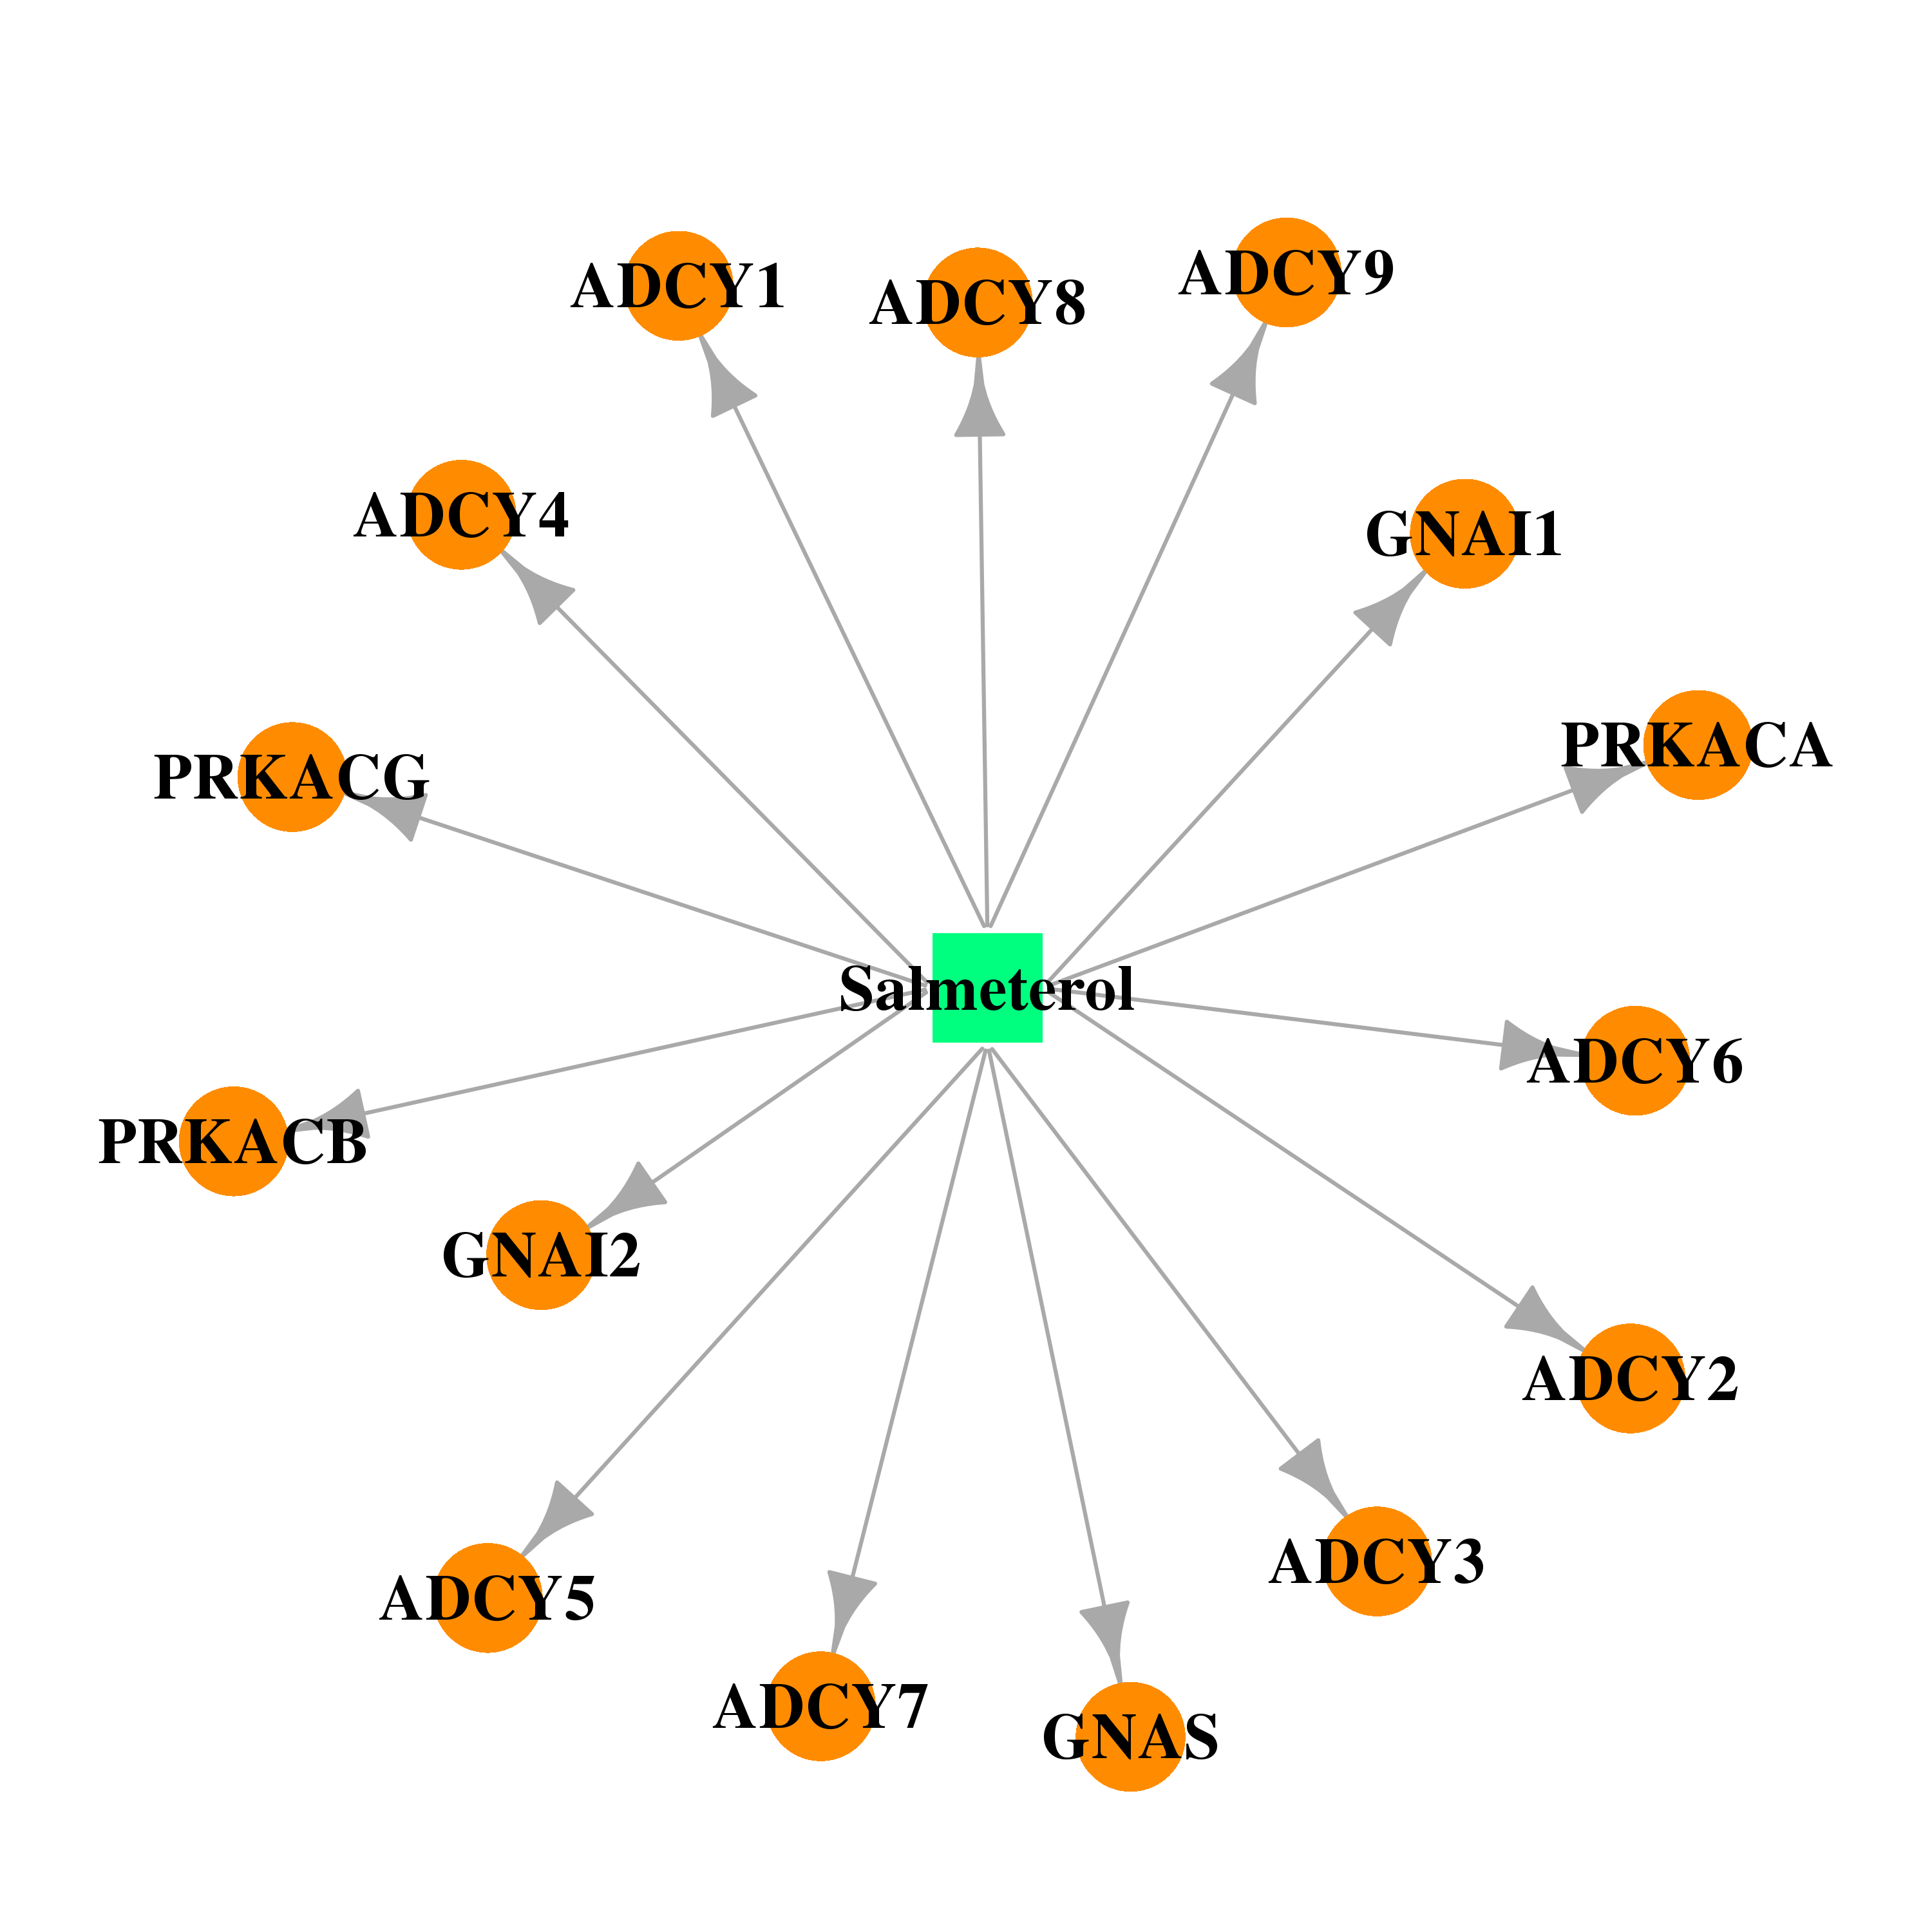 | 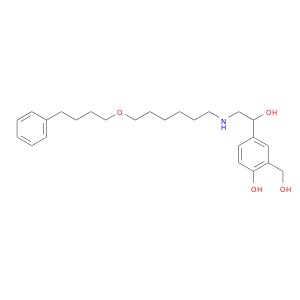 |
| Top |
| Cross referenced IDs for GNAS |
| * We obtained these cross-references from Uniprot database. It covers 150 different DBs, 18 categories. http://www.uniprot.org/help/cross_references_section |
: Open all cross reference information
|
Copyright © 2016-Present - The Univsersity of Texas Health Science Center at Houston @ |