|
|||||||||||||||||||||||||||||||||||||||||||||||||||||||||||||||||||||||||||||||||||||||||||||||||||||||||||||||||||||||||||||||||||||||||||||||||||||||||||||||||||||||||||||||||||||||||||||||||||||||||||||||||||||||||||||||||||||||||||||||||||||||||||||||||||||||||||||||||||||||||||||||||||||||||||||||||||||||||||||||||||||||||||||||||||||||||||||||||||||||||||||||||||||||||||||||||||||||||||||||||||||||||||||||||||||||||||||||||||||||||||||||||||||||||||||||||||||||||||||
| |
| Phenotypic Information (metabolism pathway, cancer, disease, phenome) |
| |
| |
| Gene-Gene Network Information: Co-Expression Network, Interacting Genes & KEGG |
| |
|


| Gene Summary for GNB1 |
| Basic gene info. | Gene symbol | GNB1 |
| Gene name | guanine nucleotide binding protein (G protein), beta polypeptide 1 | |
| Synonyms | - | |
| Cytomap | UCSC genome browser: 1p36.33 | |
| Genomic location | chr1 :1716724-1822526 | |
| Type of gene | protein-coding | |
| RefGenes | NM_001282538.1, NM_001282539.1,NM_002074.4, | |
| Ensembl id | ENSG00000078369 | |
| Description | G protein, beta-1 subunitbeta subunit, signal-transducing proteins GS/GIguanine nucleotide-binding protein G(I)/G(S)/G(T) subunit beta-1transducin beta chain 1 | |
| Modification date | 20141207 | |
| dbXrefs | MIM : 139380 | |
| HGNC : HGNC | ||
| Ensembl : ENSG00000078369 | ||
| HPRD : 00766 | ||
| Vega : OTTHUMG00000000940 | ||
| Protein | UniProt: go to UniProt's Cross Reference DB Table | |
| Expression | CleanEX: HS_GNB1 | |
| BioGPS: 2782 | ||
| Gene Expression Atlas: ENSG00000078369 | ||
| The Human Protein Atlas: ENSG00000078369 | ||
| Pathway | NCI Pathway Interaction Database: GNB1 | |
| KEGG: GNB1 | ||
| REACTOME: GNB1 | ||
| ConsensusPathDB | ||
| Pathway Commons: GNB1 | ||
| Metabolism | MetaCyc: GNB1 | |
| HUMANCyc: GNB1 | ||
| Regulation | Ensembl's Regulation: ENSG00000078369 | |
| miRBase: chr1 :1,716,724-1,822,526 | ||
| TargetScan: NM_001282538 | ||
| cisRED: ENSG00000078369 | ||
| Context | iHOP: GNB1 | |
| cancer metabolism search in PubMed: GNB1 | ||
| UCL Cancer Institute: GNB1 | ||
| Assigned class in ccmGDB | C | |
| Top |
| Phenotypic Information for GNB1(metabolism pathway, cancer, disease, phenome) |
| Cancer | CGAP: GNB1 |
| Familial Cancer Database: GNB1 | |
| * This gene is included in those cancer gene databases. |
|
|
|
|
|
| . | |||||||||||||||||||||||||||||||||||||||||||||||||||||||||||||||||||||||||||||||||||||||||||||||||||||||||||||||||||||||||||||||||||||||||||||||||||||||||||||||||||||||||||||||||||||||||||||||||||||||||||||||||||||||||||||||||||||||||||||||||||||||||||||||||||||||||||||||||||||||||||||||||||||||||||||||||||||||||||||||||||||||||||||||||||||||||||||||||||||||||||||||||||||||||||||||||||||||||||||||||||||||||||||||||||||||||||||||||||||||||||||||||||||||||||||||||||||||
Oncogene 1 | Significant driver gene in | ||||||||||||||||||||||||||||||||||||||||||||||||||||||||||||||||||||||||||||||||||||||||||||||||||||||||||||||||||||||||||||||||||||||||||||||||||||||||||||||||||||||||||||||||||||||||||||||||||||||||||||||||||||||||||||||||||||||||||||||||||||||||||||||||||||||||||||||||||||||||||||||||||||||||||||||||||||||||||||||||||||||||||||||||||||||||||||||||||||||||||||||||||||||||||||||||||||||||||||||||||||||||||||||||||||||||||||||||||||||||||||||||||||||||||||||||||||||||||||
| cf) number; DB name 1 Oncogene; http://nar.oxfordjournals.org/content/35/suppl_1/D721.long, 2 Tumor Suppressor gene; https://bioinfo.uth.edu/TSGene/, 3 Cancer Gene Census; http://www.nature.com/nrc/journal/v4/n3/abs/nrc1299.html, 4 CancerGenes; http://nar.oxfordjournals.org/content/35/suppl_1/D721.long, 5 Network of Cancer Gene; http://ncg.kcl.ac.uk/index.php, 1Therapeutic Vulnerabilities in Cancer; http://cbio.mskcc.org/cancergenomics/statius/ |
| REACTOME_INTEGRATION_OF_ENERGY_METABOLISM | |
| OMIM | |
| Orphanet | |
| Disease | KEGG Disease: GNB1 |
| MedGen: GNB1 (Human Medical Genetics with Condition) | |
| ClinVar: GNB1 | |
| Phenotype | MGI: GNB1 (International Mouse Phenotyping Consortium) |
| PhenomicDB: GNB1 | |
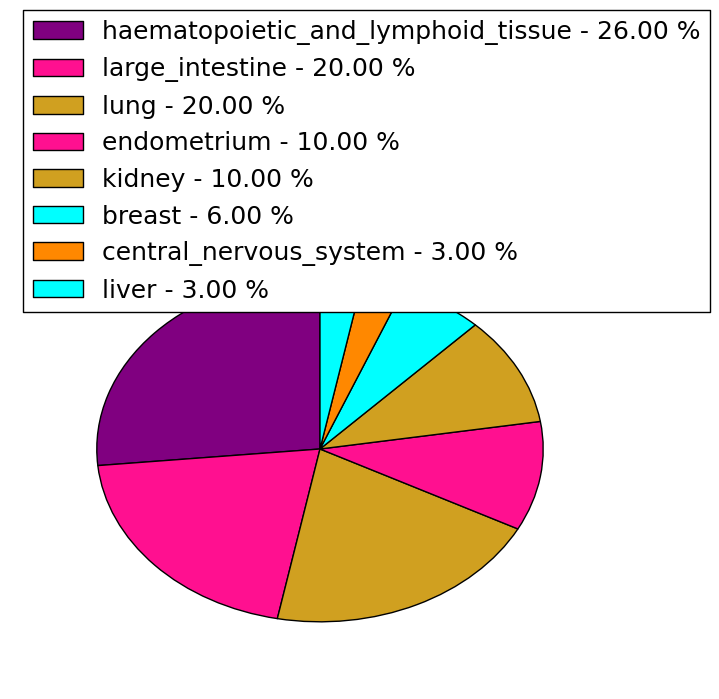
| Mutations for GNB1 |
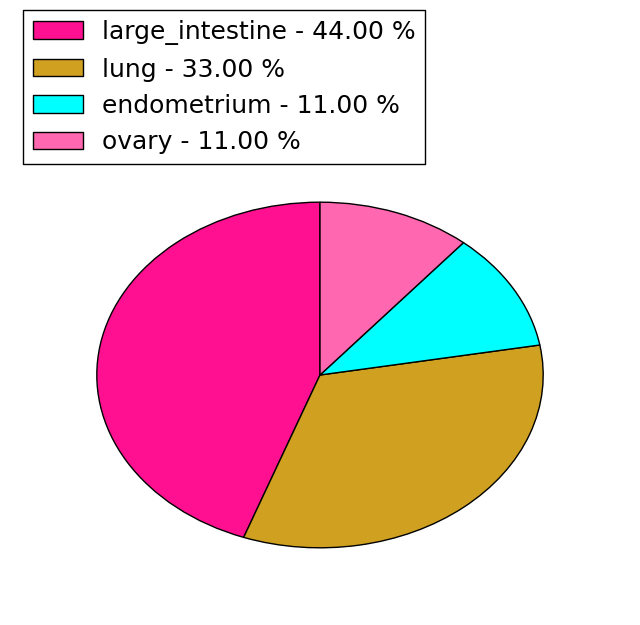
| * Under tables are showing count per each tissue to give us broad intuition about tissue specific mutation patterns.You can go to the detailed page for each mutation database's web site. |
| - Statistics for Tissue and Mutation type | Top |
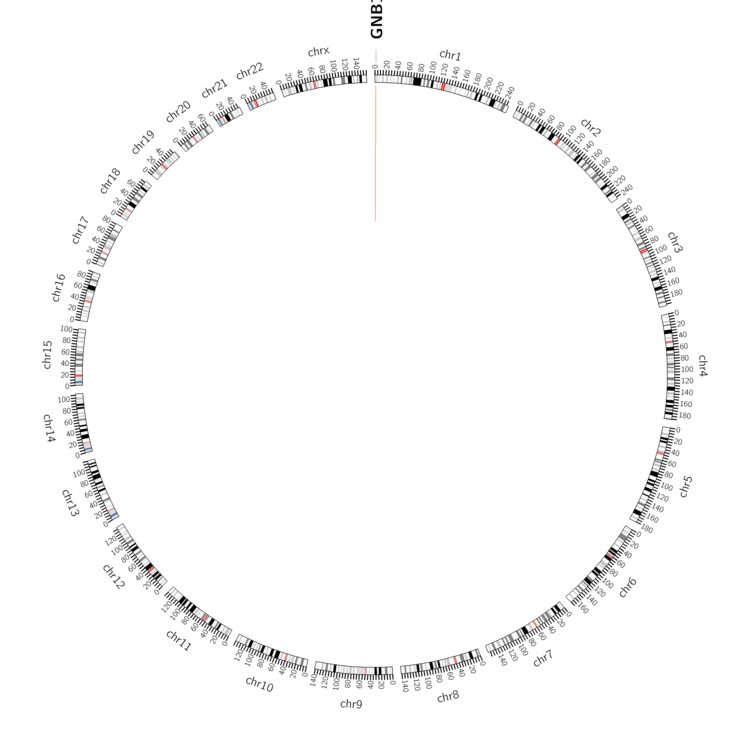 |
| - For Inter-chromosomal Variations |
| There's no inter-chromosomal structural variation. |
| - For Intra-chromosomal Variations |
| * Intra-chromosomal variantions includes 'intrachromosomal amplicon to amplicon', 'intrachromosomal amplicon to non-amplified dna', 'intrachromosomal deletion', 'intrachromosomal fold-back inversion', 'intrachromosomal inversion', 'intrachromosomal tandem duplication', 'Intrachromosomal unknown type', 'intrachromosomal with inverted orientation', 'intrachromosomal with non-inverted orientation'. |
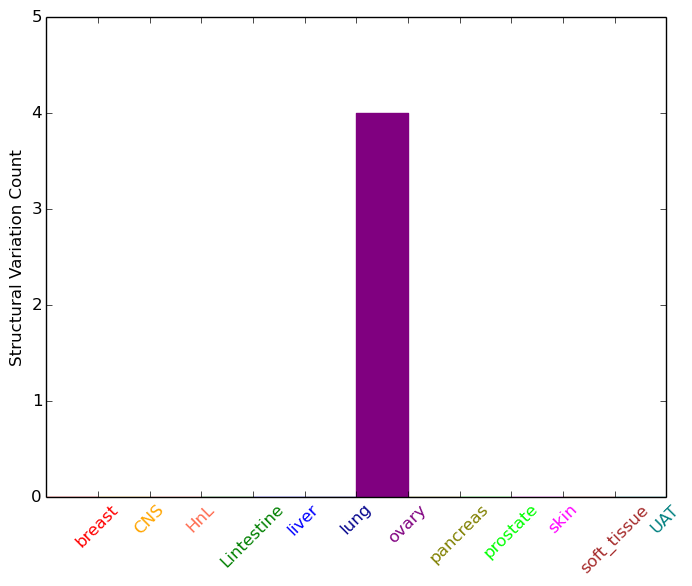 |
| Sample | Symbol_a | Chr_a | Start_a | End_a | Symbol_b | Chr_b | Start_b | End_b |
| ovary | GNB1 | chr1 | 1741716 | 1741736 | GNB1 | chr1 | 1772000 | 1772020 |
| ovary | GNB1 | chr1 | 1742665 | 1742685 | GNB1 | chr1 | 1744284 | 1744304 |
| ovary | GNB1 | chr1 | 1786292 | 1786312 | GNB1 | chr1 | 1769906 | 1769926 |
| cf) Tissue number; Tissue name (1;Breast, 2;Central_nervous_system, 3;Haematopoietic_and_lymphoid_tissue, 4;Large_intestine, 5;Liver, 6;Lung, 7;Ovary, 8;Pancreas, 9;Prostate, 10;Skin, 11;Soft_tissue, 12;Upper_aerodigestive_tract) |
| * From mRNA Sanger sequences, Chitars2.0 arranged chimeric transcripts. This table shows GNB1 related fusion information. |
| ID | Head Gene | Tail Gene | Accession | Gene_a | qStart_a | qEnd_a | Chromosome_a | tStart_a | tEnd_a | Gene_a | qStart_a | qEnd_a | Chromosome_a | tStart_a | tEnd_a |
| BF974736 | GNB1 | 2 | 64 | 1 | 1717303 | 1717365 | GNB1 | 62 | 127 | 1 | 1717243 | 1717308 | |
| BF307939 | ZSCAN30 | 4 | 102 | 18 | 32870048 | 32870148 | GNB1 | 102 | 392 | 1 | 1747201 | 1770678 | |
| BE140587 | GNB1 | 18 | 69 | 1 | 1718278 | 1718329 | ELF3 | 69 | 124 | 1 | 201984416 | 201984471 | |
| BF203707 | ZSCAN30 | 5 | 104 | 18 | 32870048 | 32870148 | GNB1 | 104 | 395 | 1 | 1747201 | 1770678 | |
| BQ228847 | GNB1 | 1 | 179 | 1 | 1770654 | 1822413 | DDX50 | 175 | 862 | 10 | 70670061 | 70673939 | |
| BF203521 | ZSCAN30 | 2 | 105 | 18 | 32870048 | 32870151 | GNB1 | 105 | 397 | 1 | 1747201 | 1770678 | |
| EL955244 | GNB1 | 5 | 424 | 1 | 1716729 | 1717148 | PEX2 | 415 | 514 | 8 | 77895820 | 77895920 | |
| DA668677 | LUZP1 | 1 | 52 | 1 | 23495259 | 23495310 | GNB1 | 51 | 559 | 1 | 1735877 | 1770679 | |
| DA852189 | RABGEF1 | 1 | 122 | 7 | 66147124 | 66147245 | GNB1 | 121 | 546 | 1 | 1747239 | 1811343 | |
| AI933070 | GNB1 | 27 | 198 | 1 | 1730832 | 1731003 | GNB1 | 187 | 438 | 1 | 1729724 | 1729981 | |
| AA651630 | GNB1 | 5 | 72 | 1 | 1717039 | 1717106 | GNB1 | 67 | 410 | 1 | 1717101 | 1717447 | |
| BE537940 | GNB1 | 199 | 249 | 1 | 1717104 | 1717154 | DAD1 | 249 | 575 | 14 | 23044093 | 23058136 | |
| CA434461 | GNB1 | 18 | 328 | 1 | 1716725 | 1717033 | CPLX1 | 309 | 333 | 4 | 784965 | 784989 | |
| W26101 | GNB1 | 13 | 267 | 1 | 1717675 | 1717927 | GNB1 | 260 | 477 | 1 | 1747267 | 1763711 | |
| AA603331 | GNB1 | 20 | 497 | 1 | 1716725 | 1717201 | FANK1 | 494 | 610 | 10 | 127605008 | 127605124 | |
| BF806121 | EPCAM | 11 | 338 | 2 | 47601236 | 47601569 | GNB1 | 330 | 582 | 1 | 1718252 | 1718504 | |
| BI026317 | GNB1 | 44 | 239 | 1 | 1809004 | 1809197 | LCP1 | 232 | 425 | 13 | 46700163 | 46700355 | |
| BI022537 | GNB1 | 12 | 70 | 1 | 1716828 | 1716886 | GNB1 | 67 | 212 | 1 | 1716745 | 1716890 | |
| DA645137 | SNHG3 | 1 | 74 | 1 | 28832556 | 28834672 | GNB1 | 74 | 461 | 1 | 1735996 | 1770678 | |
| DB357327 | GNB1 | 9 | 134 | 1 | 1716729 | 1716854 | CCND1 | 123 | 568 | 11 | 69467344 | 69467796 | |
| H53458 | ZFP14 | 1 | 82 | 19 | 36827344 | 36827511 | GNB1 | 64 | 309 | 1 | 1751288 | 1751530 | |
| BI862769 | GNB1 | 69 | 159 | 1 | 1717404 | 1717496 | GNB1 | 158 | 232 | 1 | 1717344 | 1717418 | |
| U67319 | GNB1 | 1 | 181 | 1 | 1812370 | 1812550 | CASP7 | 182 | 2601 | 10 | 115439699 | 115490662 | |
| AV717096 | MORF4L2 | 1 | 229 | X | 102935090 | 102935318 | GNB1 | 210 | 230 | 1 | 1778027 | 1778047 | |
| BC013646 | GNB1 | 215 | 268 | 1 | 1717101 | 1717154 | DAD1 | 268 | 959 | 14 | 23033805 | 23058136 | |
| AA864236 | GNB1 | 2 | 109 | 1 | 1716729 | 1716836 | TARDBP | 104 | 556 | 1 | 11082454 | 11082905 | |
| BG315176 | MBP | 5 | 160 | 18 | 74725050 | 74725205 | GNB1 | 157 | 272 | 1 | 1718399 | 1718782 | |
| AA650206 | GNB1 | 8 | 74 | 1 | 1717039 | 1717106 | GNB1 | 69 | 463 | 1 | 1717101 | 1717495 | |
| BE386644 | GNB1 | 1 | 425 | 1 | 1735973 | 1756884 | RPL24 | 425 | 635 | 3 | 101404661 | 101405535 | |
| BF510743 | KAZN | 1 | 21 | 1 | 15333549 | 15333569 | GNB1 | 3 | 473 | 1 | 1819351 | 1819821 | |
| Top |
| Mutation type/ Tissue ID | brca | cns | cerv | endome | haematopo | kidn | Lintest | liver | lung | ns | ovary | pancre | prost | skin | stoma | thyro | urina | |||
| Total # sample | 1 | |||||||||||||||||||
| GAIN (# sample) | ||||||||||||||||||||
| LOSS (# sample) | 1 |
| cf) Tissue ID; Tissue type (1; Breast, 2; Central_nervous_system, 3; Cervix, 4; Endometrium, 5; Haematopoietic_and_lymphoid_tissue, 6; Kidney, 7; Large_intestine, 8; Liver, 9; Lung, 10; NS, 11; Ovary, 12; Pancreas, 13; Prostate, 14; Skin, 15; Stomach, 16; Thyroid, 17; Urinary_tract) |
| Top |
|
 |
| Top |
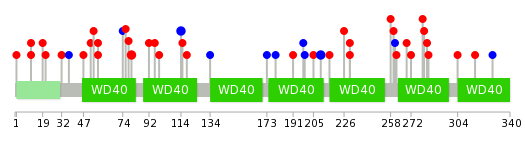
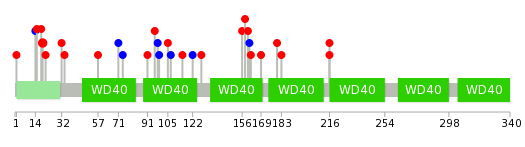
| Stat. for Non-Synonymous SNVs (# total SNVs=30) | (# total SNVs=9) |
 |  |
(# total SNVs=0) | (# total SNVs=0) |
| Top |
| * When you move the cursor on each content, you can see more deailed mutation information on the Tooltip. Those are primary_site,primary_histology,mutation(aa),pubmedID. |
| GRCh37 position | Mutation(aa) | Unique sampleID count |
| chr1:1737942-1737942 | p.I80T | 2 |
| chr1:1756861-1756861 | p.A11G | 2 |
| chr1:1735946-1735946 | p.C114C | 2 |
| chr1:1721903-1721903 | p.L210L | 2 |
| chr1:1718809-1718809 | p.A328A | 1 |
| chr1:1720630-1720630 | p.E260K | 1 |
| chr1:1749311-1749311 | p.A21S | 1 |
| chr1:1721961-1721961 | p.S191C | 1 |
| chr1:1718847-1718847 | p.S316G | 1 |
| chr1:1737949-1737949 | p.K78E | 1 |
| Top |
|
 |
| Point Mutation/ Tissue ID | 1 | 2 | 3 | 4 | 5 | 6 | 7 | 8 | 9 | 10 | 11 | 12 | 13 | 14 | 15 | 16 | 17 | 18 | 19 | 20 |
| # sample | 4 | 1 | 7 | 1 | 2 | 2 | 1 | 3 | 1 | 1 | 1 | 1 | 4 | |||||||
| # mutation | 5 | 1 | 6 | 1 | 2 | 2 | 1 | 3 | 1 | 1 | 1 | 1 | 4 | |||||||
| nonsynonymous SNV | 5 | 1 | 3 | 1 | 2 | 2 | 1 | 2 | 1 | 1 | 3 | |||||||||
| synonymous SNV | 3 | 1 | 1 | 1 | 1 |
| cf) Tissue ID; Tissue type (1; BLCA[Bladder Urothelial Carcinoma], 2; BRCA[Breast invasive carcinoma], 3; CESC[Cervical squamous cell carcinoma and endocervical adenocarcinoma], 4; COAD[Colon adenocarcinoma], 5; GBM[Glioblastoma multiforme], 6; Glioma Low Grade, 7; HNSC[Head and Neck squamous cell carcinoma], 8; KICH[Kidney Chromophobe], 9; KIRC[Kidney renal clear cell carcinoma], 10; KIRP[Kidney renal papillary cell carcinoma], 11; LAML[Acute Myeloid Leukemia], 12; LUAD[Lung adenocarcinoma], 13; LUSC[Lung squamous cell carcinoma], 14; OV[Ovarian serous cystadenocarcinoma ], 15; PAAD[Pancreatic adenocarcinoma], 16; PRAD[Prostate adenocarcinoma], 17; SKCM[Skin Cutaneous Melanoma], 18:STAD[Stomach adenocarcinoma], 19:THCA[Thyroid carcinoma], 20:UCEC[Uterine Corpus Endometrial Carcinoma]) |
| Top |
| * We represented just top 10 SNVs. When you move the cursor on each content, you can see more deailed mutation information on the Tooltip. Those are primary_site, primary_histology, mutation(aa), pubmedID. |
| Genomic Position | Mutation(aa) | Unique sampleID count |
| chr1:1718847 | p.R19L,GNB1 | 2 |
| chr1:1756837 | p.S216G,GNB1 | 2 |
| chr1:1721888 | p.D128N,GNB1 | 1 |
| chr1:1736001 | p.Q32K,GNB1 | 1 |
| chr1:1720561 | p.F122F,GNB1 | 1 |
| chr1:1721912 | p.A21S,GNB1 | 1 |
| chr1:1737959 | p.E115D,GNB1 | 1 |
| chr1:1720568 | p.S107S,GNB1 | 1 |
| chr1:1721920 | p.M1I,GNB1 | 1 |
| chr1:1747228 | p.D105N,GNB1 | 1 |
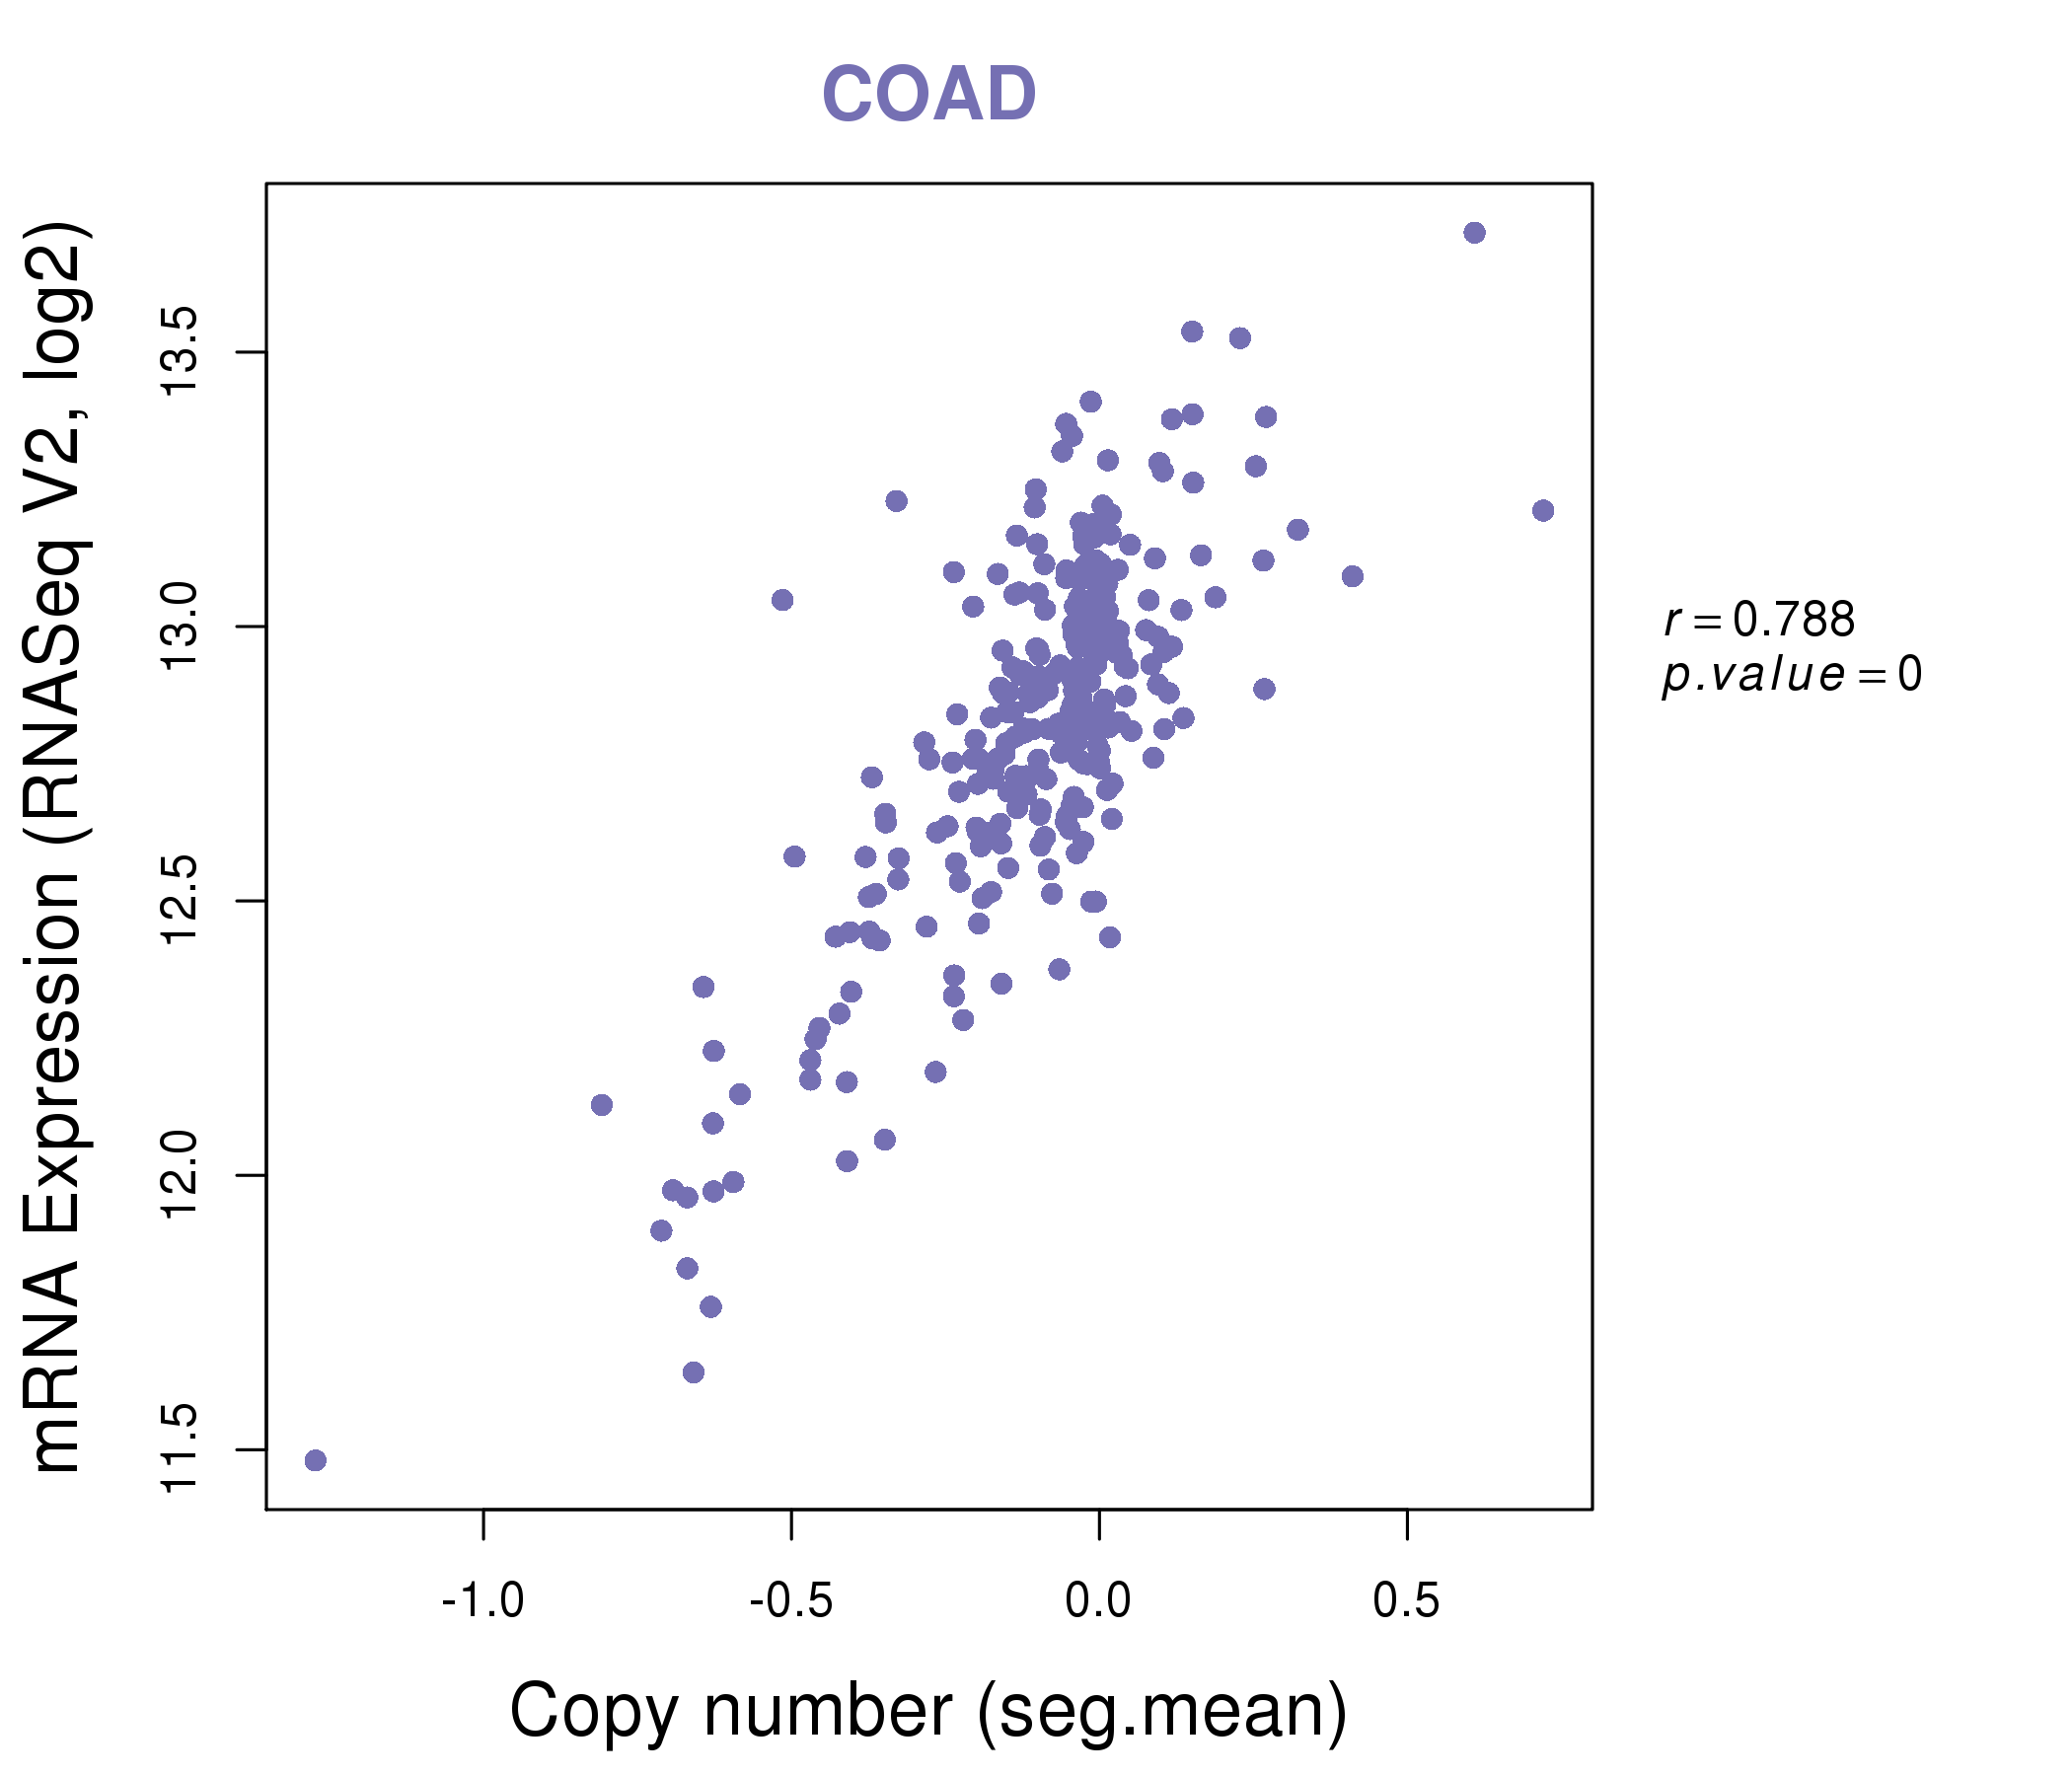
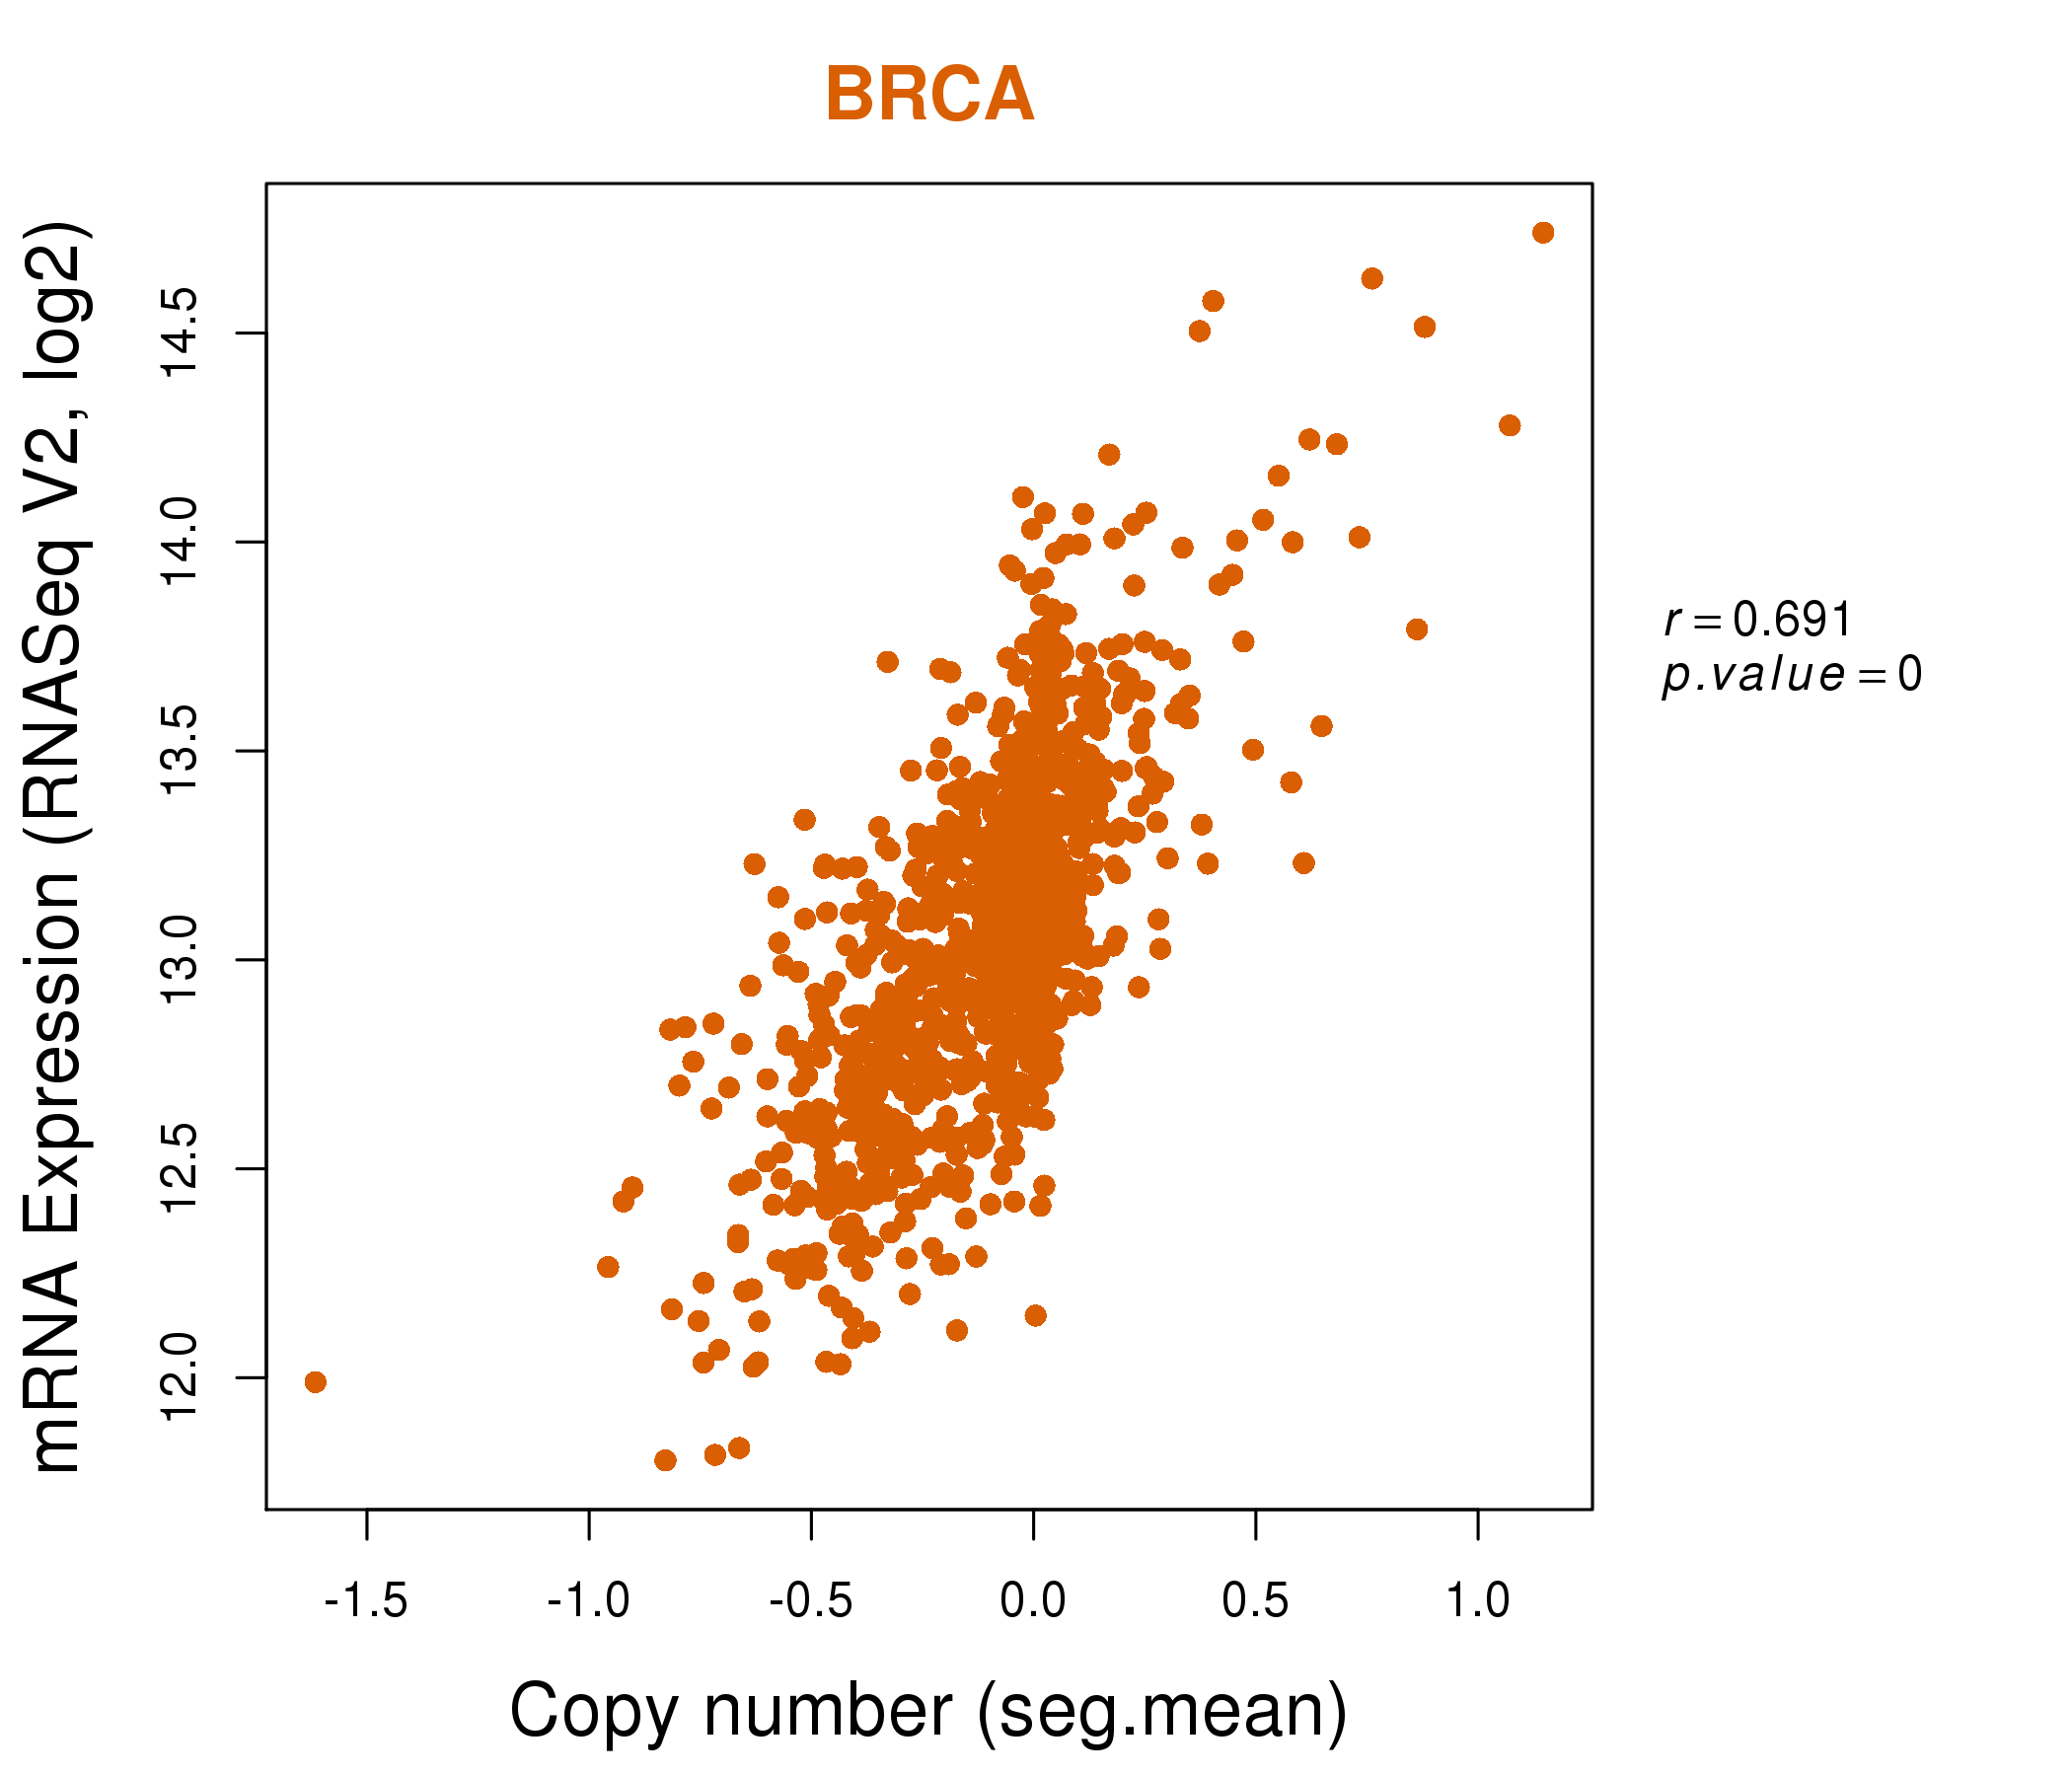
| * Copy number data were extracted from TCGA using R package TCGA-Assembler. The URLs of all public data files on TCGA DCC data server were gathered on Jan-05-2015. Function ProcessCNAData in TCGA-Assembler package was used to obtain gene-level copy number value which is calculated as the average copy number of the genomic region of a gene. |
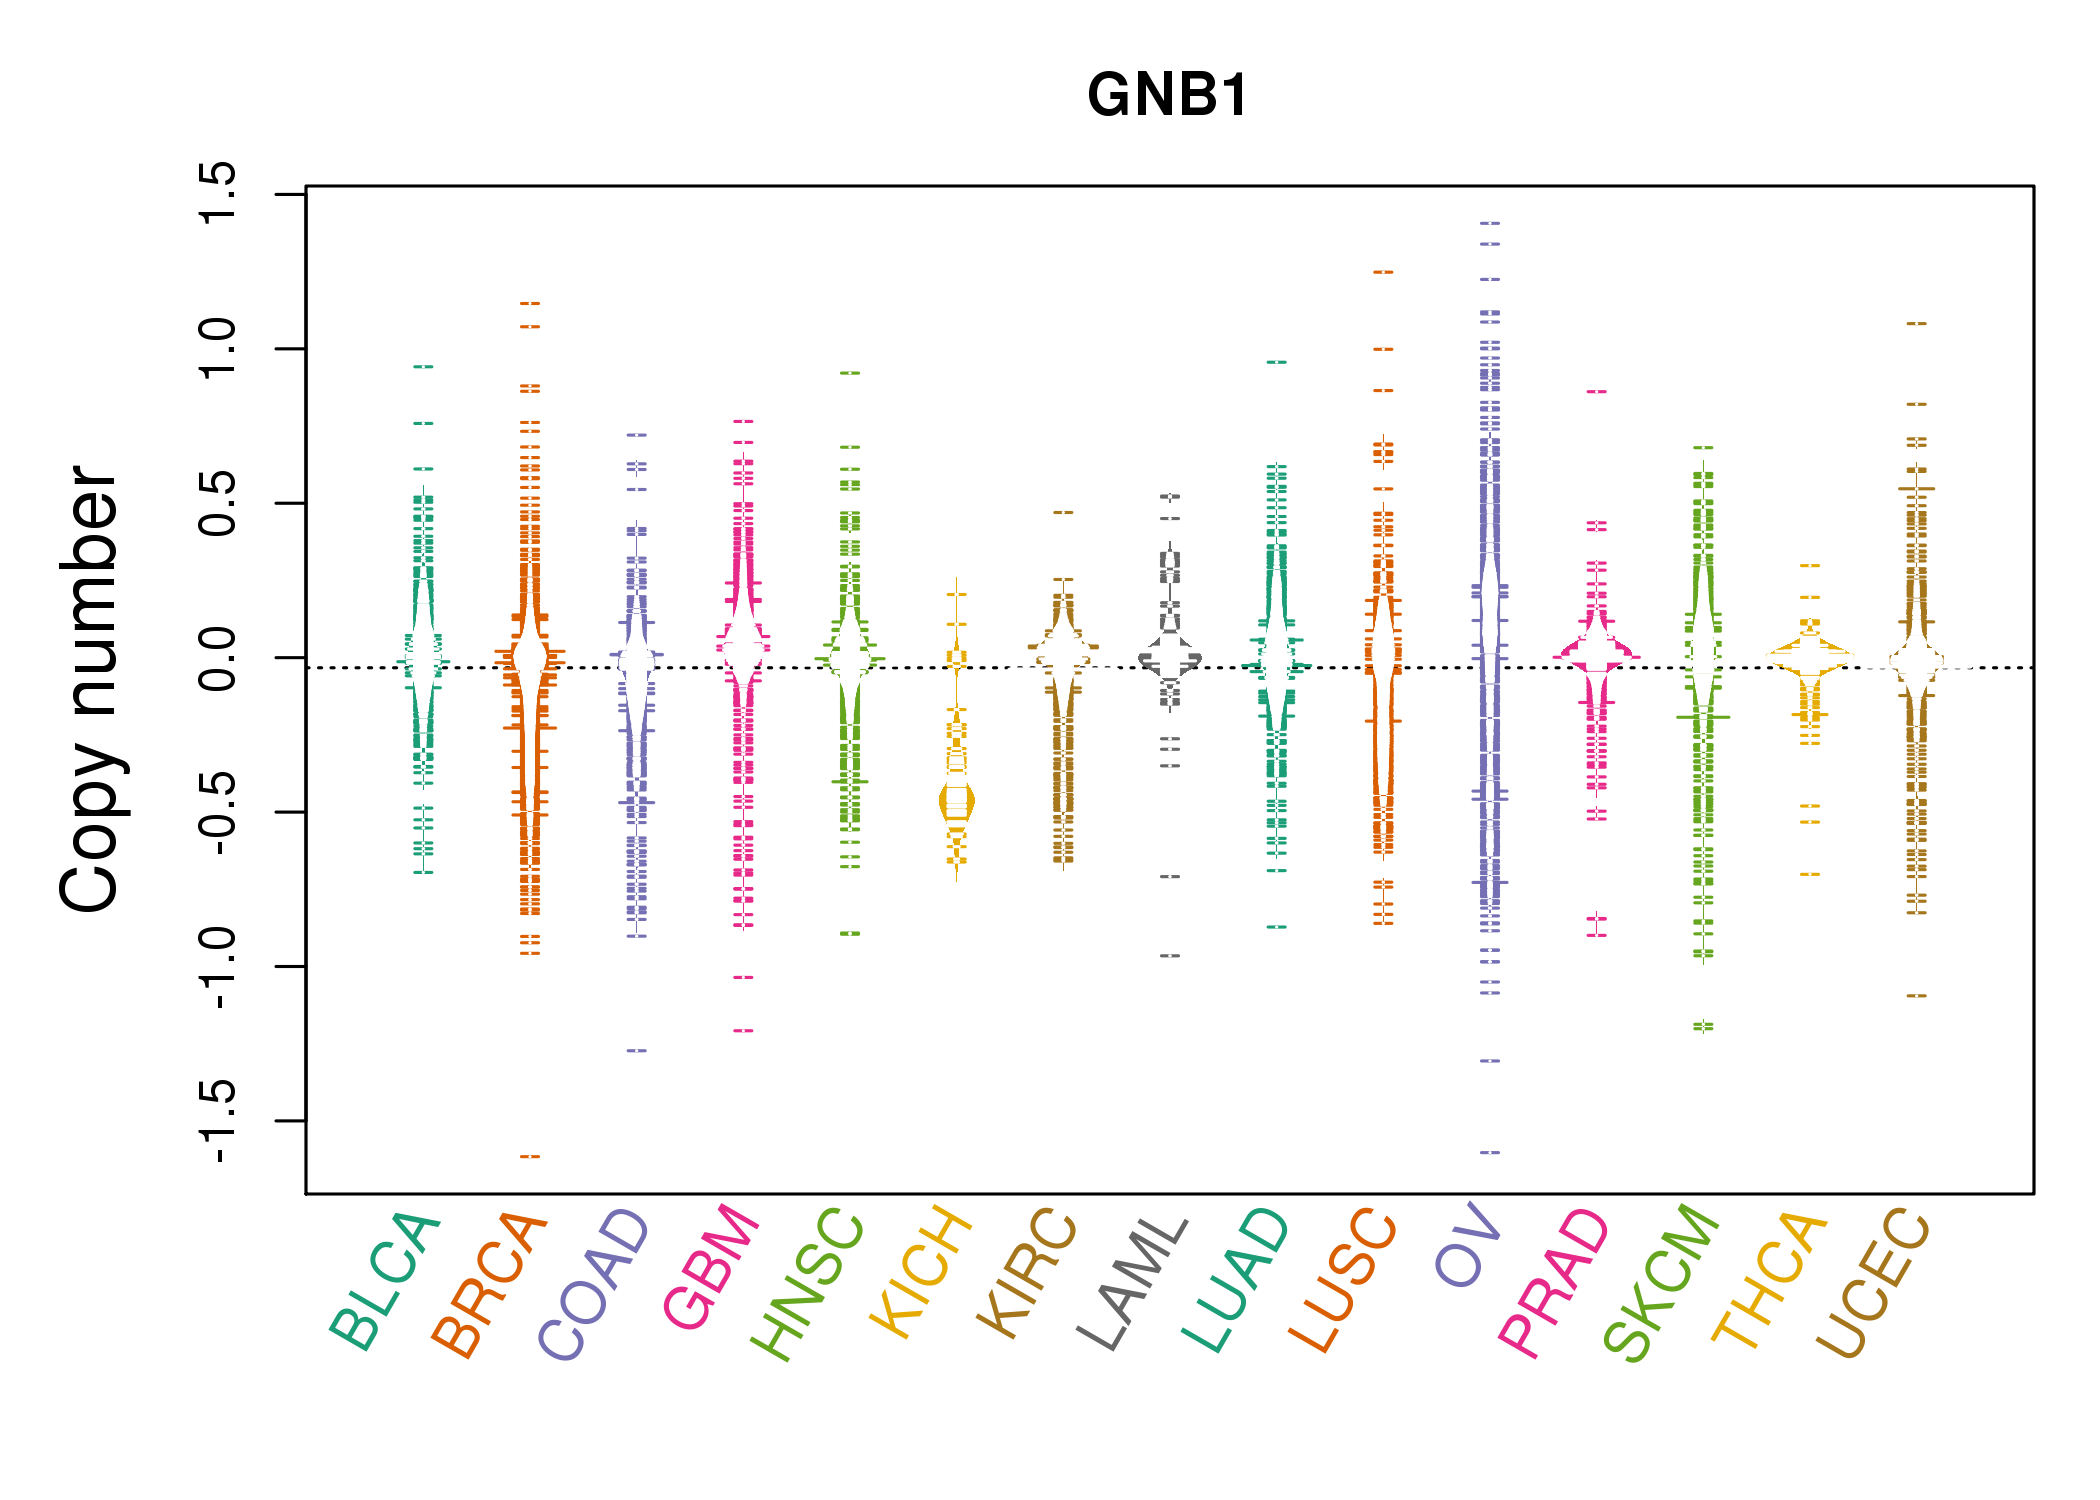 |
| cf) Tissue ID[Tissue type]: BLCA[Bladder Urothelial Carcinoma], BRCA[Breast invasive carcinoma], CESC[Cervical squamous cell carcinoma and endocervical adenocarcinoma], COAD[Colon adenocarcinoma], GBM[Glioblastoma multiforme], Glioma Low Grade, HNSC[Head and Neck squamous cell carcinoma], KICH[Kidney Chromophobe], KIRC[Kidney renal clear cell carcinoma], KIRP[Kidney renal papillary cell carcinoma], LAML[Acute Myeloid Leukemia], LUAD[Lung adenocarcinoma], LUSC[Lung squamous cell carcinoma], OV[Ovarian serous cystadenocarcinoma ], PAAD[Pancreatic adenocarcinoma], PRAD[Prostate adenocarcinoma], SKCM[Skin Cutaneous Melanoma], STAD[Stomach adenocarcinoma], THCA[Thyroid carcinoma], UCEC[Uterine Corpus Endometrial Carcinoma] |
| Top |
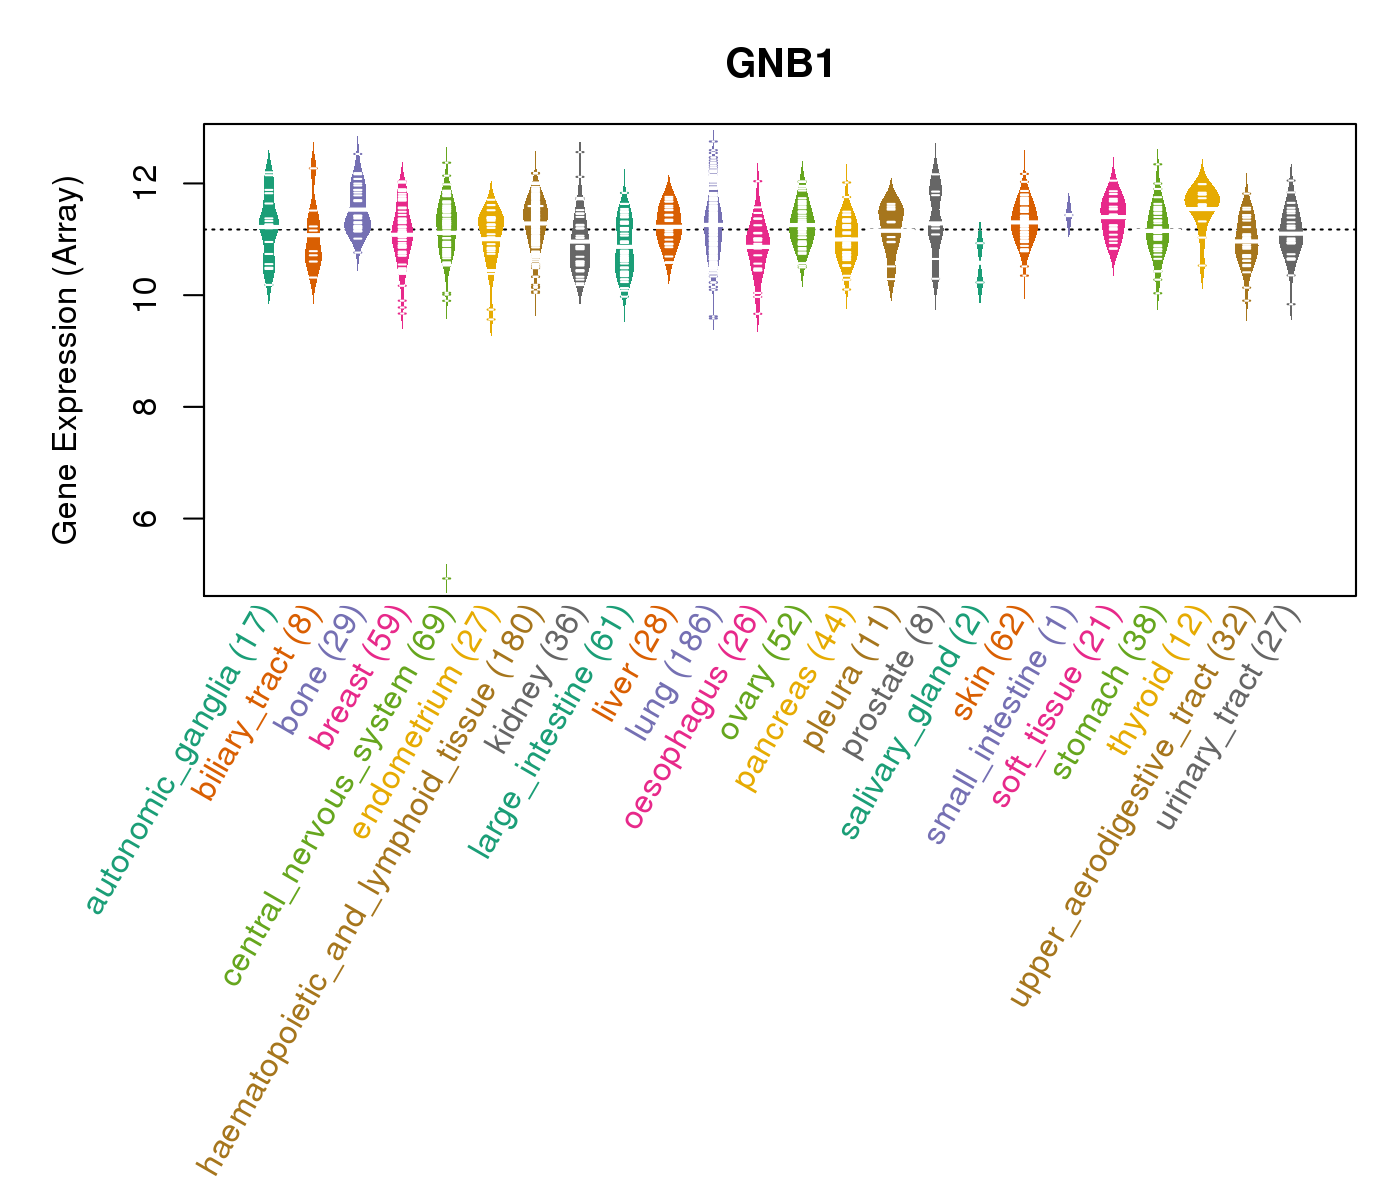
| Gene Expression for GNB1 |
| * CCLE gene expression data were extracted from CCLE_Expression_Entrez_2012-10-18.res: Gene-centric RMA-normalized mRNA expression data. |
 |
| * Normalized gene expression data of RNASeqV2 was extracted from TCGA using R package TCGA-Assembler. The URLs of all public data files on TCGA DCC data server were gathered at Jan-05-2015. Only eight cancer types have enough normal control samples for differential expression analysis. (t test, adjusted p<0.05 (using Benjamini-Hochberg FDR)) |
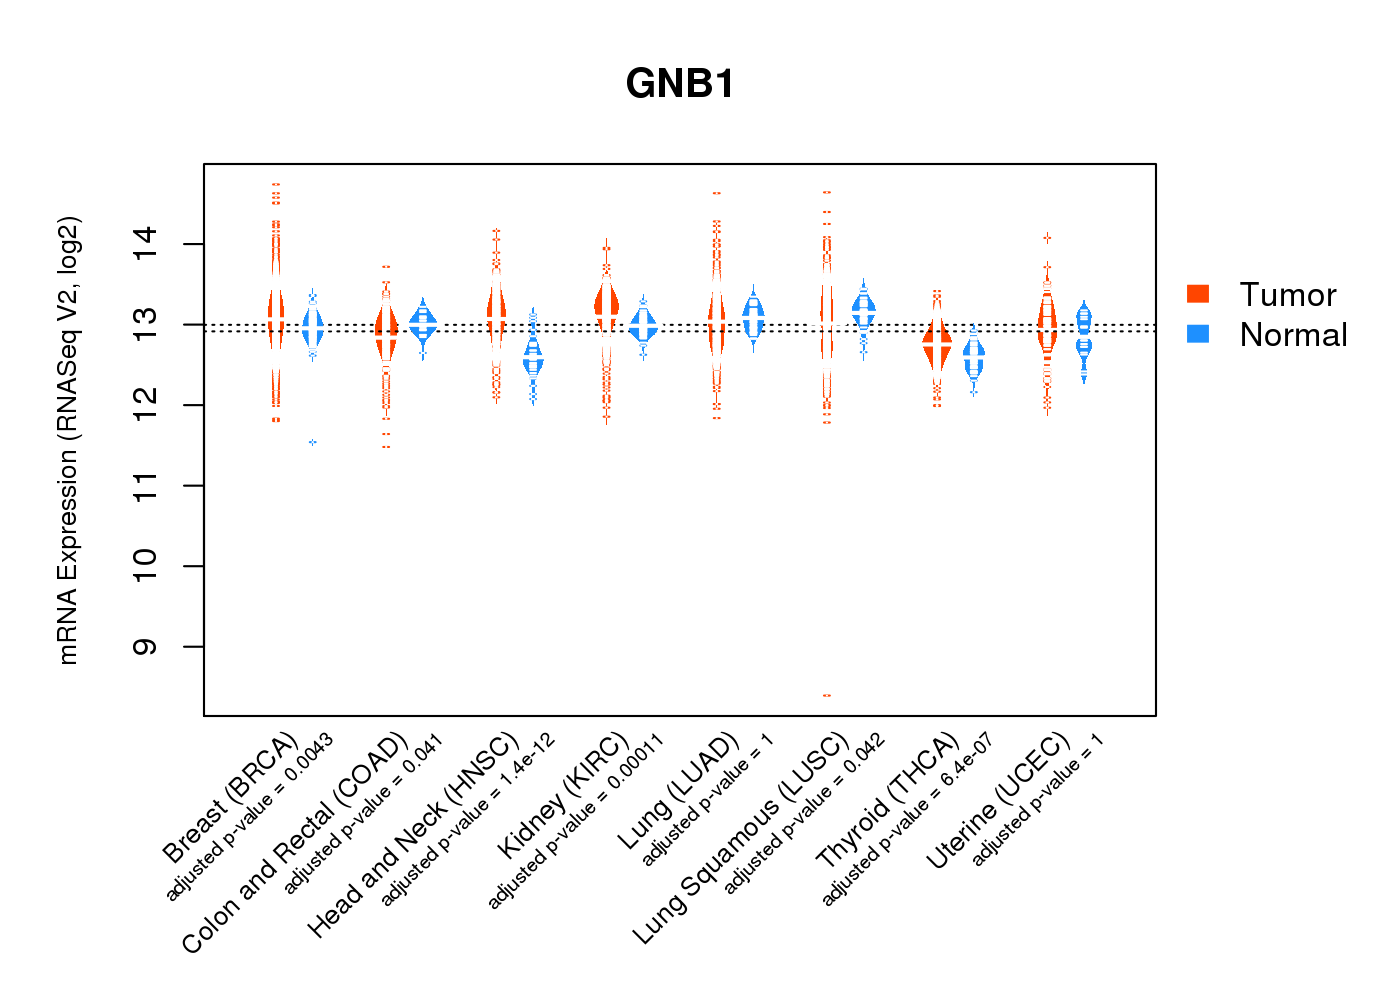 |
| Top |
| * This plots show the correlation between CNV and gene expression. |
: Open all plots for all cancer types
 |
|
 |
|

| Top |
| Gene-Gene Network Information |
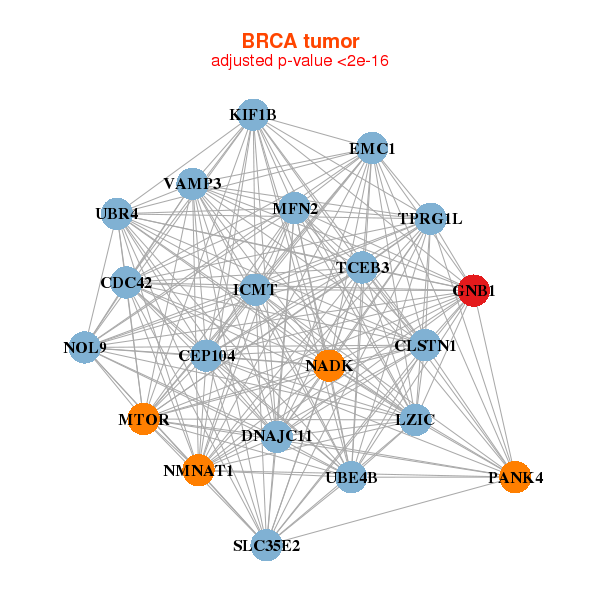
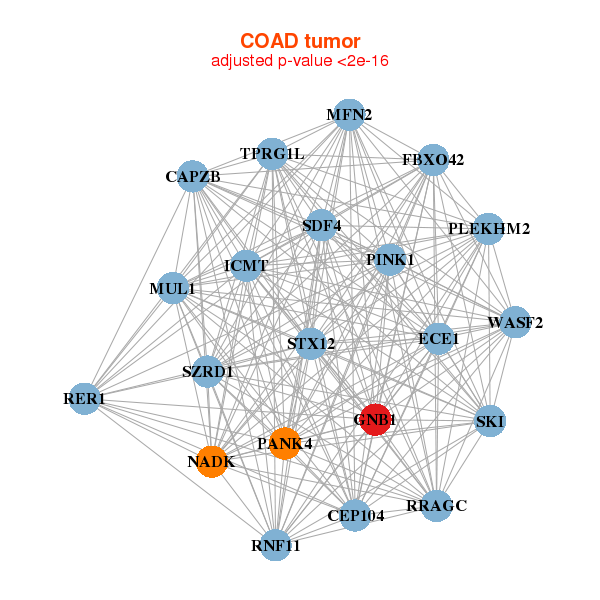
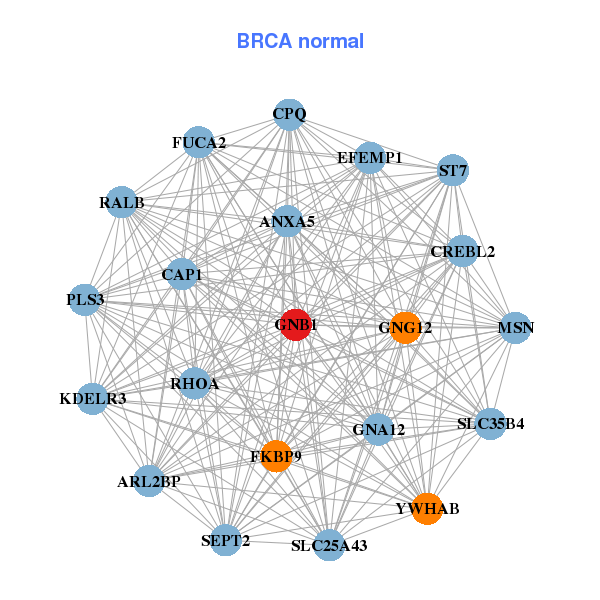
| * Co-Expression network figures were drawn using R package igraph. Only the top 20 genes with the highest correlations were shown. Red circle: input gene, orange circle: cell metabolism gene, sky circle: other gene |
: Open all plots for all cancer types
 |
| ||||
| CDC42,CLSTN1,DNAJC11,GNB1,ICMT,EMC1,CEP104, KIF1B,LZIC,MFN2,MTOR,NADK,NMNAT1,NOL9, PANK4,SLC35E2,TCEB3,TPRG1L,UBE4B,UBR4,VAMP3 | ANXA5,ARL2BP,CAP1,CREBL2,EFEMP1,FKBP9,FUCA2, GNA12,GNB1,GNG12,KDELR3,MSN,CPQ,PLS3, RALB,RHOA,SEPT2,SLC25A43,SLC35B4,ST7,YWHAB | ||||
 |
| ||||
| SZRD1,CAPZB,ECE1,FBXO42,GNB1,ICMT,CEP104, MFN2,MUL1,NADK,PANK4,PINK1,PLEKHM2,RER1, RNF11,RRAGC,SDF4,SKI,STX12,TPRG1L,WASF2 | ABHD6,ALPI,ANPEP,CDHR2,CHRNA7,FAM102A,GNB1, SLC52A1,GSK3A,HEBP1,INPP5J,ITPK1,CERS2,MEP1A, MSRA,MYO1A,OIT3,PLA2G12B,PPP2R5D,SEMA3B,USH1G |
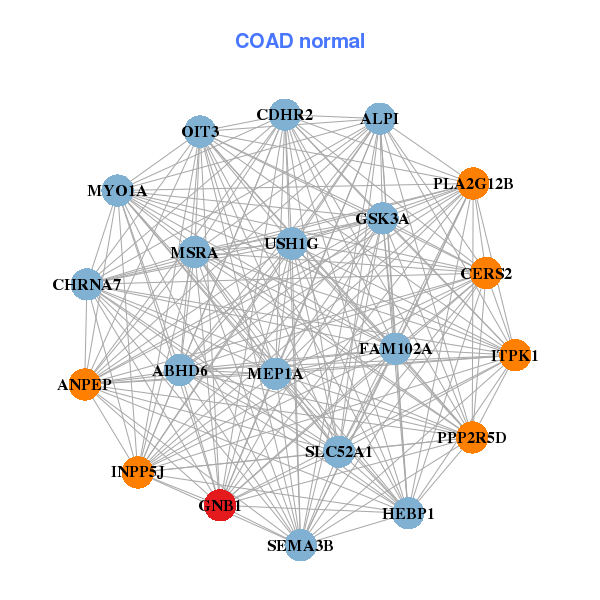
| * Co-Expression network figures were drawn using R package igraph. Only the top 20 genes with the highest correlations were shown. Red circle: input gene, orange circle: cell metabolism gene, sky circle: other gene |
: Open all plots for all cancer types
| Top |
: Open all interacting genes' information including KEGG pathway for all interacting genes from DAVID
| Top |
| Pharmacological Information for GNB1 |
| DB Category | DB Name | DB's ID and Url link |
| * Gene Centered Interaction Network. |
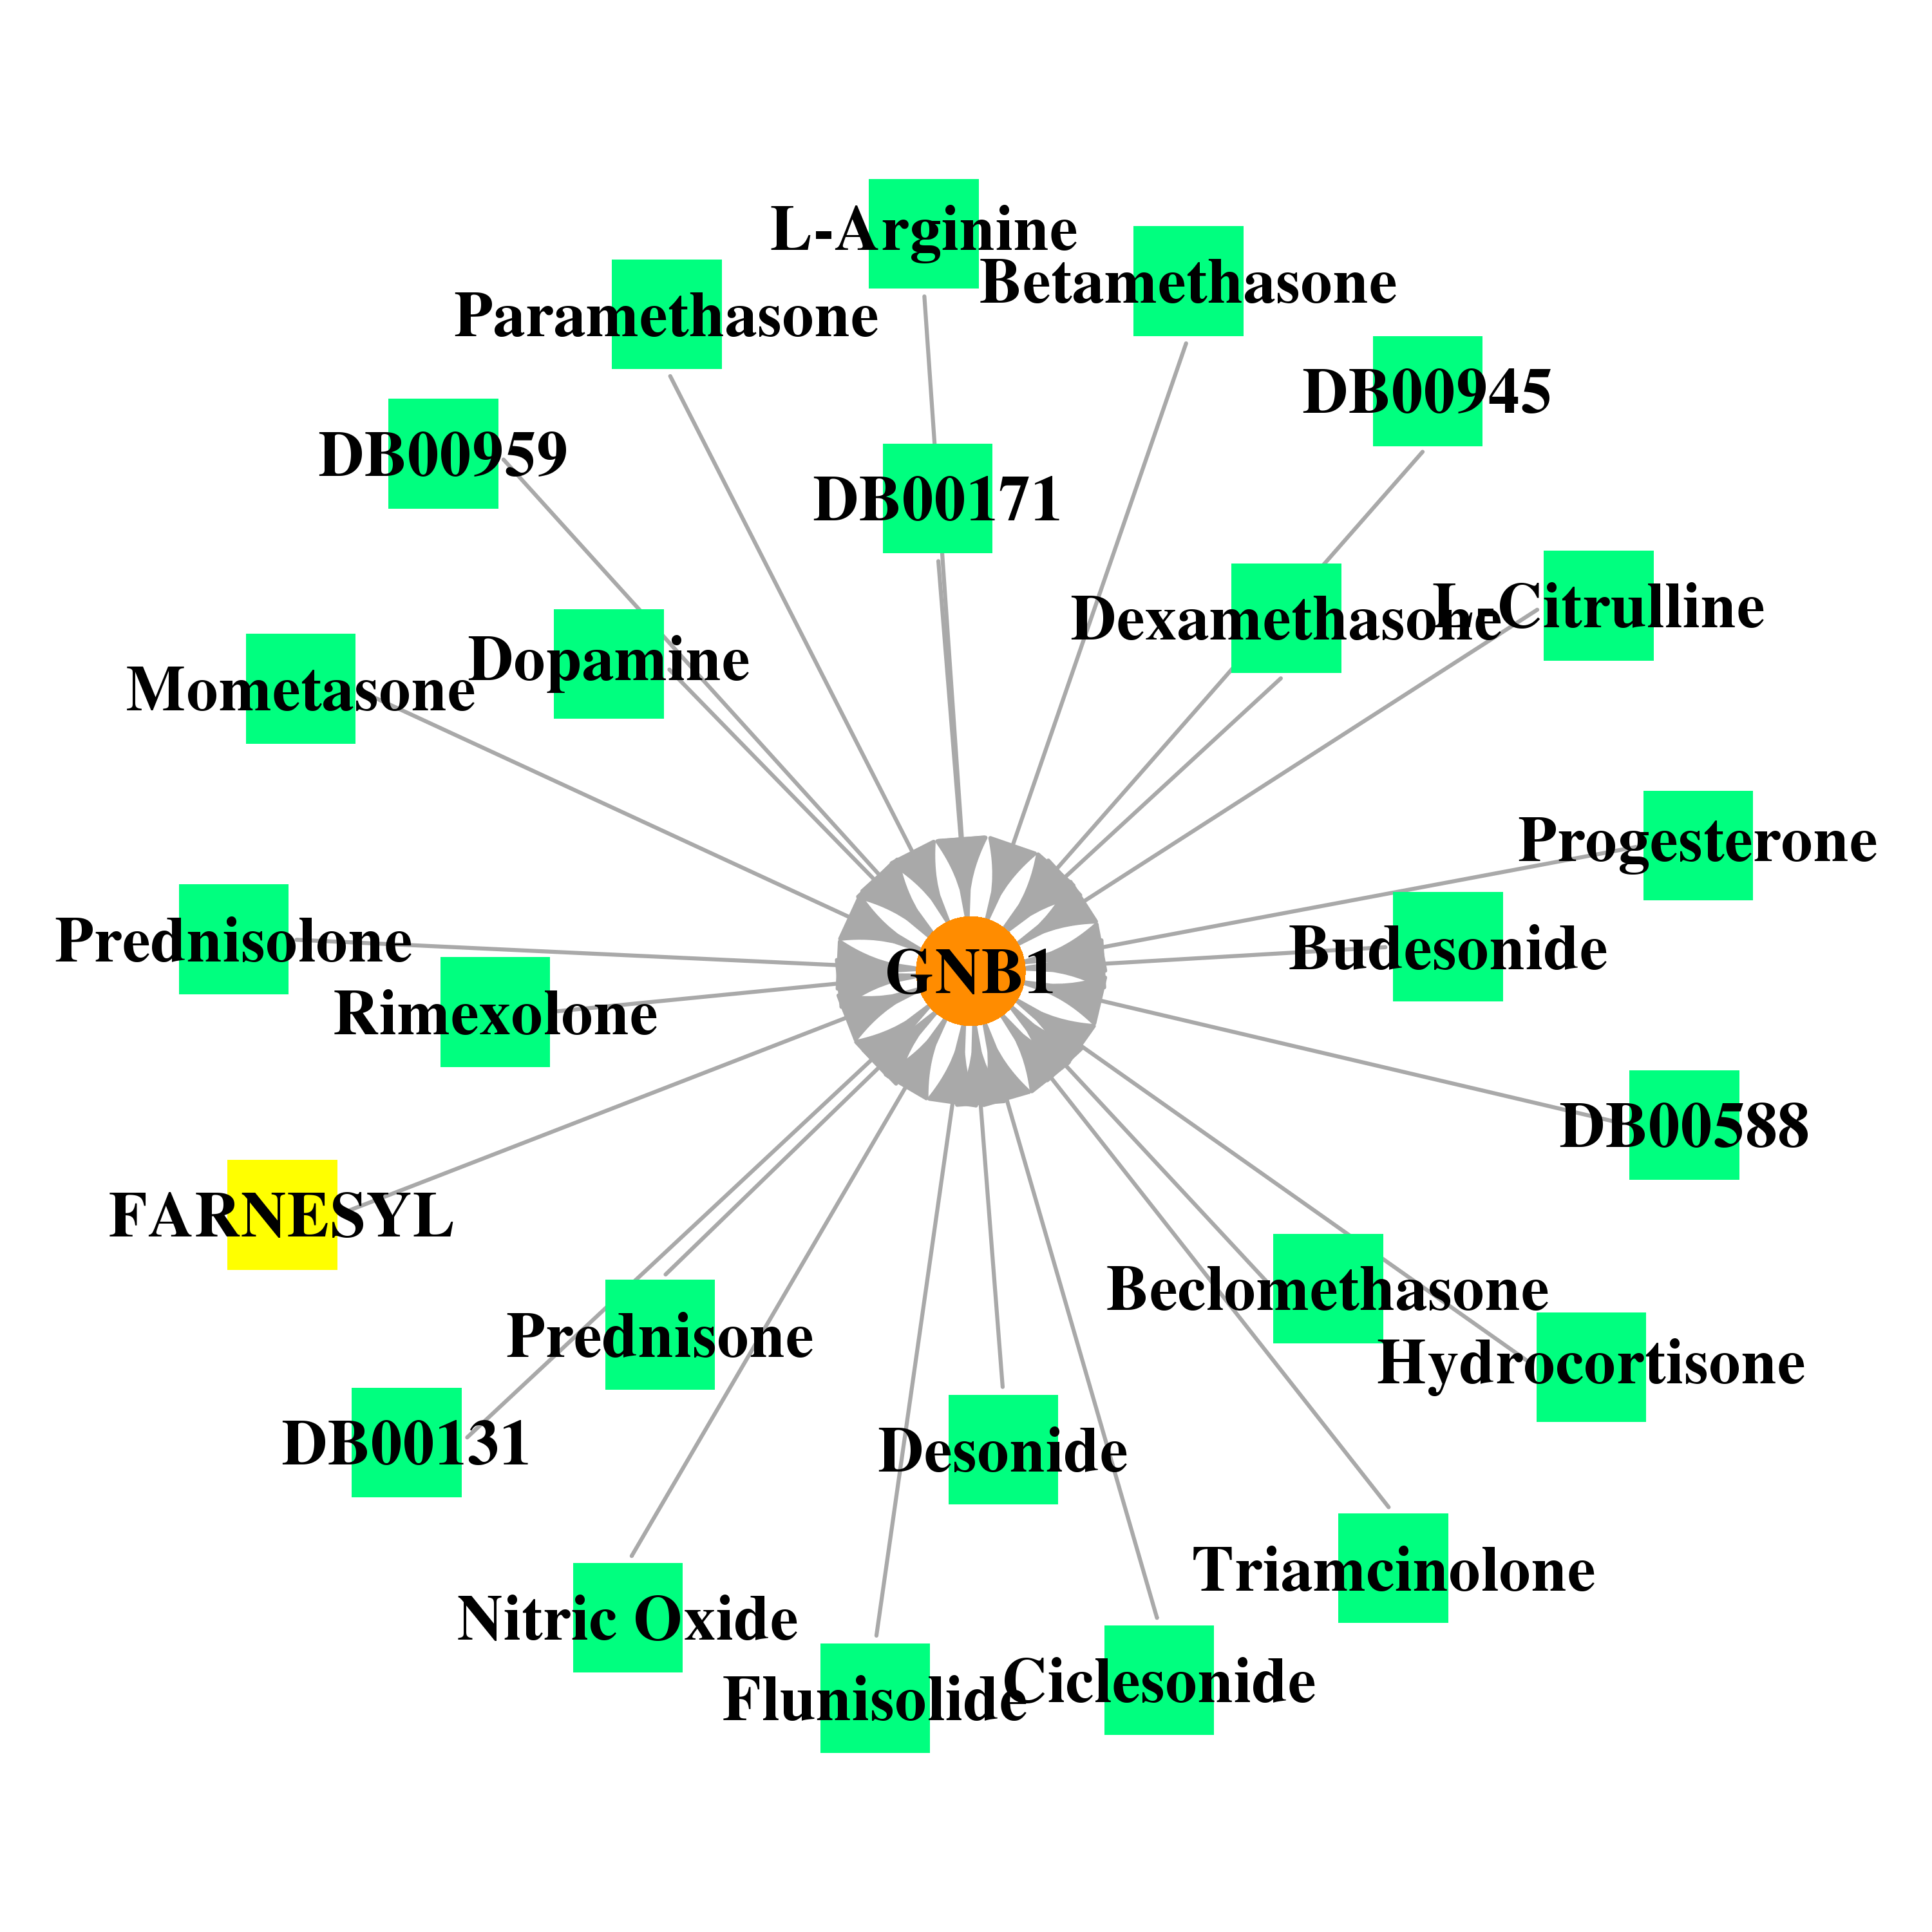 |
| * Drug Centered Interaction Network. |
| DrugBank ID | Target Name | Drug Groups | Generic Name | Drug Centered Network | Drug Structure |
| DB07752 | guanine nucleotide binding protein (G protein), beta polypeptide 1 | experimental | FARNESYL | 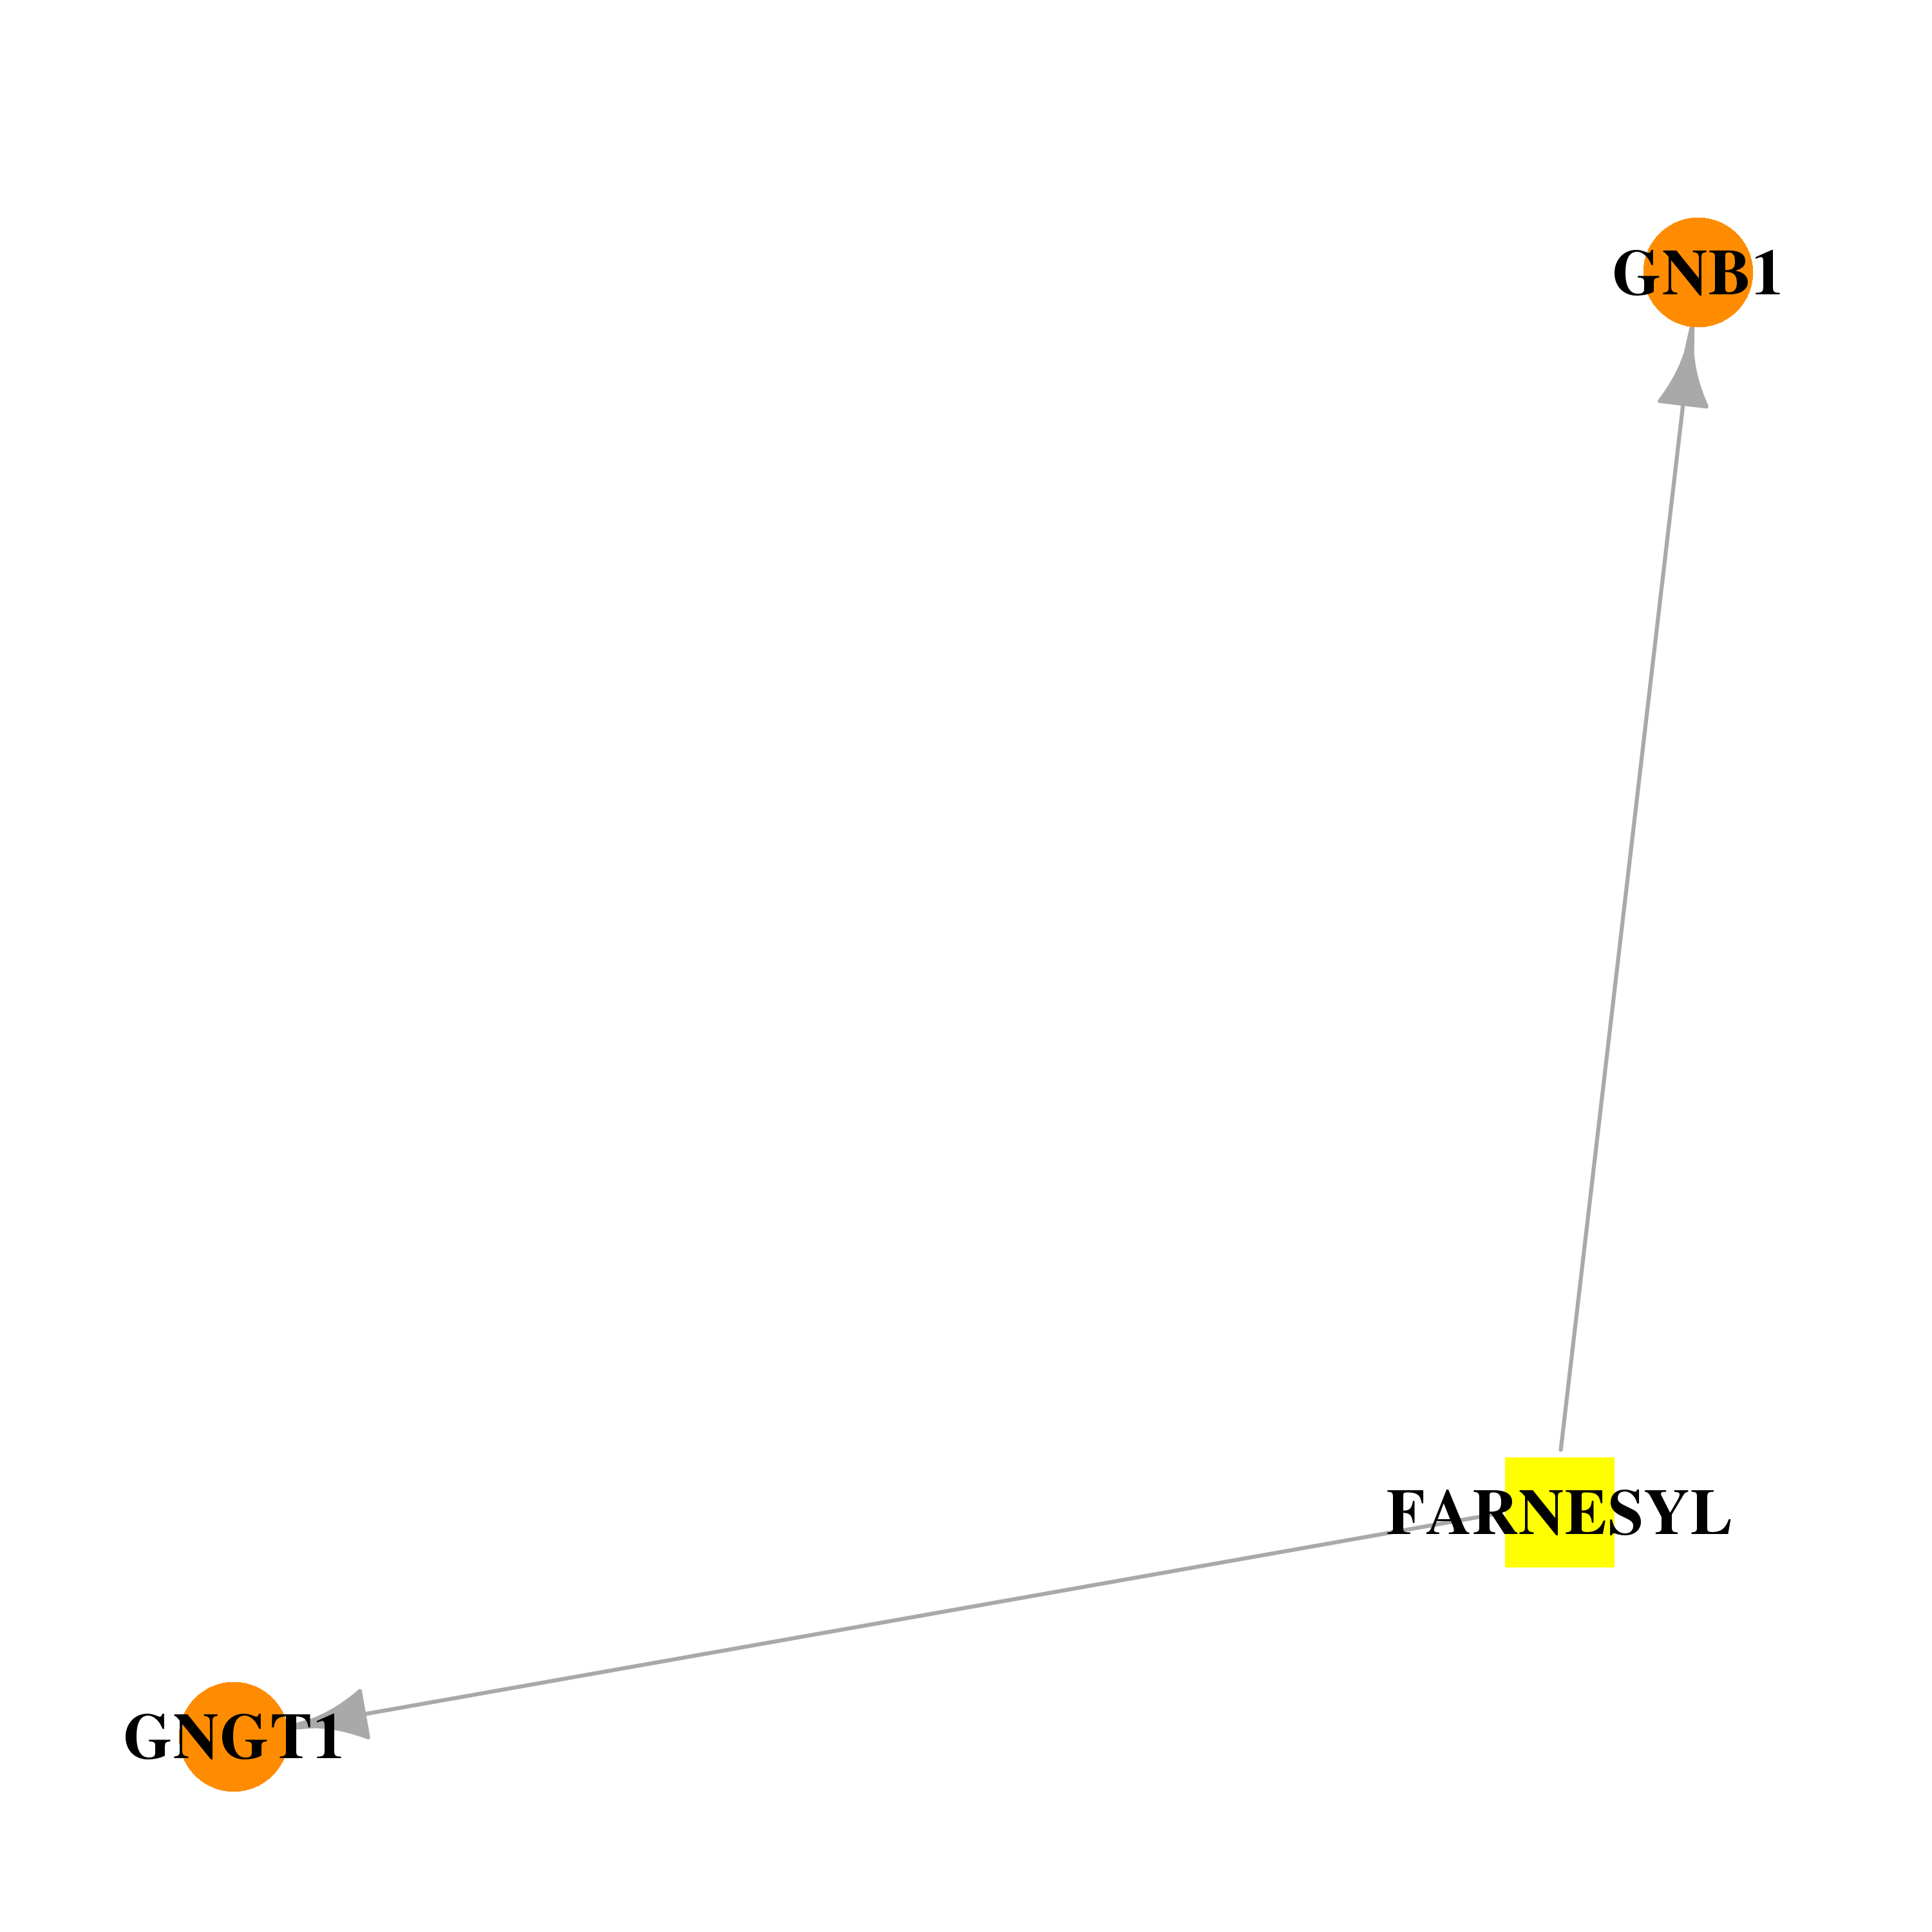 | 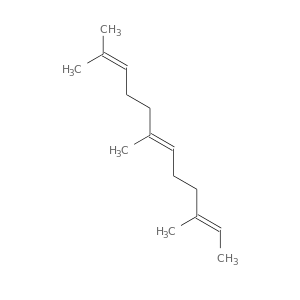 |
| DB00945 | guanine nucleotide binding protein (G protein), beta polypeptide 1 | approved | Acetylsalicylic acid | 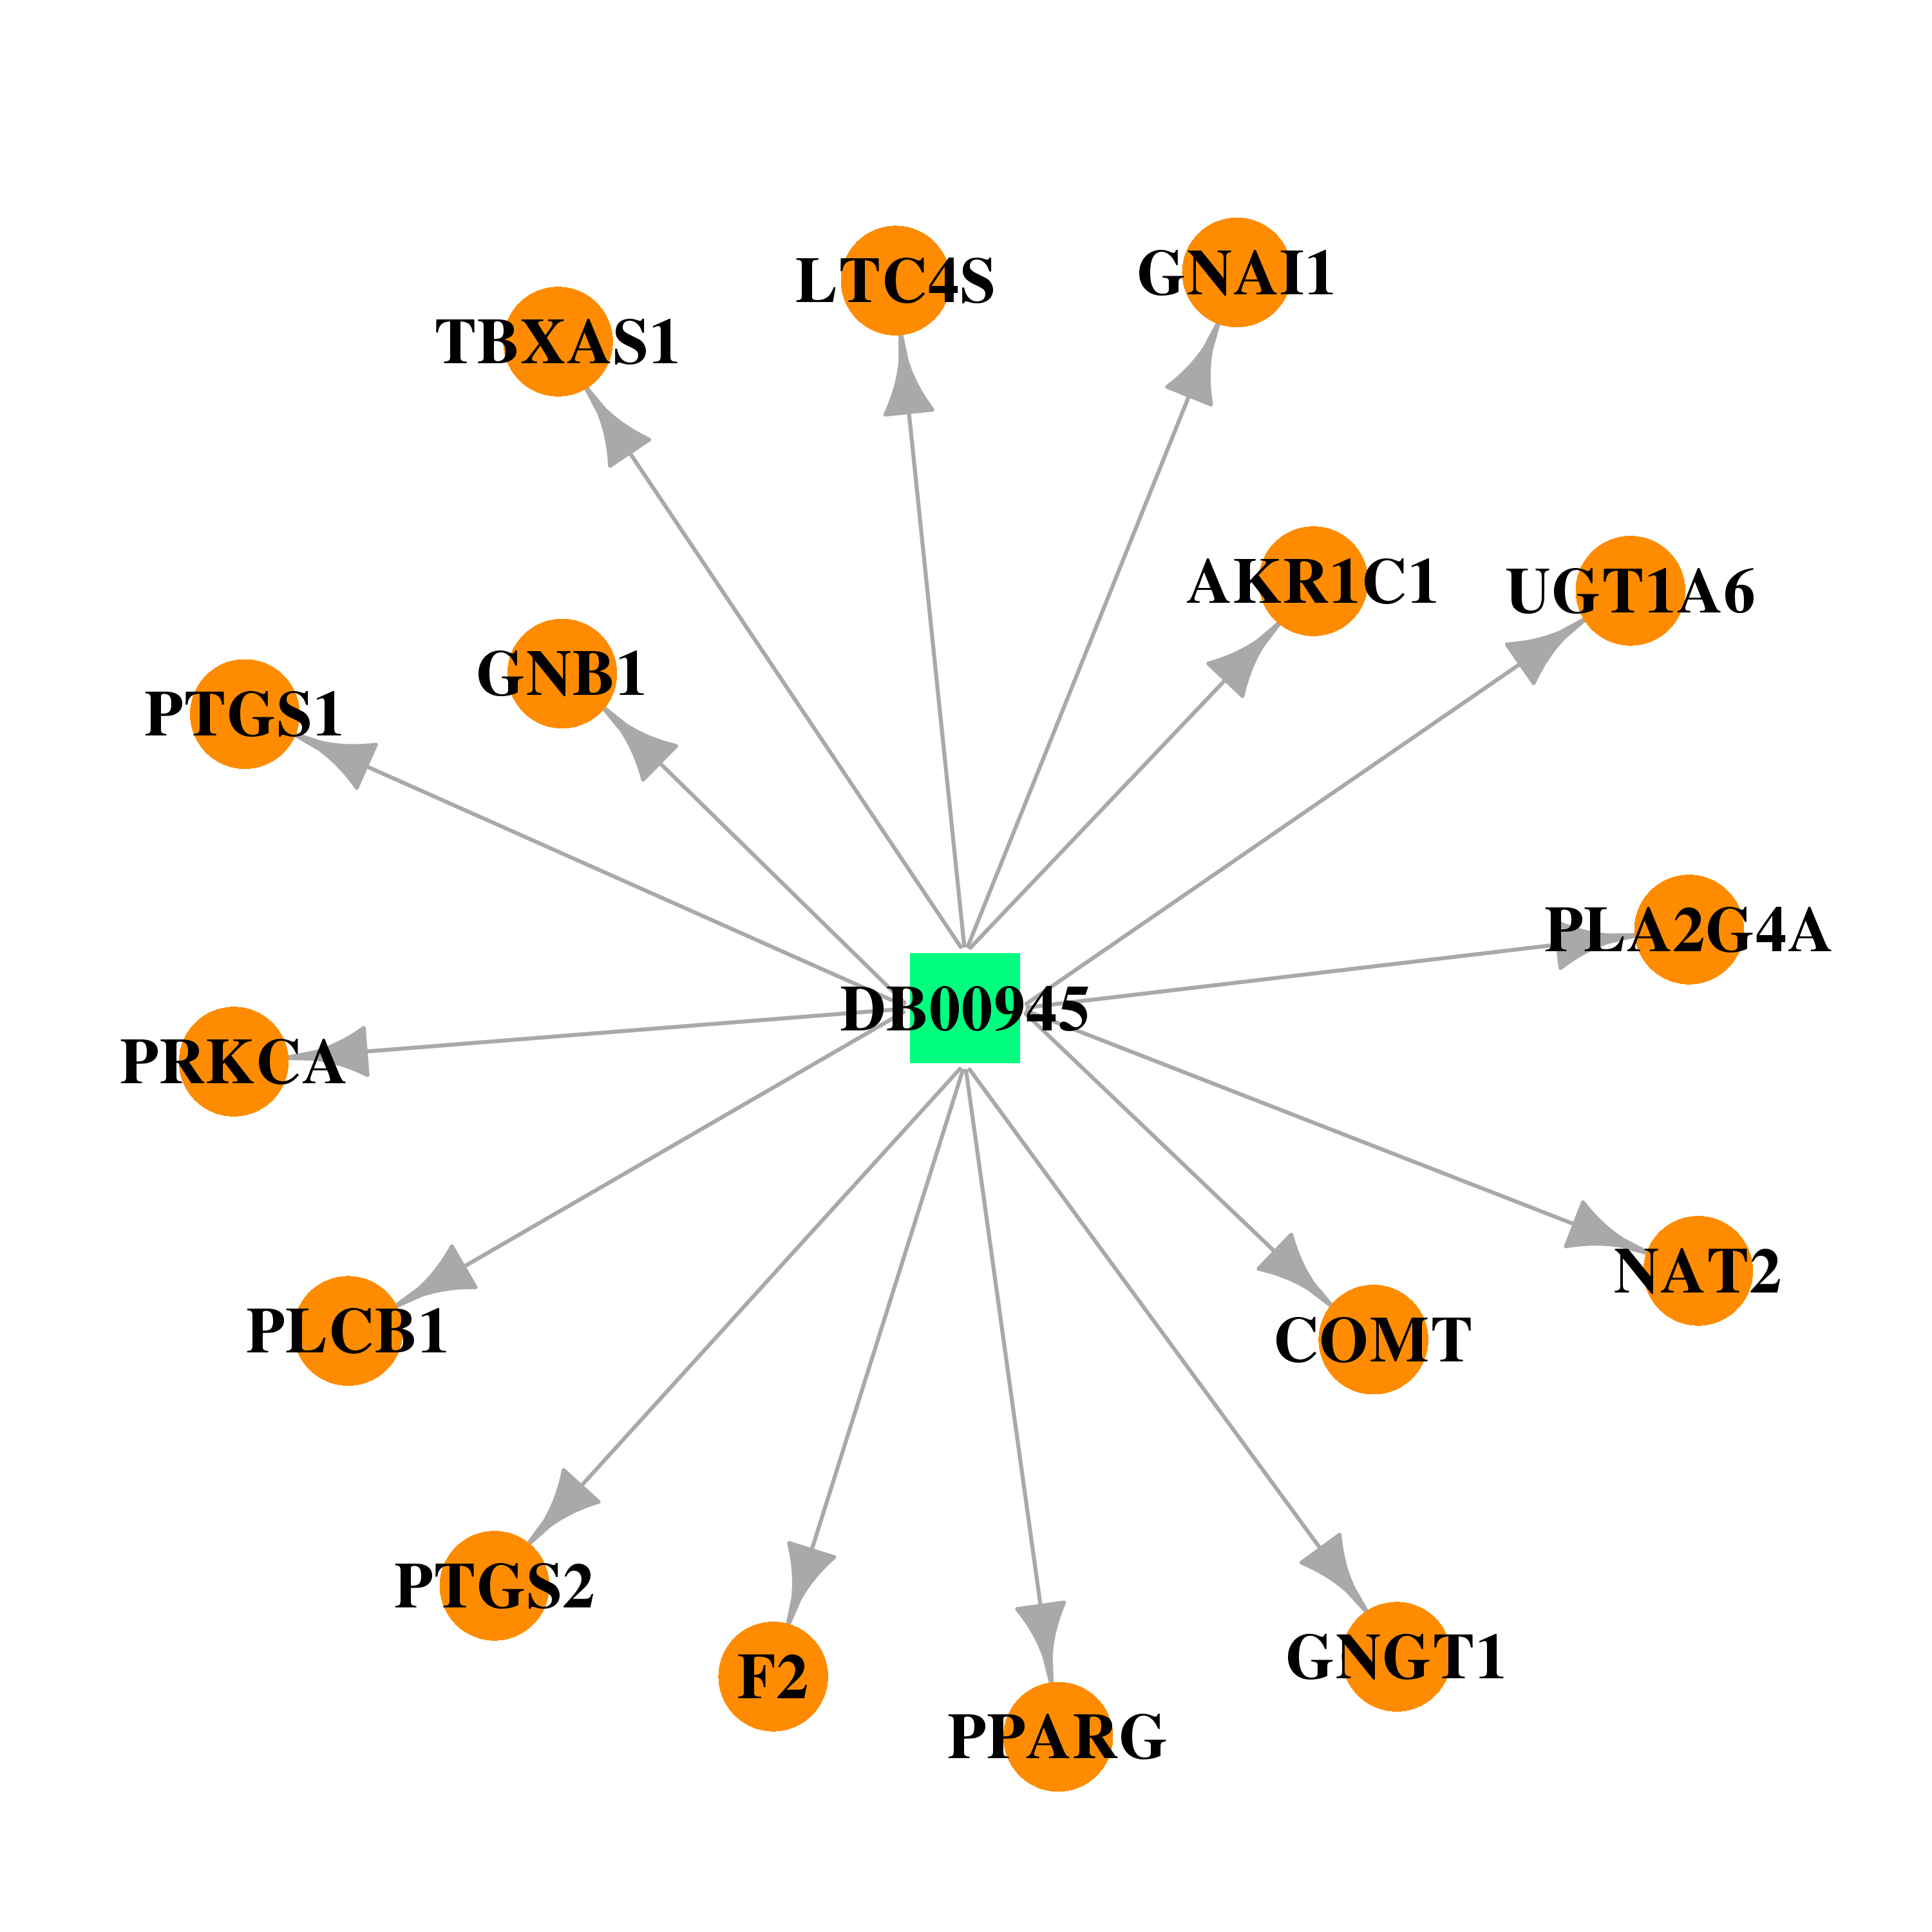 | 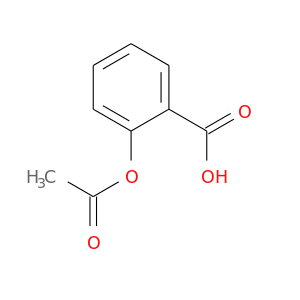 |
| DB00394 | guanine nucleotide binding protein (G protein), beta polypeptide 1 | approved | Beclomethasone | 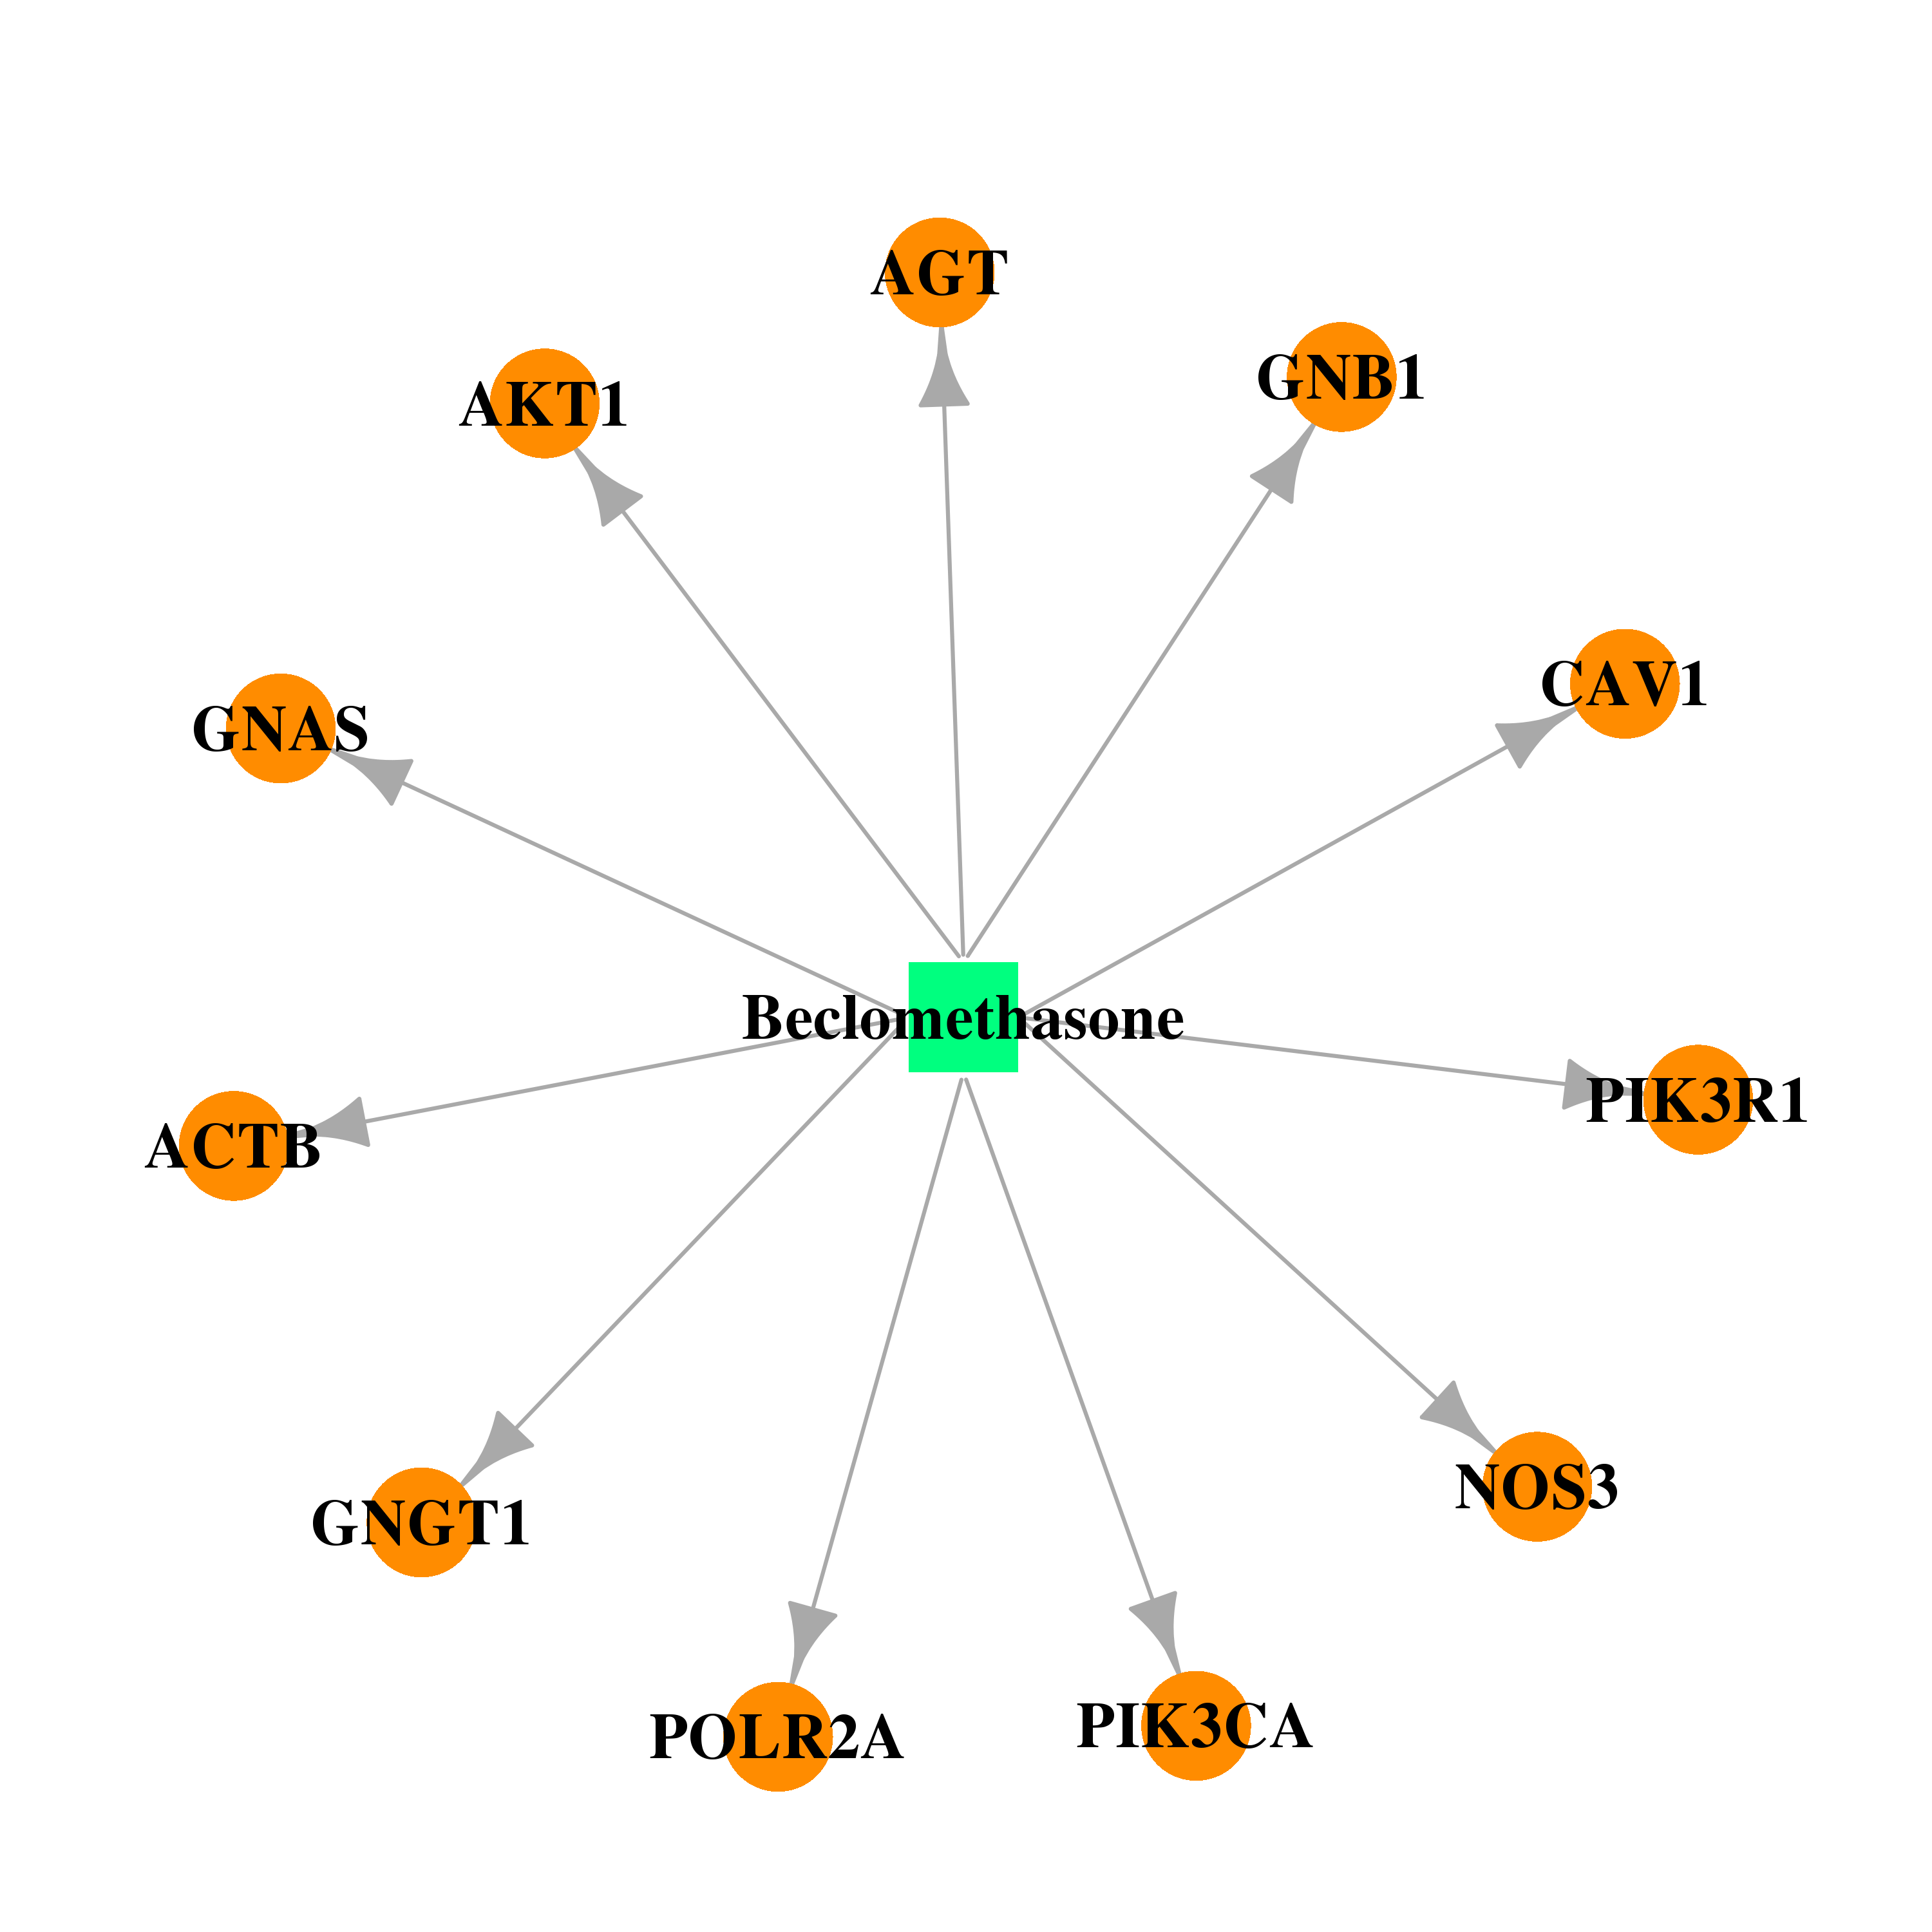 | 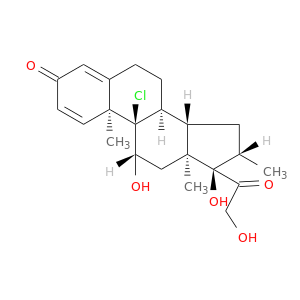 |
| DB00443 | guanine nucleotide binding protein (G protein), beta polypeptide 1 | approved | Betamethasone |  | 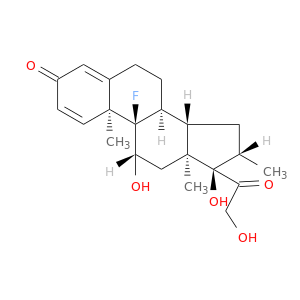 |
| DB01222 | guanine nucleotide binding protein (G protein), beta polypeptide 1 | approved; investigational | Budesonide |  | 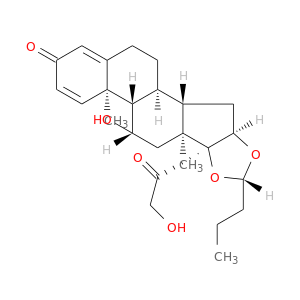 |
| DB01410 | guanine nucleotide binding protein (G protein), beta polypeptide 1 | approved; investigational | Ciclesonide | 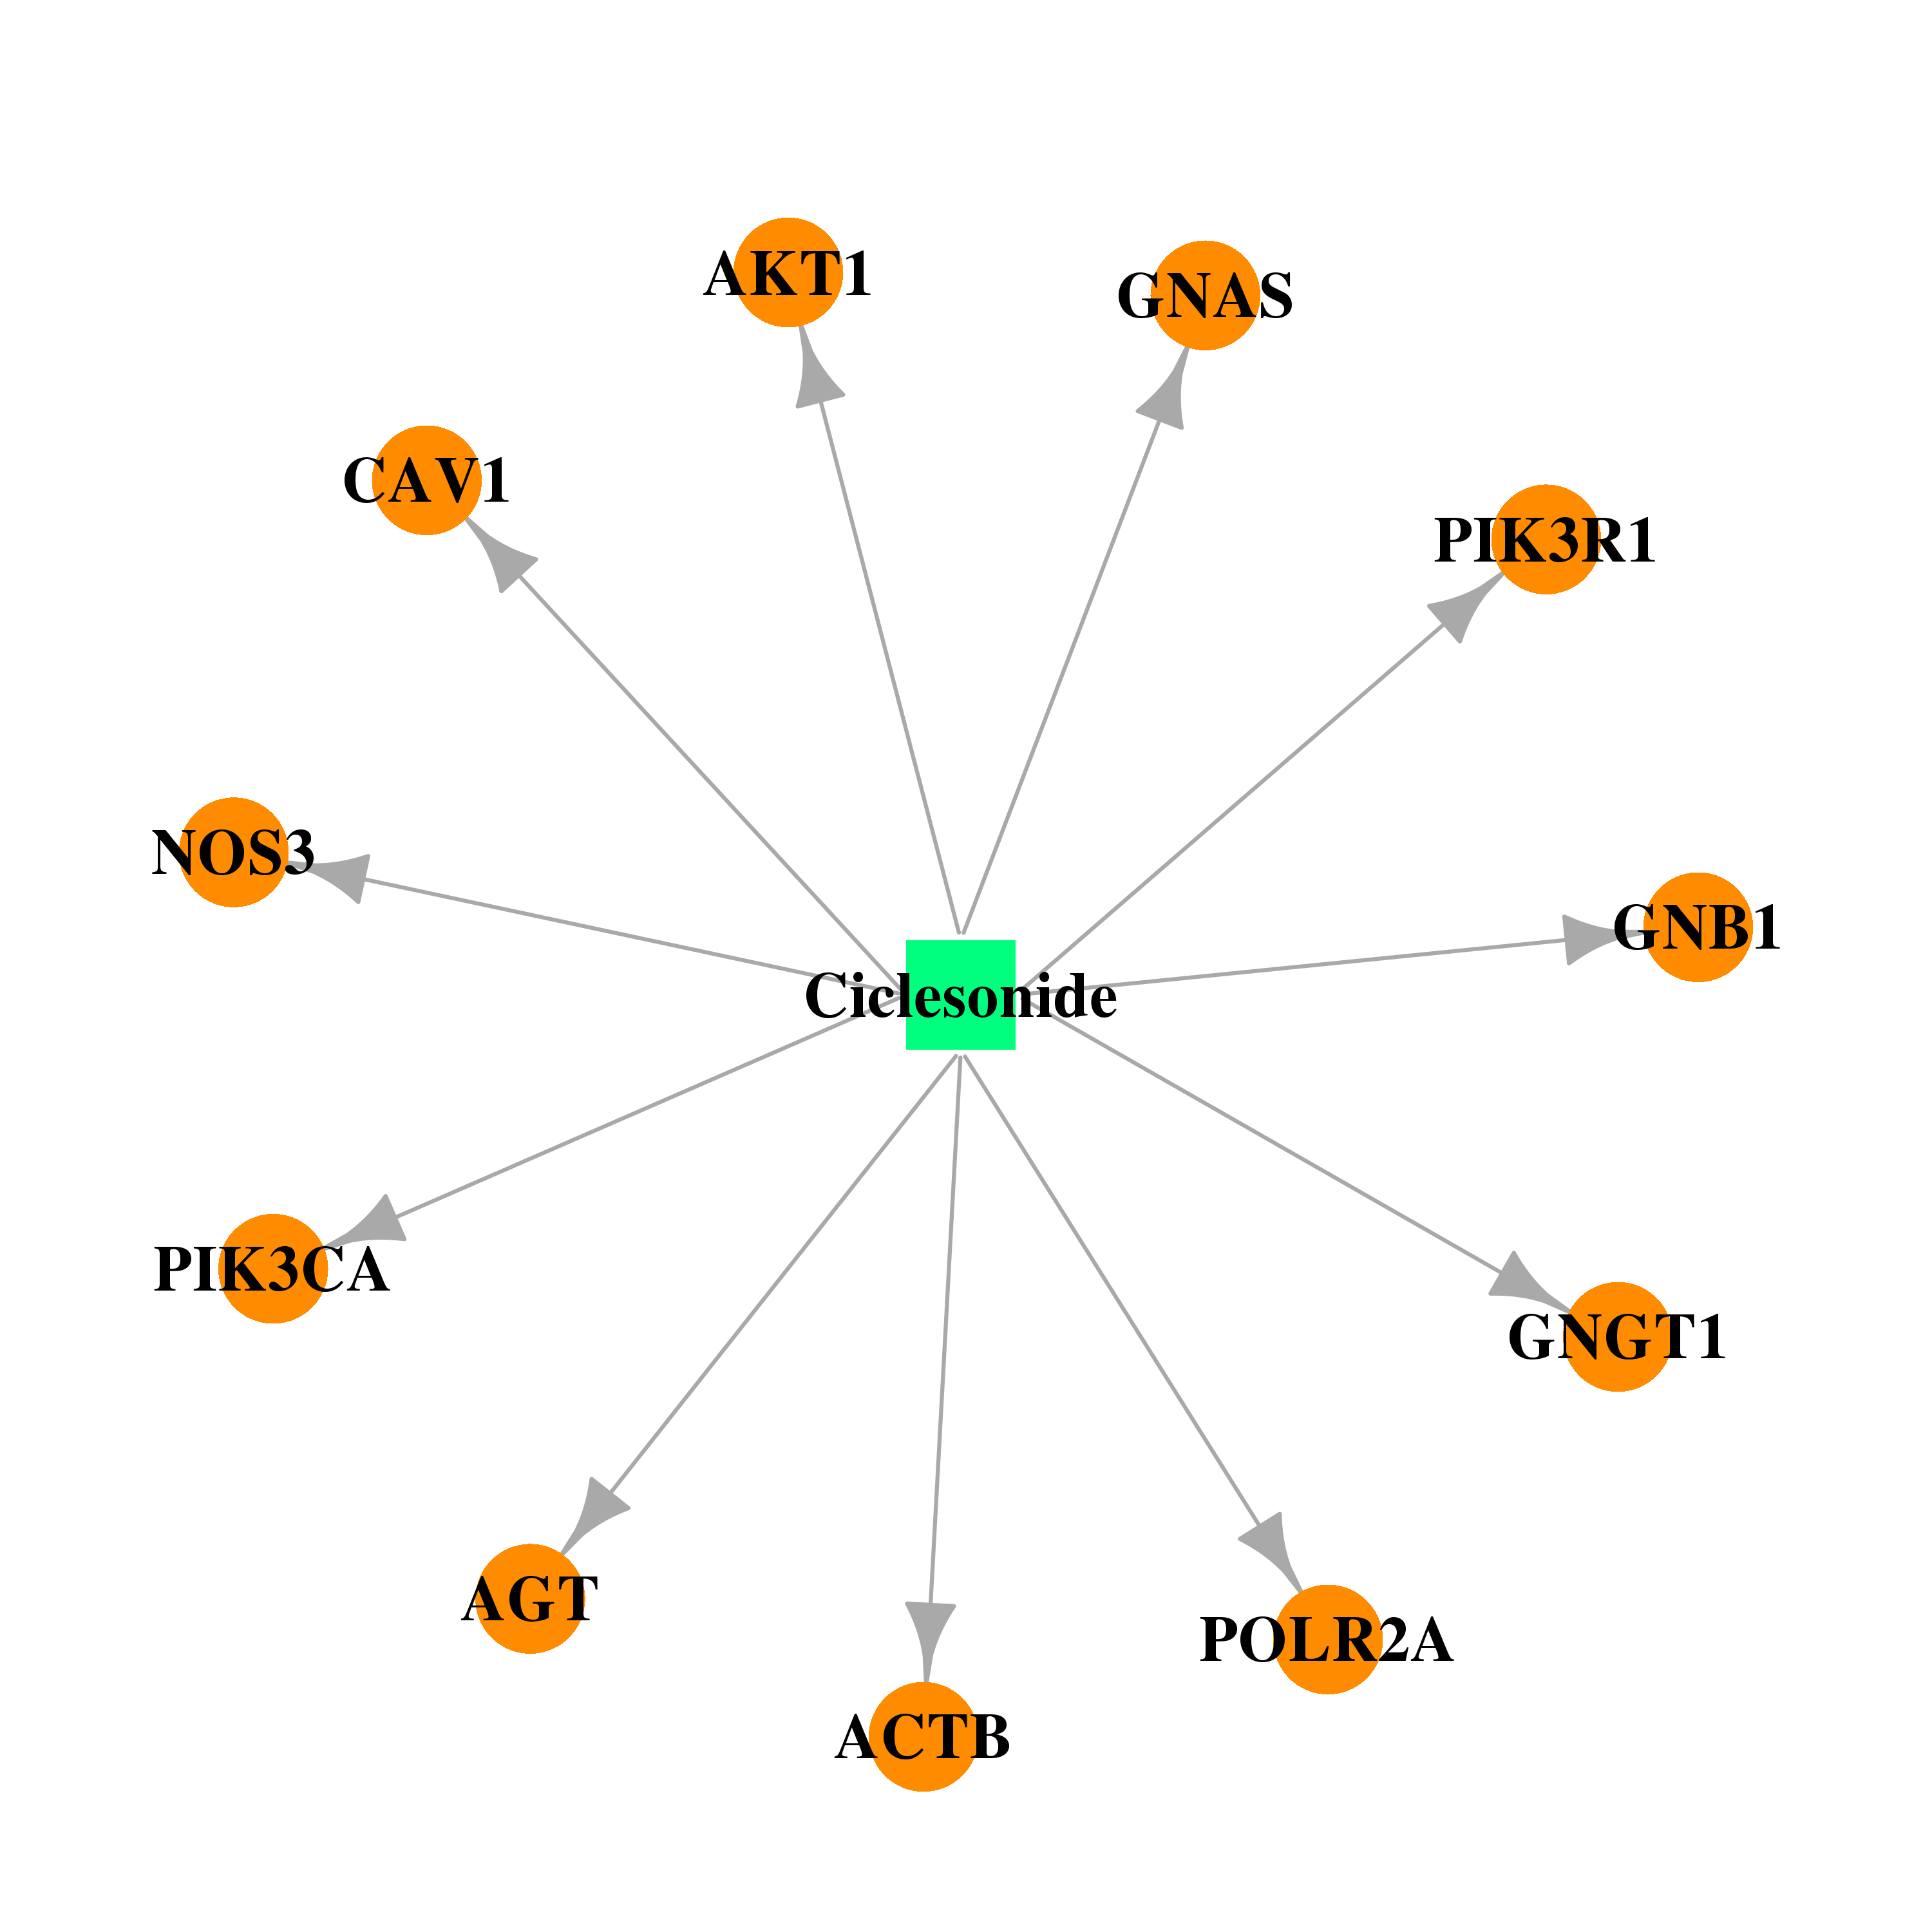 | 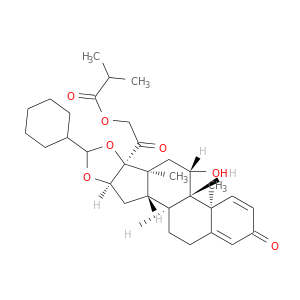 |
| DB01260 | guanine nucleotide binding protein (G protein), beta polypeptide 1 | approved; investigational | Desonide |  |  |
| DB01234 | guanine nucleotide binding protein (G protein), beta polypeptide 1 | approved; investigational | Dexamethasone | 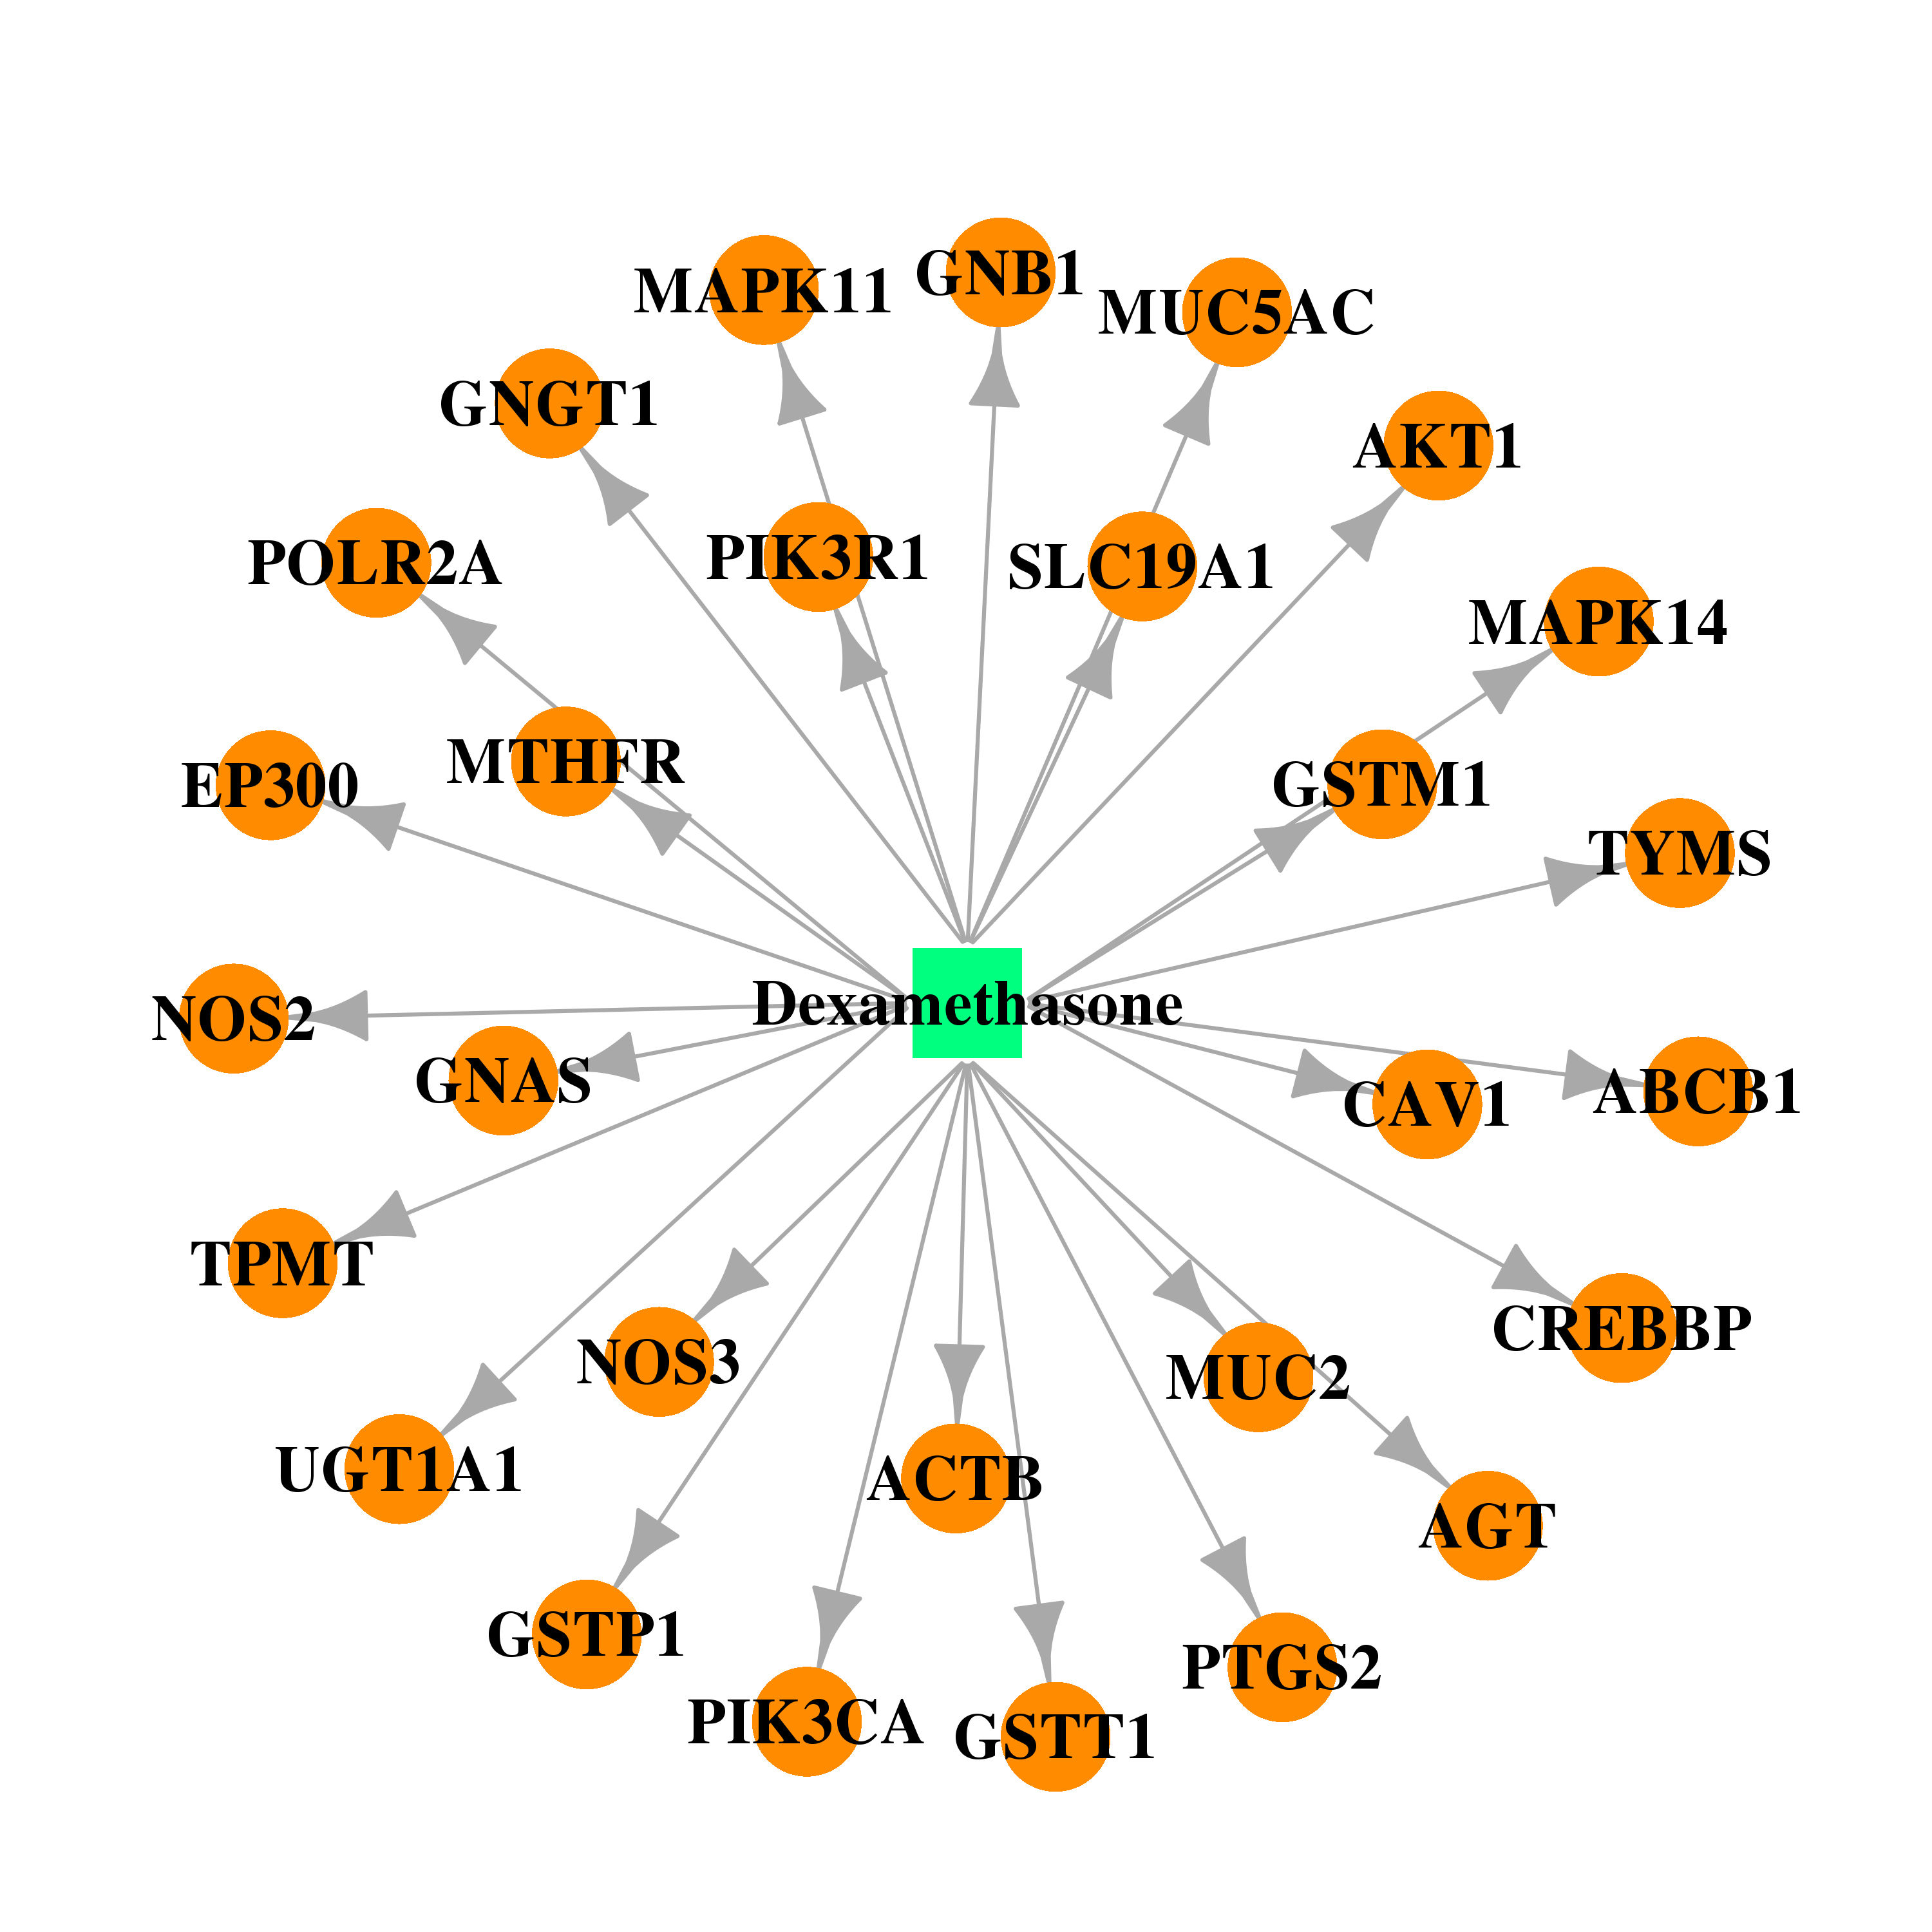 | 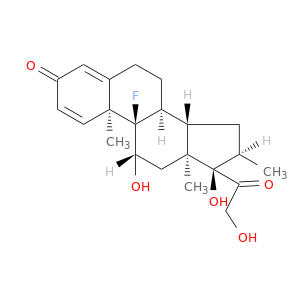 |
| DB00180 | guanine nucleotide binding protein (G protein), beta polypeptide 1 | approved; investigational | Flunisolide | 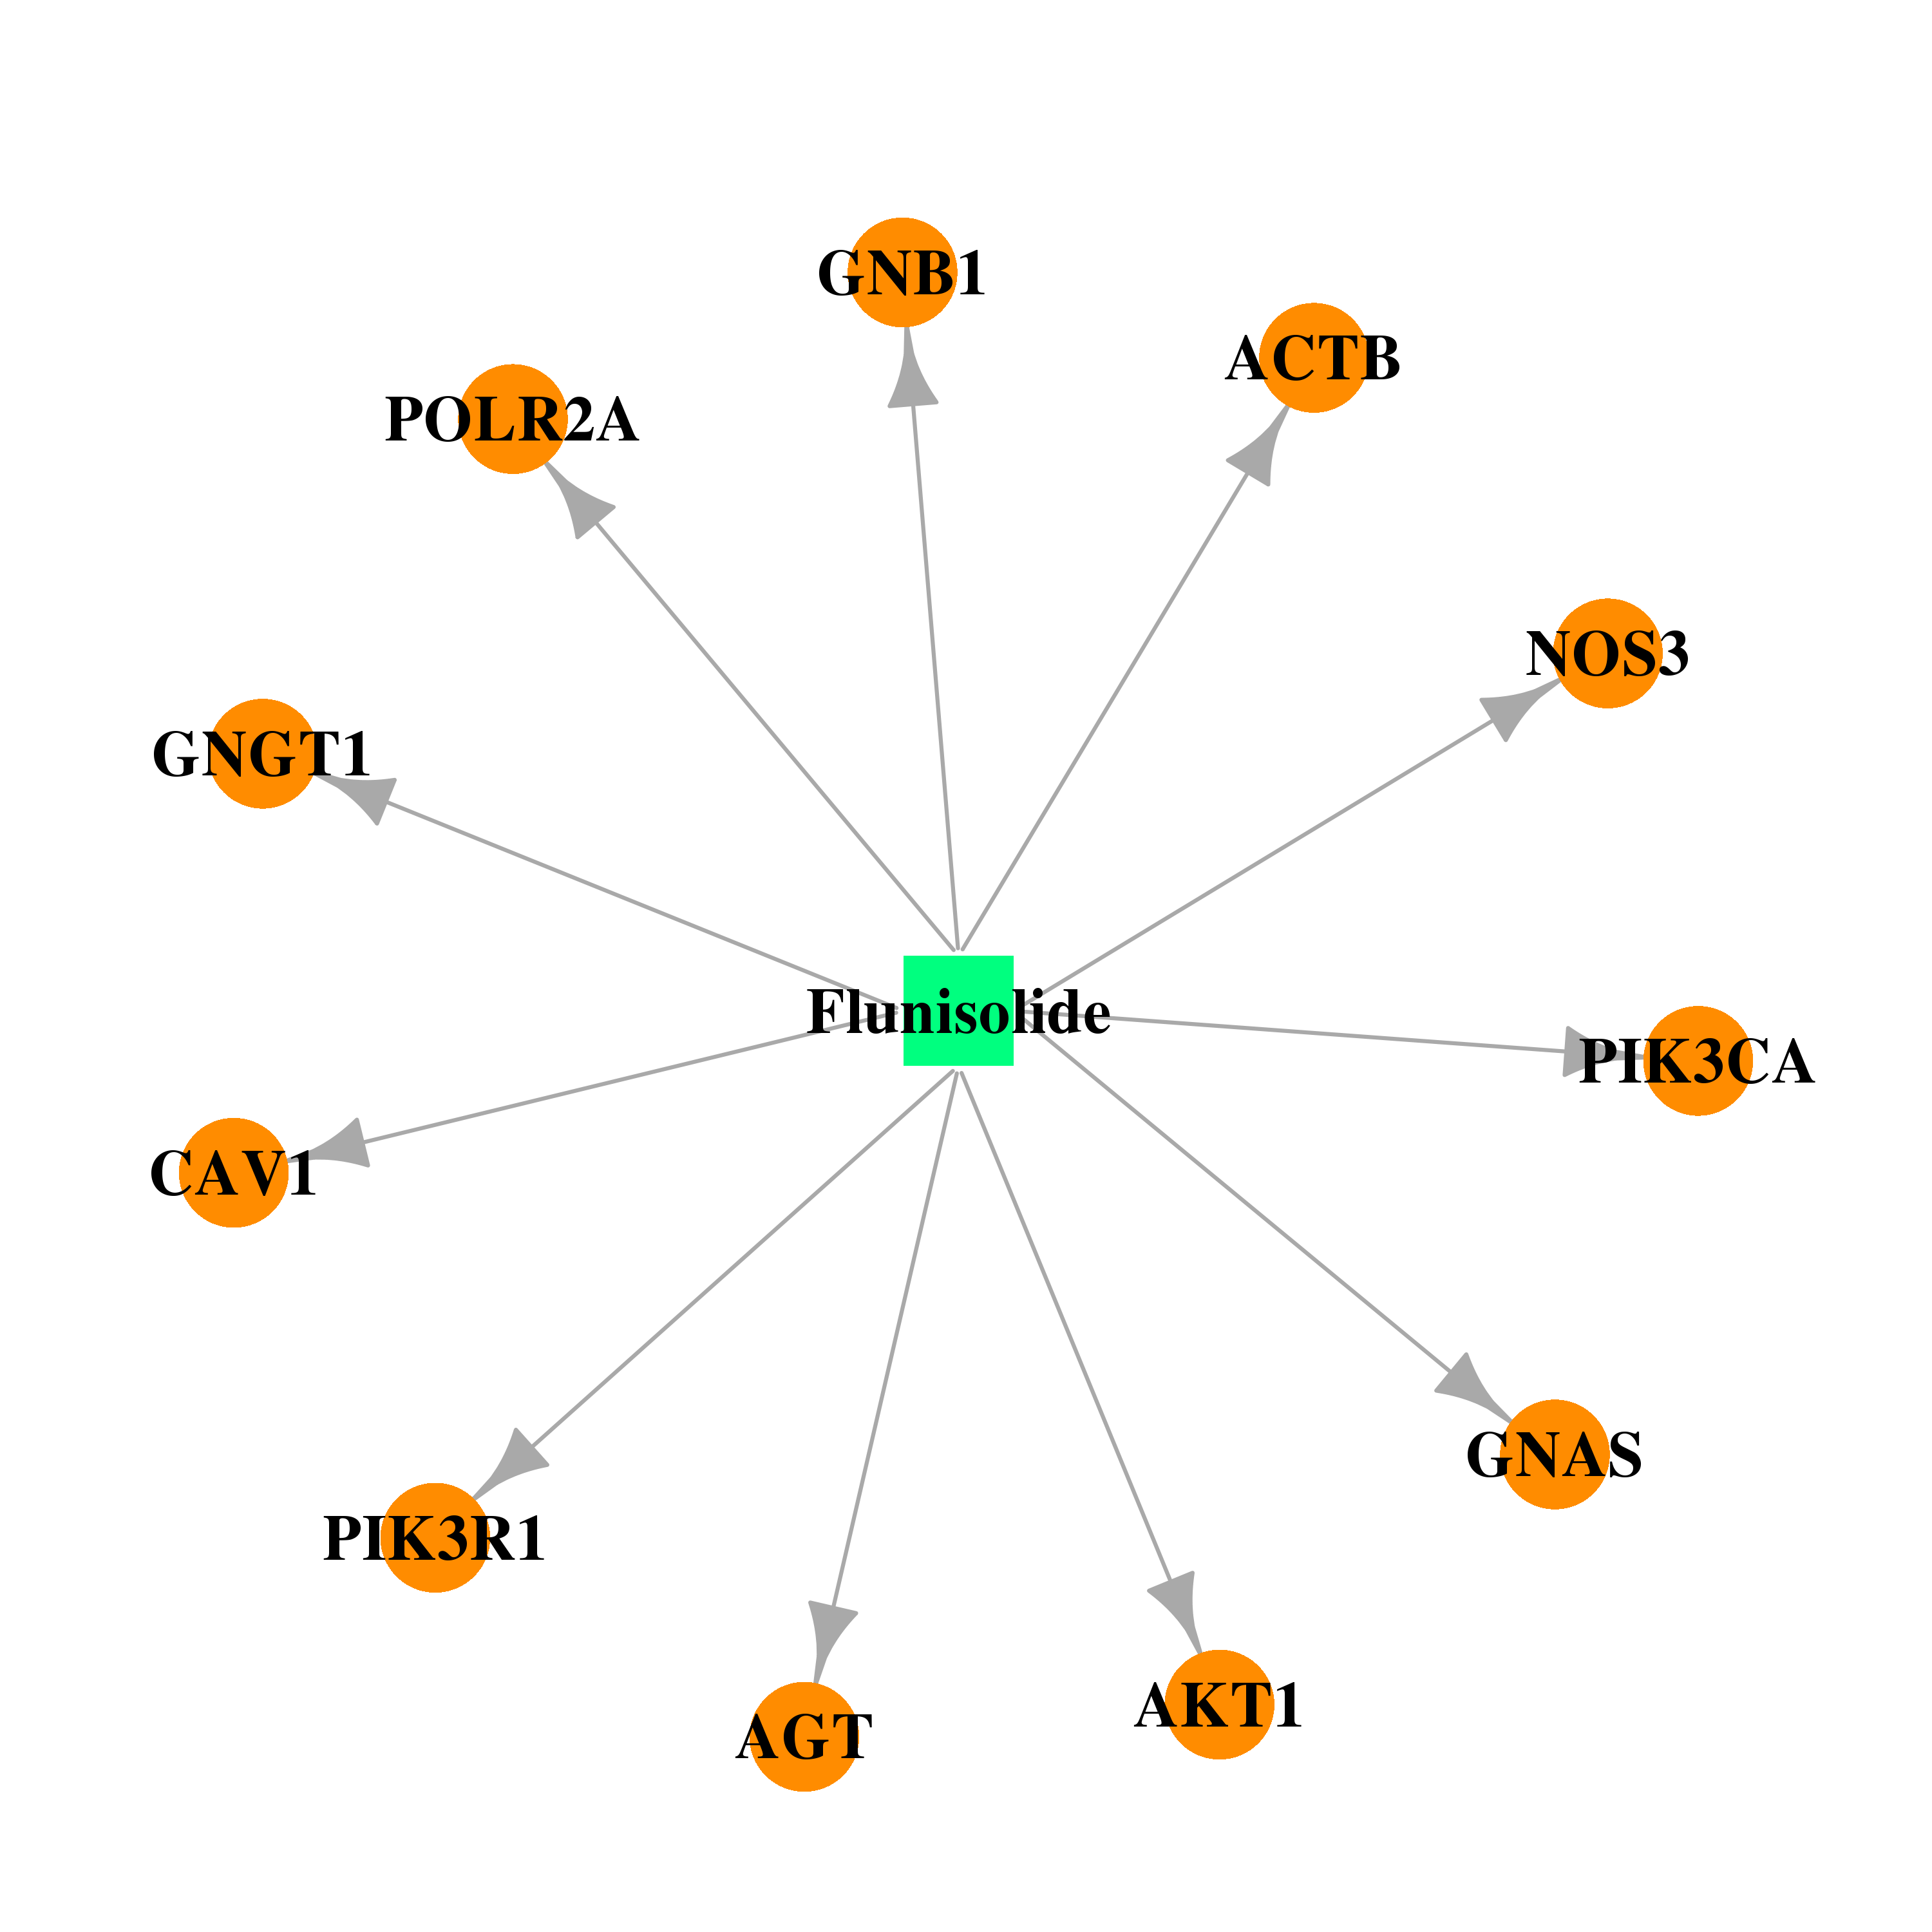 | 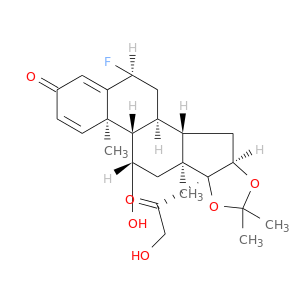 |
| DB00588 | guanine nucleotide binding protein (G protein), beta polypeptide 1 | approved; investigational | Fluticasone Propionate | 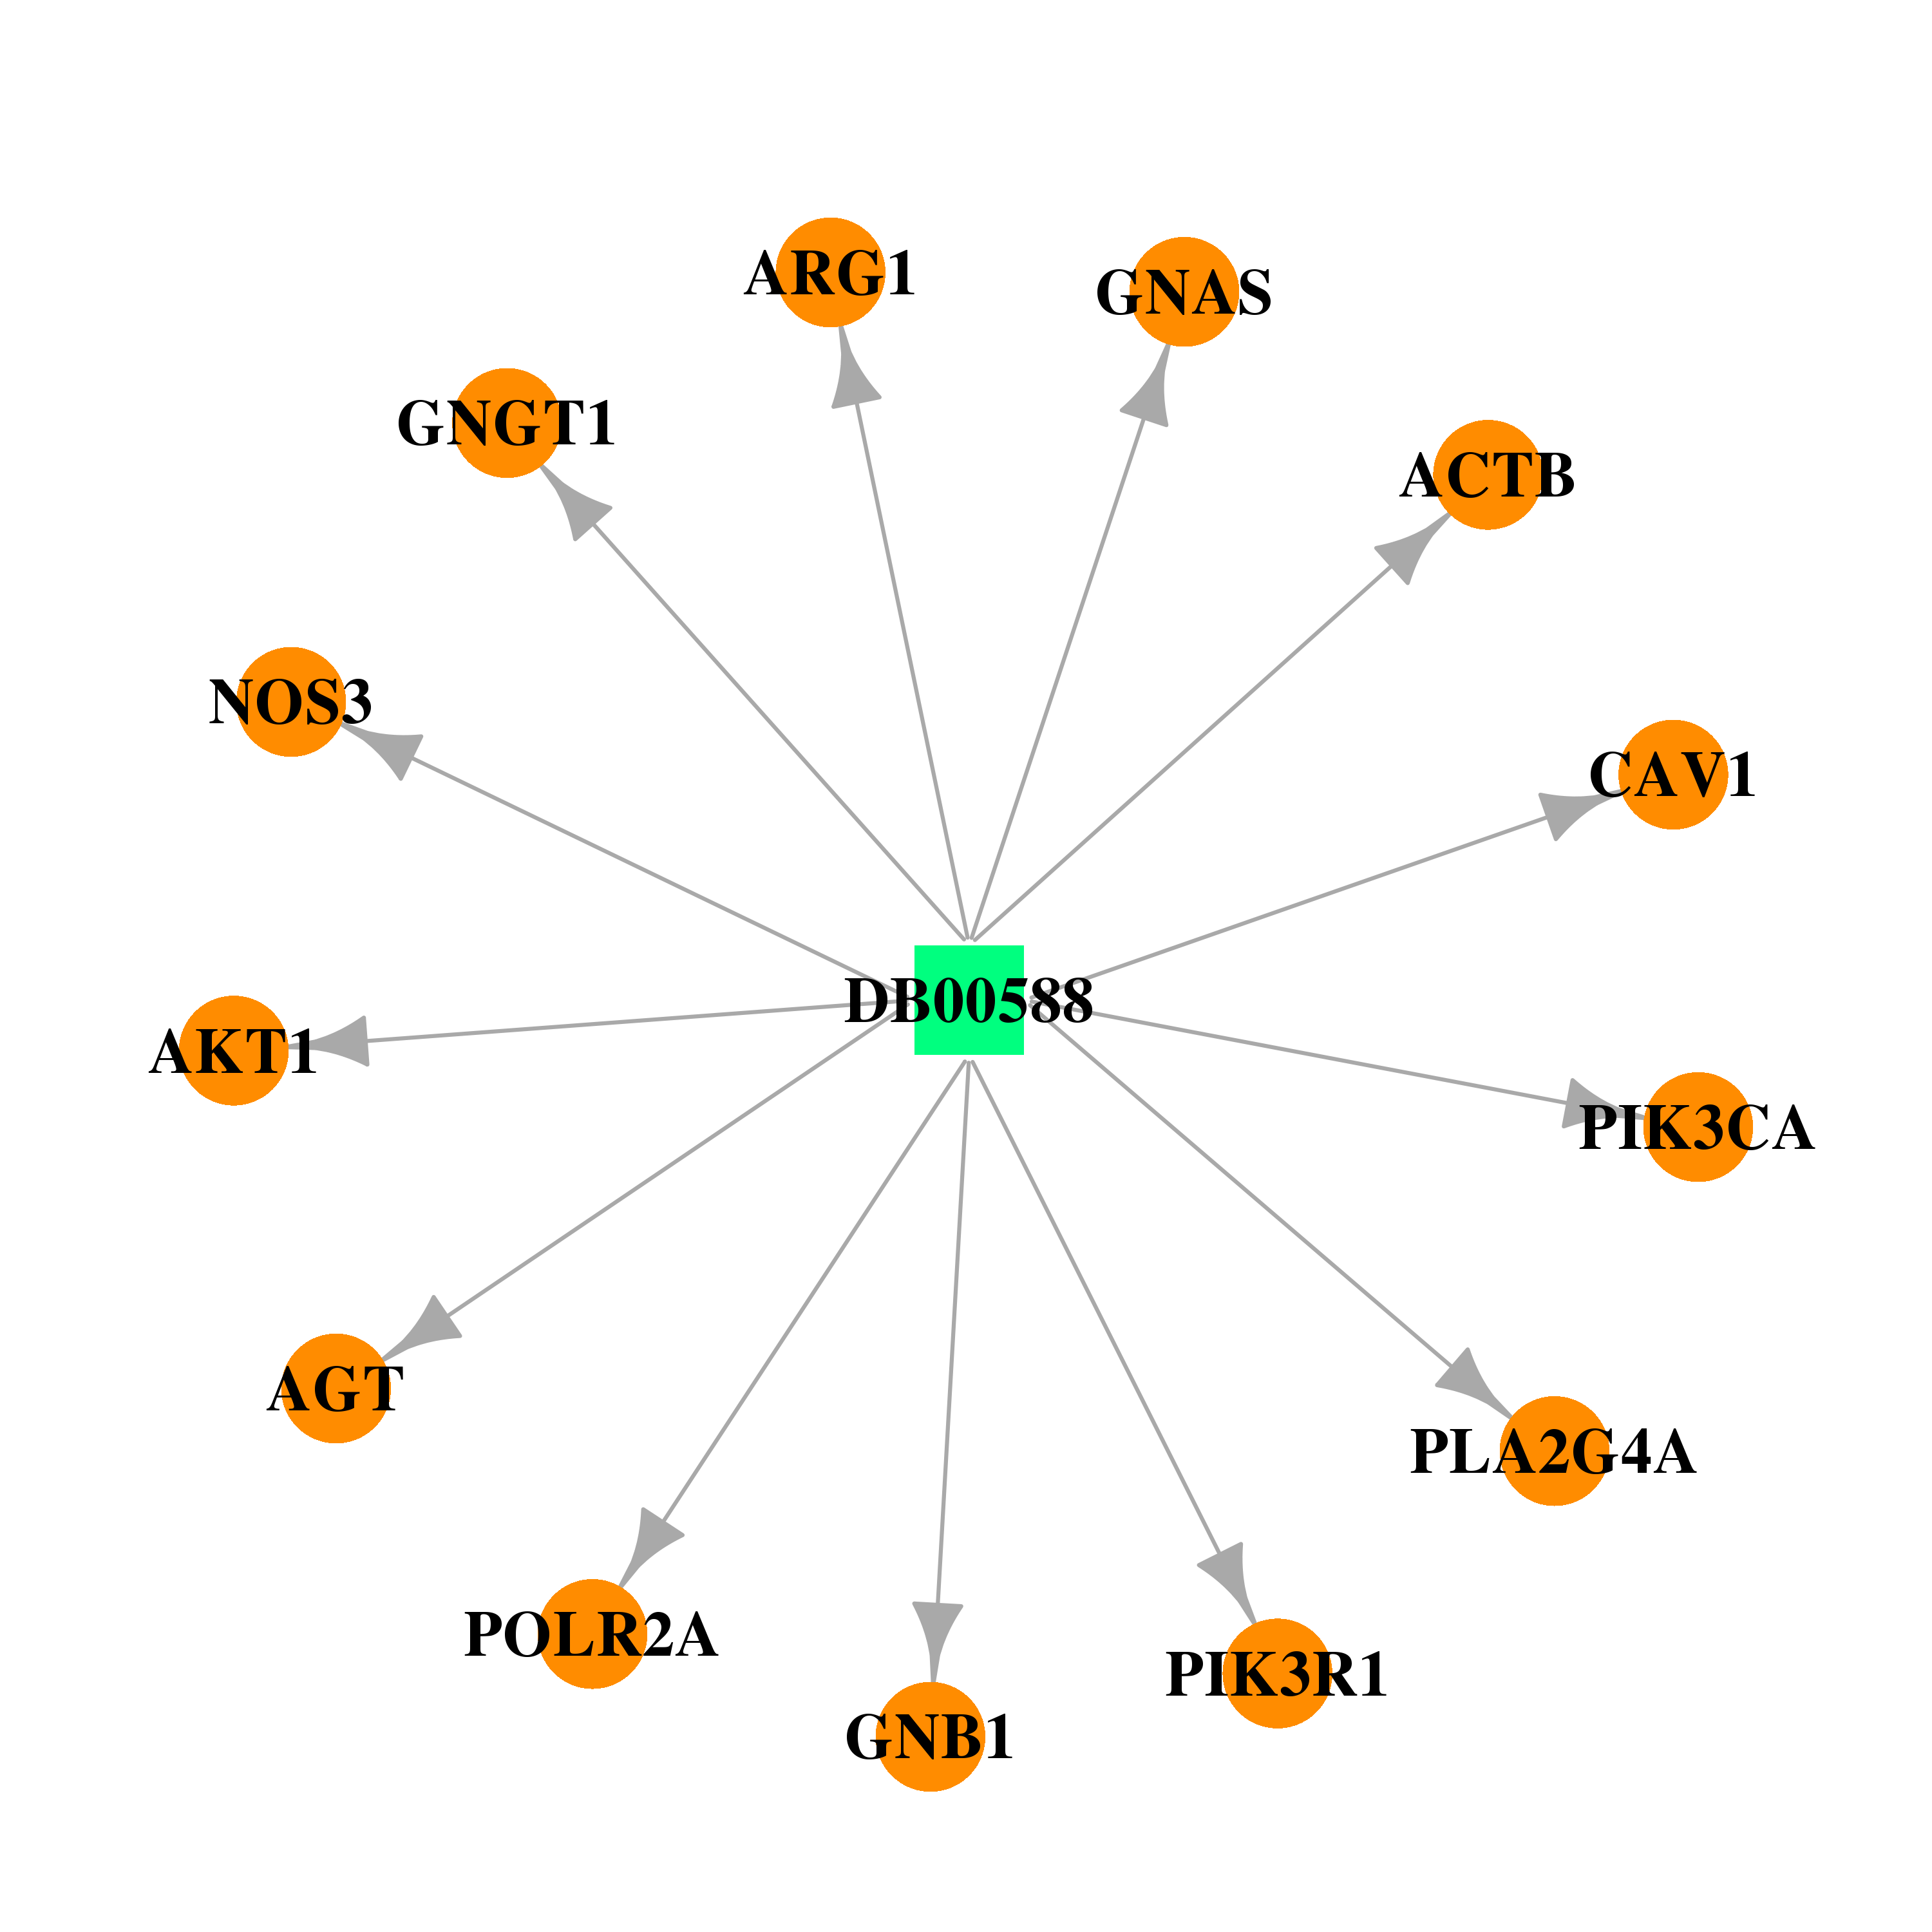 | 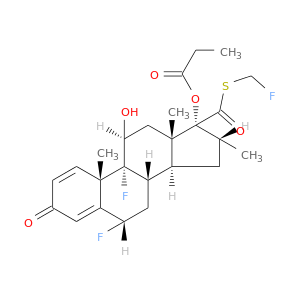 |
| DB00741 | guanine nucleotide binding protein (G protein), beta polypeptide 1 | approved | Hydrocortisone |  |  |
| DB00959 | guanine nucleotide binding protein (G protein), beta polypeptide 1 | approved | Methylprednisolone |  |  |
| DB00764 | guanine nucleotide binding protein (G protein), beta polypeptide 1 | approved | Mometasone | 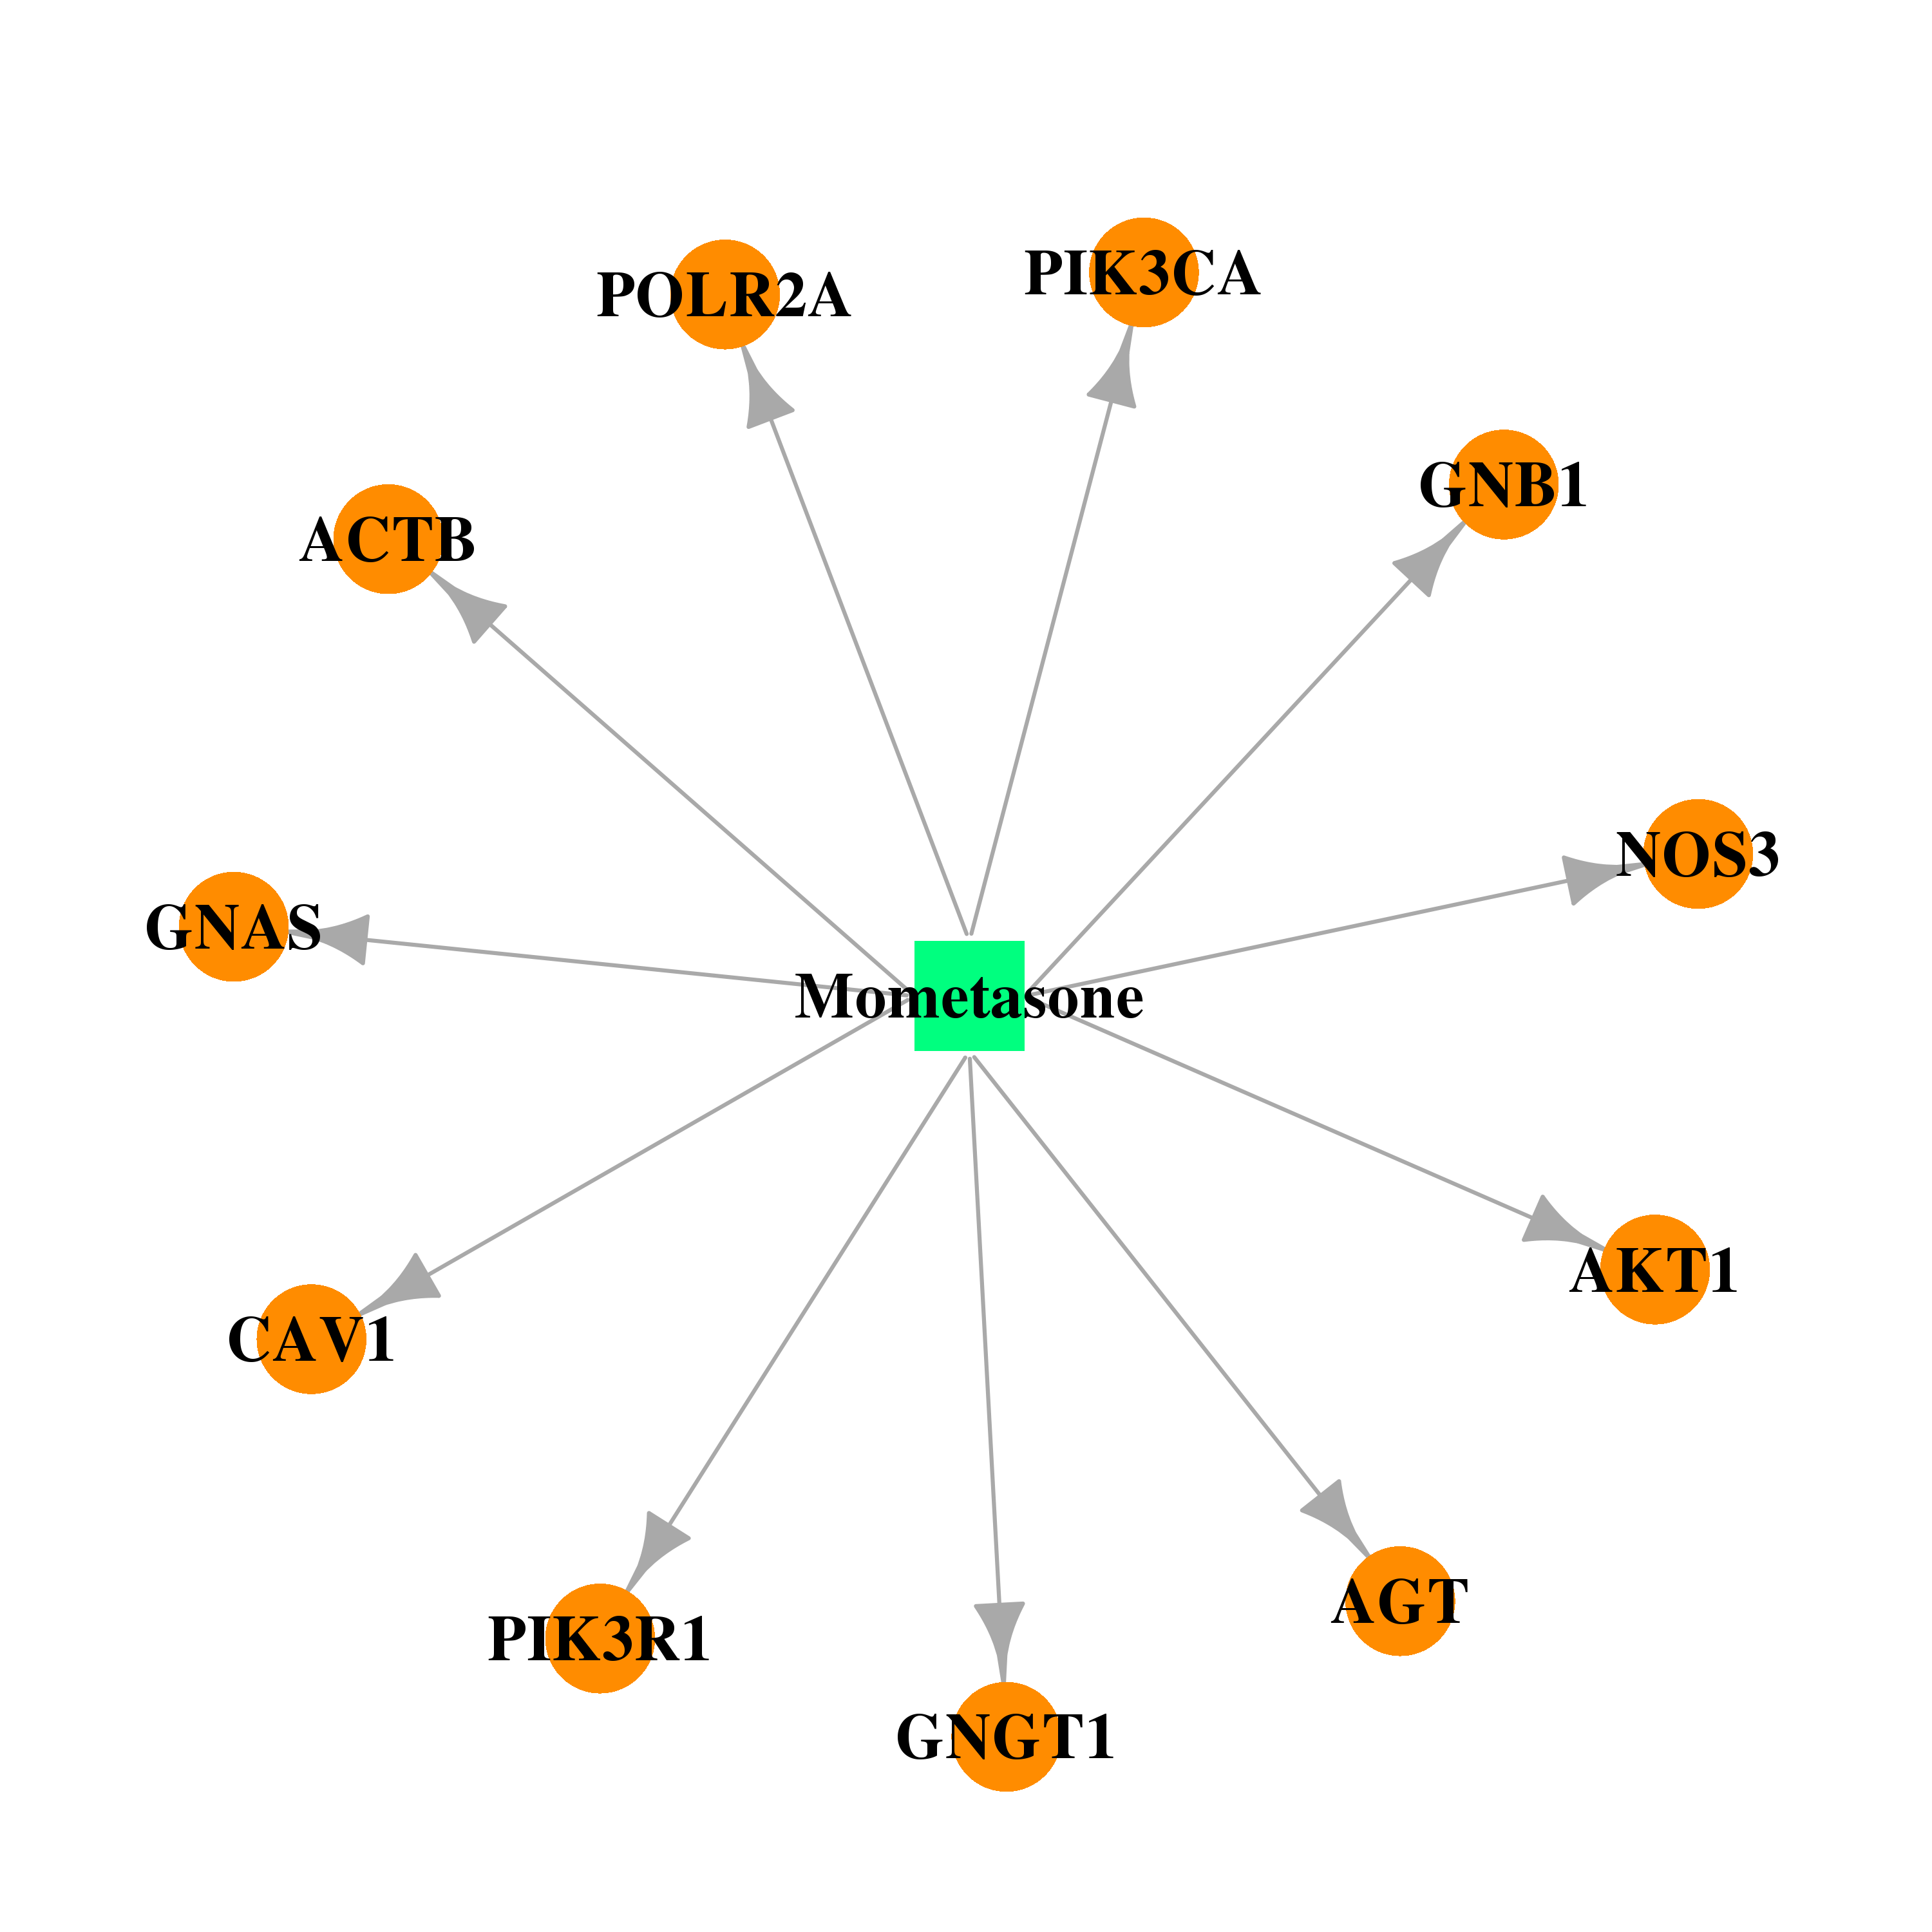 |  |
| DB01384 | guanine nucleotide binding protein (G protein), beta polypeptide 1 | approved | Paramethasone | 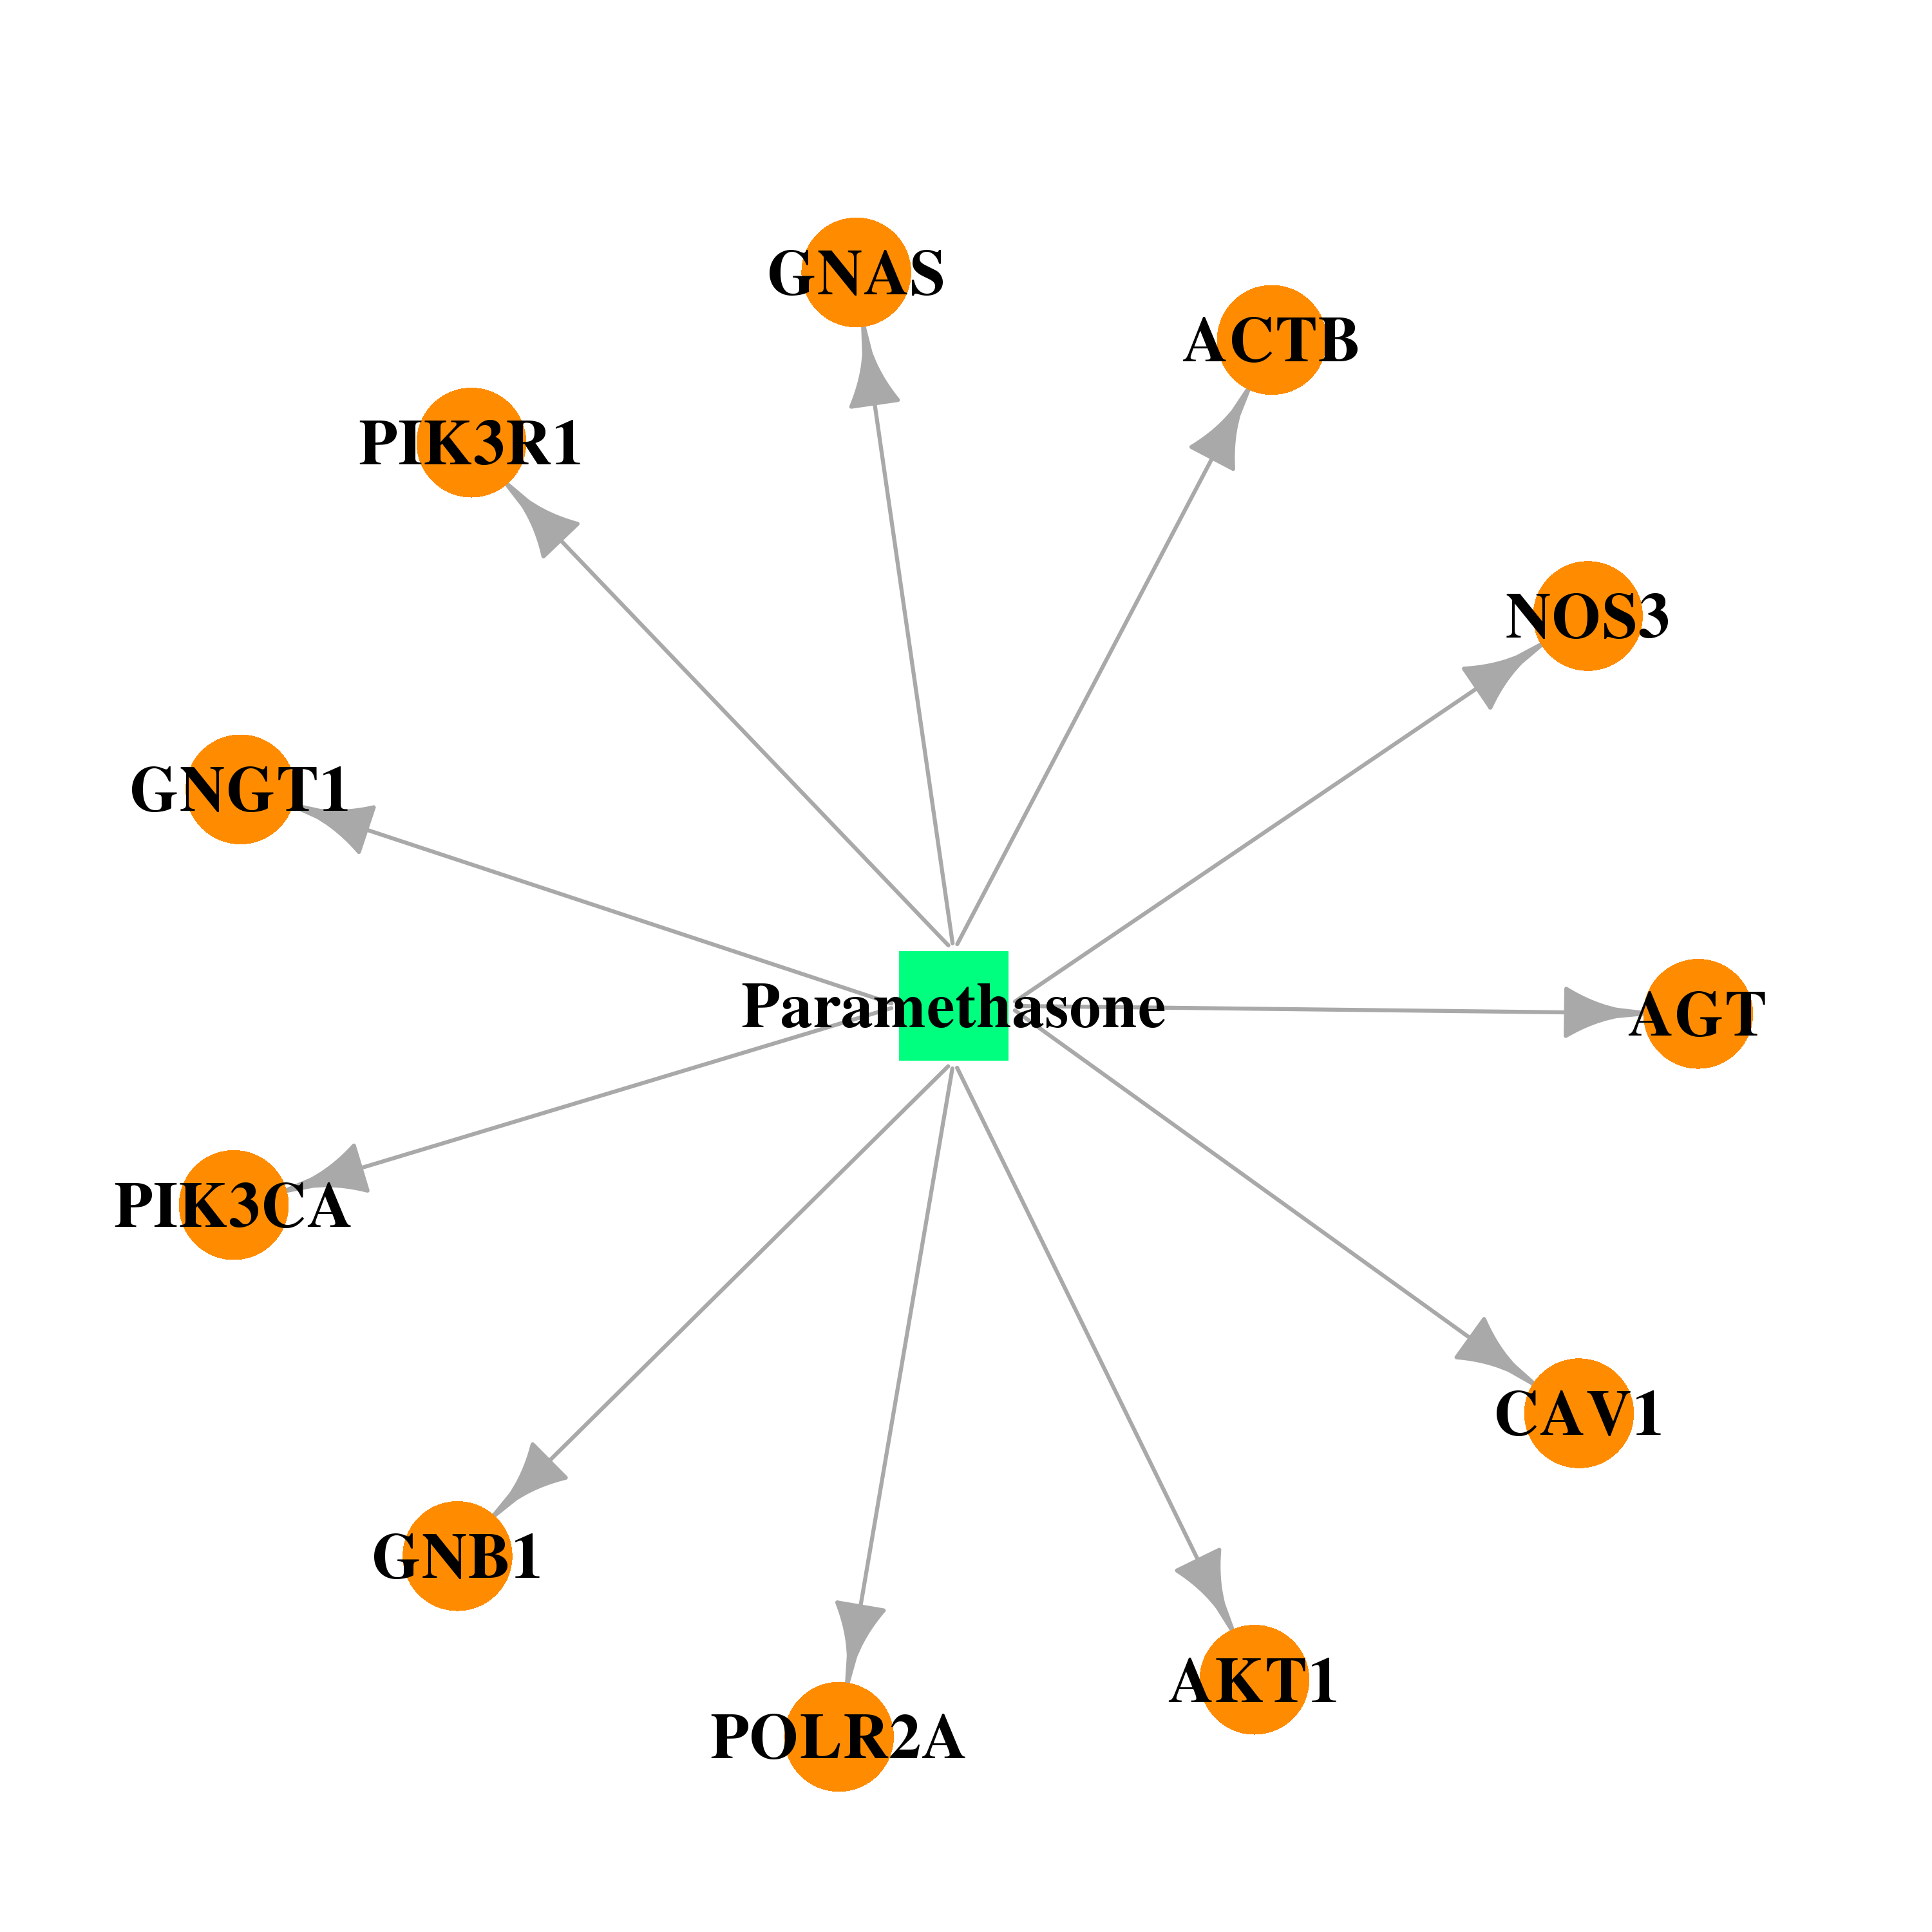 |  |
| DB00860 | guanine nucleotide binding protein (G protein), beta polypeptide 1 | approved | Prednisolone | 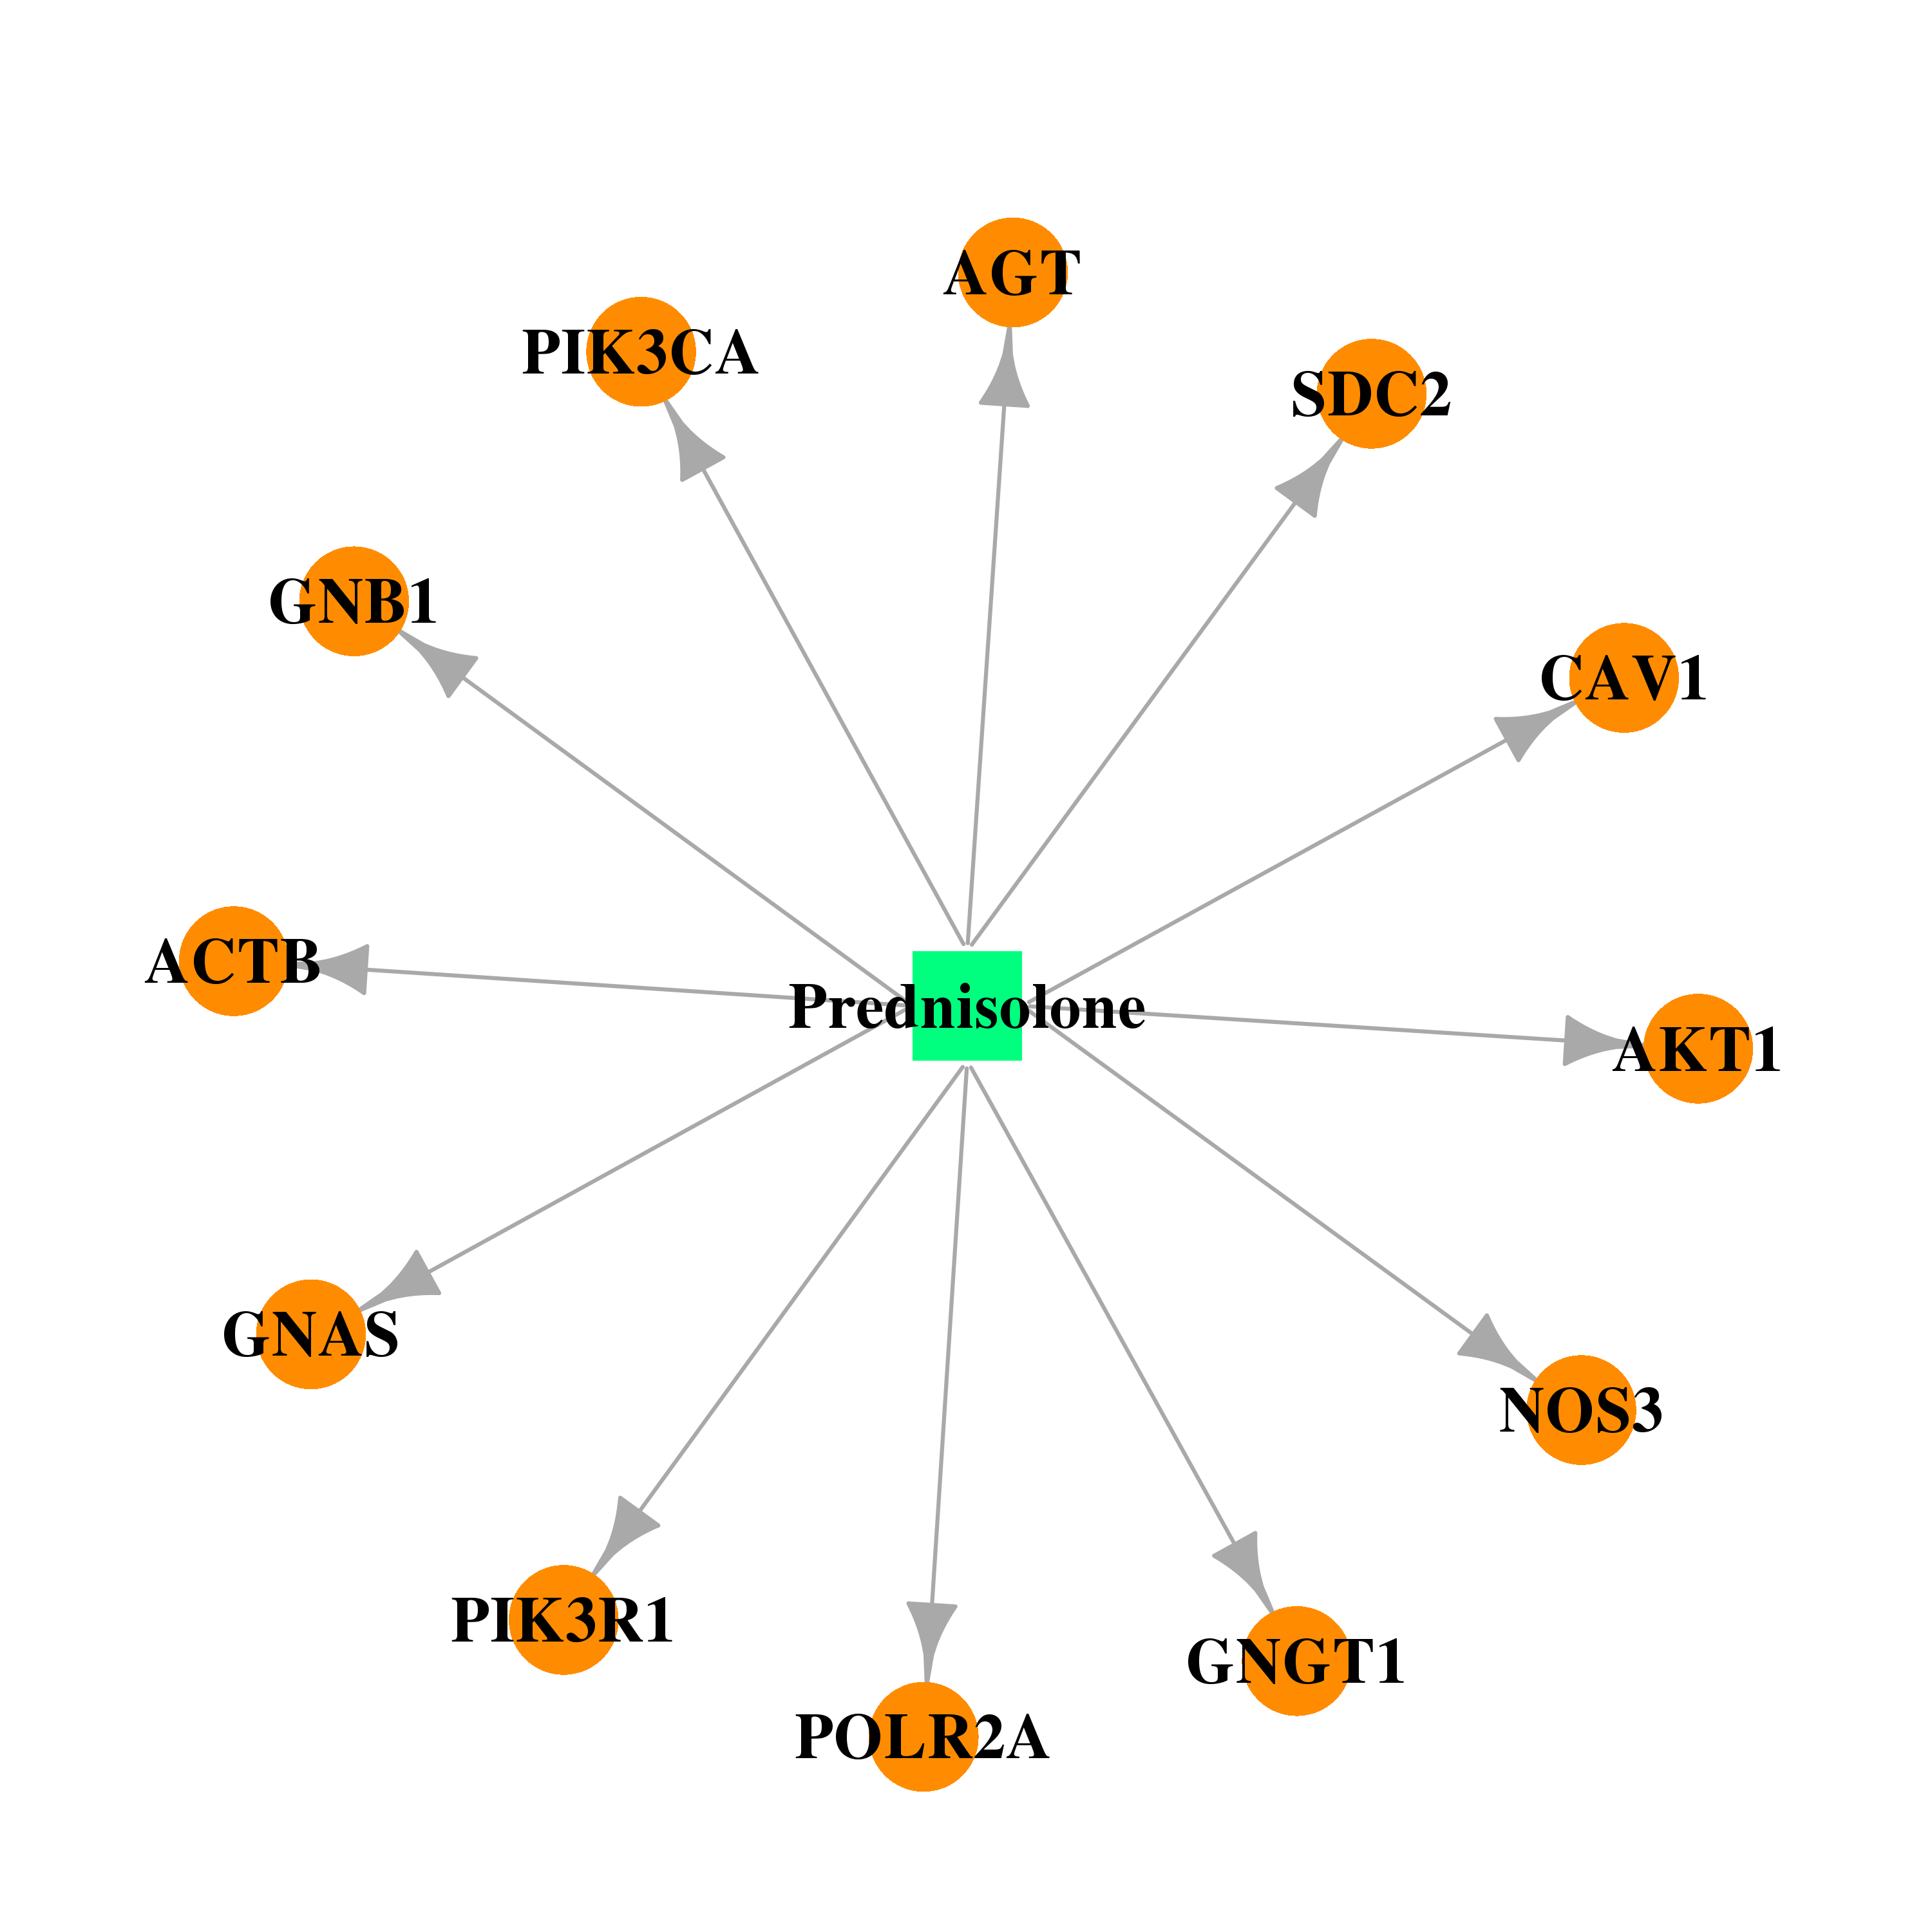 |  |
| DB00635 | guanine nucleotide binding protein (G protein), beta polypeptide 1 | approved | Prednisone | 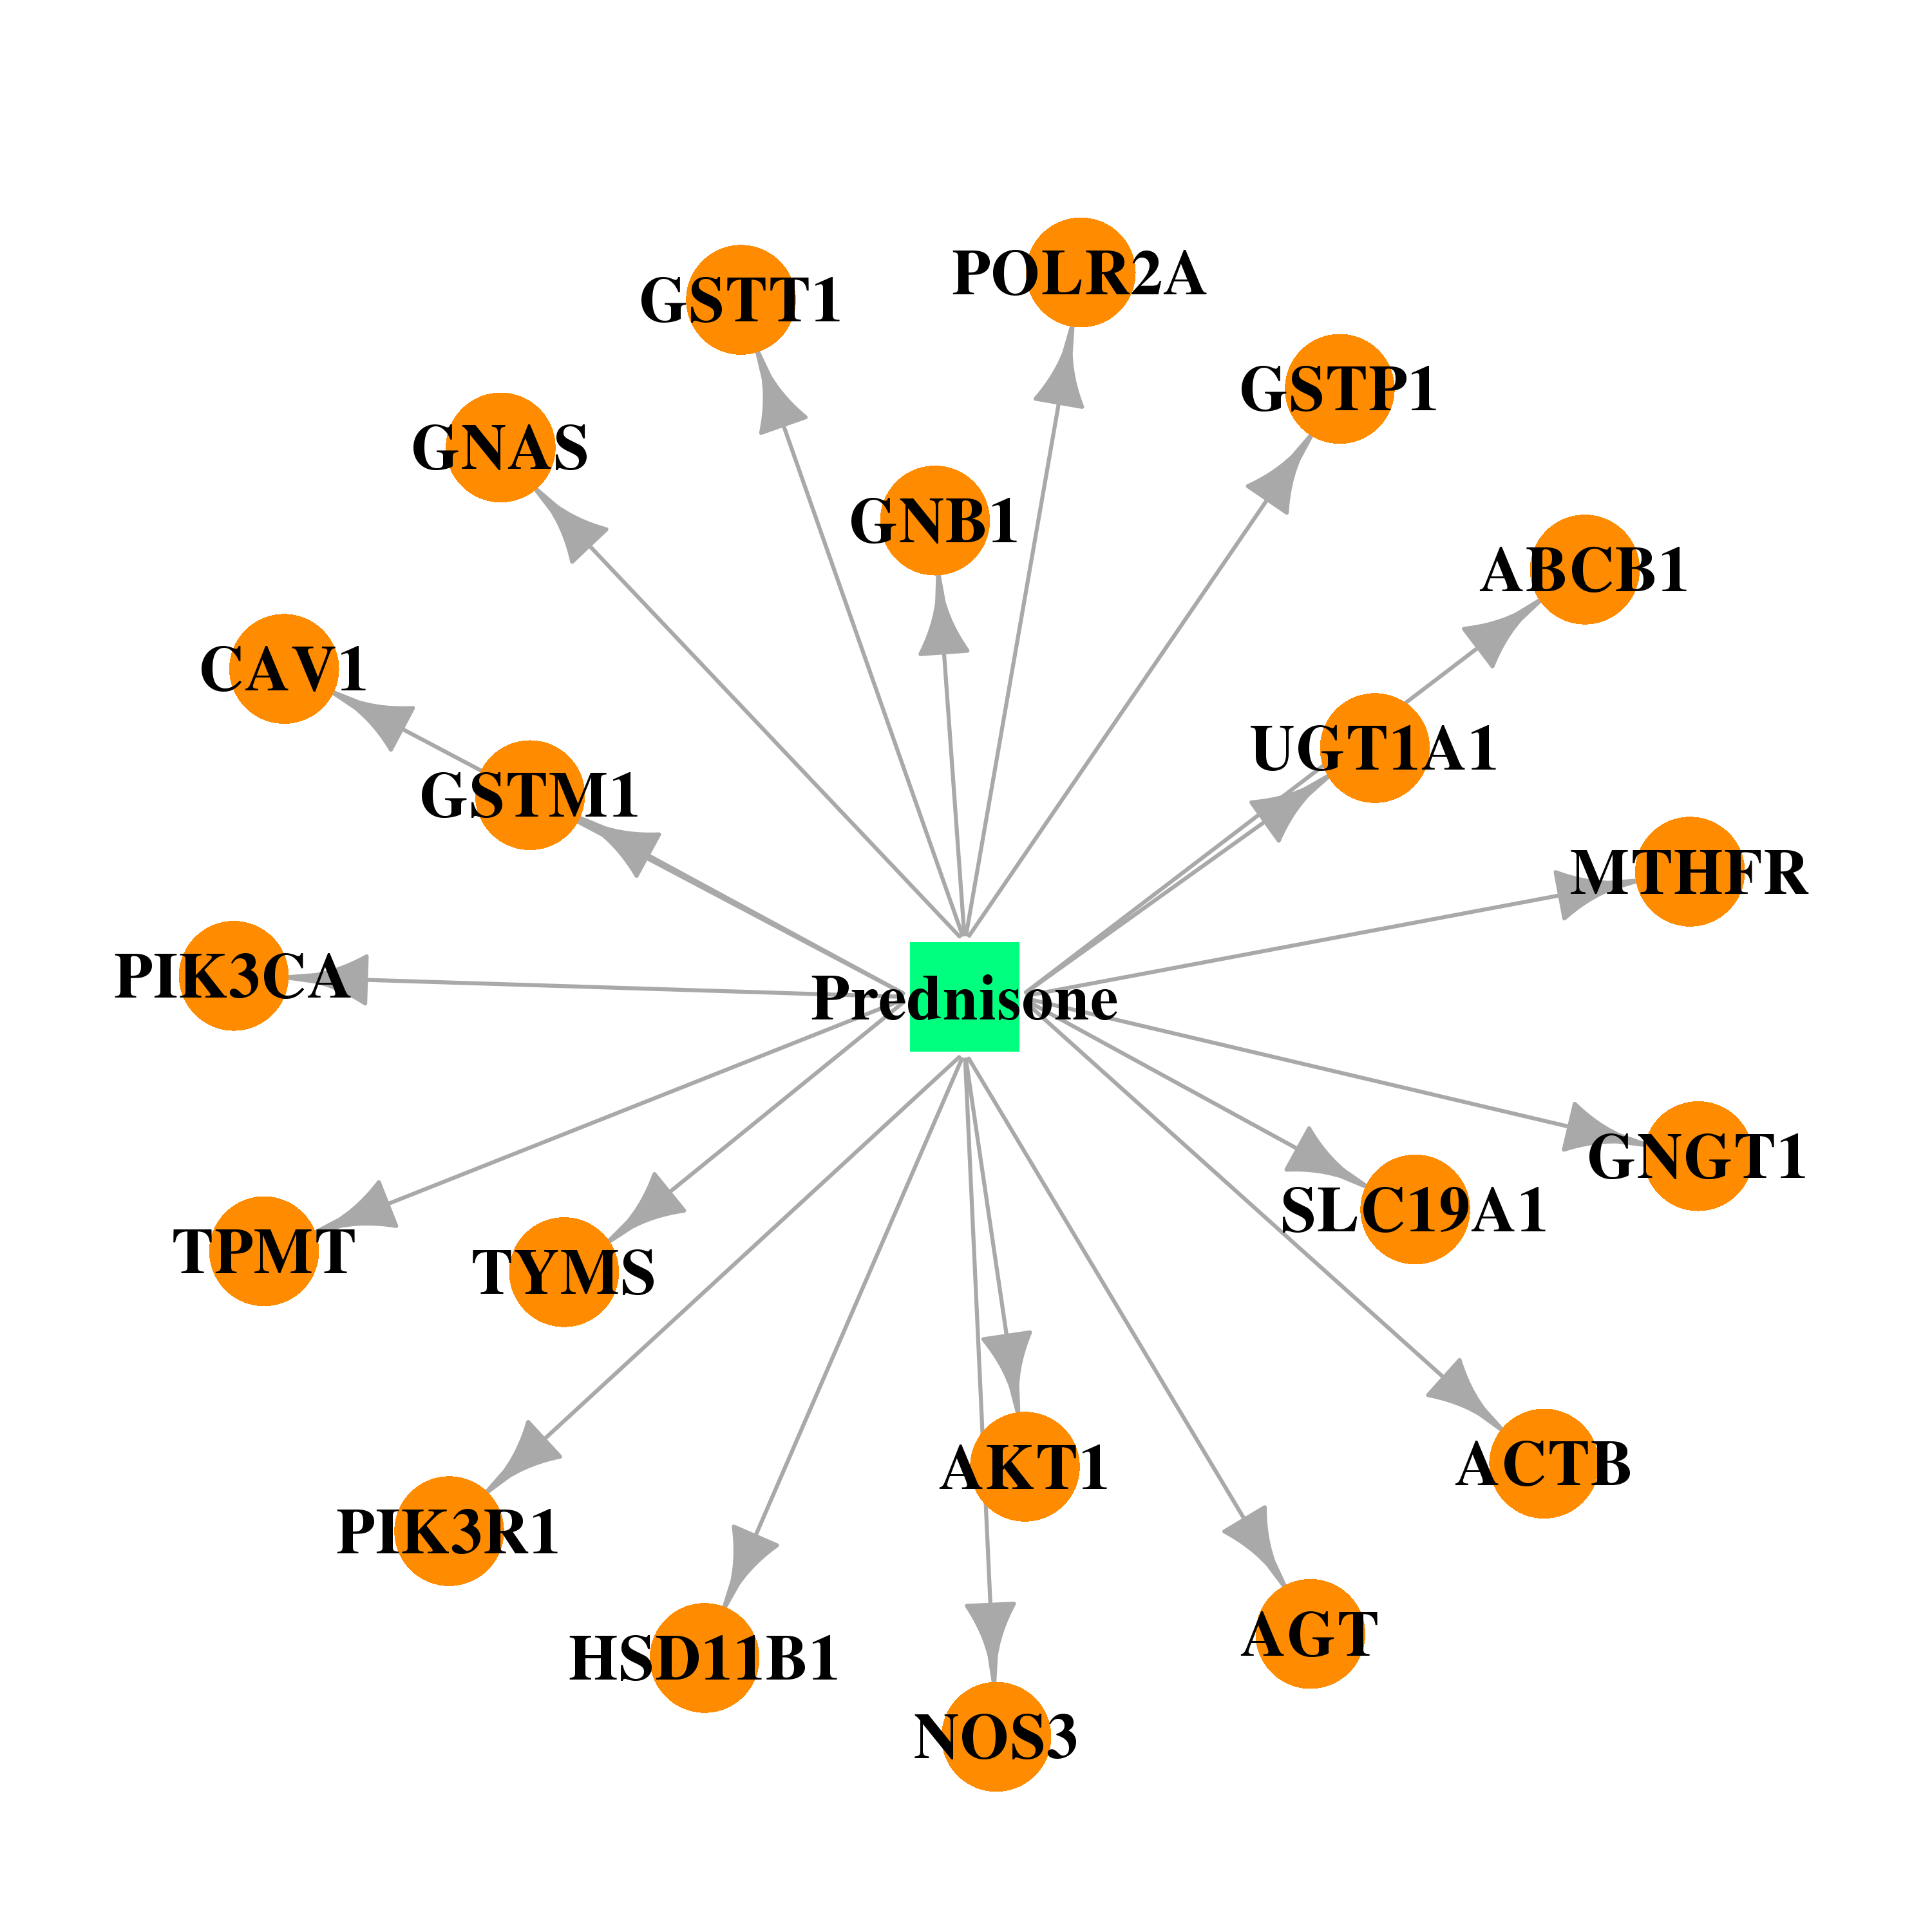 |  |
| DB00896 | guanine nucleotide binding protein (G protein), beta polypeptide 1 | approved | Rimexolone |  |  |
| DB00620 | guanine nucleotide binding protein (G protein), beta polypeptide 1 | approved | Triamcinolone |  |  |
| DB00125 | guanine nucleotide binding protein (G protein), beta polypeptide 1 | approved; nutraceutical | L-Arginine |  |  |
| DB00155 | guanine nucleotide binding protein (G protein), beta polypeptide 1 | approved; nutraceutical | L-Citrulline | 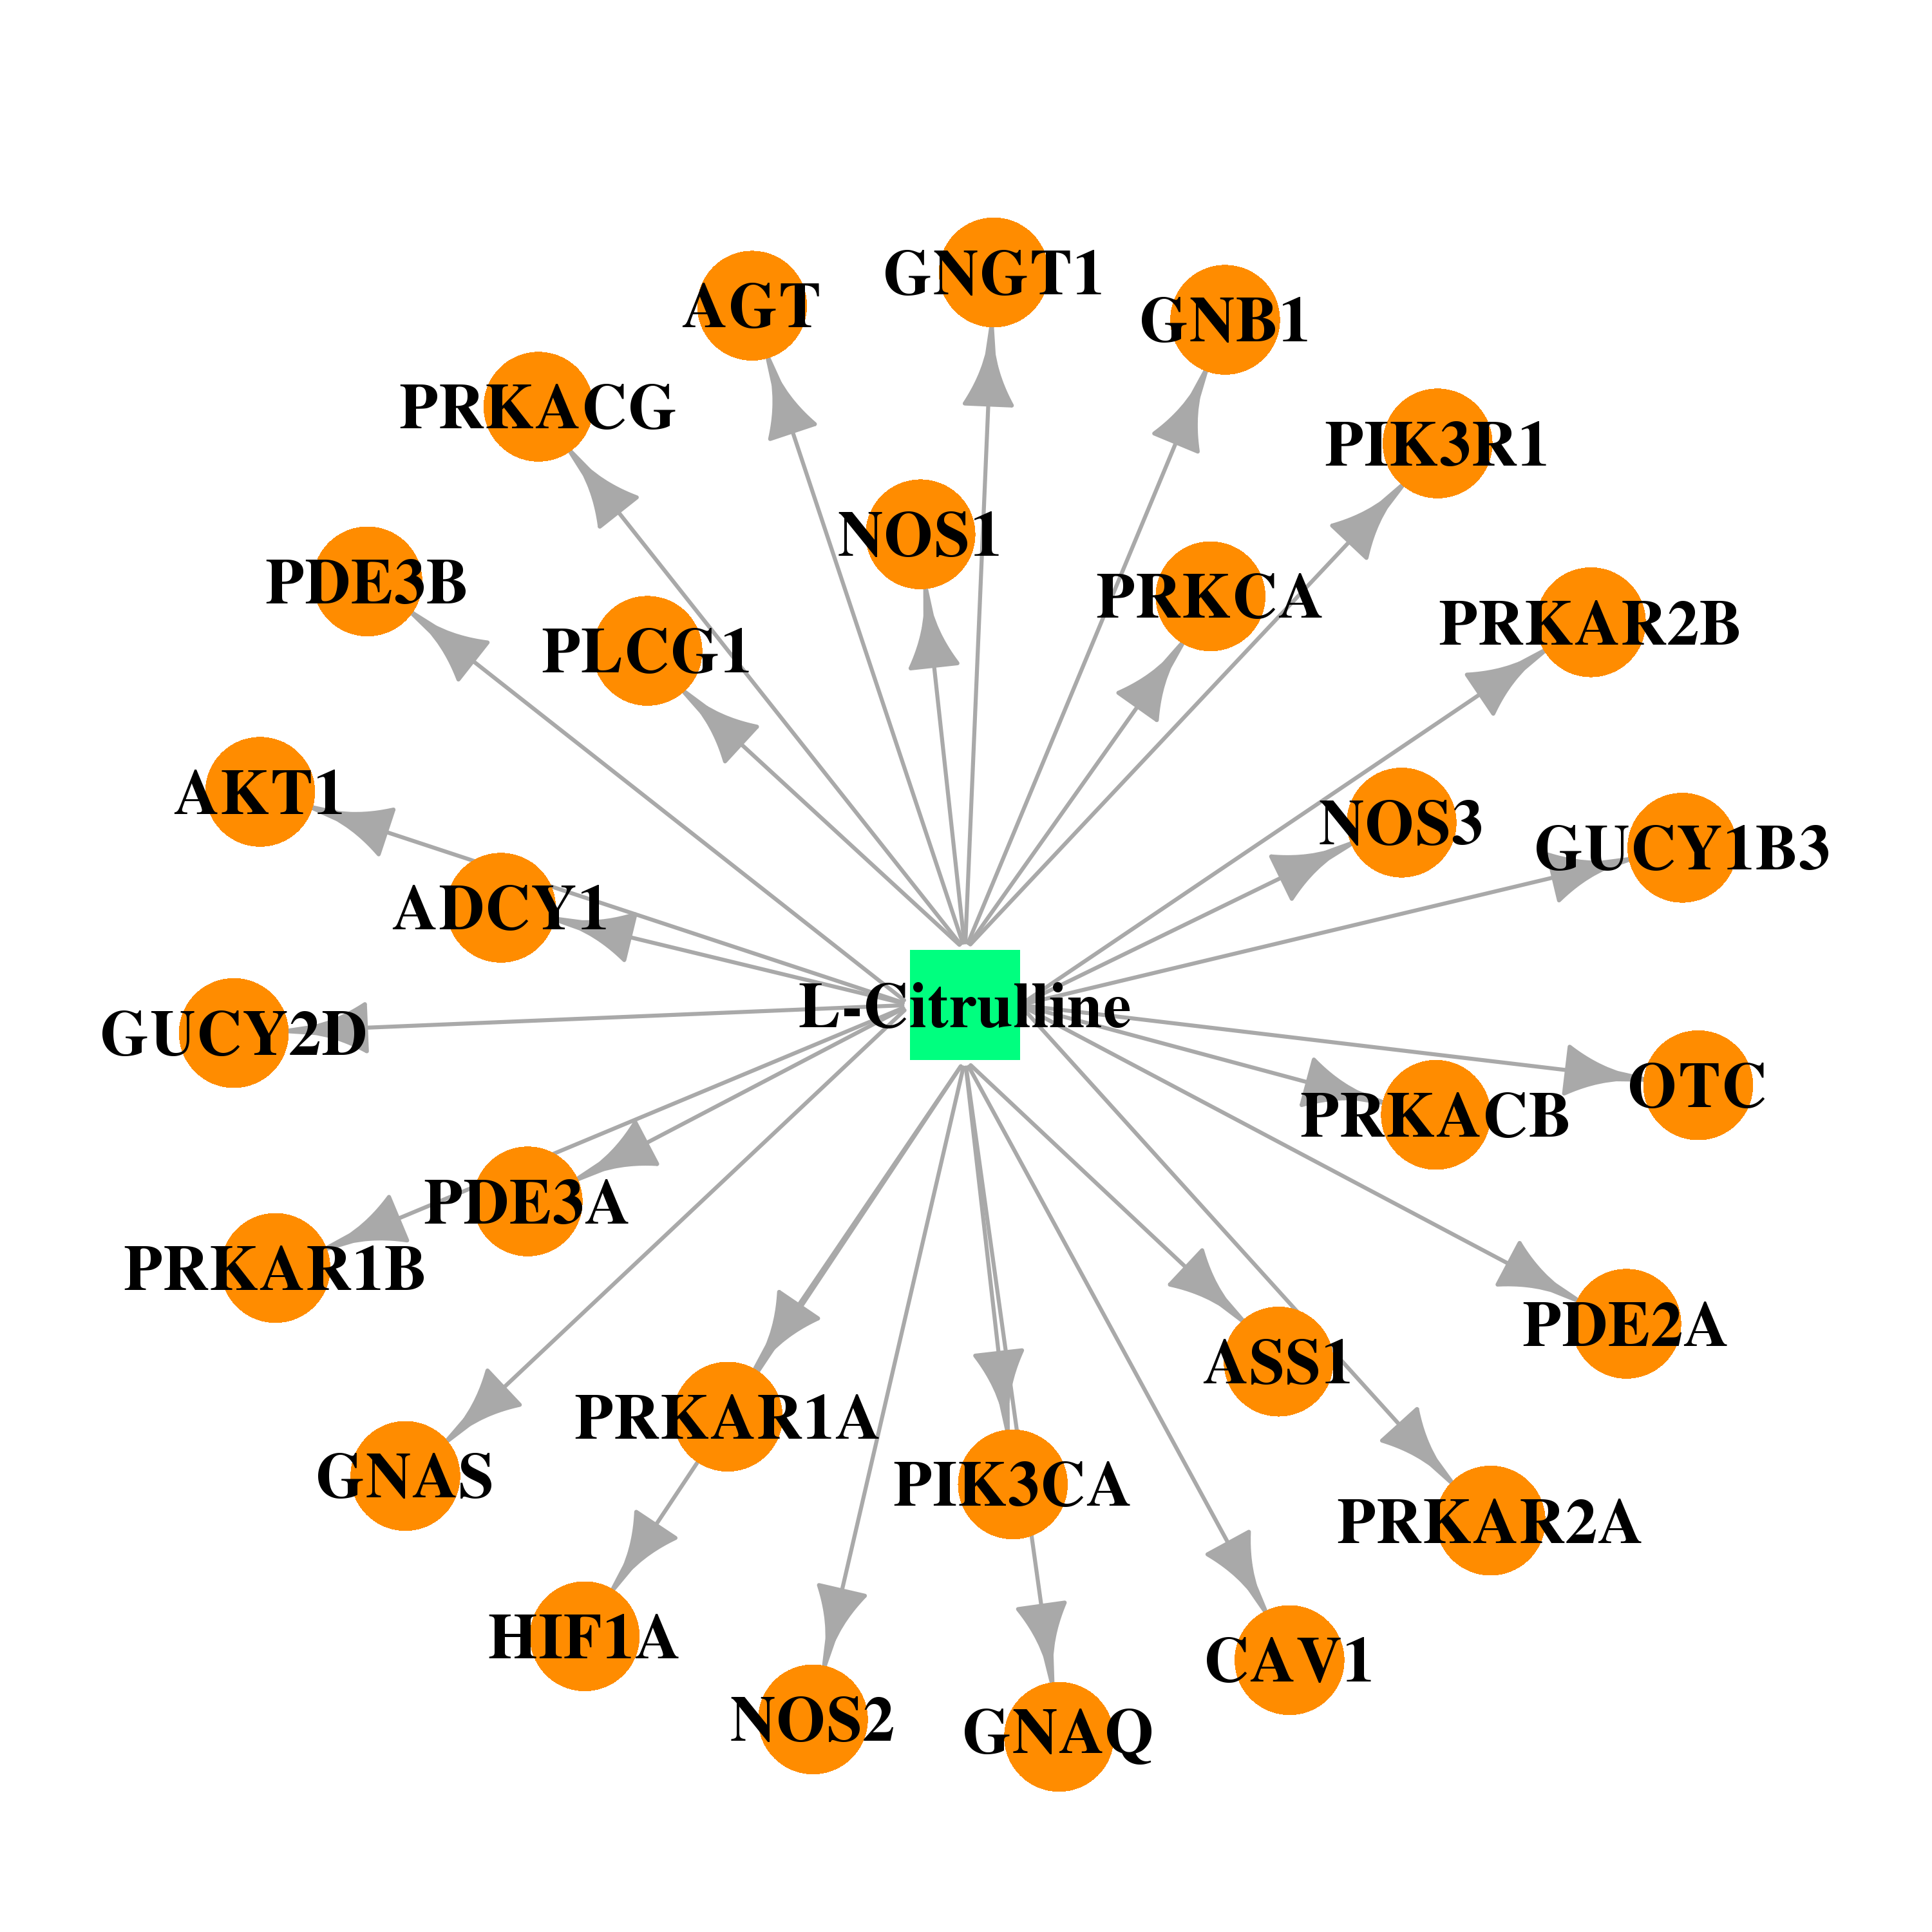 | 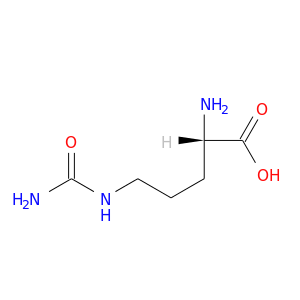 |
| DB00435 | guanine nucleotide binding protein (G protein), beta polypeptide 1 | approved | Nitric Oxide | 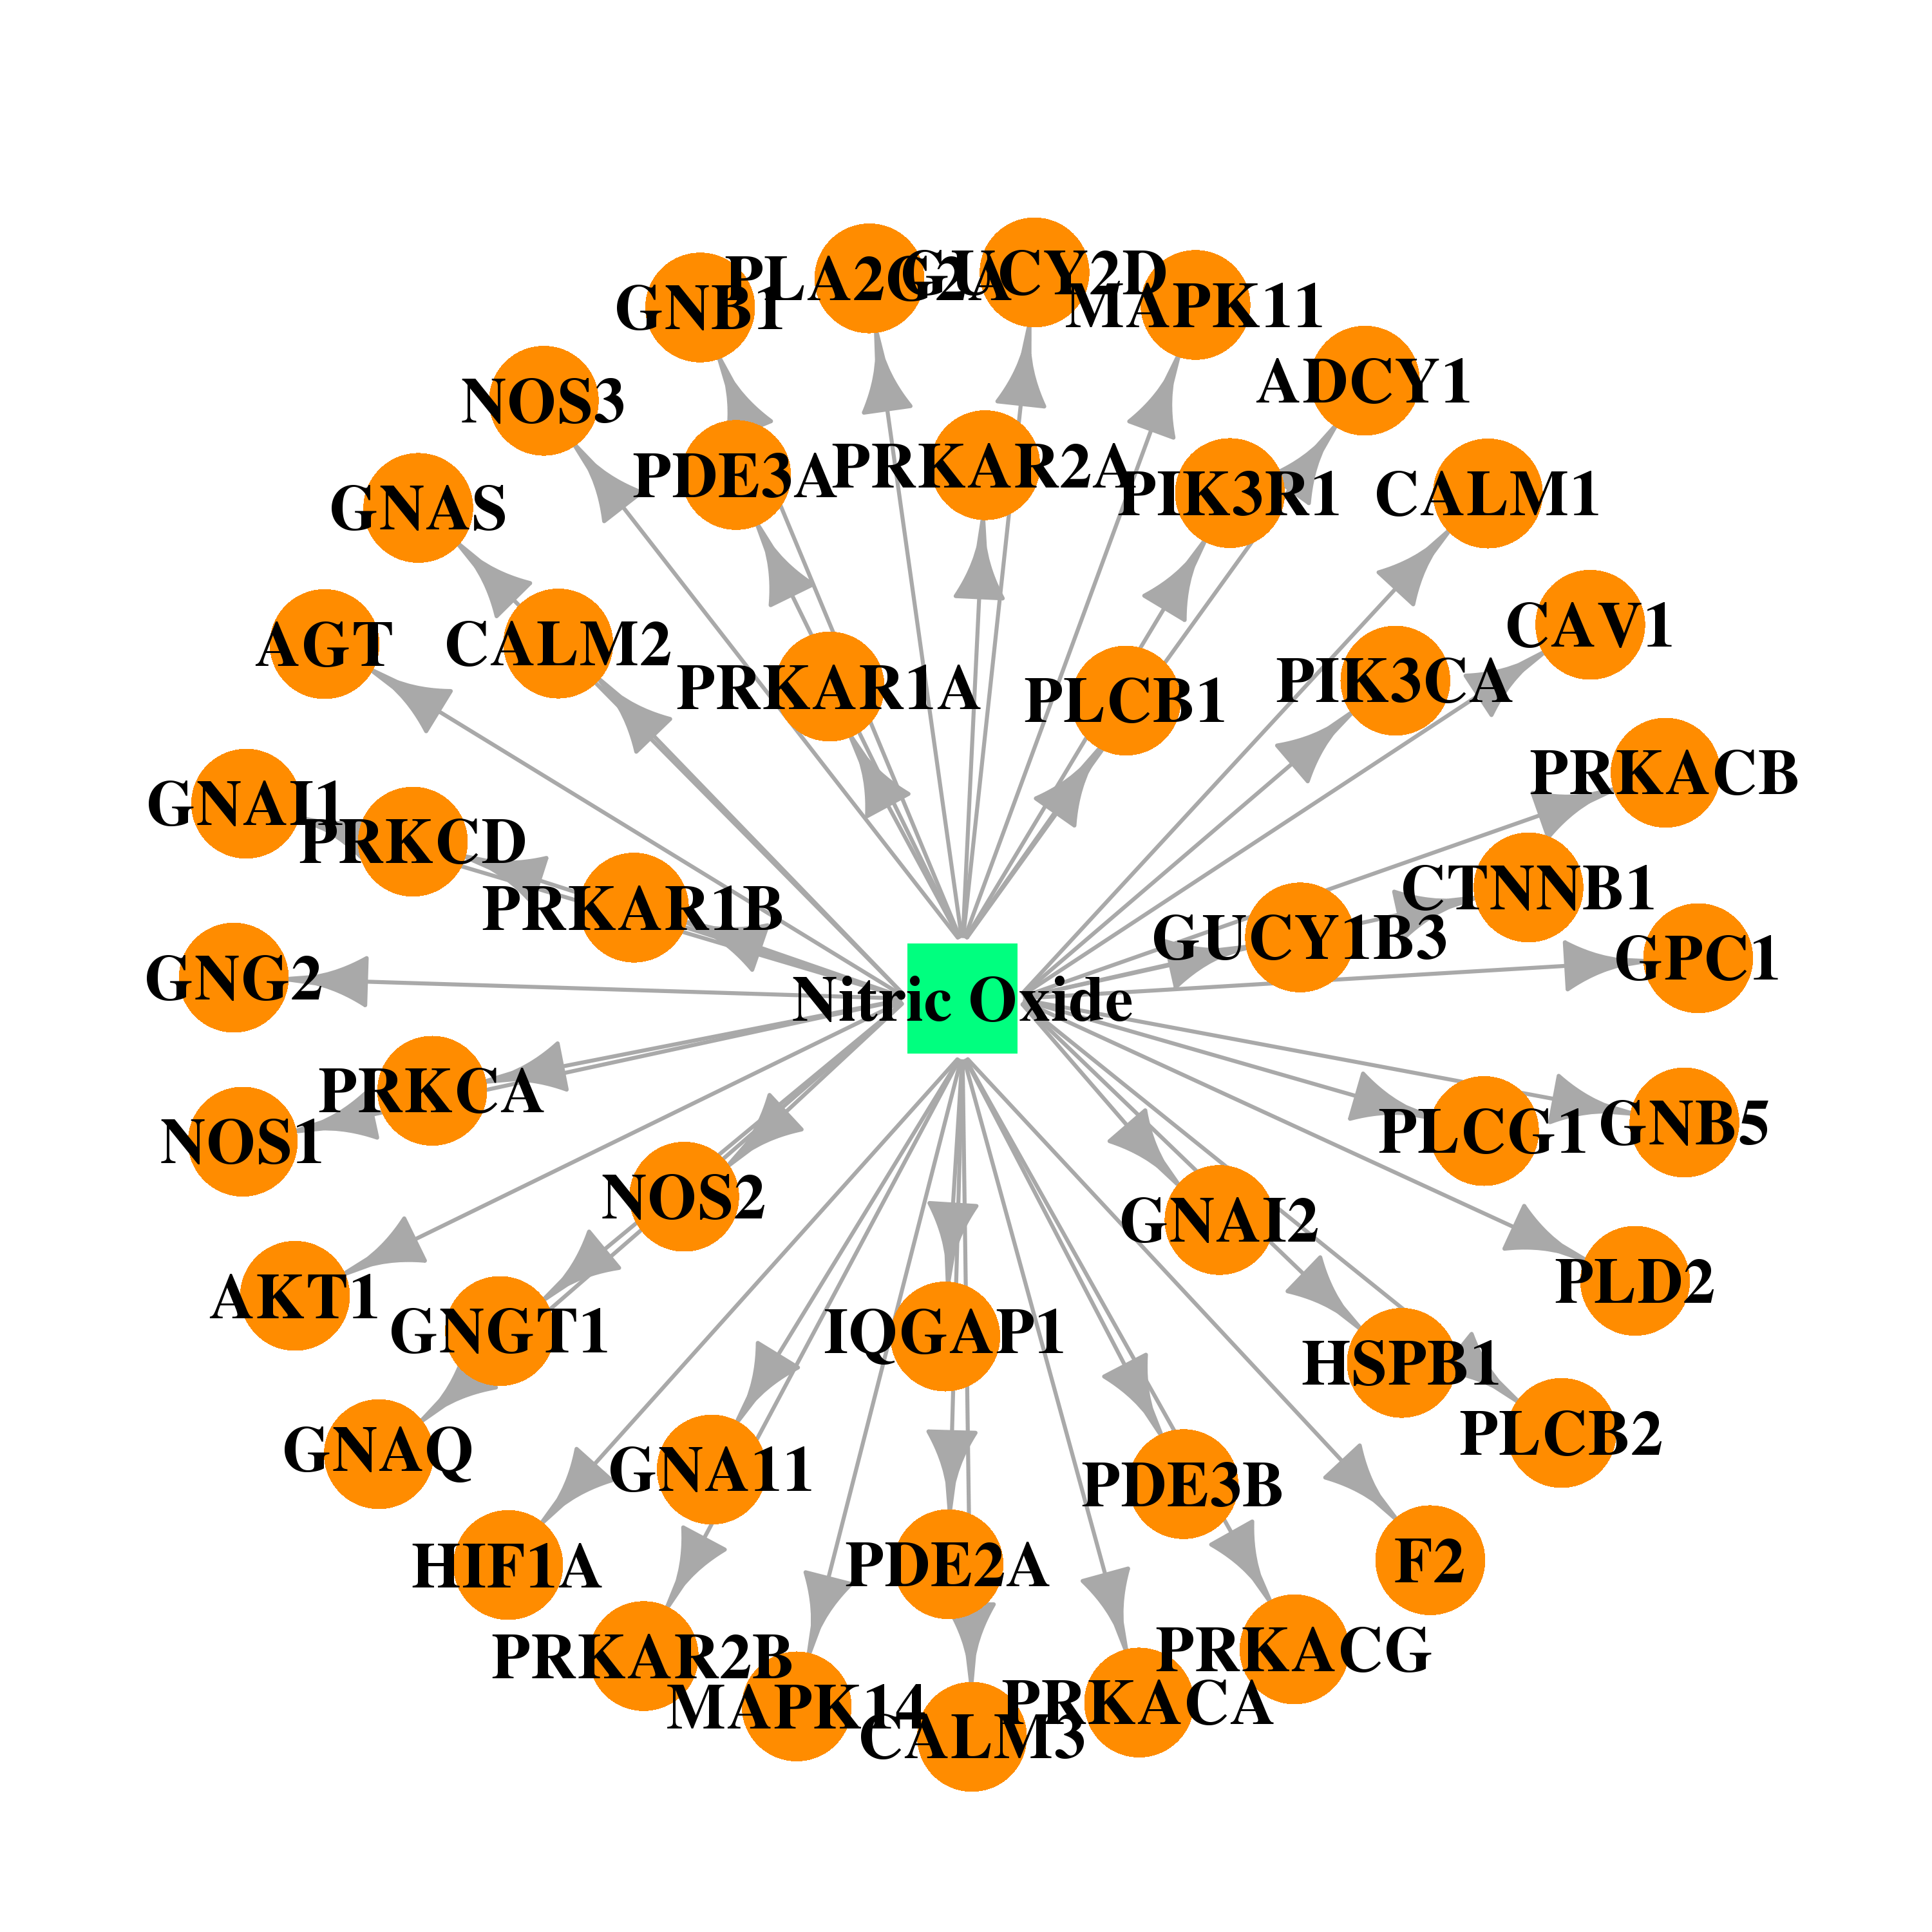 |  |
| DB00988 | guanine nucleotide binding protein (G protein), beta polypeptide 1 | approved | Dopamine | 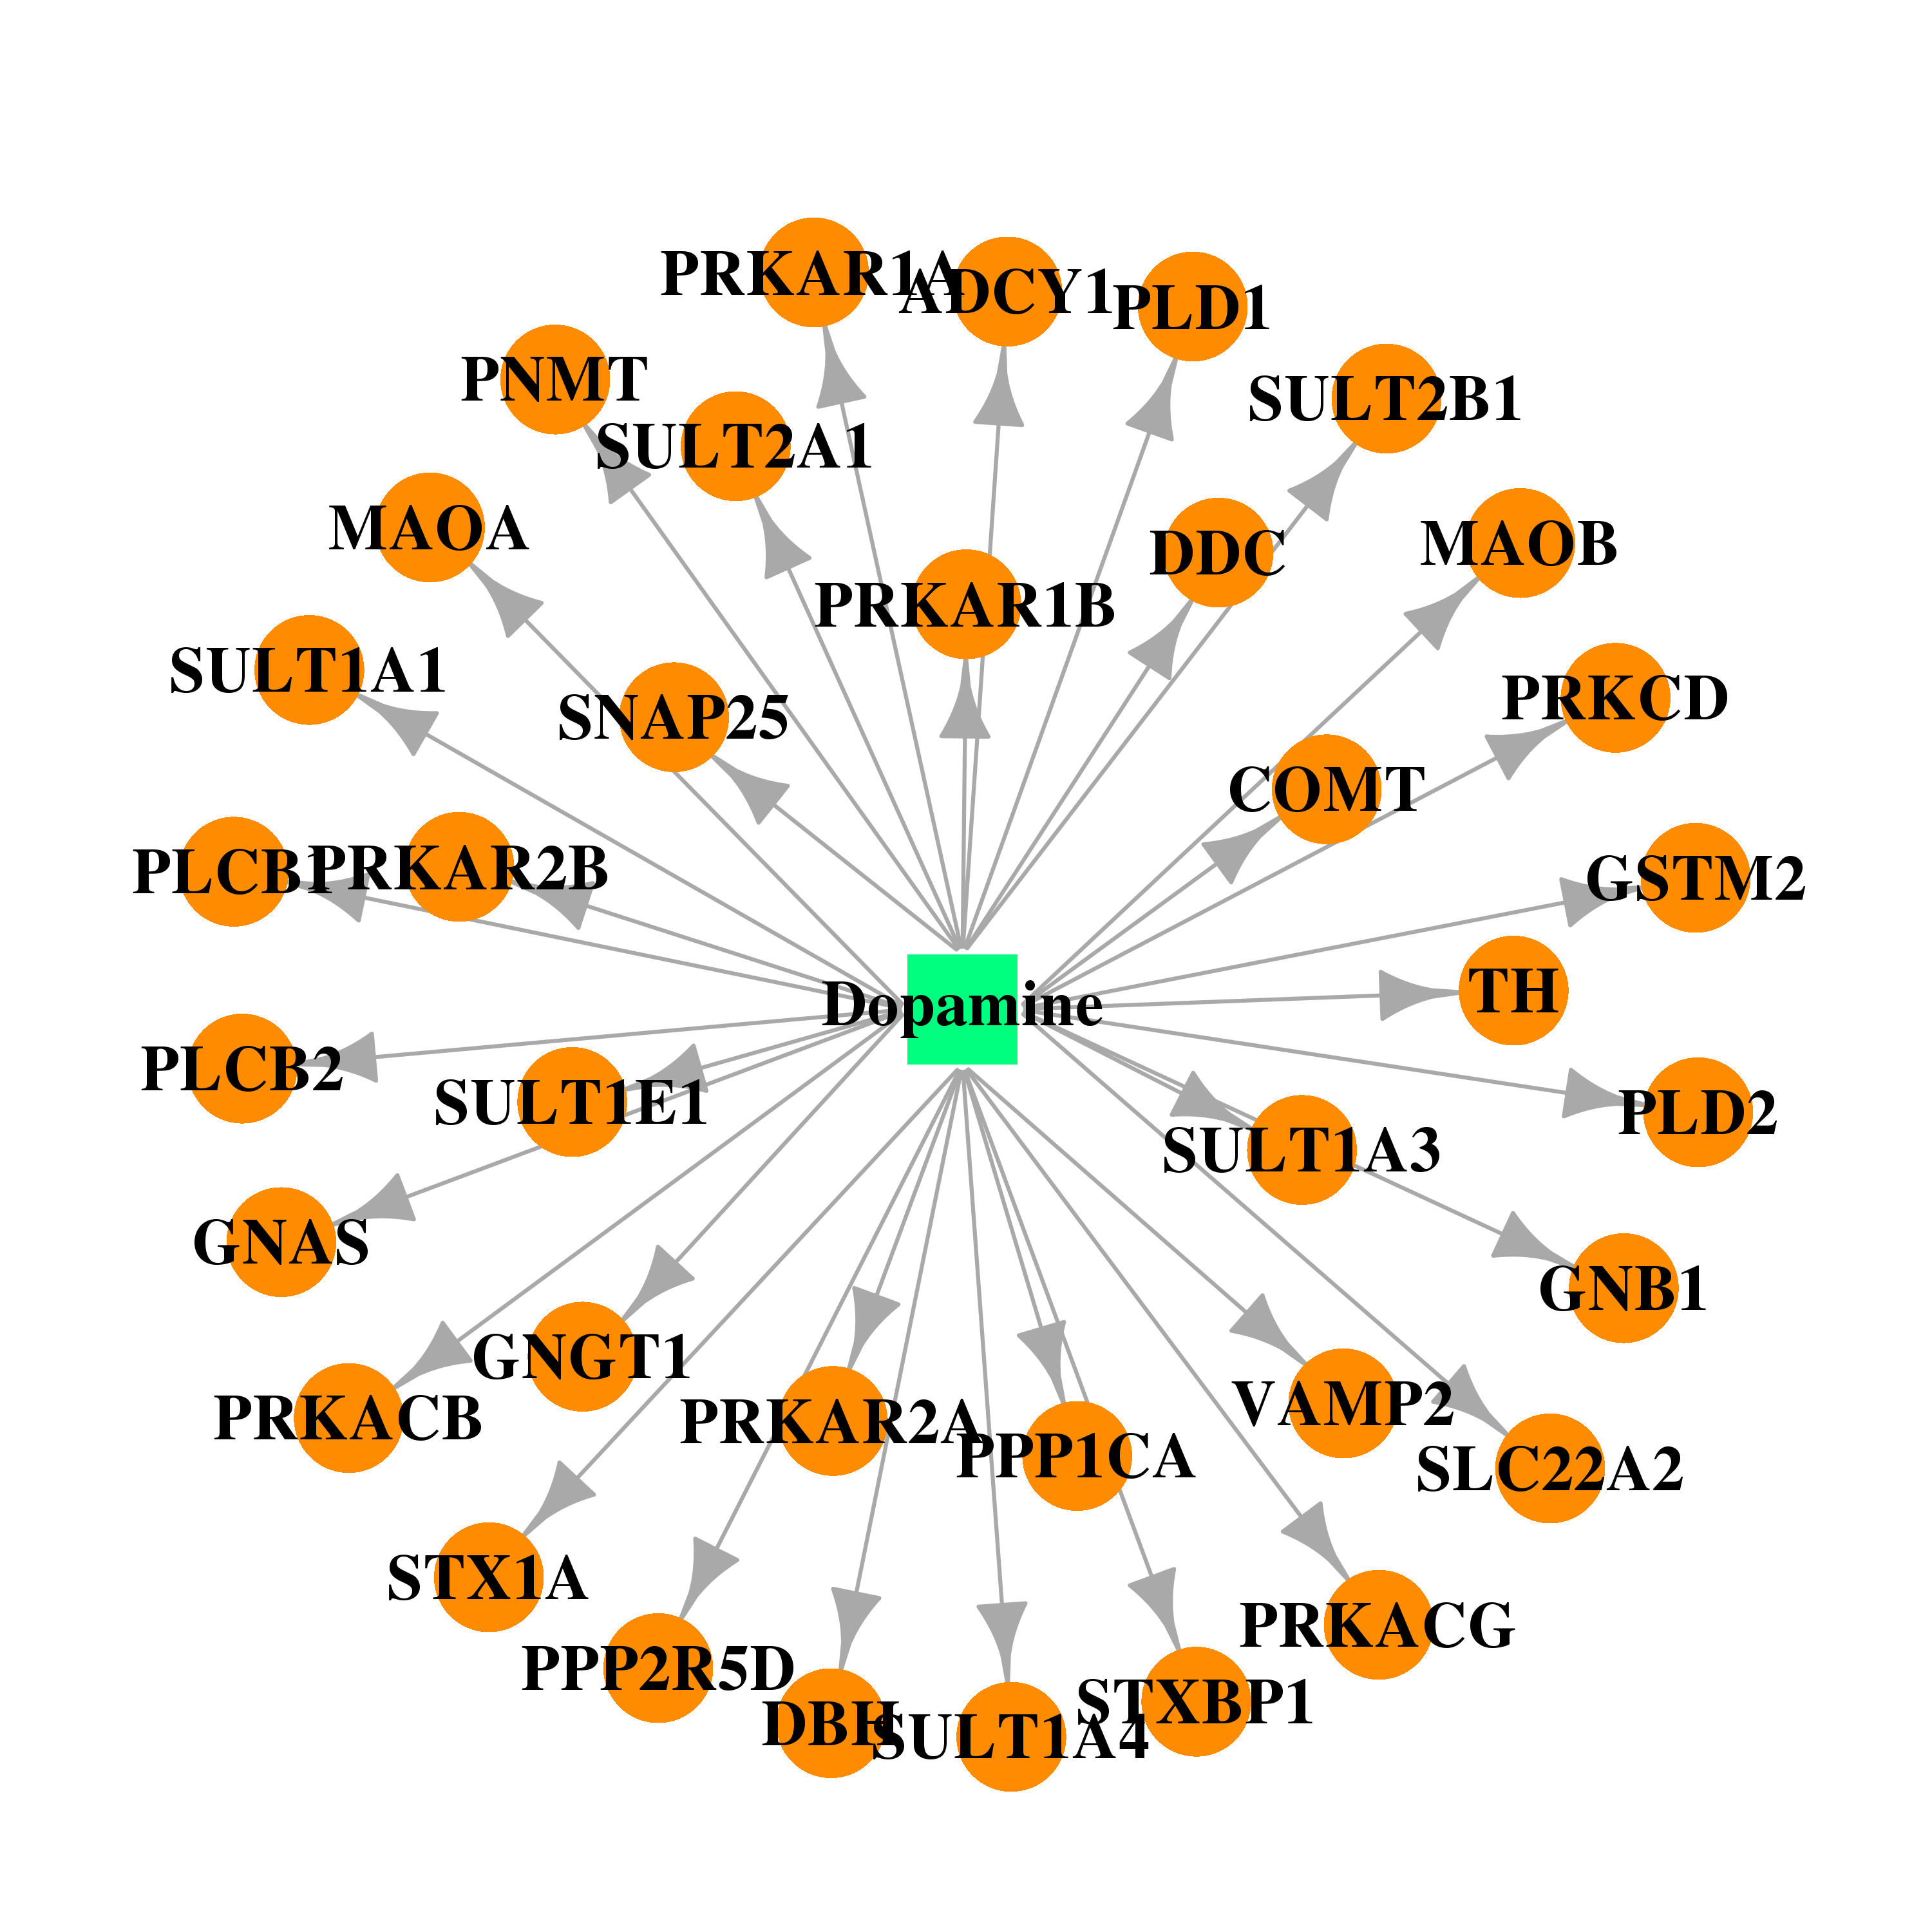 |  |
| DB00171 | guanine nucleotide binding protein (G protein), beta polypeptide 1 | approved; nutraceutical | Adenosine triphosphate |  |  |
| DB00131 | guanine nucleotide binding protein (G protein), beta polypeptide 1 | approved; nutraceutical | Adenosine monophosphate | 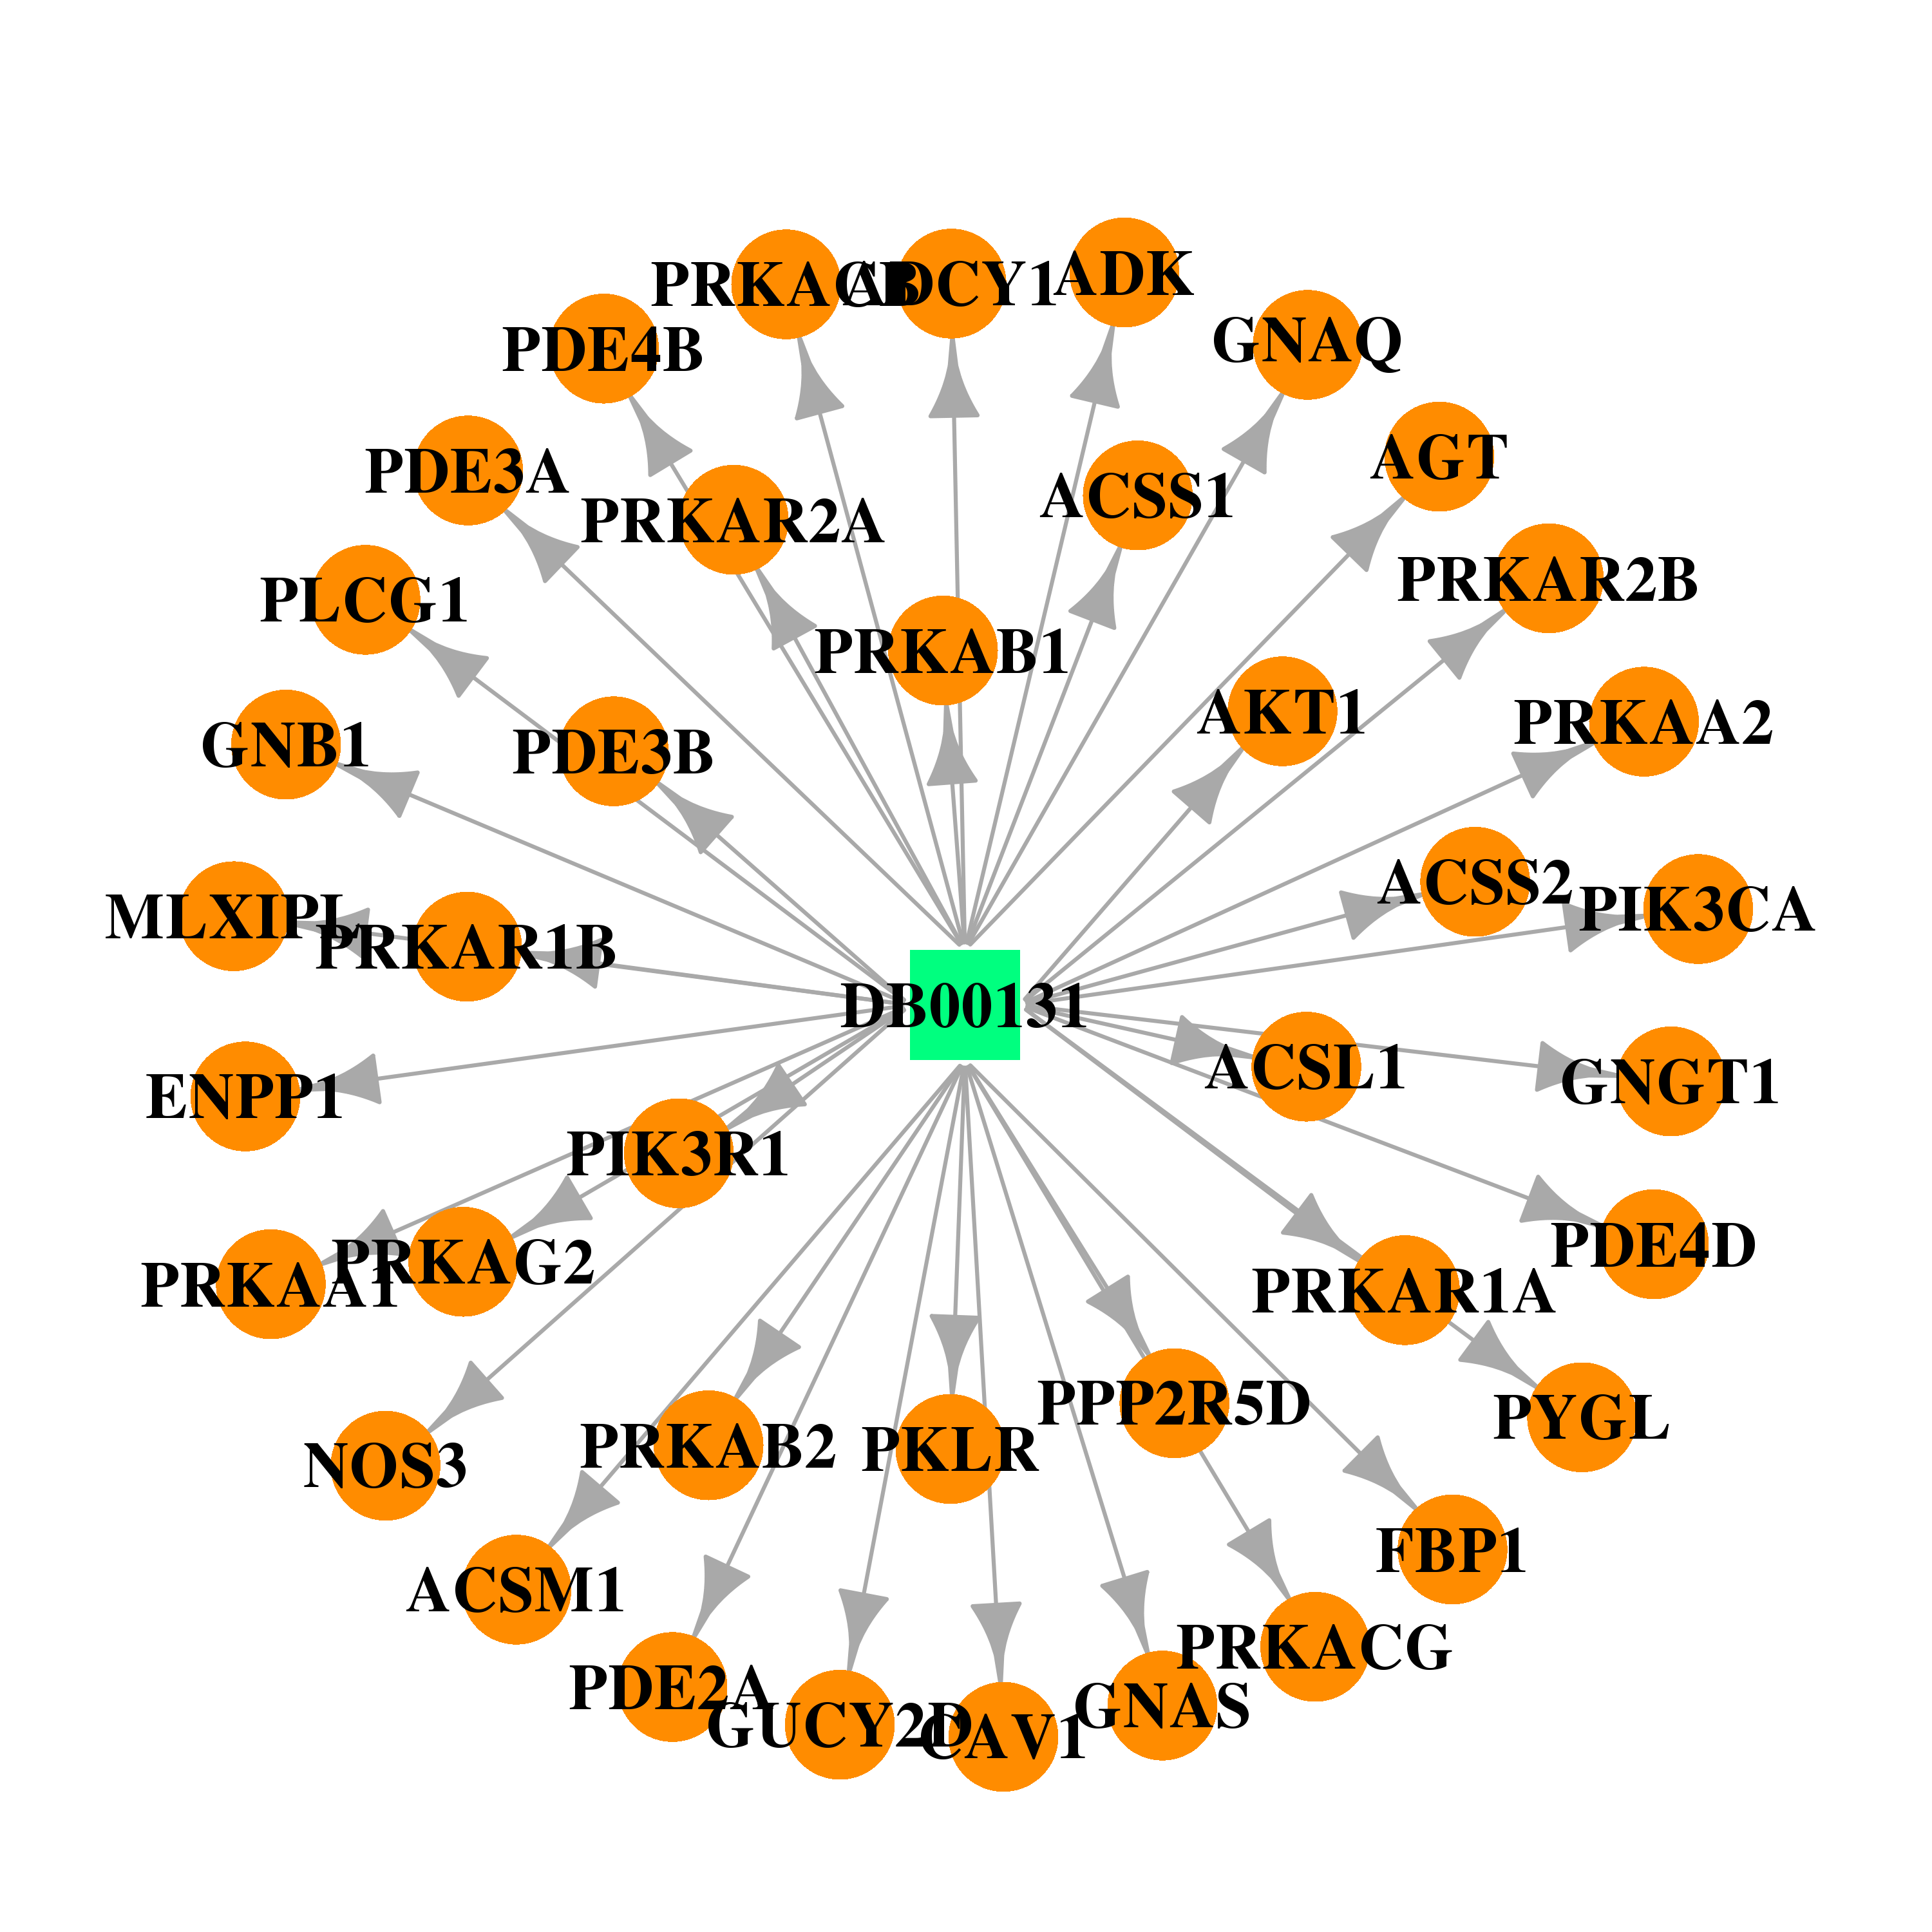 |  |
| DB00396 | guanine nucleotide binding protein (G protein), beta polypeptide 1 | approved | Progesterone | 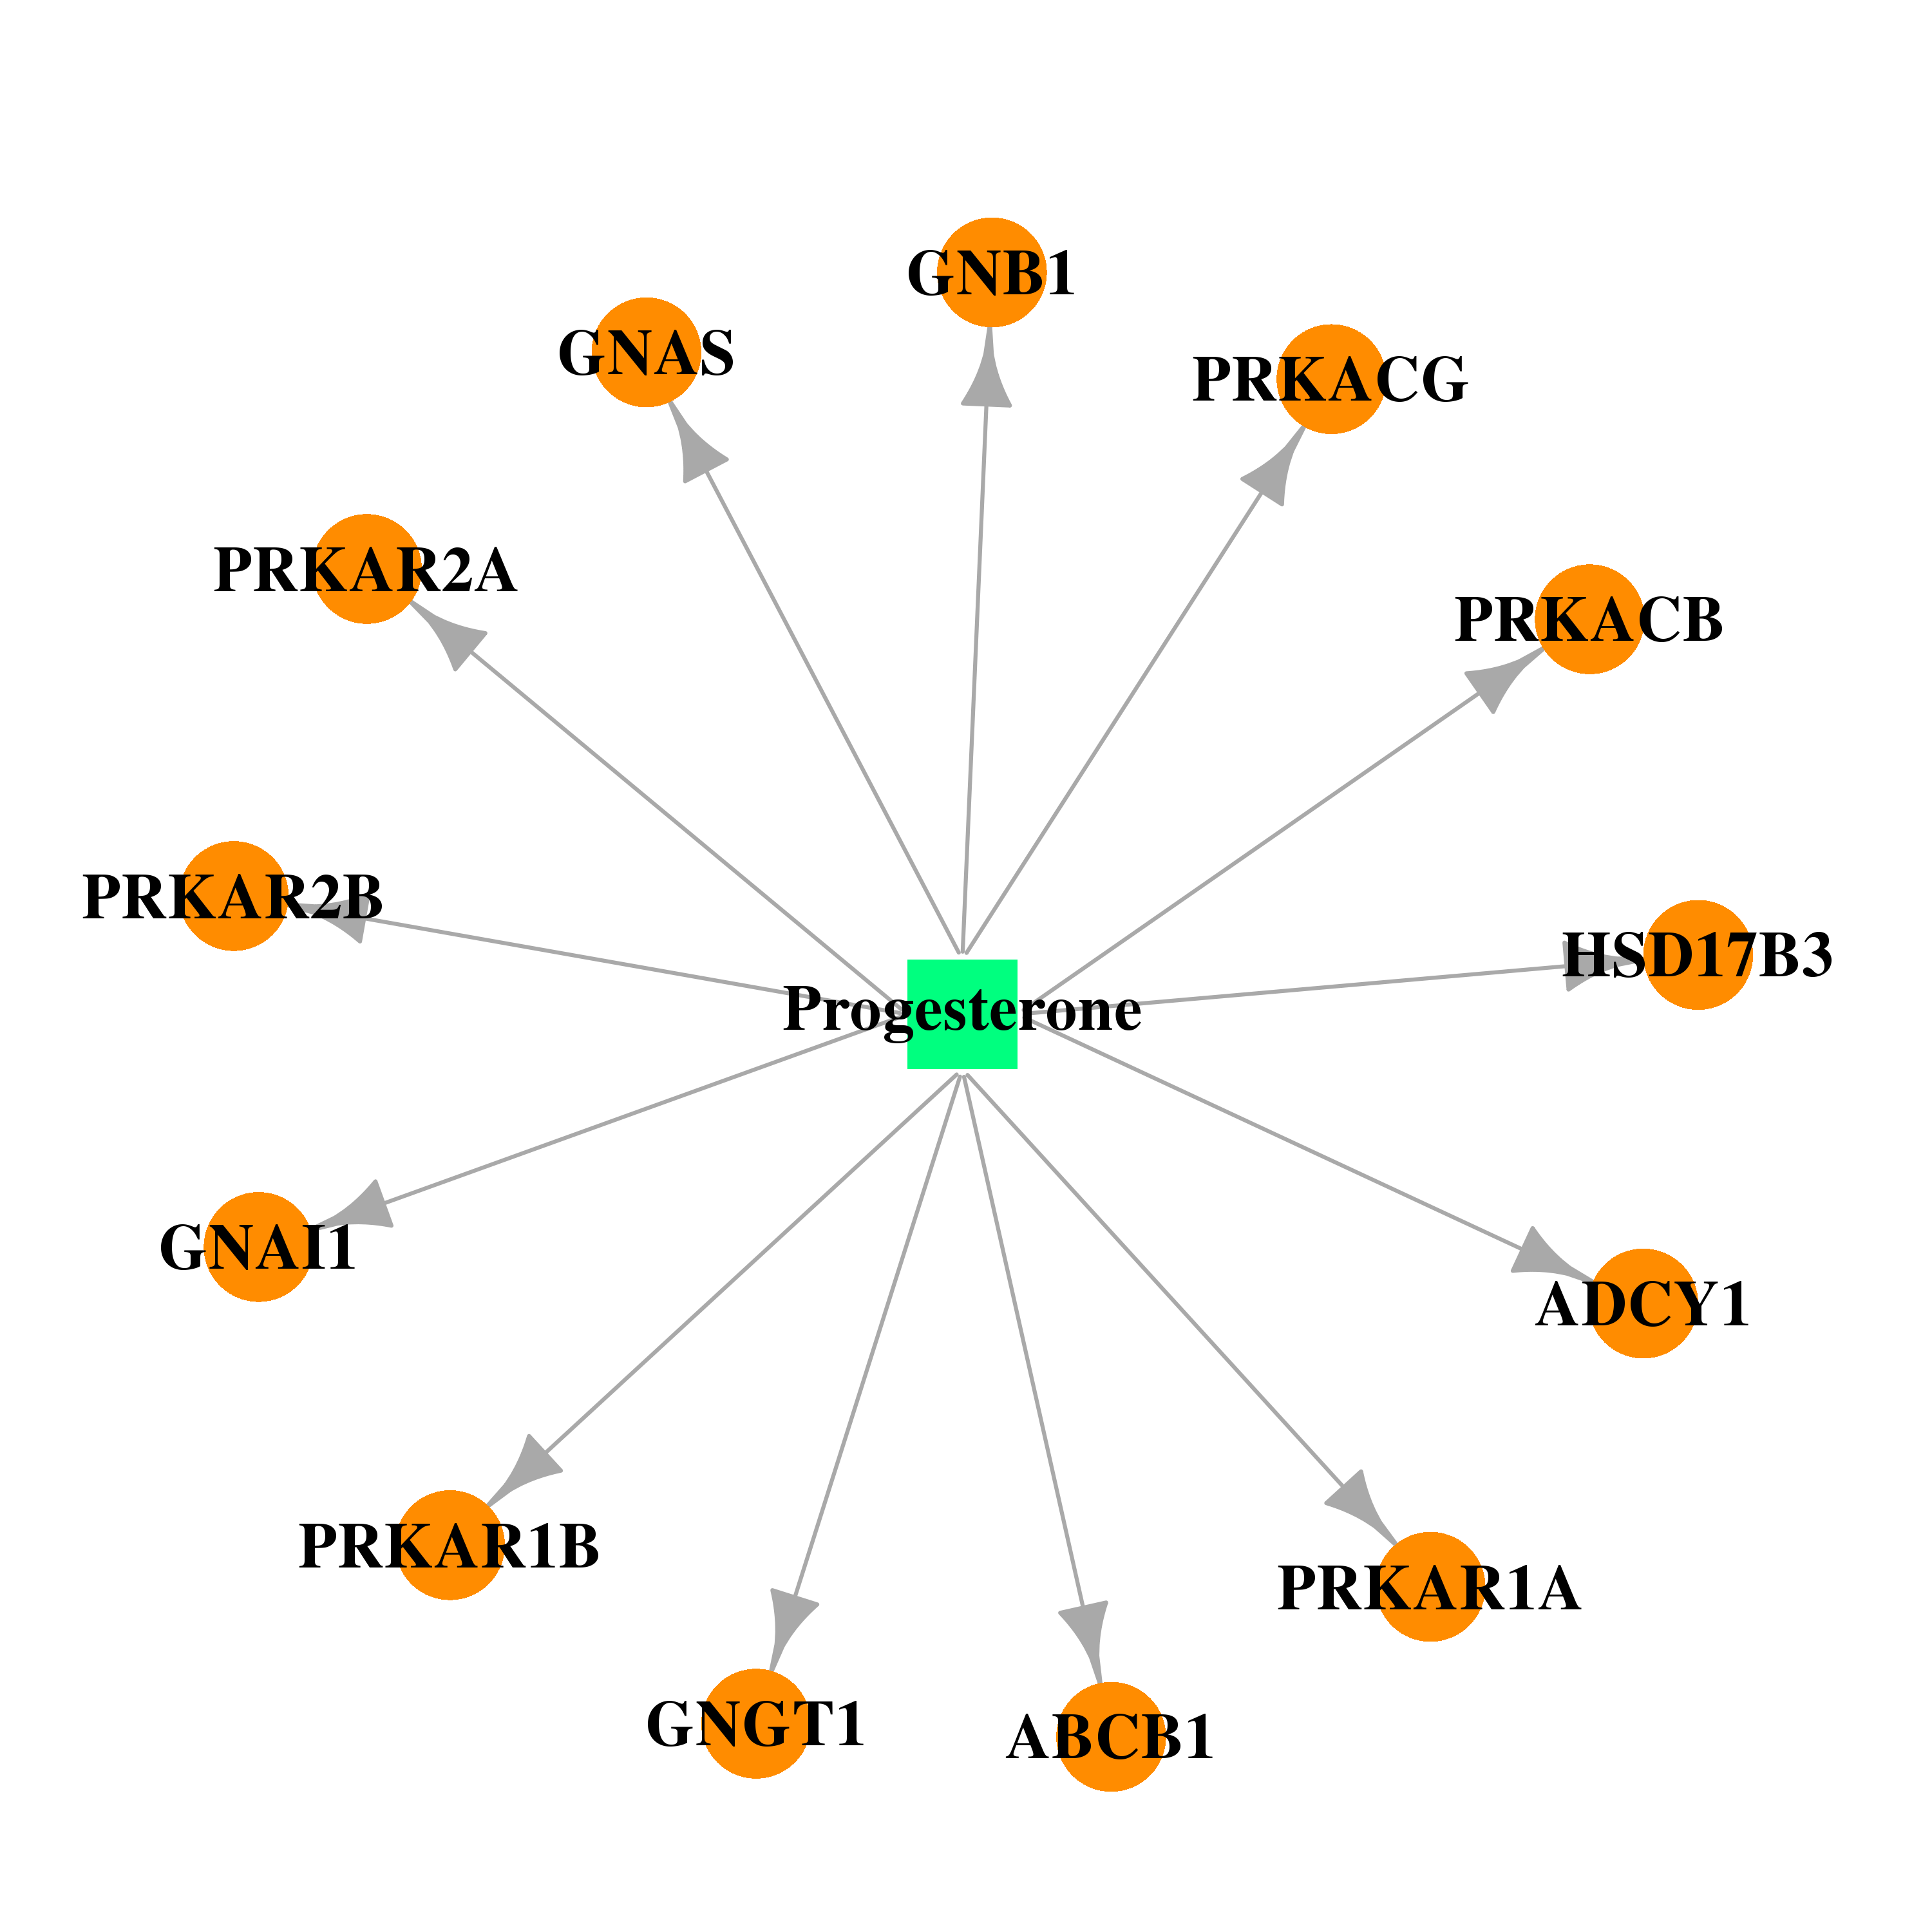 |  |
| Top |
| Cross referenced IDs for GNB1 |
| * We obtained these cross-references from Uniprot database. It covers 150 different DBs, 18 categories. http://www.uniprot.org/help/cross_references_section |
: Open all cross reference information
|
Copyright © 2016-Present - The Univsersity of Texas Health Science Center at Houston @ |