|
||||||||||||||||||||
| |
| Phenotypic Information (metabolism pathway, cancer, disease, phenome) |
| |
| |
| Gene-Gene Network Information: Co-Expression Network, Interacting Genes & KEGG |
| |
|


| Gene Summary for GNB2 |
| Basic gene info. | Gene symbol | GNB2 |
| Gene name | guanine nucleotide binding protein (G protein), beta polypeptide 2 | |
| Synonyms | - | |
| Cytomap | UCSC genome browser: 7q22 | |
| Genomic location | chr7 :100271362-100276792 | |
| Type of gene | protein-coding | |
| RefGenes | NM_005273.3, | |
| Ensembl id | ENSG00000172354 | |
| Description | G protein, beta-2 subunitg protein subunit beta-2guanine nucleotide-binding protein G(I)/G(S)/G(T) beta subunit 2guanine nucleotide-binding protein G(I)/G(S)/G(T) subunit beta-2signal-transducing guanine nucleotide-binding regulatory protein beta subu | |
| Modification date | 20141207 | |
| dbXrefs | MIM : 139390 | |
| HGNC : HGNC | ||
| Ensembl : ENSG00000172354 | ||
| HPRD : 11820 | ||
| Vega : OTTHUMG00000137419 | ||
| Protein | UniProt: go to UniProt's Cross Reference DB Table | |
| Expression | CleanEX: HS_GNB2 | |
| BioGPS: 2783 | ||
| Gene Expression Atlas: ENSG00000172354 | ||
| The Human Protein Atlas: ENSG00000172354 | ||
| Pathway | NCI Pathway Interaction Database: GNB2 | |
| KEGG: GNB2 | ||
| REACTOME: GNB2 | ||
| ConsensusPathDB | ||
| Pathway Commons: GNB2 | ||
| Metabolism | MetaCyc: GNB2 | |
| HUMANCyc: GNB2 | ||
| Regulation | Ensembl's Regulation: ENSG00000172354 | |
| miRBase: chr7 :100,271,362-100,276,792 | ||
| TargetScan: NM_005273 | ||
| cisRED: ENSG00000172354 | ||
| Context | iHOP: GNB2 | |
| cancer metabolism search in PubMed: GNB2 | ||
| UCL Cancer Institute: GNB2 | ||
| Assigned class in ccmGDB | C | |
| Top |
| Phenotypic Information for GNB2(metabolism pathway, cancer, disease, phenome) |
| Cancer | CGAP: GNB2 |
| Familial Cancer Database: GNB2 | |
| * This gene is included in those cancer gene databases. |
|
|
|
|
|
| . | ||||||||||||||
Oncogene 1 | Significant driver gene in | |||||||||||||||||||
| cf) number; DB name 1 Oncogene; http://nar.oxfordjournals.org/content/35/suppl_1/D721.long, 2 Tumor Suppressor gene; https://bioinfo.uth.edu/TSGene/, 3 Cancer Gene Census; http://www.nature.com/nrc/journal/v4/n3/abs/nrc1299.html, 4 CancerGenes; http://nar.oxfordjournals.org/content/35/suppl_1/D721.long, 5 Network of Cancer Gene; http://ncg.kcl.ac.uk/index.php, 1Therapeutic Vulnerabilities in Cancer; http://cbio.mskcc.org/cancergenomics/statius/ |
| REACTOME_INTEGRATION_OF_ENERGY_METABOLISM | |
| OMIM | |
| Orphanet | |
| Disease | KEGG Disease: GNB2 |
| MedGen: GNB2 (Human Medical Genetics with Condition) | |
| ClinVar: GNB2 | |
| Phenotype | MGI: GNB2 (International Mouse Phenotyping Consortium) |
| PhenomicDB: GNB2 | |
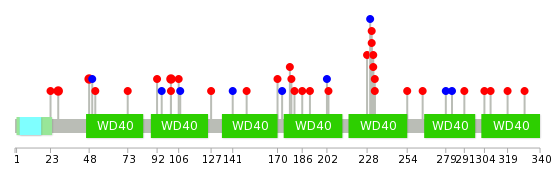
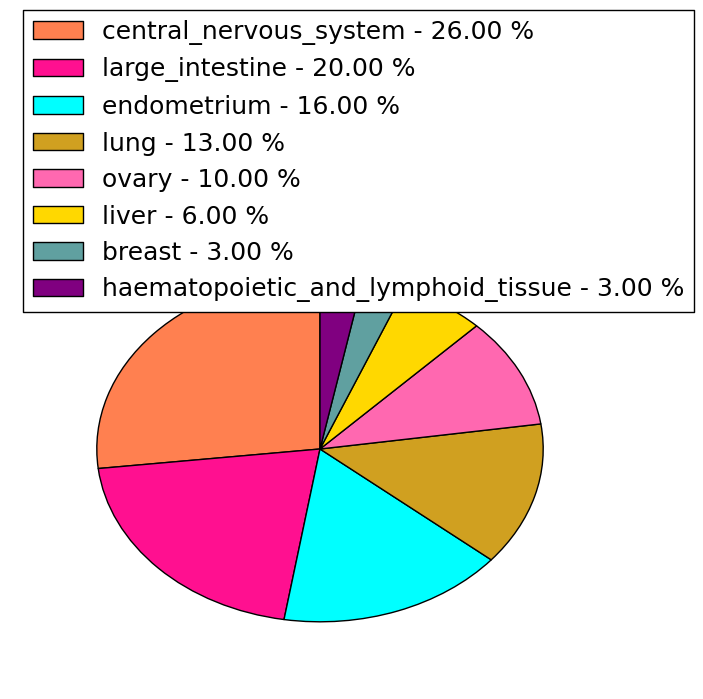
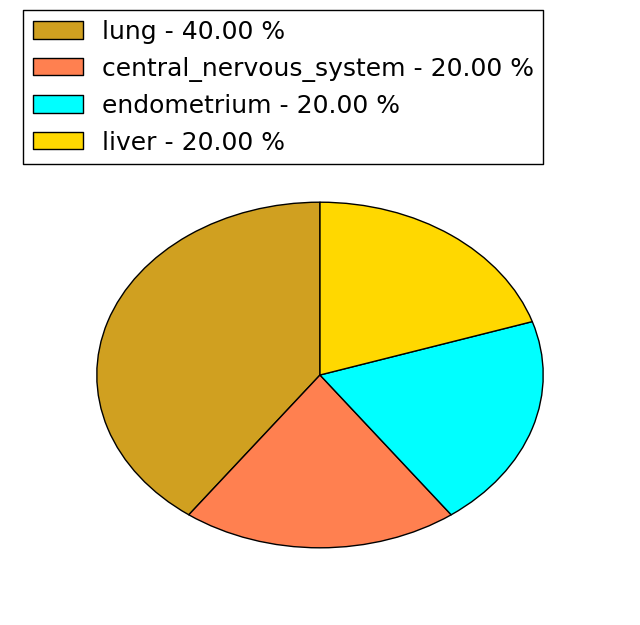
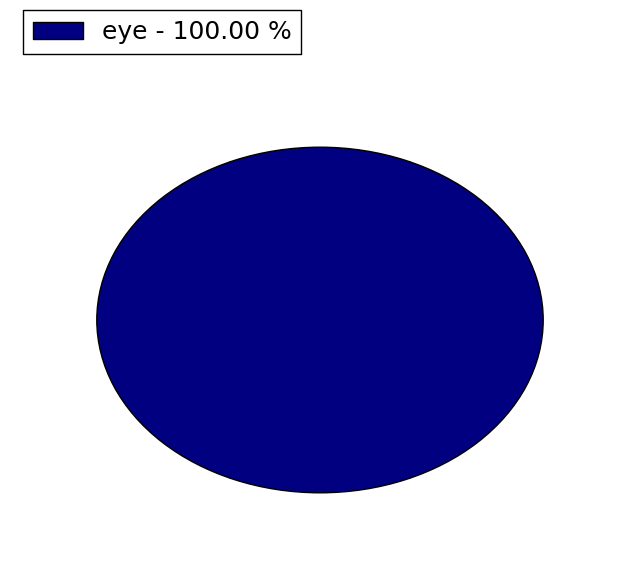
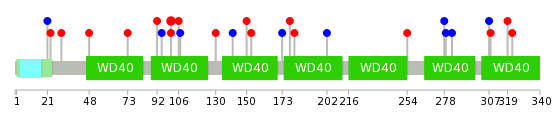
| Mutations for GNB2 |
| * Under tables are showing count per each tissue to give us broad intuition about tissue specific mutation patterns.You can go to the detailed page for each mutation database's web site. |
| There's no structural variation information in COSMIC data for this gene. |
| * From mRNA Sanger sequences, Chitars2.0 arranged chimeric transcripts. This table shows GNB2 related fusion information. |
| ID | Head Gene | Tail Gene | Accession | Gene_a | qStart_a | qEnd_a | Chromosome_a | tStart_a | tEnd_a | Gene_a | qStart_a | qEnd_a | Chromosome_a | tStart_a | tEnd_a |
| BQ326075 | GNB2 | 22 | 358 | 7 | 100275213 | 100275919 | GNB2 | 352 | 503 | 7 | 100276623 | 100276774 | |
| AW316925 | ATG7 | 1 | 30 | 3 | 11471006 | 11471436 | GNB2 | 23 | 164 | 7 | 100276646 | 100276787 | |
| AW904903 | TSPAN14 | 5 | 65 | 10 | 82278691 | 82278751 | GNB2 | 63 | 137 | 7 | 100275753 | 100275827 | |
| BQ326073 | GNB2 | 19 | 352 | 7 | 100275213 | 100275916 | GNB2 | 346 | 497 | 7 | 100276623 | 100276774 | |
| Top |
| There's no copy number variation information in COSMIC data for this gene. |
| Top |
|
 |
| Top |
| Stat. for Non-Synonymous SNVs (# total SNVs=30) | (# total SNVs=5) |
 |  |
(# total SNVs=1) | (# total SNVs=0) |
 |
| Top |
| * When you move the cursor on each content, you can see more deailed mutation information on the Tooltip. Those are primary_site,primary_histology,mutation(aa),pubmedID. |
| GRCh37 position | Mutation(aa) | Unique sampleID count |
| chr7:100274183-100274183 | p.S28L | 3 |
| chr7:100275154-100275154 | p.M101V | 2 |
| chr7:100274361-100274361 | p.R48W | 2 |
| chr7:100274423-100274424 | p.? | 2 |
| chr7:100276323-100276323 | p.L308F | 1 |
| chr7:100275138-100275138 | p.L95L | 1 |
| chr7:100275756-100275756 | p.V178A | 1 |
| chr7:100275917-100275917 | p.V232M | 1 |
| chr7:100274167-100274167 | p.K23Q | 1 |
| chr7:100276356-100276356 | p.G319R | 1 |
| Top |
|
 |
| Point Mutation/ Tissue ID | 1 | 2 | 3 | 4 | 5 | 6 | 7 | 8 | 9 | 10 | 11 | 12 | 13 | 14 | 15 | 16 | 17 | 18 | 19 | 20 |
| # sample | 1 | 2 | 3 | 2 | 2 | 2 | 1 | 1 | 5 | 5 | ||||||||||
| # mutation | 1 | 2 | 3 | 2 | 2 | 2 | 1 | 1 | 7 | 6 | ||||||||||
| nonsynonymous SNV | 1 | 2 | 2 | 2 | 2 | 4 | 5 | |||||||||||||
| synonymous SNV | 1 | 2 | 1 | 1 | 3 | 1 |
| cf) Tissue ID; Tissue type (1; BLCA[Bladder Urothelial Carcinoma], 2; BRCA[Breast invasive carcinoma], 3; CESC[Cervical squamous cell carcinoma and endocervical adenocarcinoma], 4; COAD[Colon adenocarcinoma], 5; GBM[Glioblastoma multiforme], 6; Glioma Low Grade, 7; HNSC[Head and Neck squamous cell carcinoma], 8; KICH[Kidney Chromophobe], 9; KIRC[Kidney renal clear cell carcinoma], 10; KIRP[Kidney renal papillary cell carcinoma], 11; LAML[Acute Myeloid Leukemia], 12; LUAD[Lung adenocarcinoma], 13; LUSC[Lung squamous cell carcinoma], 14; OV[Ovarian serous cystadenocarcinoma ], 15; PAAD[Pancreatic adenocarcinoma], 16; PRAD[Prostate adenocarcinoma], 17; SKCM[Skin Cutaneous Melanoma], 18:STAD[Stomach adenocarcinoma], 19:THCA[Thyroid carcinoma], 20:UCEC[Uterine Corpus Endometrial Carcinoma]) |
| Top |
| * We represented just top 10 SNVs. When you move the cursor on each content, you can see more deailed mutation information on the Tooltip. Those are primary_site, primary_histology, mutation(aa), pubmedID. |
| Genomic Position | Mutation(aa) | Unique sampleID count |
| chr7:100275154 | p.M101V | 2 |
| chr7:100275174 | p.R150H | 1 |
| chr7:100276158 | p.D153N | 1 |
| chr7:100274163 | p.T173T | 1 |
| chr7:100275243 | p.V178A | 1 |
| chr7:100276170 | p.A21A | 1 |
| chr7:100274167 | p.A181V | 1 |
| chr7:100275276 | p.K23Q | 1 |
| chr7:100276322 | p.G202G | 1 |
| chr7:100274189 | p.L30P | 1 |
| * Copy number data were extracted from TCGA using R package TCGA-Assembler. The URLs of all public data files on TCGA DCC data server were gathered on Jan-05-2015. Function ProcessCNAData in TCGA-Assembler package was used to obtain gene-level copy number value which is calculated as the average copy number of the genomic region of a gene. |
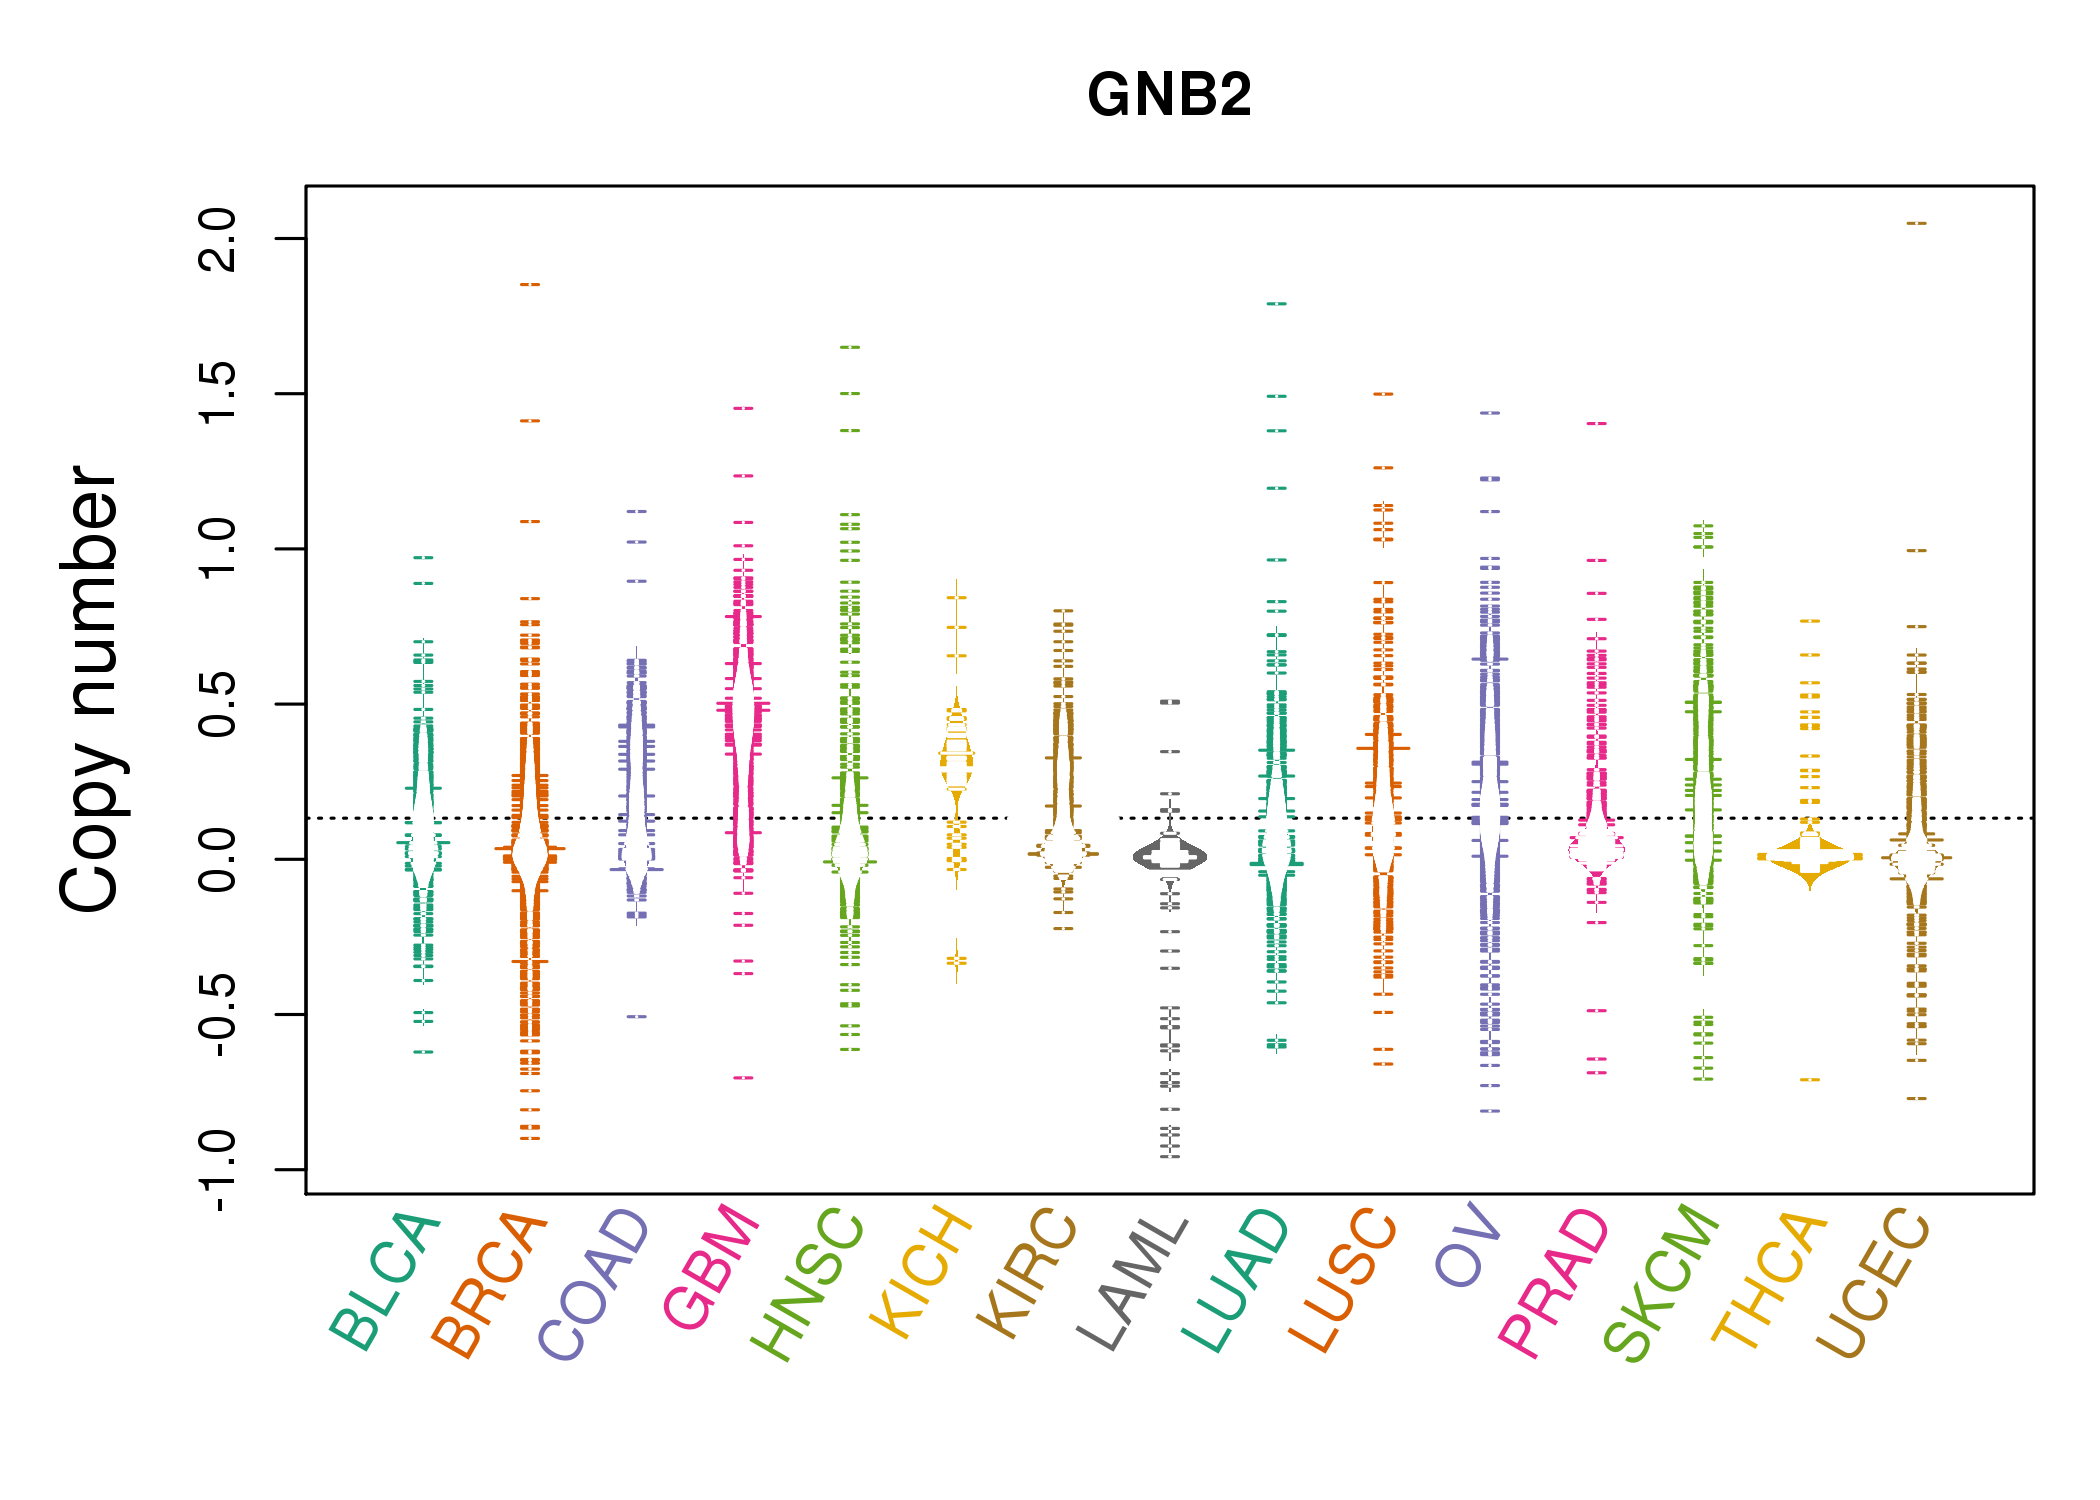 |
| cf) Tissue ID[Tissue type]: BLCA[Bladder Urothelial Carcinoma], BRCA[Breast invasive carcinoma], CESC[Cervical squamous cell carcinoma and endocervical adenocarcinoma], COAD[Colon adenocarcinoma], GBM[Glioblastoma multiforme], Glioma Low Grade, HNSC[Head and Neck squamous cell carcinoma], KICH[Kidney Chromophobe], KIRC[Kidney renal clear cell carcinoma], KIRP[Kidney renal papillary cell carcinoma], LAML[Acute Myeloid Leukemia], LUAD[Lung adenocarcinoma], LUSC[Lung squamous cell carcinoma], OV[Ovarian serous cystadenocarcinoma ], PAAD[Pancreatic adenocarcinoma], PRAD[Prostate adenocarcinoma], SKCM[Skin Cutaneous Melanoma], STAD[Stomach adenocarcinoma], THCA[Thyroid carcinoma], UCEC[Uterine Corpus Endometrial Carcinoma] |
| Top |
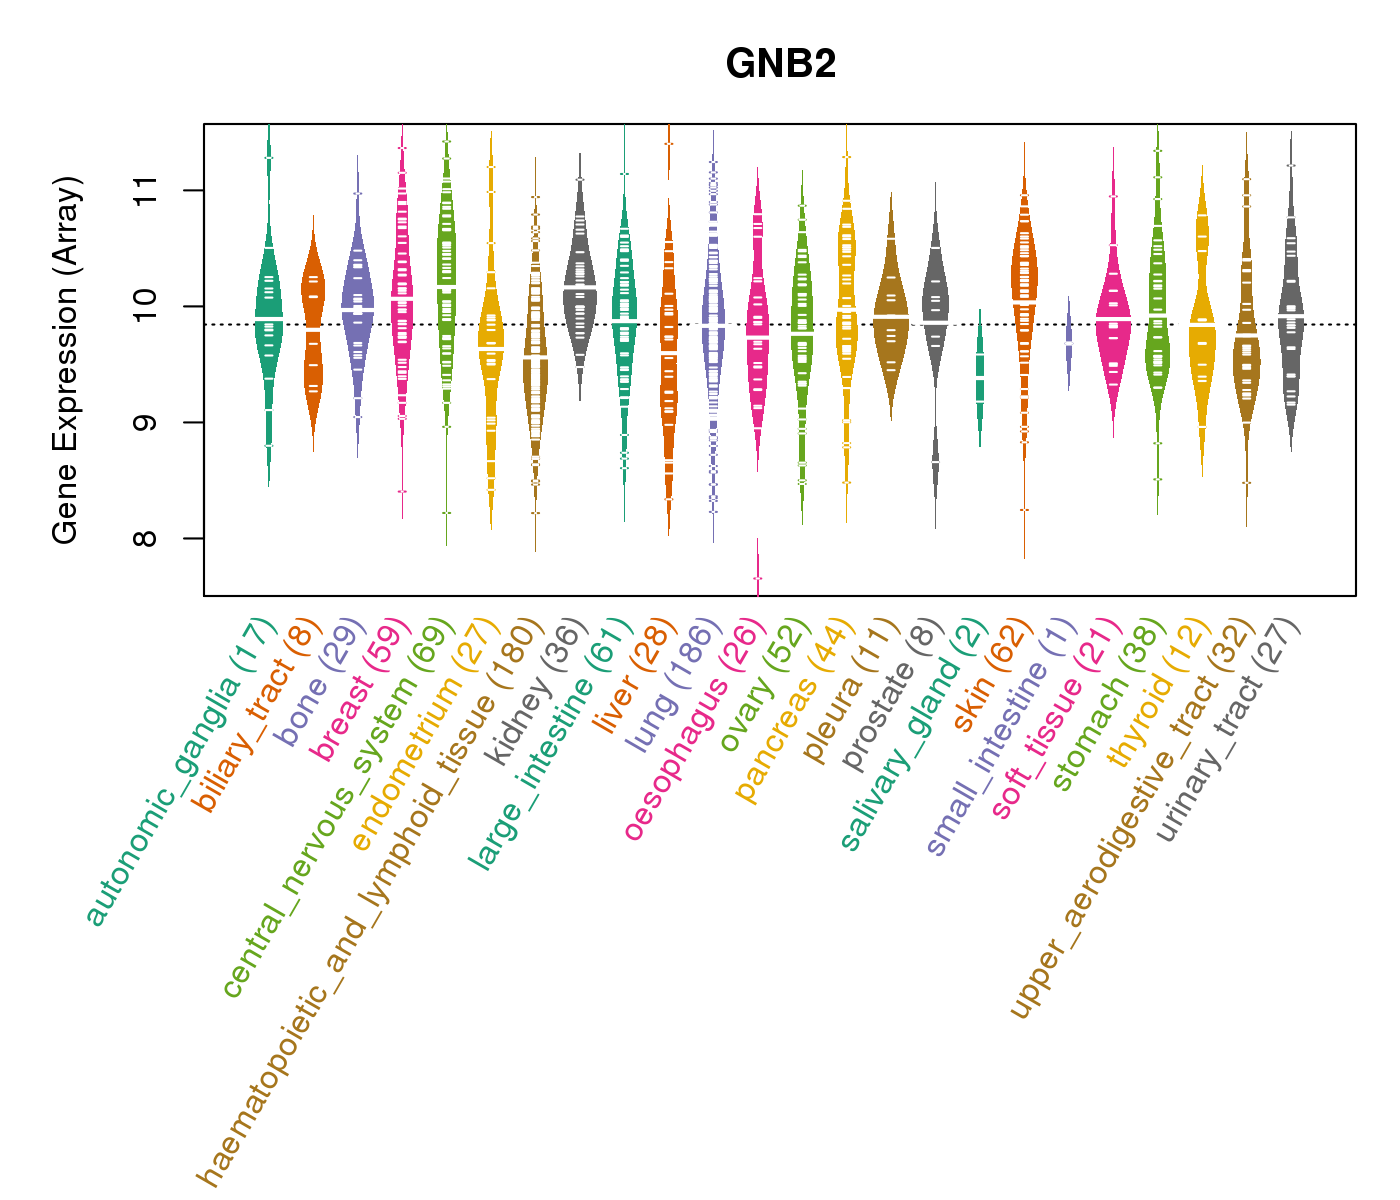
| Gene Expression for GNB2 |
| * CCLE gene expression data were extracted from CCLE_Expression_Entrez_2012-10-18.res: Gene-centric RMA-normalized mRNA expression data. |
 |
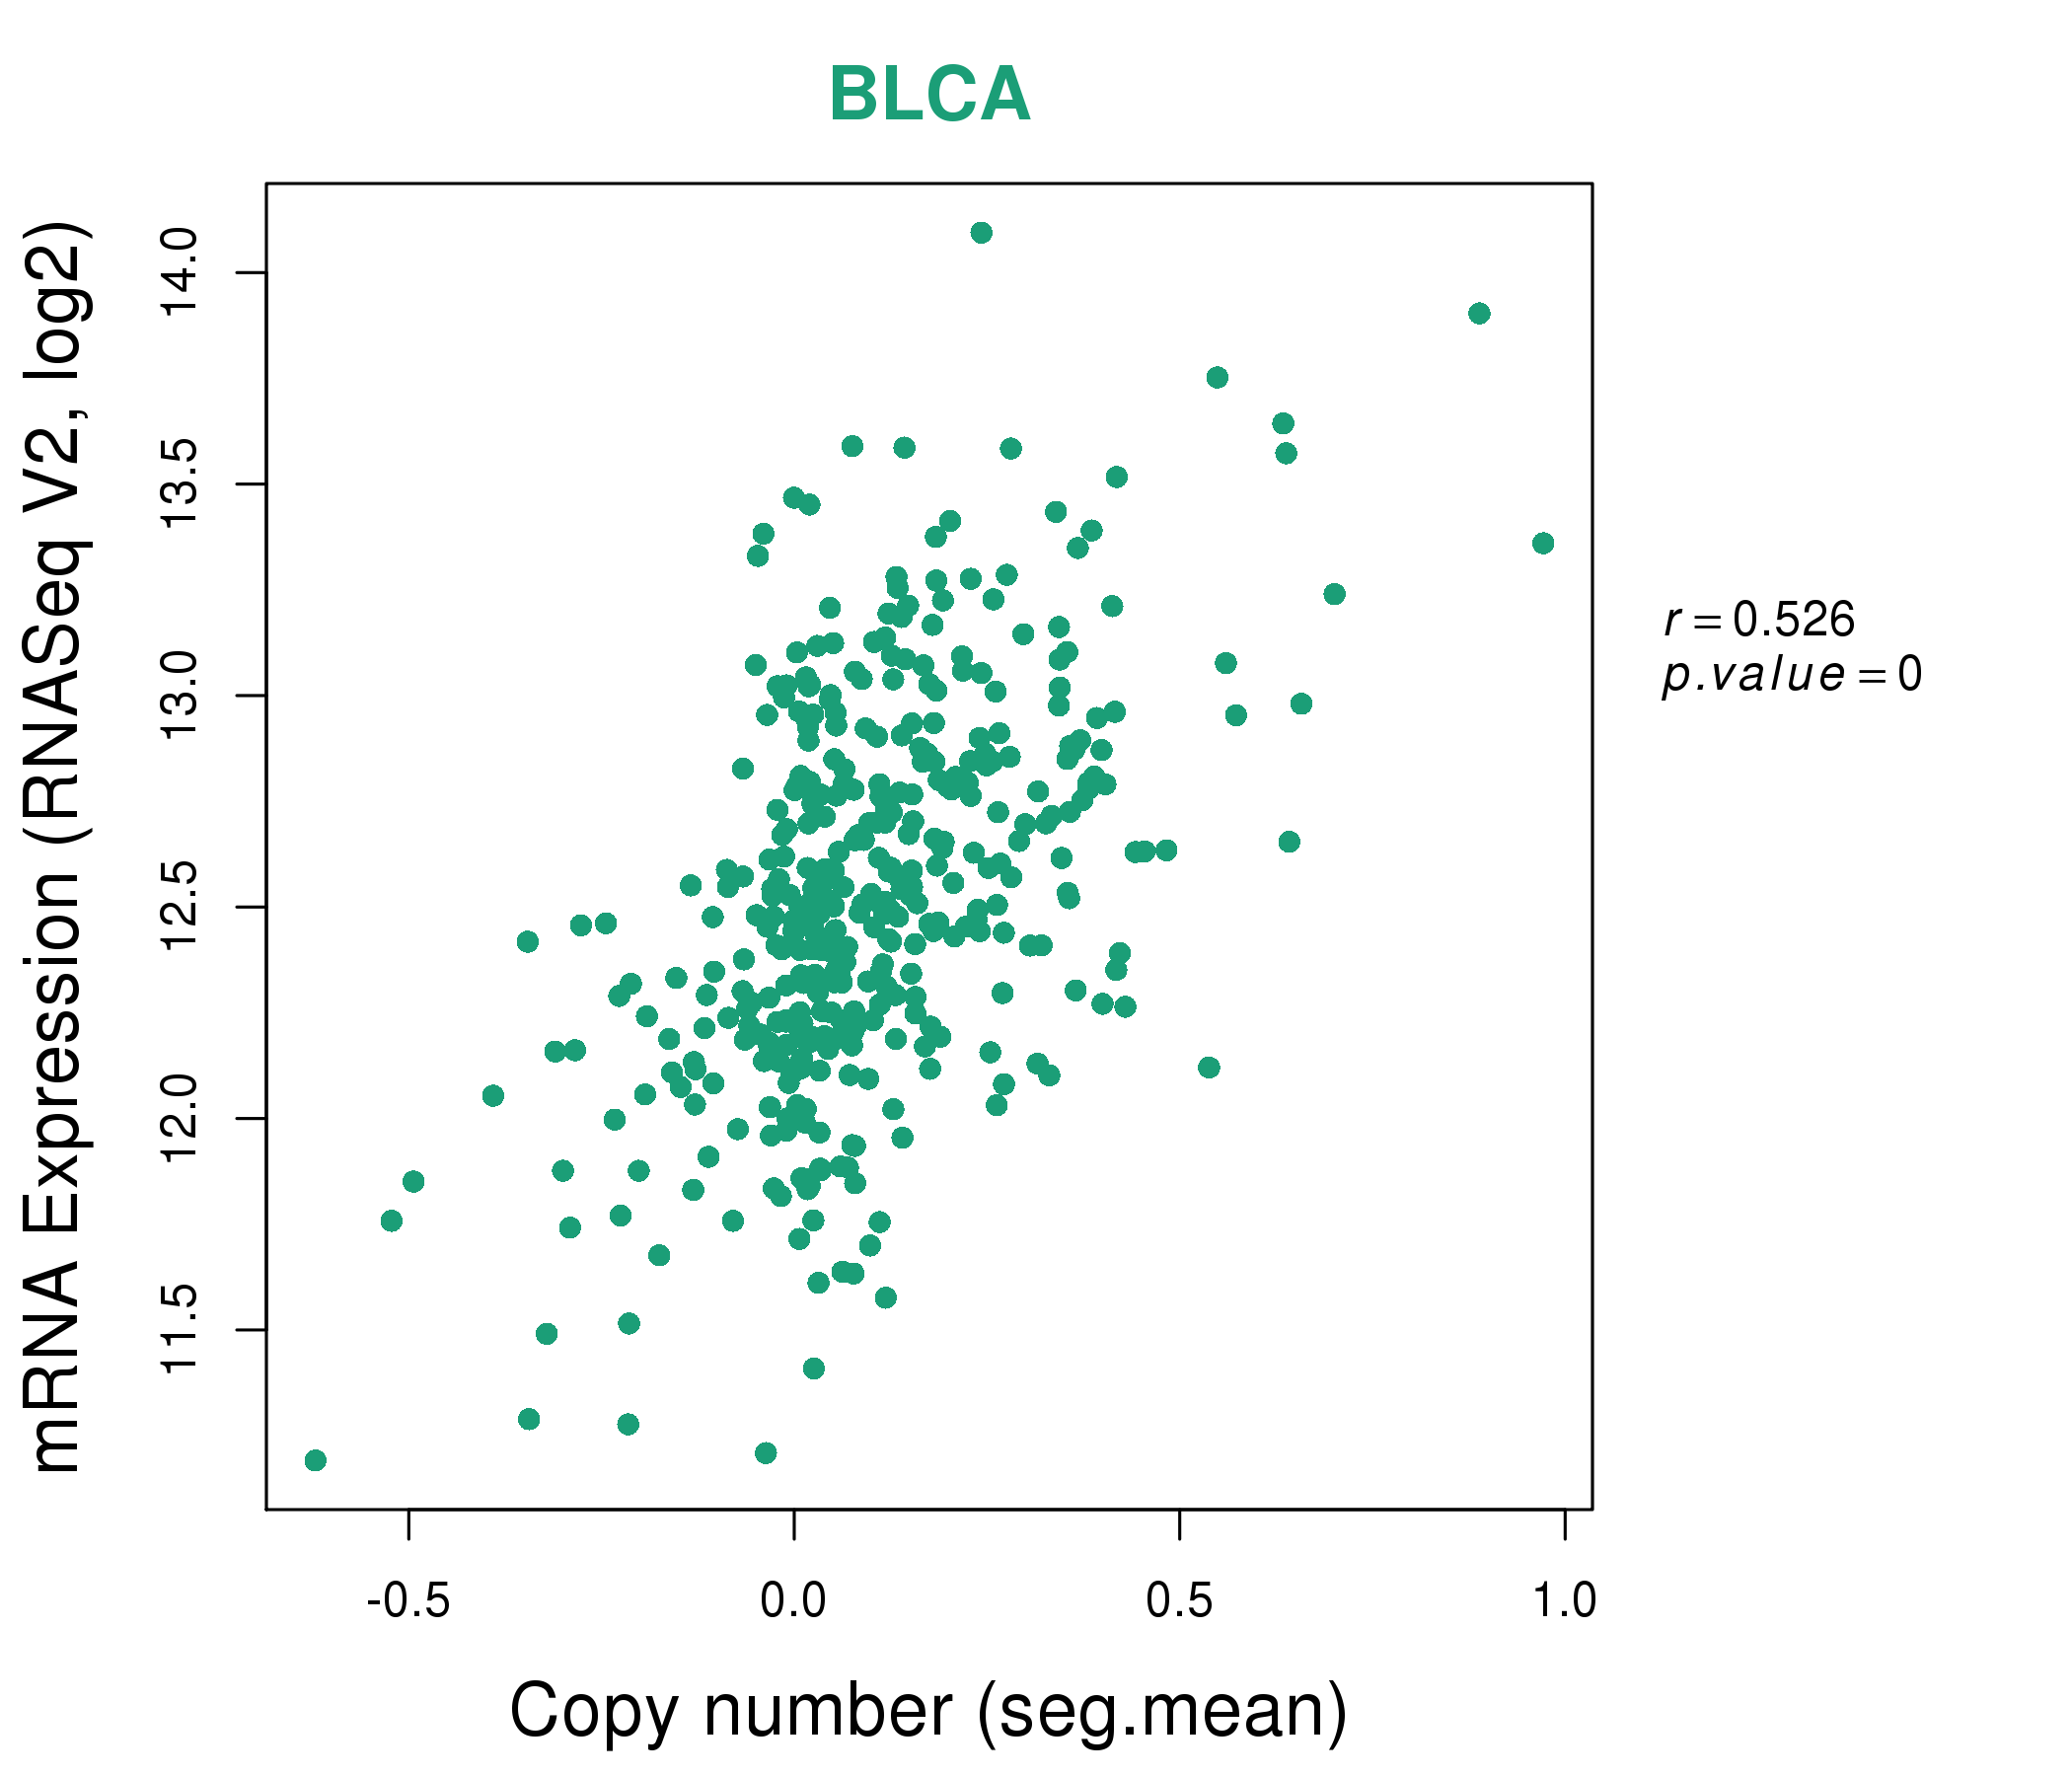
| * Normalized gene expression data of RNASeqV2 was extracted from TCGA using R package TCGA-Assembler. The URLs of all public data files on TCGA DCC data server were gathered at Jan-05-2015. Only eight cancer types have enough normal control samples for differential expression analysis. (t test, adjusted p<0.05 (using Benjamini-Hochberg FDR)) |
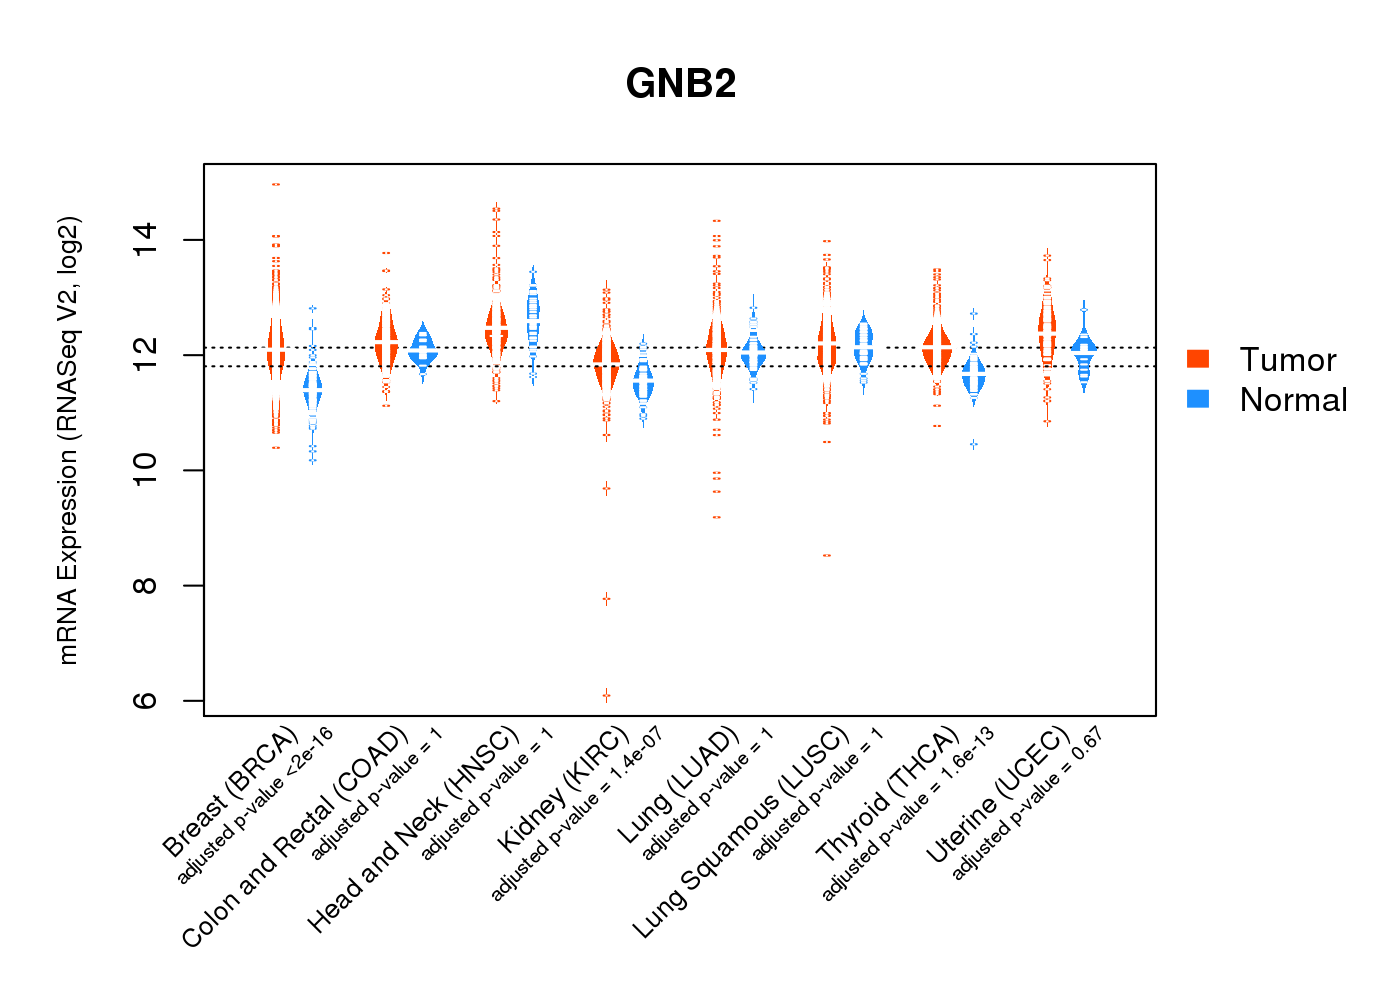 |
| Top |
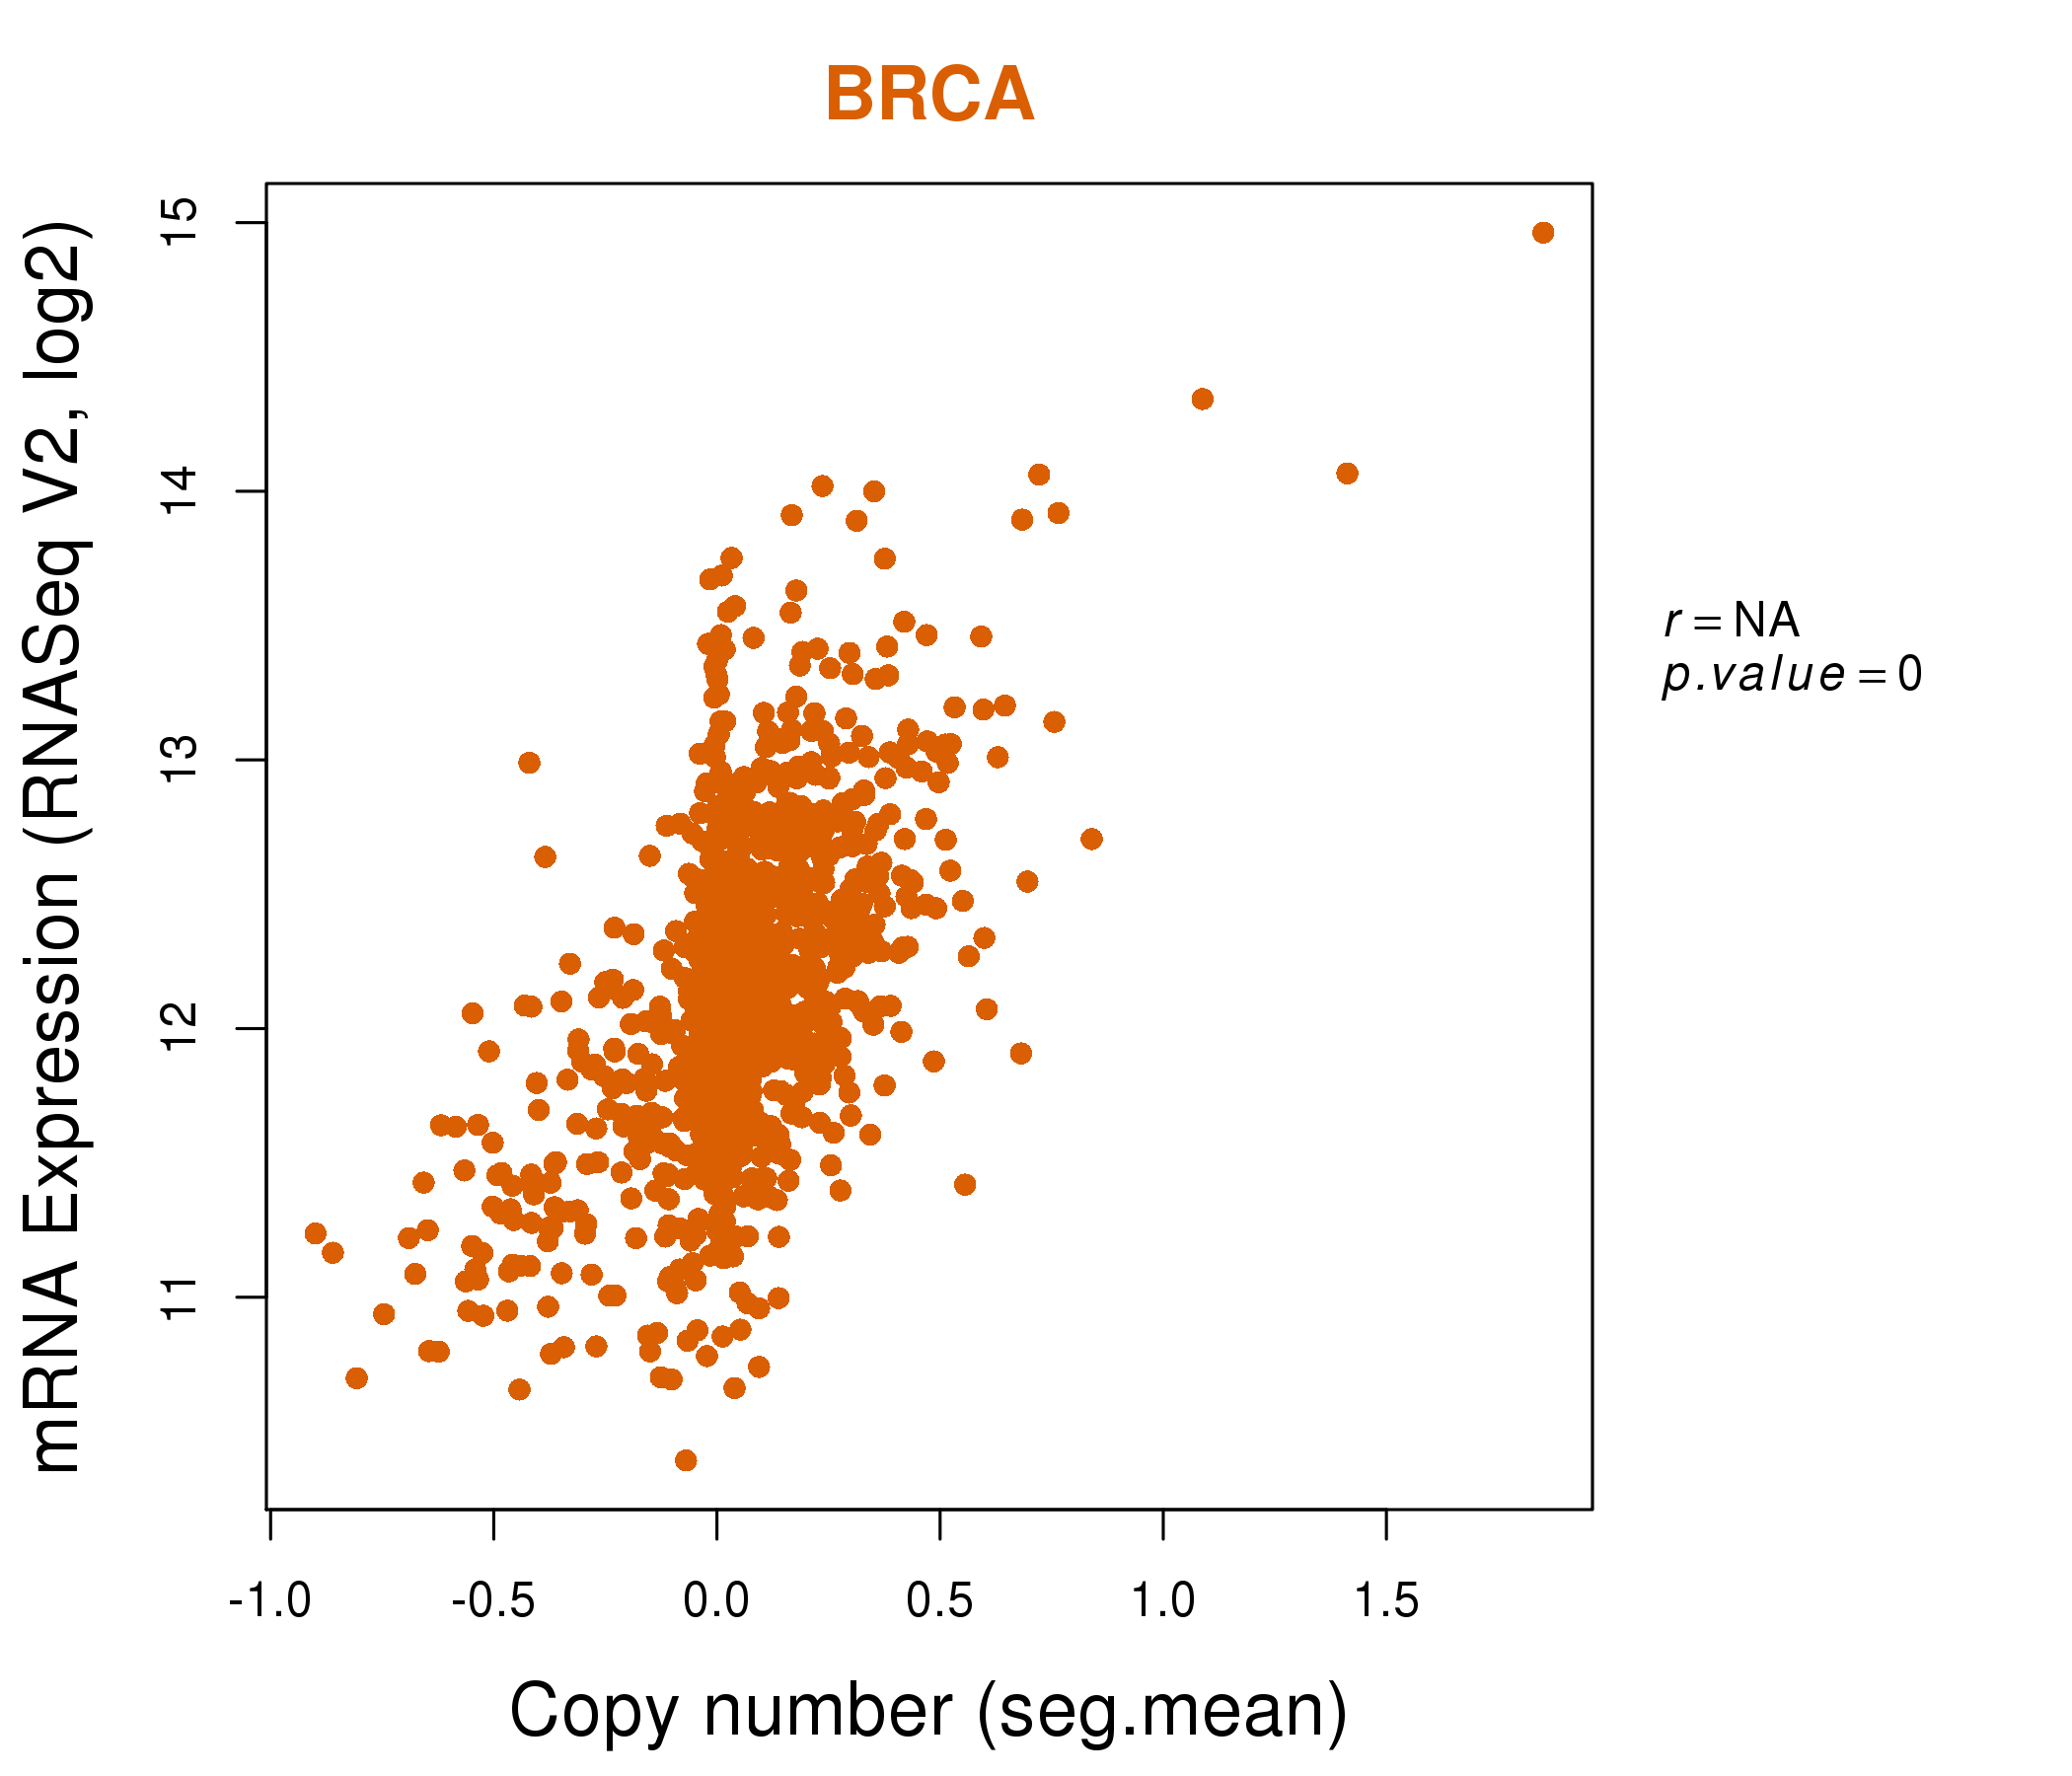
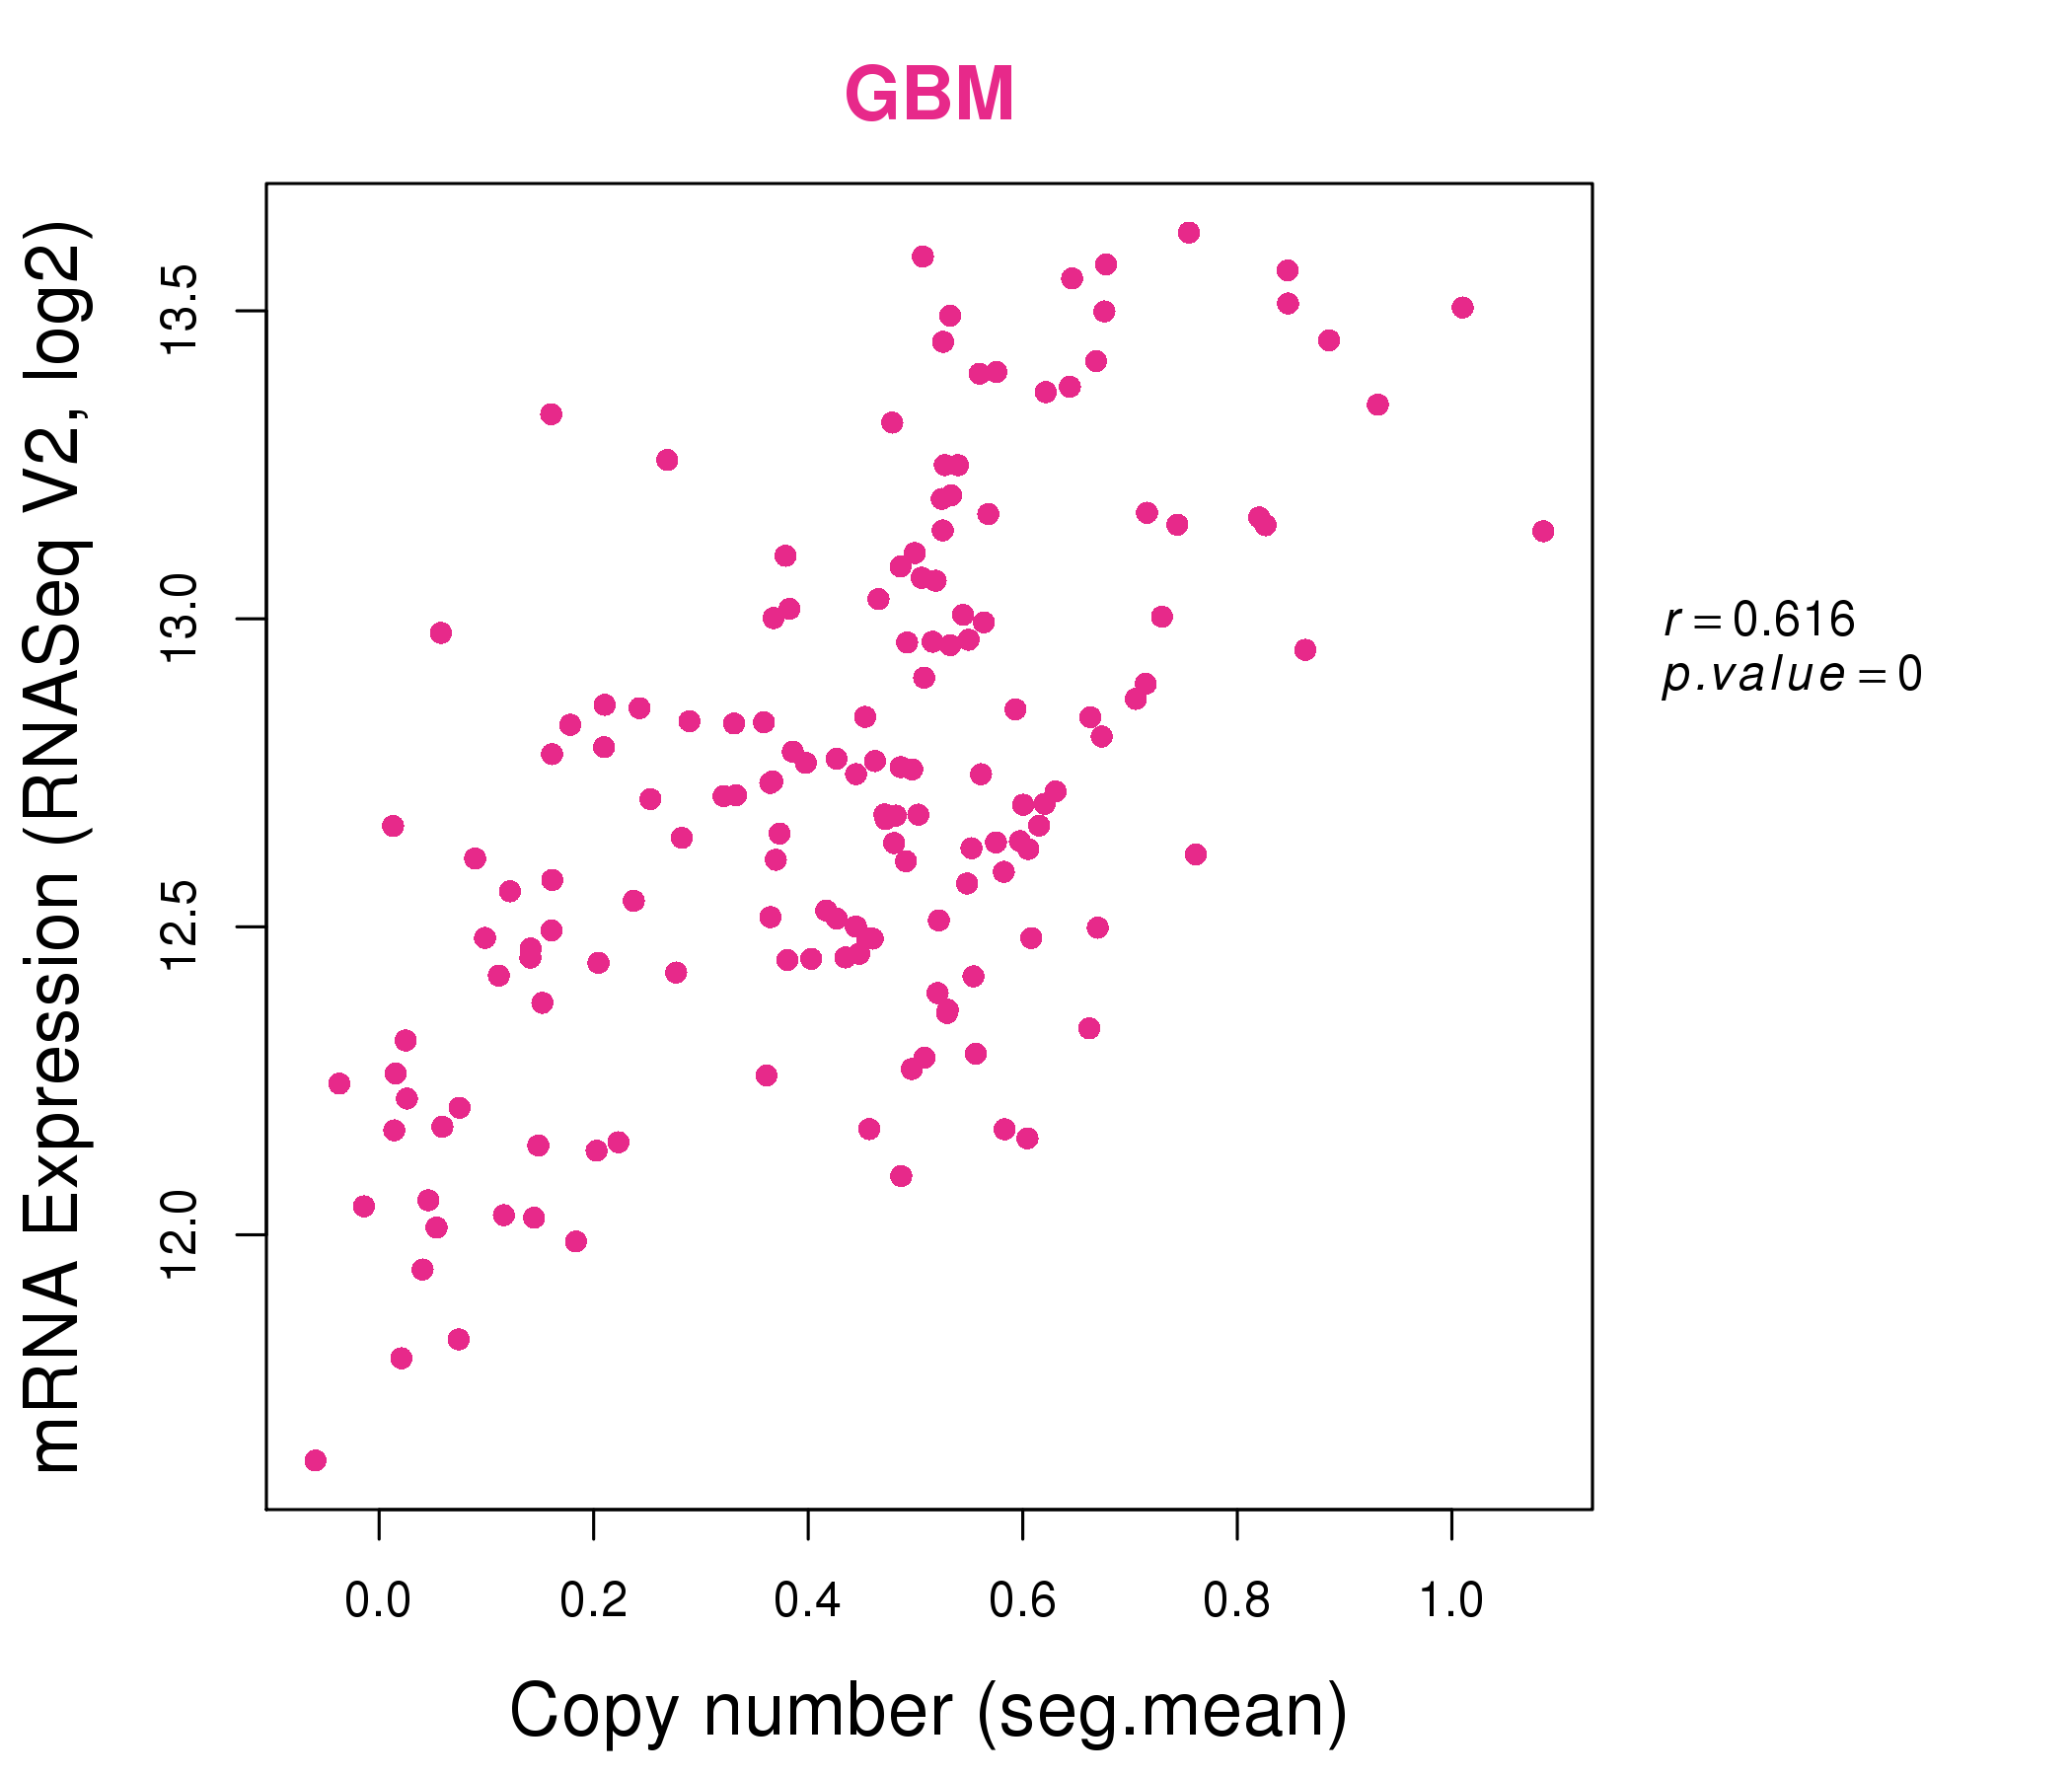
| * This plots show the correlation between CNV and gene expression. |
: Open all plots for all cancer types
 |
|
 |
|
| Top |
| Gene-Gene Network Information |
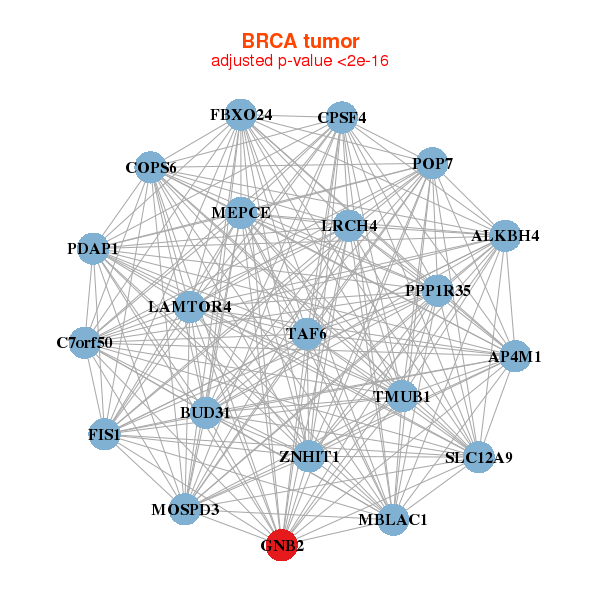
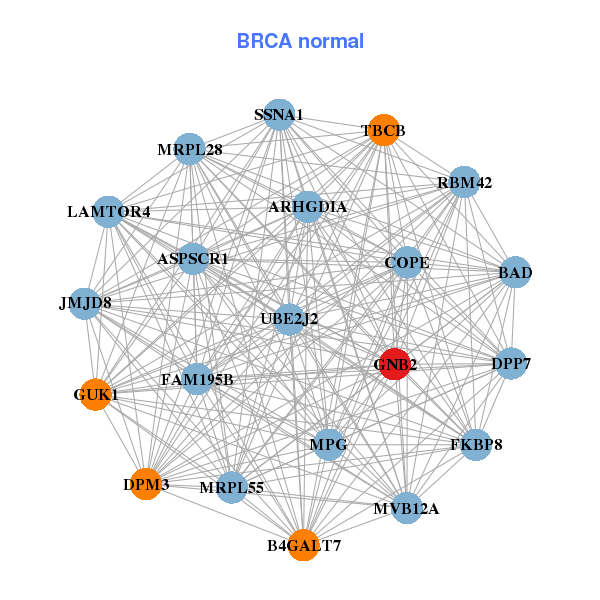
| * Co-Expression network figures were drawn using R package igraph. Only the top 20 genes with the highest correlations were shown. Red circle: input gene, orange circle: cell metabolism gene, sky circle: other gene |
: Open all plots for all cancer types
 |
|
| ALKBH4,AP4M1,BUD31,PPP1R35,C7orf50,LAMTOR4,COPS6, CPSF4,FBXO24,FIS1,GNB2,LRCH4,MBLAC1,MEPCE, MOSPD3,PDAP1,POP7,SLC12A9,TAF6,TMUB1,ZNHIT1 | ARHGDIA,ASPSCR1,B4GALT7,BAD,LAMTOR4,COPE,DPM3, DPP7,MVB12A,FAM195B,FKBP8,GNB2,GUK1,JMJD8, MPG,MRPL28,MRPL55,RBM42,SSNA1,TBCB,UBE2J2 |
 |
|
| ABHD11,ALKBH4,ARF5,ARPC1A,BCL7B,BUD31,PPP1R35, COPS6,FIS1,GNB2,LRWD1,MOSPD3,PDAP1,POLR2J, POR,TMEM120A,TMUB1,TSC22D4,WBSCR16,WBSCR22,ZNHIT1 | ANXA11,ARHGDIA,ATP6V0C,ATP6V0D1,CLTB,CORO1B,GNB2, KRT18,KRT8,LYPLA2,METRNL,MYD88,NFKBIB,PITPNM1, PKP3,RALY,RHOG,SIRT6,TJP3,TMEM53,TMEM54 |

| * Co-Expression network figures were drawn using R package igraph. Only the top 20 genes with the highest correlations were shown. Red circle: input gene, orange circle: cell metabolism gene, sky circle: other gene |
: Open all plots for all cancer types
| Top |
: Open all interacting genes' information including KEGG pathway for all interacting genes from DAVID
| Top |
| Pharmacological Information for GNB2 |
| There's no related Drug. |
| Top |
| Cross referenced IDs for GNB2 |
| * We obtained these cross-references from Uniprot database. It covers 150 different DBs, 18 categories. http://www.uniprot.org/help/cross_references_section |
: Open all cross reference information
|
Copyright © 2016-Present - The Univsersity of Texas Health Science Center at Houston @ |