|
|||||||||||||||||||||||||||||||||||||||||||||||||||||||||||||||||||||||||||||||||||||||||||||||||||||||||||||||||||||||||||||||||||||||||||||||||||||||||||||||||||||||||||||||||||||||||||||||||||||||||||||||||||||||||||||||||||||||||||||||||||||||||||||||||||||||||||||||||||||||||||||||||||||||||||||||||||||||||||||||||||||||||||||||||||||||||||||||||||||||||||||||||||||||||||||||||||||||||||||||||||||||||||||||||||||||||||||||||||||||||||||||||||||||||||
| |
| Phenotypic Information (metabolism pathway, cancer, disease, phenome) |
| |
| |
| Gene-Gene Network Information: Co-Expression Network, Interacting Genes & KEGG |
| |
|


| Gene Summary for GNB3 |
| Basic gene info. | Gene symbol | GNB3 |
| Gene name | guanine nucleotide binding protein (G protein), beta polypeptide 3 | |
| Synonyms | - | |
| Cytomap | UCSC genome browser: 12p13 | |
| Genomic location | chr12 :6949374-6956557 | |
| Type of gene | protein-coding | |
| RefGenes | NM_001297571.1, NM_002075.3, | |
| Ensembl id | ENSG00000268195 | |
| Description | G protein, beta-3 subunitGTP-binding regulatory protein beta-3 chainguanine nucleotide-binding protein G(I)/G(S)/G(T) beta subunit 3guanine nucleotide-binding protein G(I)/G(S)/G(T) subunit beta-3hypertension associated proteintransducin beta chain 3 | |
| Modification date | 20141207 | |
| dbXrefs | MIM : 139130 | |
| HGNC : HGNC | ||
| Ensembl : ENSG00000111664 | ||
| HPRD : 00743 | ||
| Vega : OTTHUMG00000168517 | ||
| Protein | UniProt: go to UniProt's Cross Reference DB Table | |
| Expression | CleanEX: HS_GNB3 | |
| BioGPS: 2784 | ||
| Gene Expression Atlas: ENSG00000268195 | ||
| The Human Protein Atlas: ENSG00000268195 | ||
| Pathway | NCI Pathway Interaction Database: GNB3 | |
| KEGG: GNB3 | ||
| REACTOME: GNB3 | ||
| ConsensusPathDB | ||
| Pathway Commons: GNB3 | ||
| Metabolism | MetaCyc: GNB3 | |
| HUMANCyc: GNB3 | ||
| Regulation | Ensembl's Regulation: ENSG00000268195 | |
| miRBase: chr12 :6,949,374-6,956,557 | ||
| TargetScan: NM_001297571 | ||
| cisRED: ENSG00000268195 | ||
| Context | iHOP: GNB3 | |
| cancer metabolism search in PubMed: GNB3 | ||
| UCL Cancer Institute: GNB3 | ||
| Assigned class in ccmGDB | C | |
| Top |
| Phenotypic Information for GNB3(metabolism pathway, cancer, disease, phenome) |
| Cancer | CGAP: GNB3 |
| Familial Cancer Database: GNB3 | |
| * This gene is included in those cancer gene databases. |
|
|
|
|
|
| . | |||||||||||||||||||||||||||||||||||||||||||||||||||||||||||||||||||||||||||||||||||||||||||||||||||||||||||||||||||||||||||||||||||||||||||||||||||||||||||||||||||||||||||||||||||||||||||||||||||||||||||||||||||||||||||||||||||||||||||||||||||||||||||||||||||||||||||||||||||||||||||||||||||||||||||||||||||||||||||||||||||||||||||||||||||||||||||||||||||||||||||||||||||||||||||||||||||||||||||||||||||||||||||||||||||||||||||||||||||||||||||||||||||||
Oncogene 1 | Significant driver gene in | ||||||||||||||||||||||||||||||||||||||||||||||||||||||||||||||||||||||||||||||||||||||||||||||||||||||||||||||||||||||||||||||||||||||||||||||||||||||||||||||||||||||||||||||||||||||||||||||||||||||||||||||||||||||||||||||||||||||||||||||||||||||||||||||||||||||||||||||||||||||||||||||||||||||||||||||||||||||||||||||||||||||||||||||||||||||||||||||||||||||||||||||||||||||||||||||||||||||||||||||||||||||||||||||||||||||||||||||||||||||||||||||||||||||||||
| cf) number; DB name 1 Oncogene; http://nar.oxfordjournals.org/content/35/suppl_1/D721.long, 2 Tumor Suppressor gene; https://bioinfo.uth.edu/TSGene/, 3 Cancer Gene Census; http://www.nature.com/nrc/journal/v4/n3/abs/nrc1299.html, 4 CancerGenes; http://nar.oxfordjournals.org/content/35/suppl_1/D721.long, 5 Network of Cancer Gene; http://ncg.kcl.ac.uk/index.php, 1Therapeutic Vulnerabilities in Cancer; http://cbio.mskcc.org/cancergenomics/statius/ |
| REACTOME_INTEGRATION_OF_ENERGY_METABOLISM | |
| OMIM | |
| Orphanet | |
| Disease | KEGG Disease: GNB3 |
| MedGen: GNB3 (Human Medical Genetics with Condition) | |
| ClinVar: GNB3 | |
| Phenotype | MGI: GNB3 (International Mouse Phenotyping Consortium) |
| PhenomicDB: GNB3 | |
| Mutations for GNB3 |
| * Under tables are showing count per each tissue to give us broad intuition about tissue specific mutation patterns.You can go to the detailed page for each mutation database's web site. |
| There's no structural variation information in COSMIC data for this gene. |
| * From mRNA Sanger sequences, Chitars2.0 arranged chimeric transcripts. This table shows GNB3 related fusion information. |
| ID | Head Gene | Tail Gene | Accession | Gene_a | qStart_a | qEnd_a | Chromosome_a | tStart_a | tEnd_a | Gene_a | qStart_a | qEnd_a | Chromosome_a | tStart_a | tEnd_a |
| BM715141 | INTS9 | 1 | 300 | 8 | 28654229 | 28654528 | GNB3 | 286 | 353 | 12 | 6956490 | 6956557 | |
| BM691769 | INTS9 | 1 | 300 | 8 | 28654229 | 28654528 | GNB3 | 286 | 353 | 12 | 6956490 | 6956557 | |
| BU734248 | GNB3 | 18 | 304 | 12 | 6956276 | 6956557 | GNB3 | 286 | 351 | 12 | 6956204 | 6956269 | |
| BM665849 | GNB3 | 18 | 85 | 12 | 6956490 | 6956557 | INTS9 | 71 | 366 | 8 | 28654233 | 28654528 | |
| Top |
| Mutation type/ Tissue ID | brca | cns | cerv | endome | haematopo | kidn | Lintest | liver | lung | ns | ovary | pancre | prost | skin | stoma | thyro | urina | |||
| Total # sample | 1 | 1 | ||||||||||||||||||
| GAIN (# sample) | 1 | 1 | ||||||||||||||||||
| LOSS (# sample) |
| cf) Tissue ID; Tissue type (1; Breast, 2; Central_nervous_system, 3; Cervix, 4; Endometrium, 5; Haematopoietic_and_lymphoid_tissue, 6; Kidney, 7; Large_intestine, 8; Liver, 9; Lung, 10; NS, 11; Ovary, 12; Pancreas, 13; Prostate, 14; Skin, 15; Stomach, 16; Thyroid, 17; Urinary_tract) |
| Top |
|
 |
| Top |
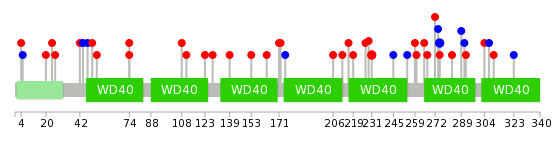
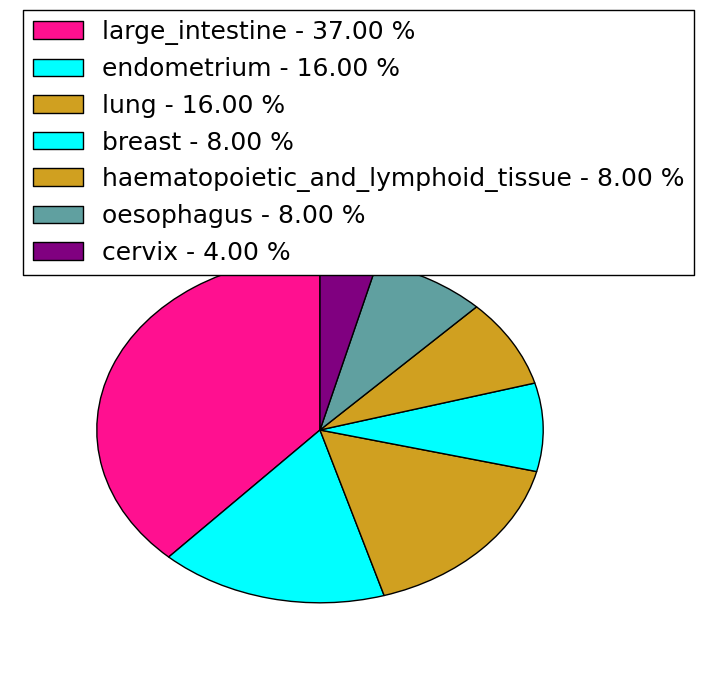
| Stat. for Non-Synonymous SNVs (# total SNVs=24) | (# total SNVs=10) |
 |  |
(# total SNVs=0) | (# total SNVs=0) |
| Top |
| * When you move the cursor on each content, you can see more deailed mutation information on the Tooltip. Those are primary_site,primary_histology,mutation(aa),pubmedID. |
| GRCh37 position | Mutation(aa) | Unique sampleID count |
| chr12:6952161-6952161 | p.R42* | 2 |
| chr12:6954875-6954875 | p.S275S | 2 |
| chr12:6953134-6953134 | p.A231T | 2 |
| chr12:6954844-6954844 | p.S265F | 1 |
| chr12:6952626-6952626 | p.I123V | 1 |
| chr12:6955960-6955960 | p.I307I | 1 |
| chr12:6953077-6953077 | p.D212N | 1 |
| chr12:6952162-6952162 | p.R42Q | 1 |
| chr12:6954849-6954849 | p.E267K | 1 |
| chr12:6952642-6952642 | p.S128F | 1 |
| Top |
|
 |
| Point Mutation/ Tissue ID | 1 | 2 | 3 | 4 | 5 | 6 | 7 | 8 | 9 | 10 | 11 | 12 | 13 | 14 | 15 | 16 | 17 | 18 | 19 | 20 |
| # sample | 2 | 2 | 1 | 7 | 2 | 1 | 5 | 3 | 1 | 6 | 3 | 5 | ||||||||
| # mutation | 2 | 2 | 1 | 7 | 2 | 1 | 6 | 3 | 1 | 7 | 3 | 5 | ||||||||
| nonsynonymous SNV | 2 | 2 | 1 | 4 | 2 | 5 | 1 | 1 | 7 | 1 | 3 | |||||||||
| synonymous SNV | 3 | 1 | 1 | 2 | 2 | 2 |
| cf) Tissue ID; Tissue type (1; BLCA[Bladder Urothelial Carcinoma], 2; BRCA[Breast invasive carcinoma], 3; CESC[Cervical squamous cell carcinoma and endocervical adenocarcinoma], 4; COAD[Colon adenocarcinoma], 5; GBM[Glioblastoma multiforme], 6; Glioma Low Grade, 7; HNSC[Head and Neck squamous cell carcinoma], 8; KICH[Kidney Chromophobe], 9; KIRC[Kidney renal clear cell carcinoma], 10; KIRP[Kidney renal papillary cell carcinoma], 11; LAML[Acute Myeloid Leukemia], 12; LUAD[Lung adenocarcinoma], 13; LUSC[Lung squamous cell carcinoma], 14; OV[Ovarian serous cystadenocarcinoma ], 15; PAAD[Pancreatic adenocarcinoma], 16; PRAD[Prostate adenocarcinoma], 17; SKCM[Skin Cutaneous Melanoma], 18:STAD[Stomach adenocarcinoma], 19:THCA[Thyroid carcinoma], 20:UCEC[Uterine Corpus Endometrial Carcinoma]) |
| Top |
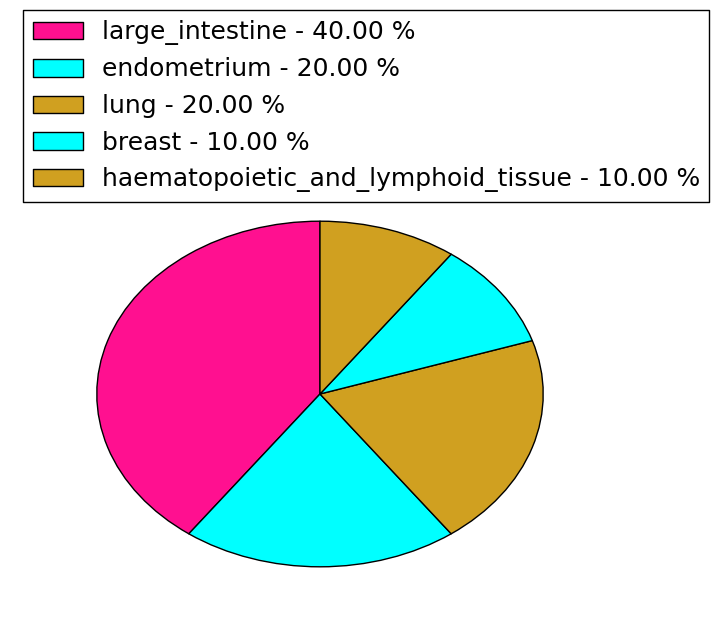
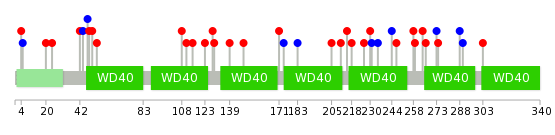
| * We represented just top 10 SNVs. When you move the cursor on each content, you can see more deailed mutation information on the Tooltip. Those are primary_site, primary_histology, mutation(aa), pubmedID. |
| Genomic Position | Mutation(aa) | Unique sampleID count |
| chr12:6952178 | p.C148F,GNB3 | 1 |
| chr12:6954923 | p.S264F,GNB3 | 1 |
| chr12:6952808 | p.E5E,GNB3 | 1 |
| chr12:6954758 | p.E171K,GNB3 | 1 |
| chr12:6952179 | p.E266K,GNB3 | 1 |
| chr12:6954960 | p.D20G,GNB3 | 1 |
| chr12:6952957 | p.Q174Q,GNB3 | 1 |
| chr12:6954785 | p.T273T,GNB3 | 1 |
| chr12:6952186 | p.A24P,GNB3 | 1 |
| chr12:6952968 | p.T183T,GNB3 | 1 |
| * Copy number data were extracted from TCGA using R package TCGA-Assembler. The URLs of all public data files on TCGA DCC data server were gathered on Jan-05-2015. Function ProcessCNAData in TCGA-Assembler package was used to obtain gene-level copy number value which is calculated as the average copy number of the genomic region of a gene. |
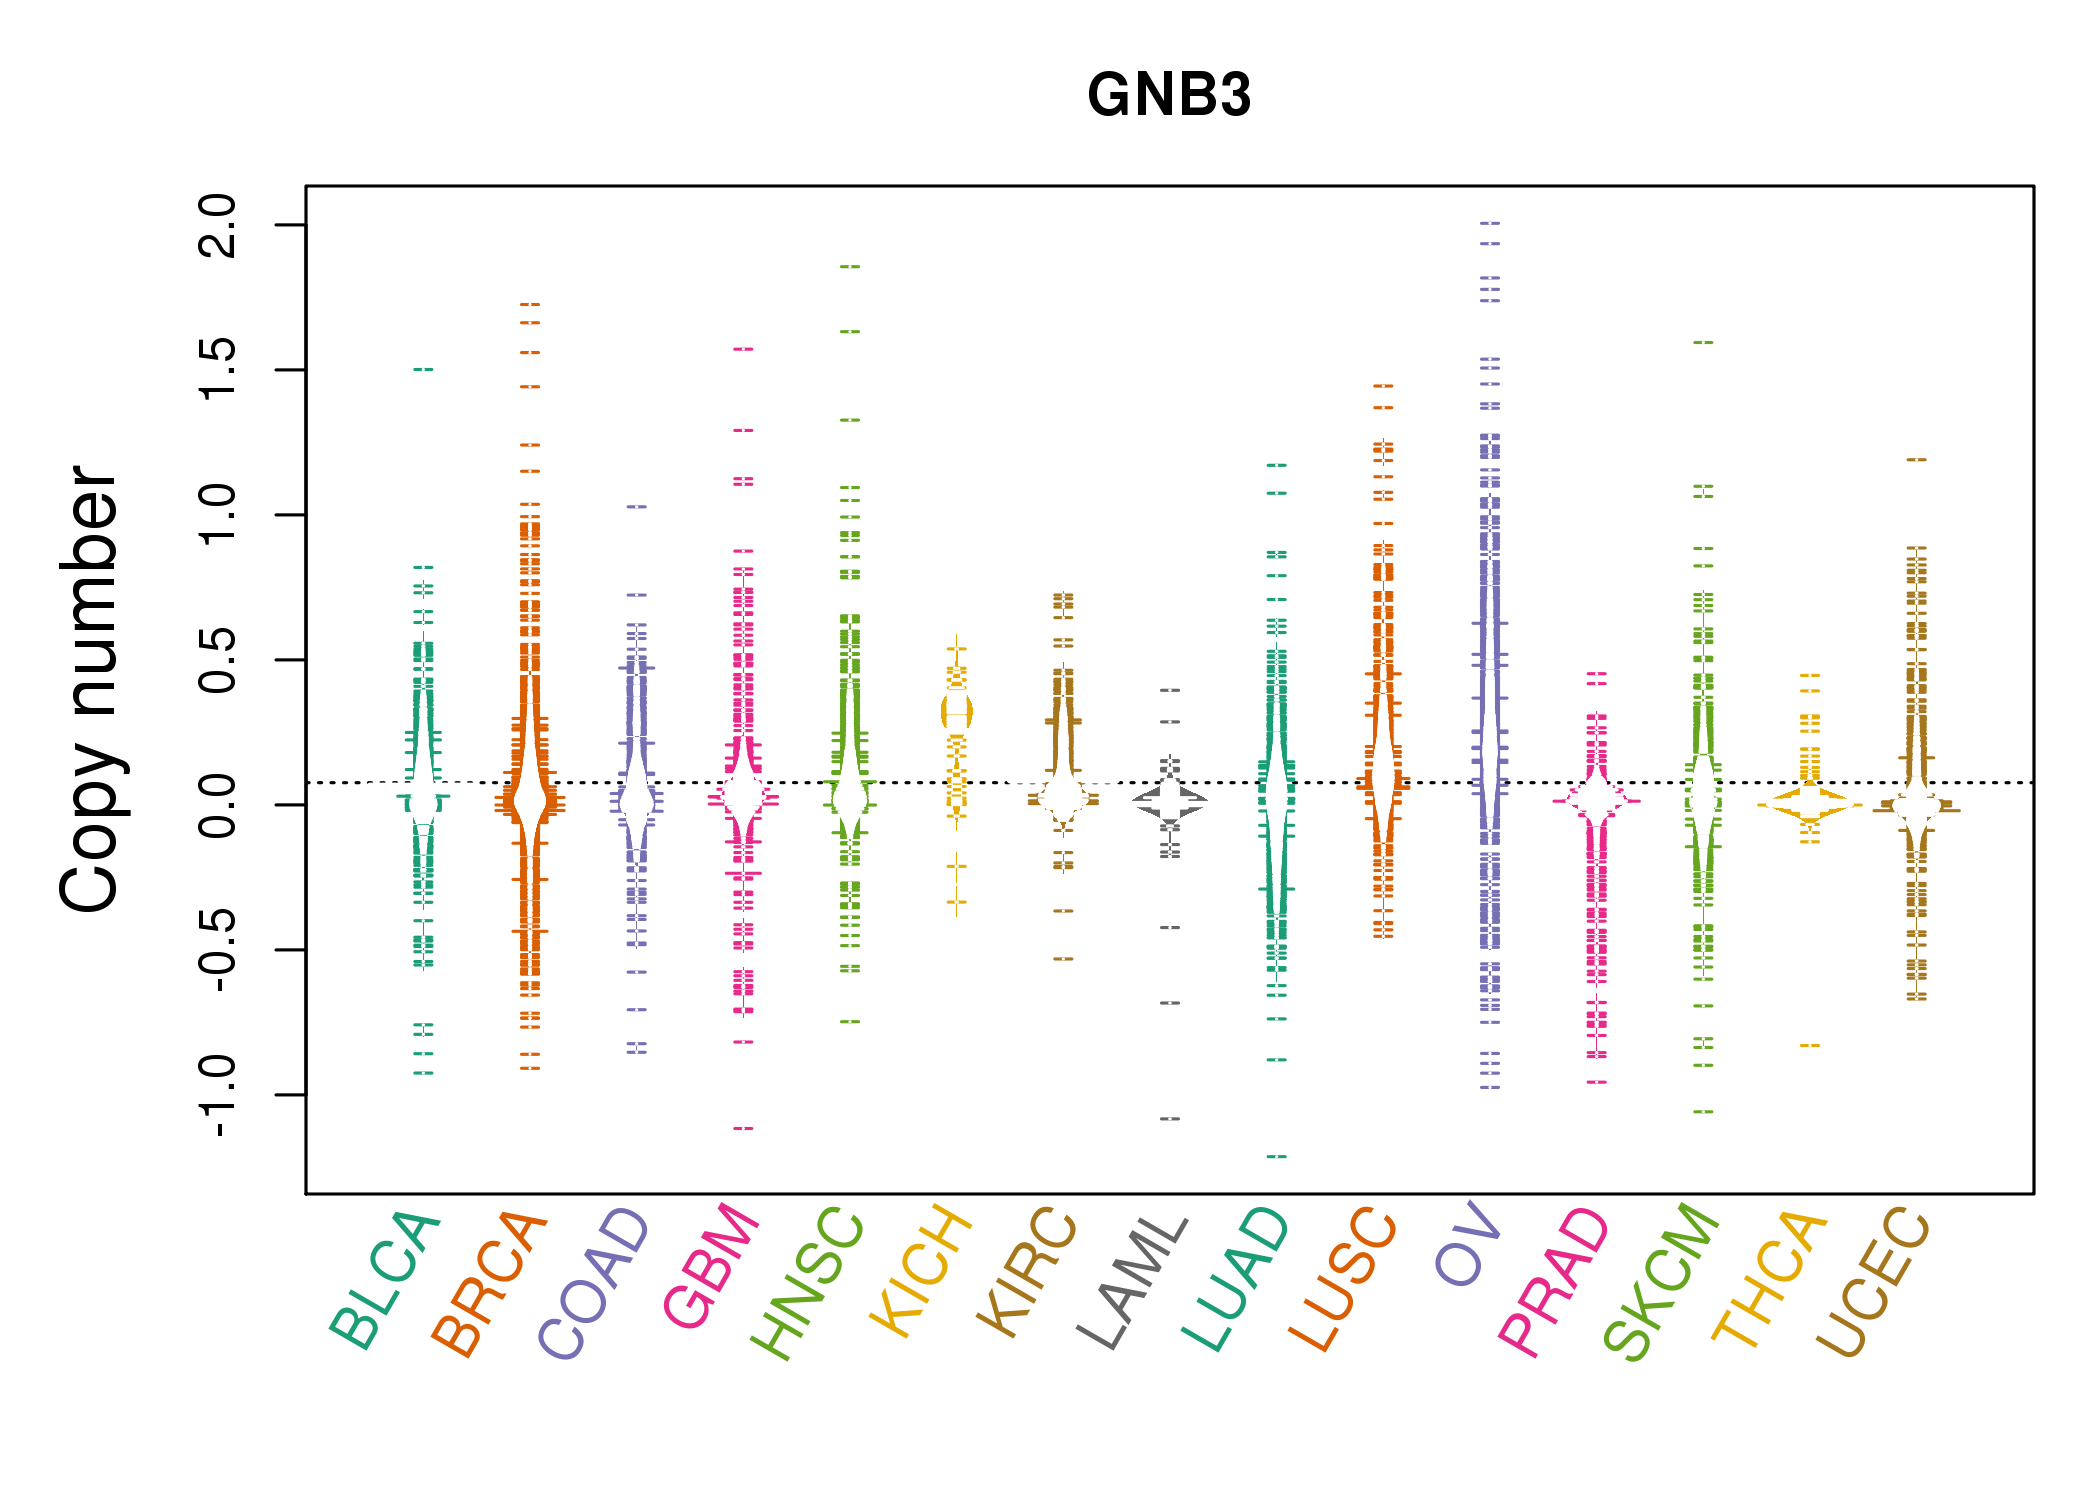 |
| cf) Tissue ID[Tissue type]: BLCA[Bladder Urothelial Carcinoma], BRCA[Breast invasive carcinoma], CESC[Cervical squamous cell carcinoma and endocervical adenocarcinoma], COAD[Colon adenocarcinoma], GBM[Glioblastoma multiforme], Glioma Low Grade, HNSC[Head and Neck squamous cell carcinoma], KICH[Kidney Chromophobe], KIRC[Kidney renal clear cell carcinoma], KIRP[Kidney renal papillary cell carcinoma], LAML[Acute Myeloid Leukemia], LUAD[Lung adenocarcinoma], LUSC[Lung squamous cell carcinoma], OV[Ovarian serous cystadenocarcinoma ], PAAD[Pancreatic adenocarcinoma], PRAD[Prostate adenocarcinoma], SKCM[Skin Cutaneous Melanoma], STAD[Stomach adenocarcinoma], THCA[Thyroid carcinoma], UCEC[Uterine Corpus Endometrial Carcinoma] |
| Top |
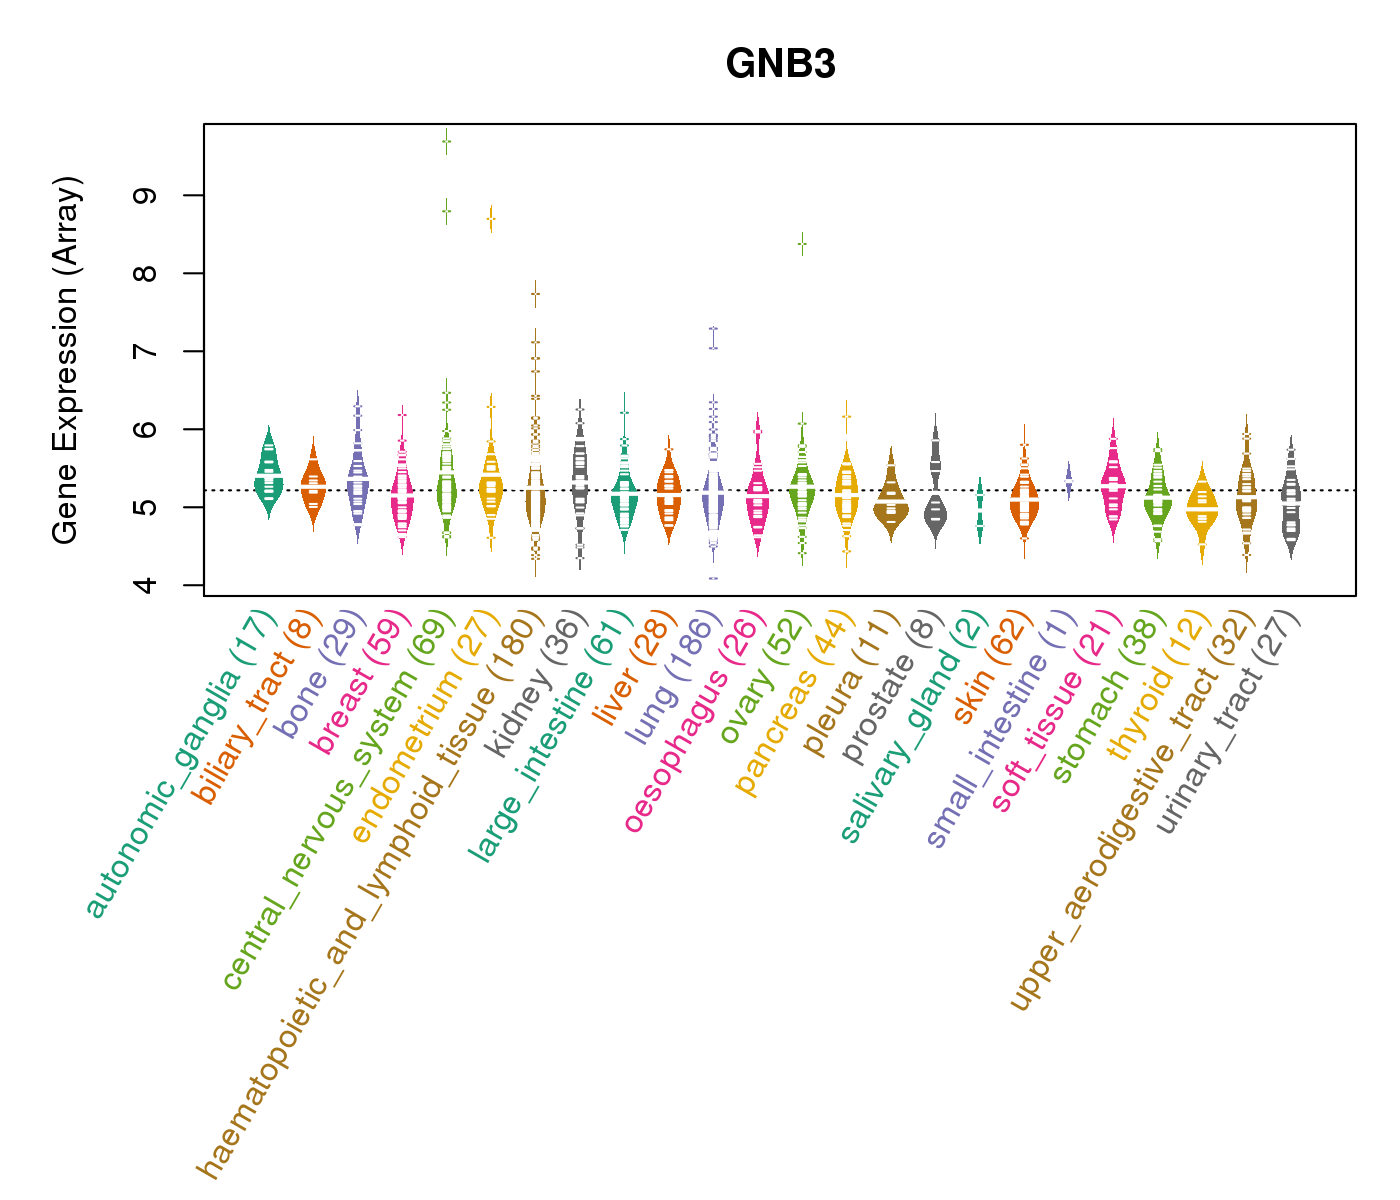
| Gene Expression for GNB3 |
| * CCLE gene expression data were extracted from CCLE_Expression_Entrez_2012-10-18.res: Gene-centric RMA-normalized mRNA expression data. |
 |
| * Normalized gene expression data of RNASeqV2 was extracted from TCGA using R package TCGA-Assembler. The URLs of all public data files on TCGA DCC data server were gathered at Jan-05-2015. Only eight cancer types have enough normal control samples for differential expression analysis. (t test, adjusted p<0.05 (using Benjamini-Hochberg FDR)) |
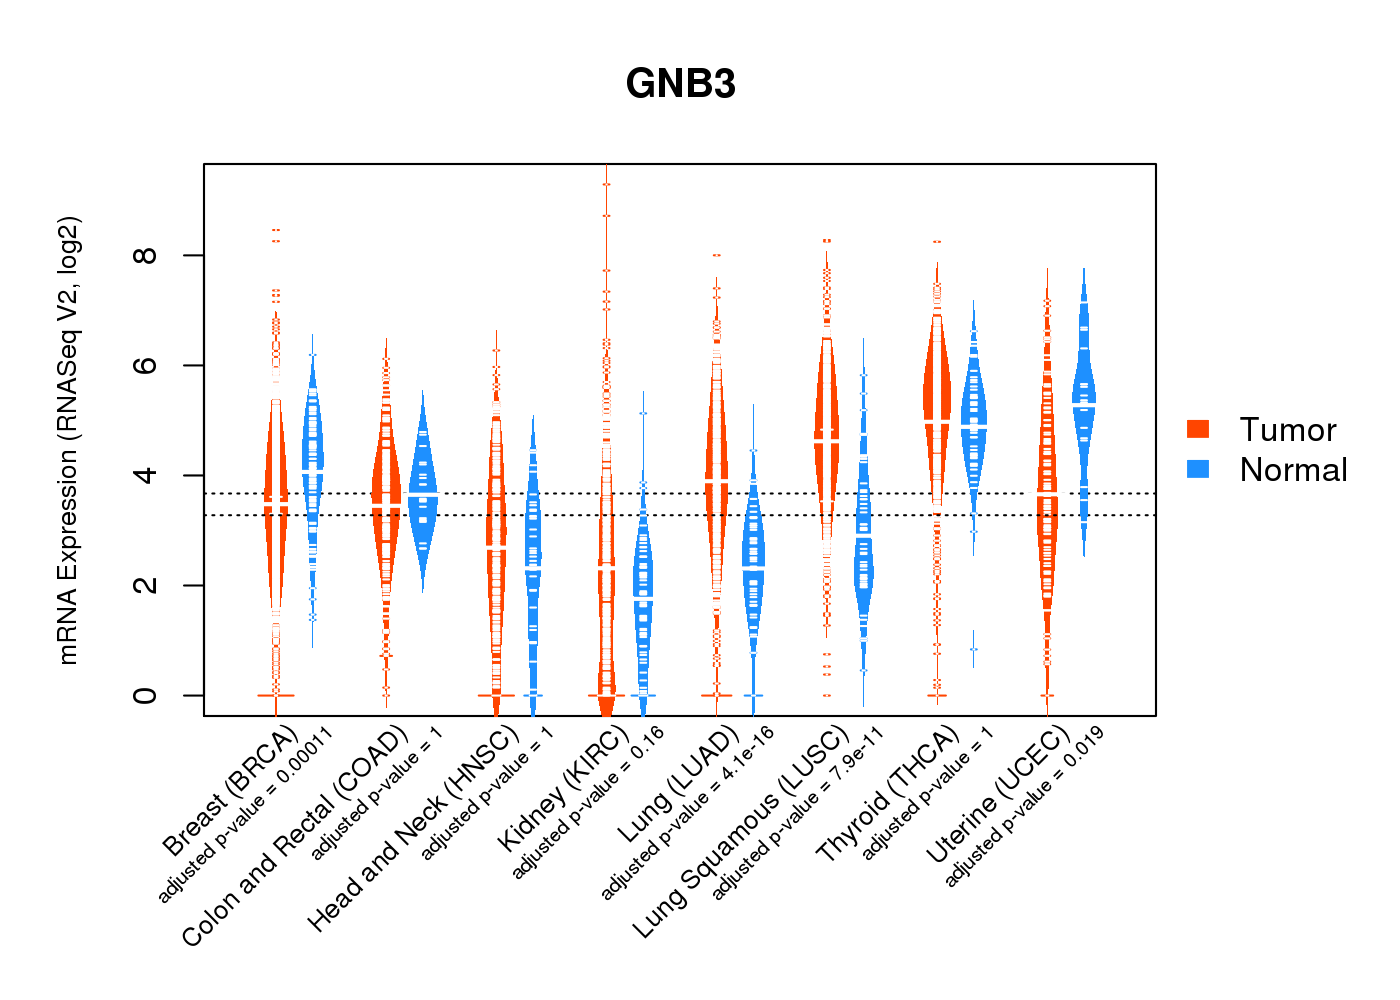 |
| Top |
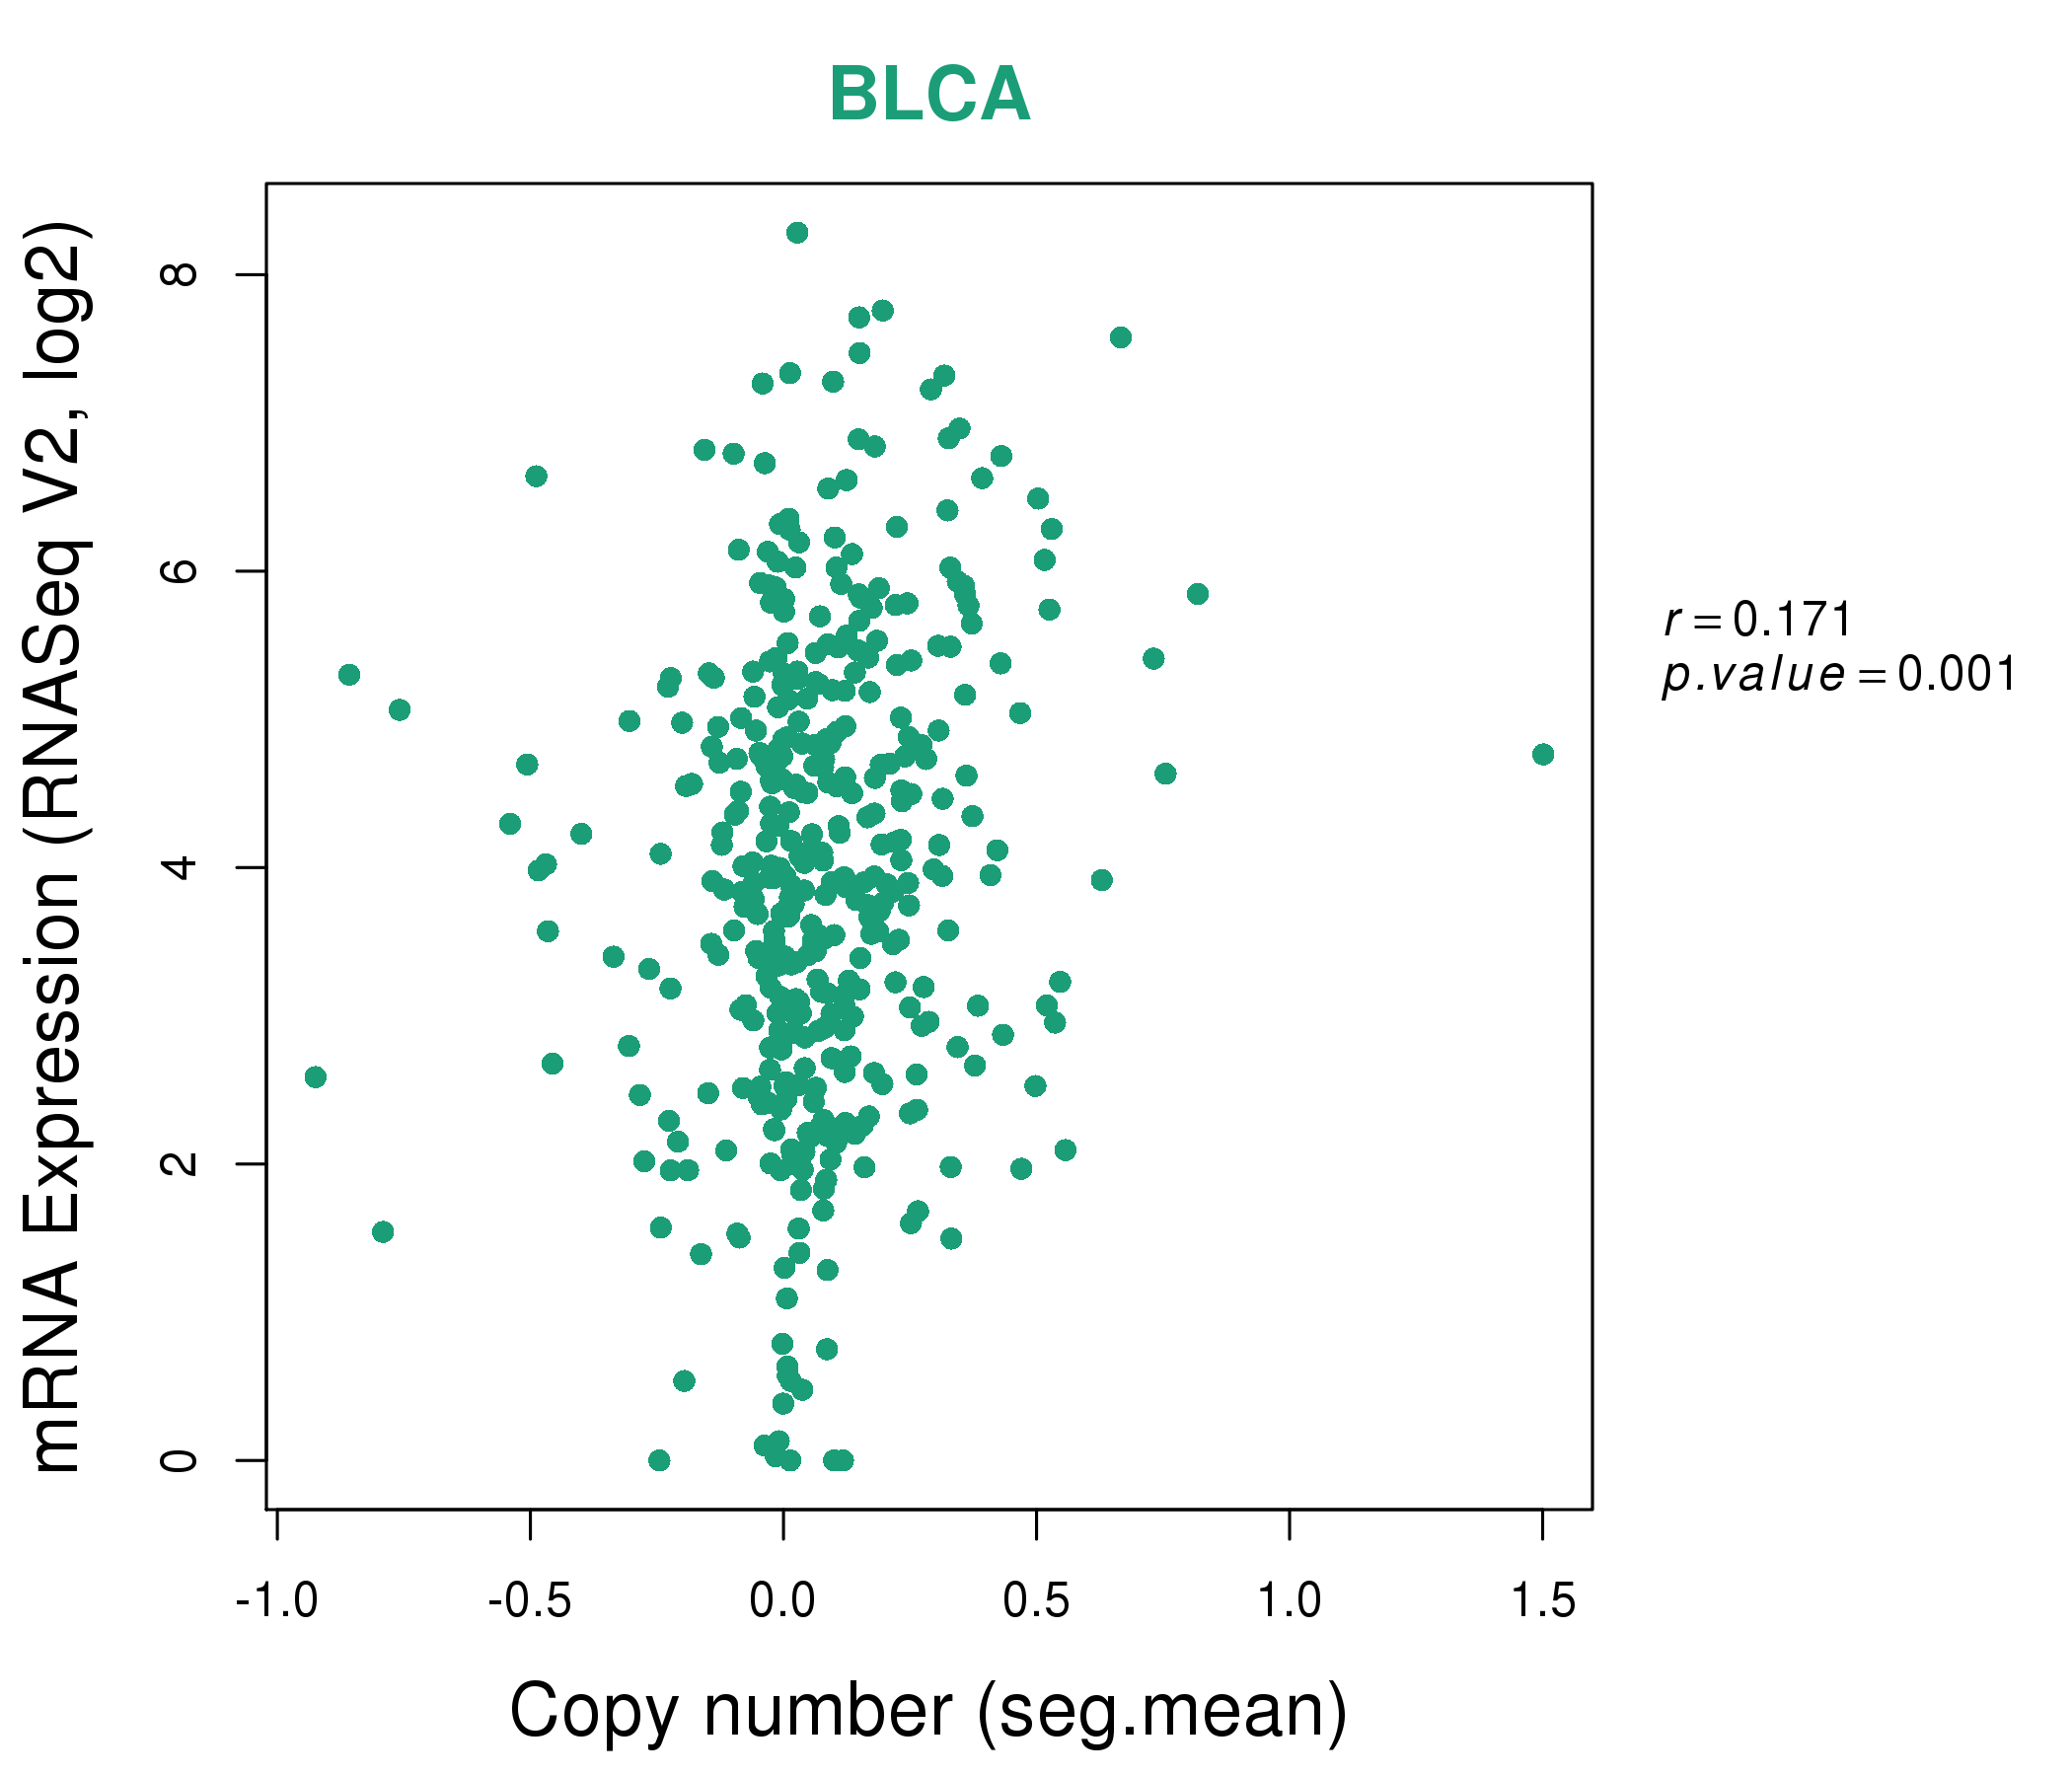
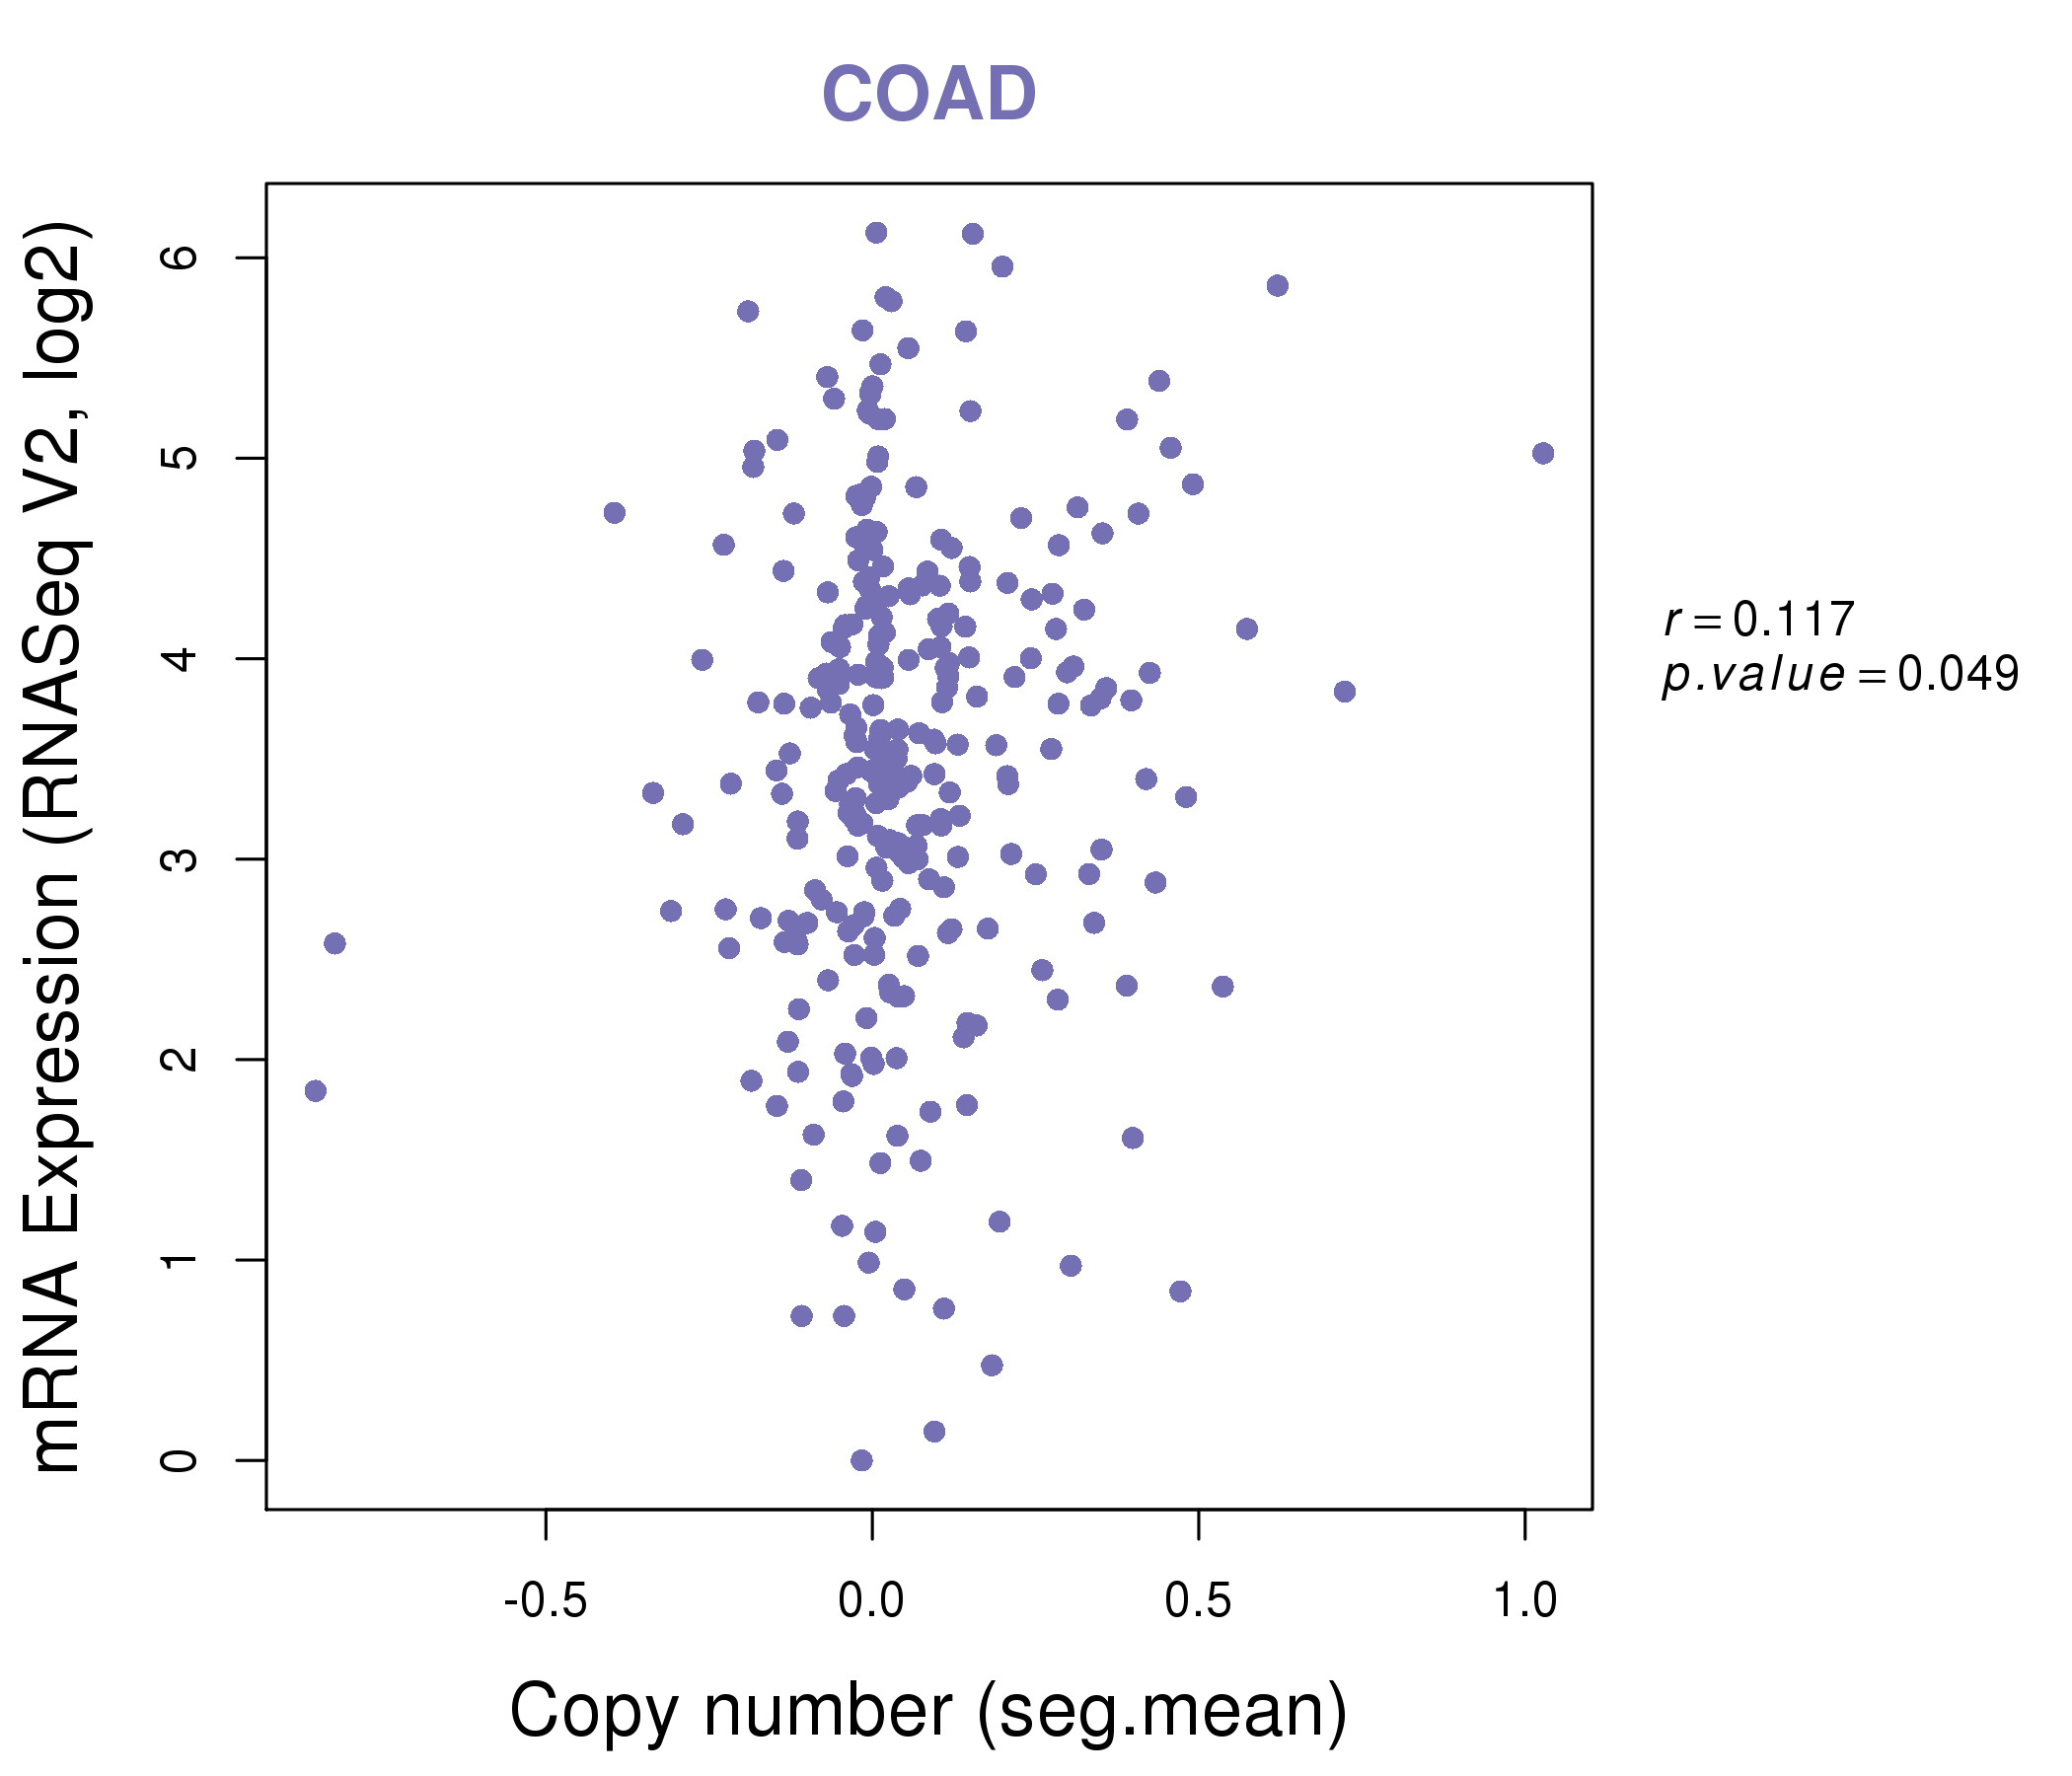
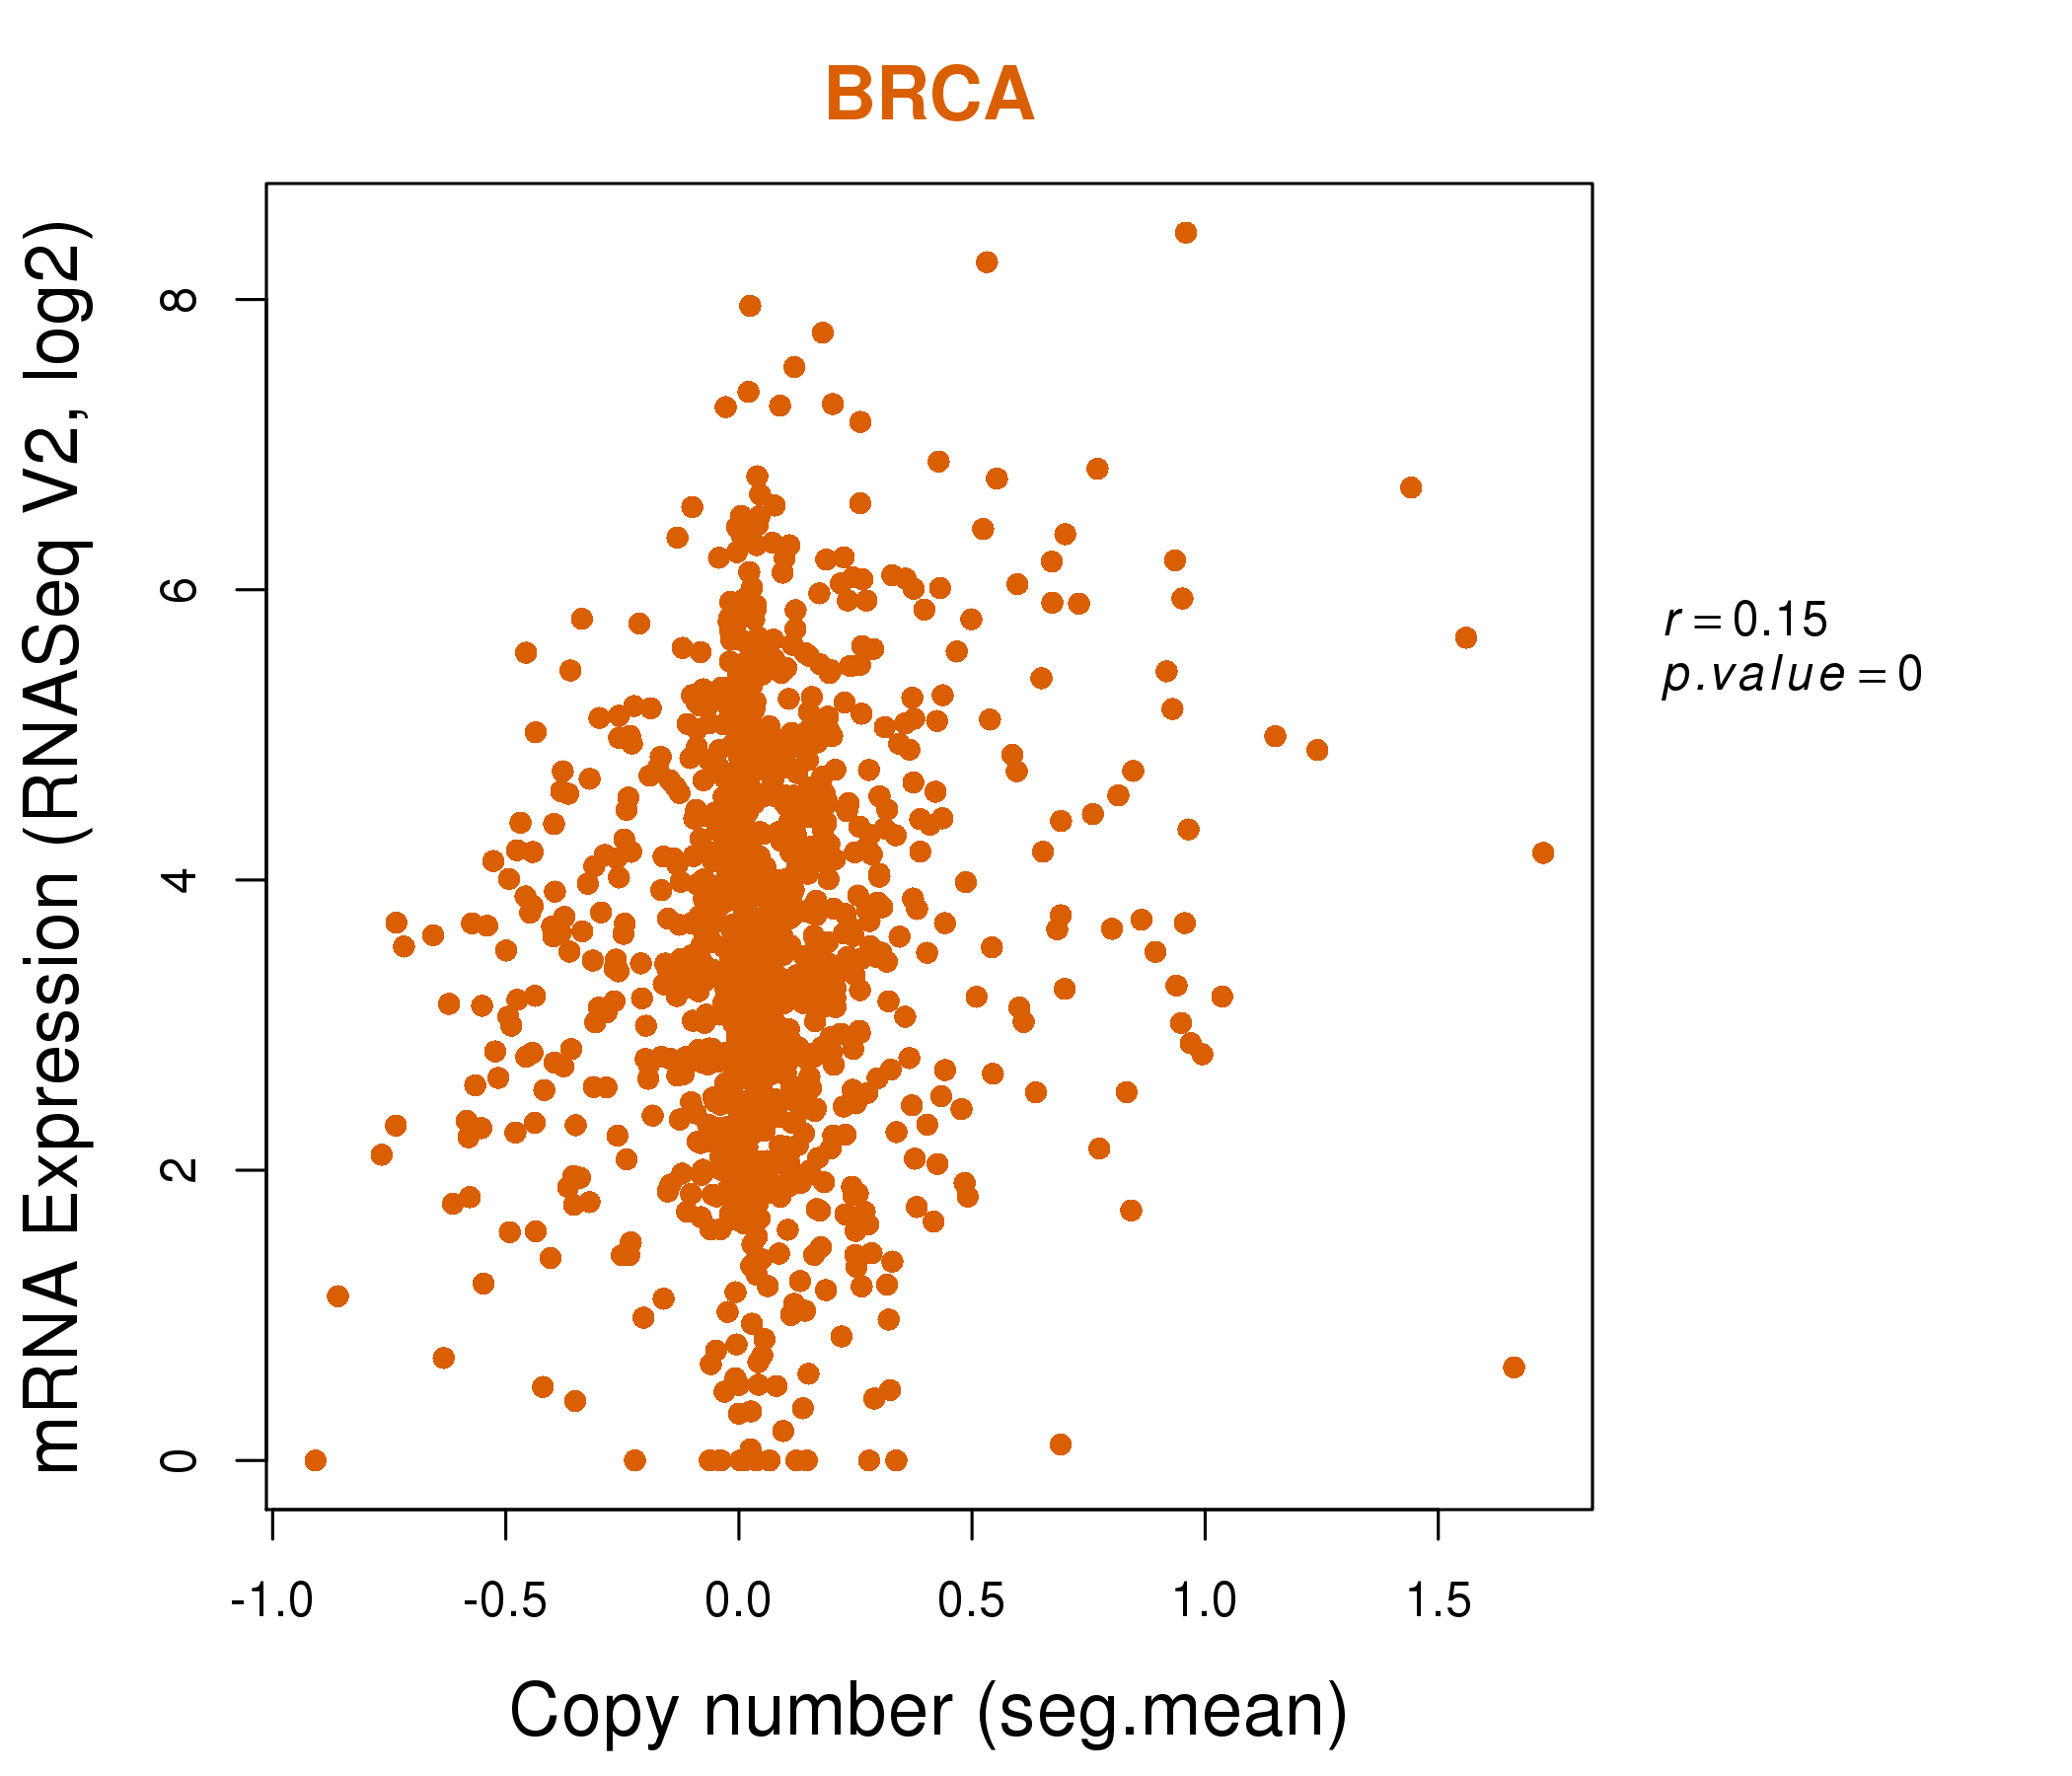
| * This plots show the correlation between CNV and gene expression. |
: Open all plots for all cancer types
 |
|
 |
|

| Top |
| Gene-Gene Network Information |
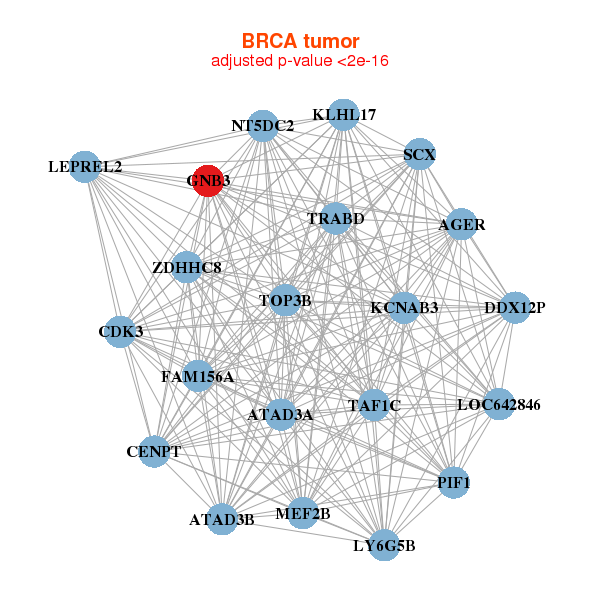
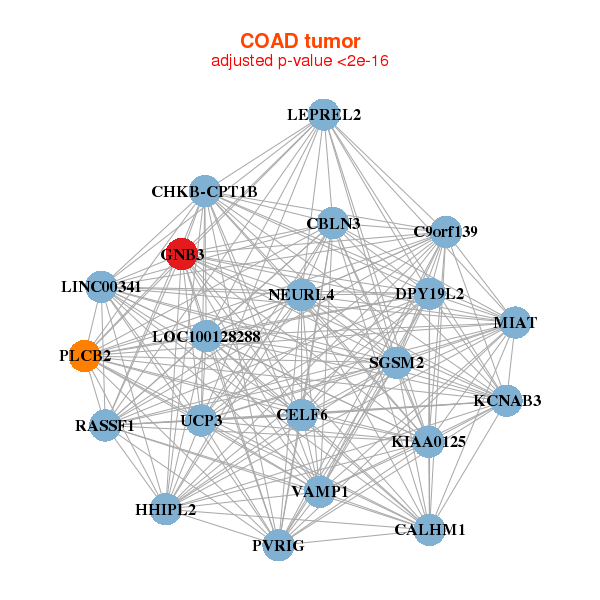
| * Co-Expression network figures were drawn using R package igraph. Only the top 20 genes with the highest correlations were shown. Red circle: input gene, orange circle: cell metabolism gene, sky circle: other gene |
: Open all plots for all cancer types
 |
| ||||
| AGER,ATAD3A,ATAD3B,CDK3,CENPT,DDX12P,FAM156A, GNB3,KCNAB3,KLHL17,LEPREL2,LOC642846,LY6G5B,MEF2B, NT5DC2,PIF1,SCX,TAF1C,TOP3B,TRABD,ZDHHC8 | AMT,ANKZF1,APBB3,ATG16L2,CCNL2,CENPT,DCST2, FAM193B,GNB3,HSF4,KAT2A,LUC7L,NEIL1,NSUN5P1, NSUN5P2,PABPC1L,SLC23A3,SNHG10,SNHG12,ZGLP1,ZNF692 | ||||
 |
| ||||
| LINC00341,C9orf139,CALHM1,CBLN3,CELF6,CHKB-CPT1B,DPY19L2, GNB3,HHIPL2,KCNAB3,KIAA0125,LEPREL2,LOC100128288,MIAT, NEURL4,PLCB2,PVRIG,RASSF1,SGSM2,UCP3,VAMP1 | CSF2RB,E2F3,EYA3,FCRL5,GLCCI1,GNB3,ITGA8, KCNA3,KLHL6,LAX1,NUP210,OSBPL3,PDE7A,PIK3CG, PIM2,PLCG2,POU2AF1,PRDM15,SEMA4A,SFMBT2,SYVN1 |


| * Co-Expression network figures were drawn using R package igraph. Only the top 20 genes with the highest correlations were shown. Red circle: input gene, orange circle: cell metabolism gene, sky circle: other gene |
: Open all plots for all cancer types
| Top |
: Open all interacting genes' information including KEGG pathway for all interacting genes from DAVID
| Top |
| Pharmacological Information for GNB3 |
| DB Category | DB Name | DB's ID and Url link |
| * Gene Centered Interaction Network. |
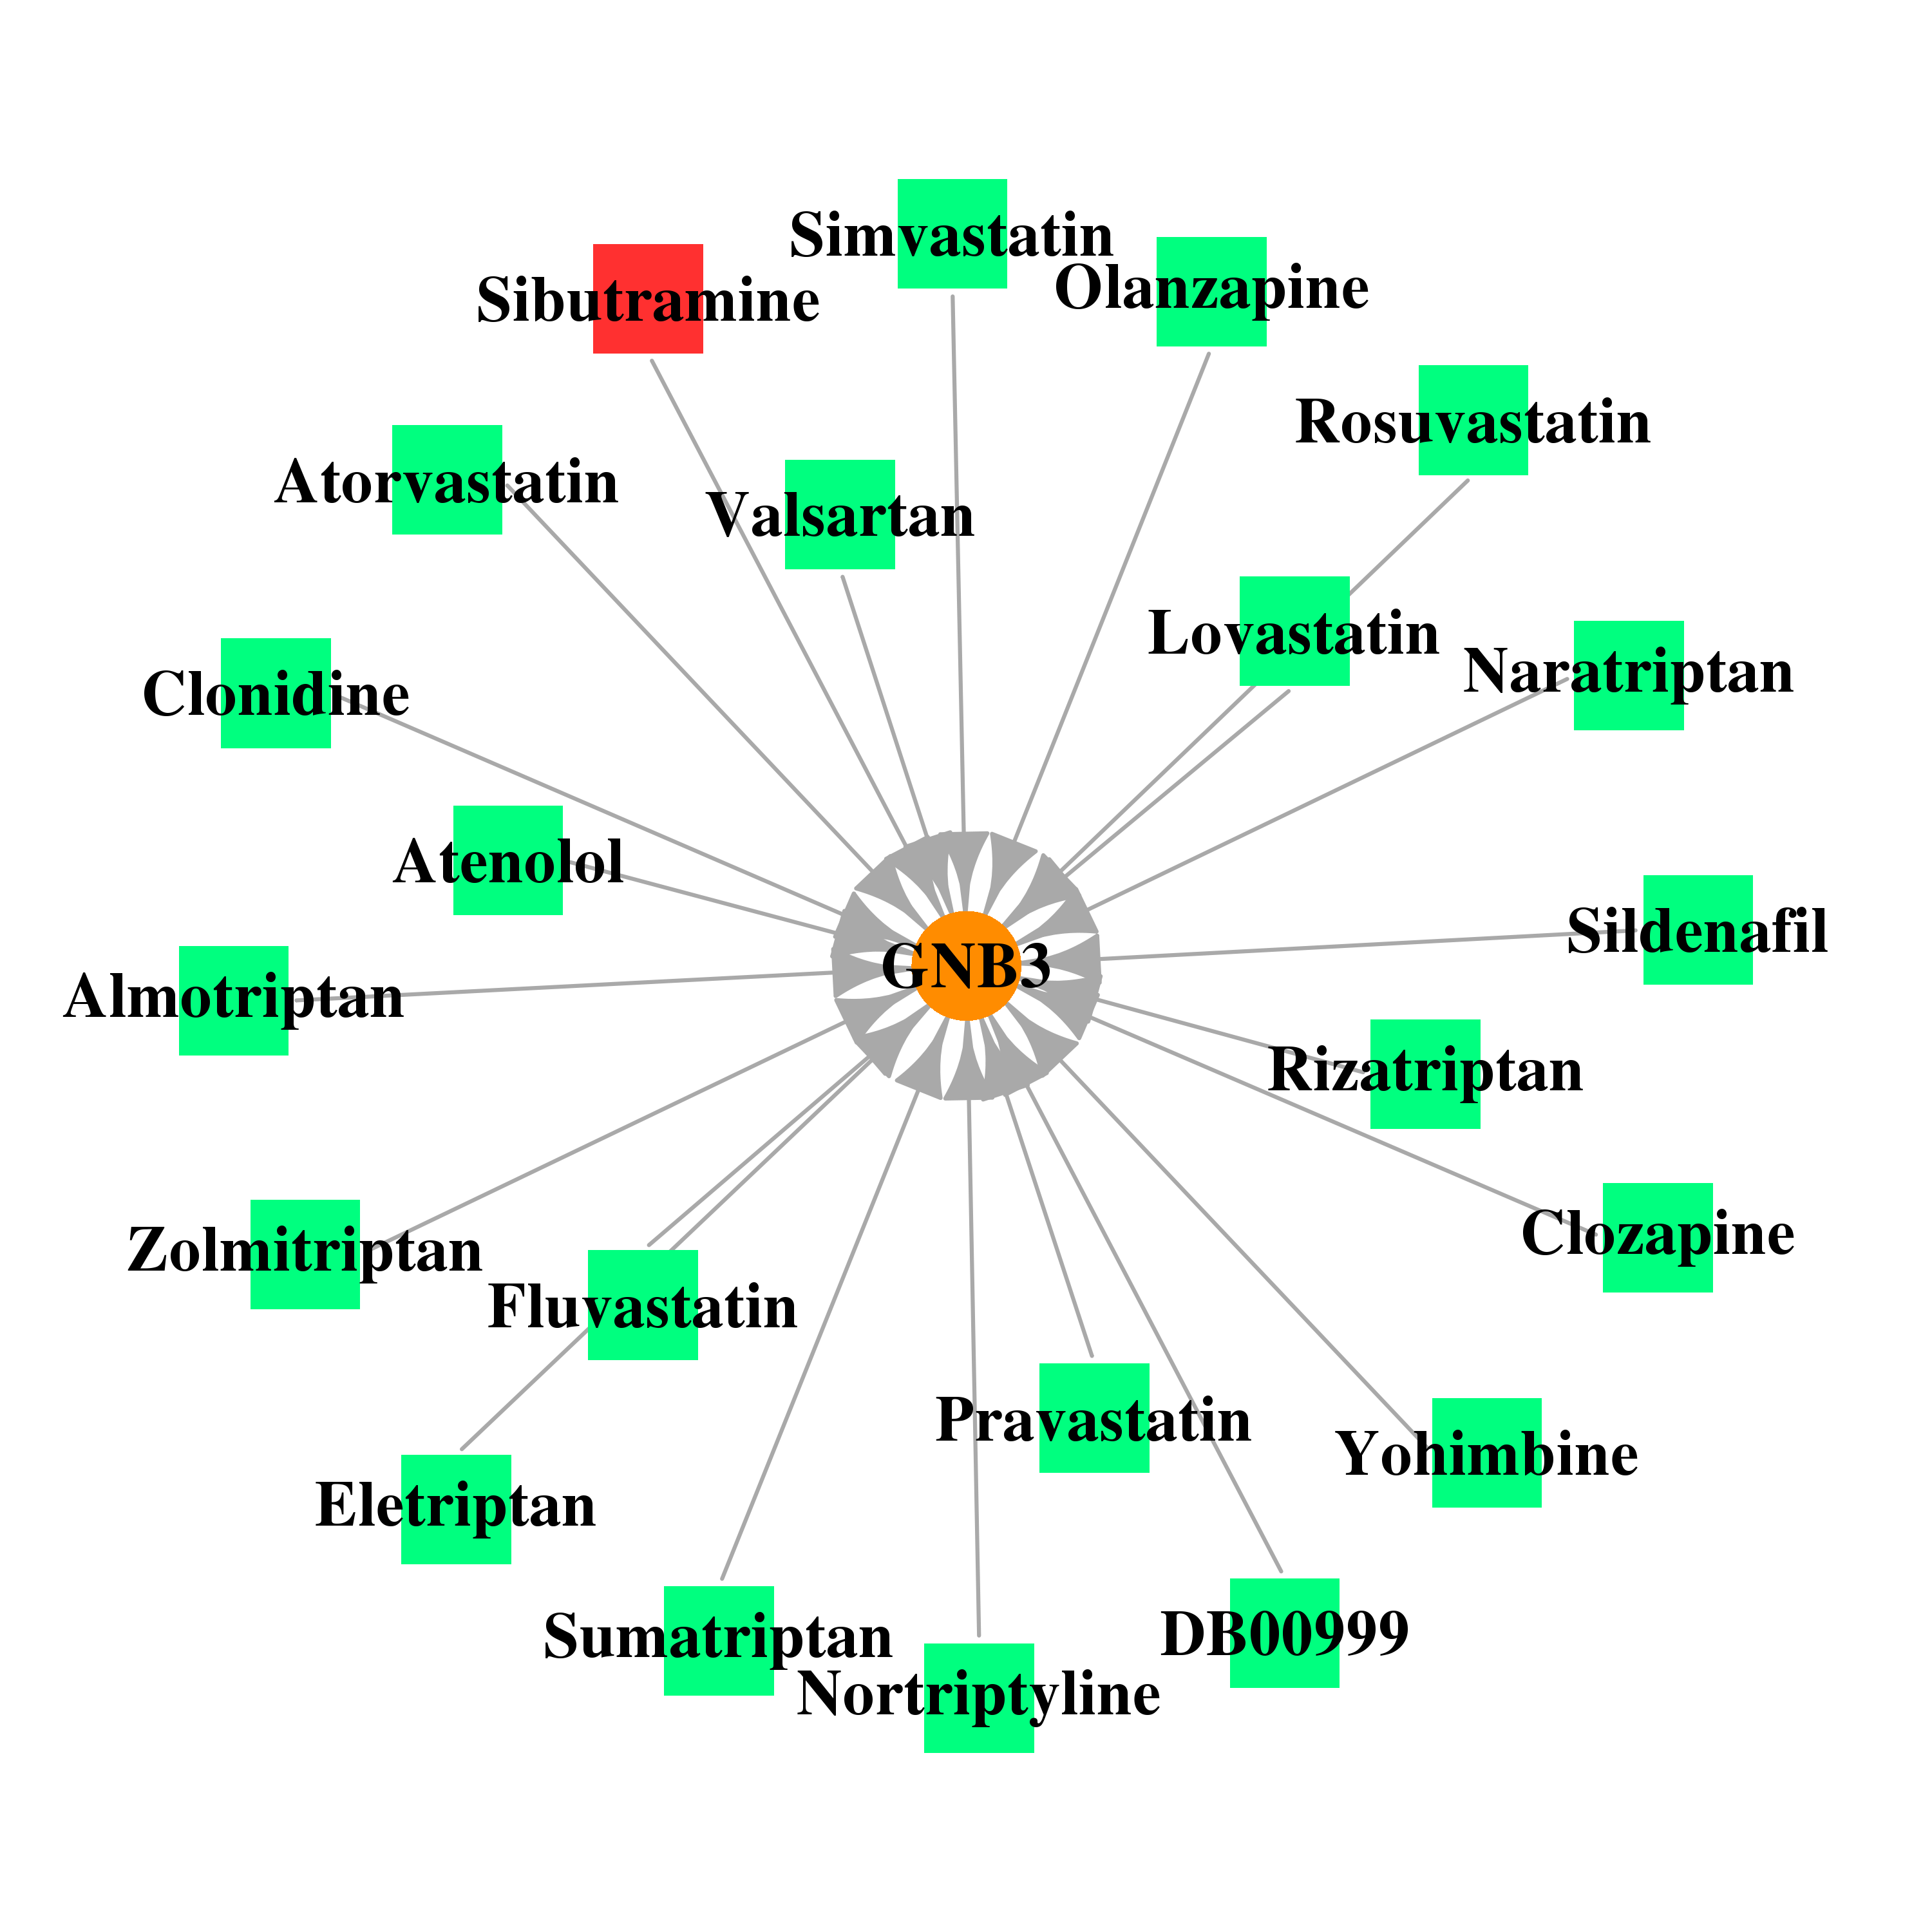 |
| * Drug Centered Interaction Network. |
| DrugBank ID | Target Name | Drug Groups | Generic Name | Drug Centered Network | Drug Structure |
| DB00575 | guanine nucleotide binding protein (G protein), beta polypeptide 3 | approved | Clonidine | 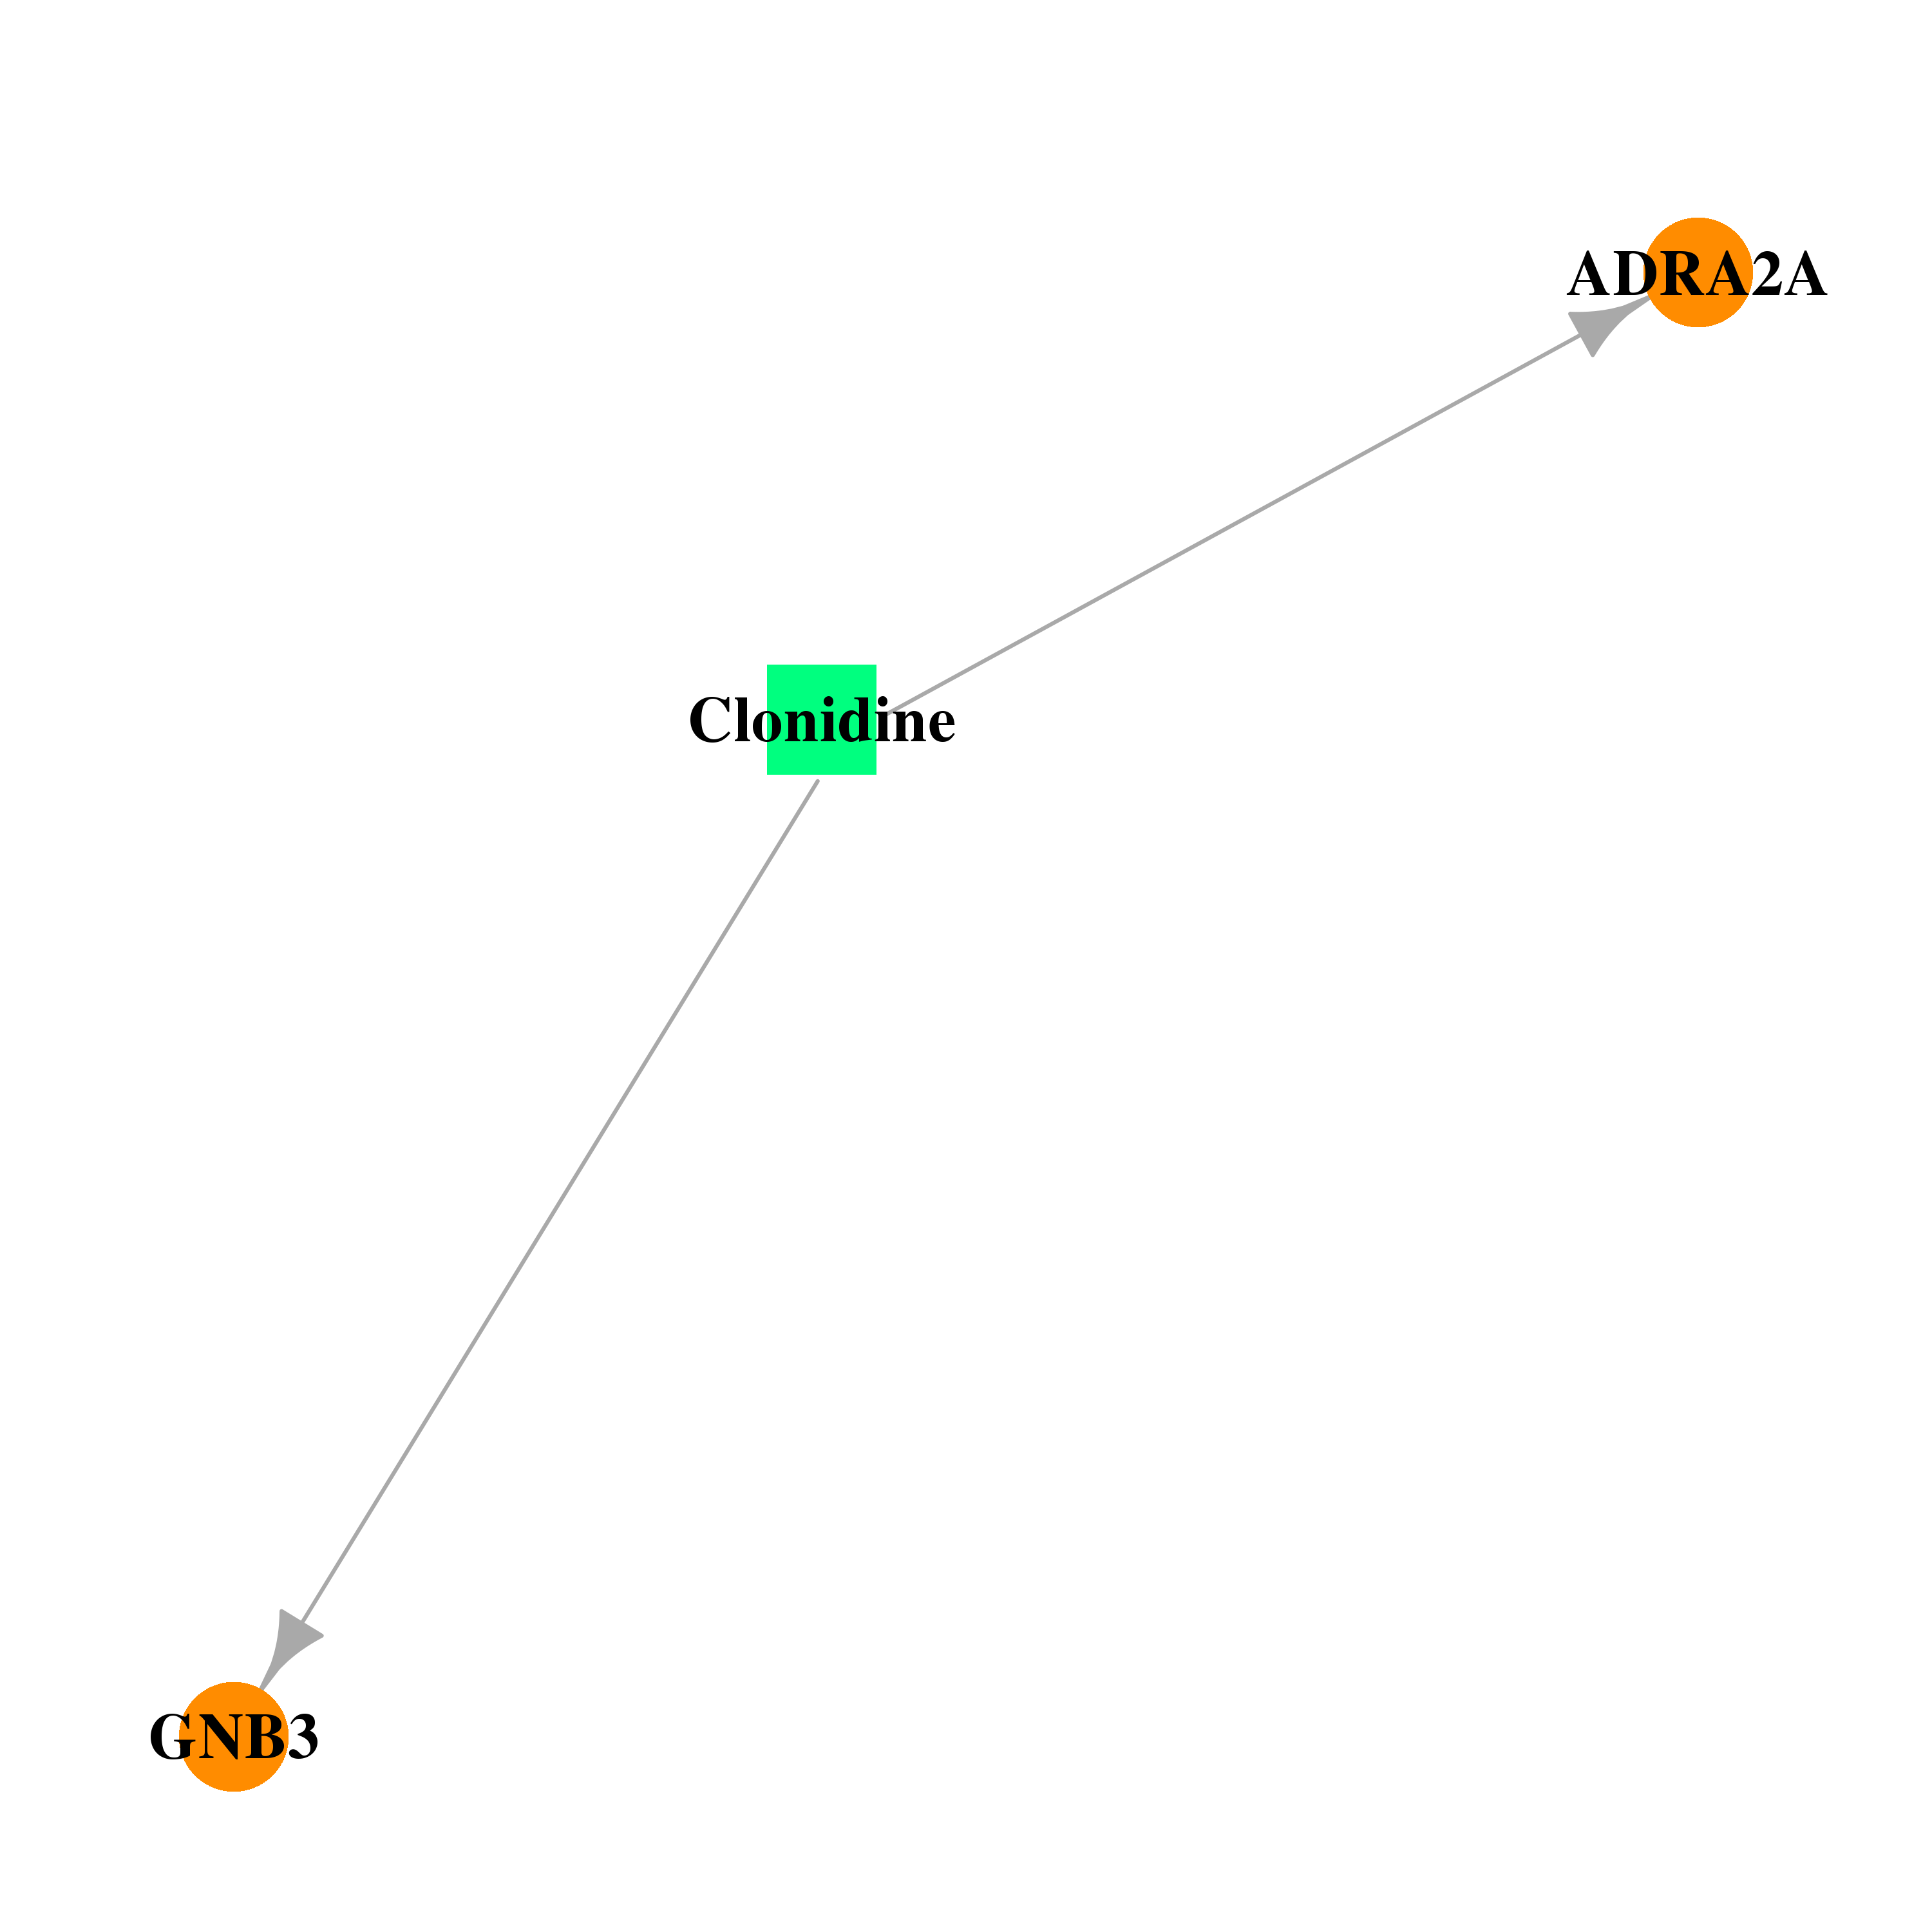 | 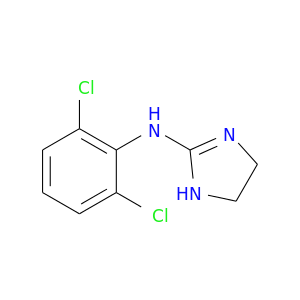 |
| DB00363 | guanine nucleotide binding protein (G protein), beta polypeptide 3 | approved | Clozapine | 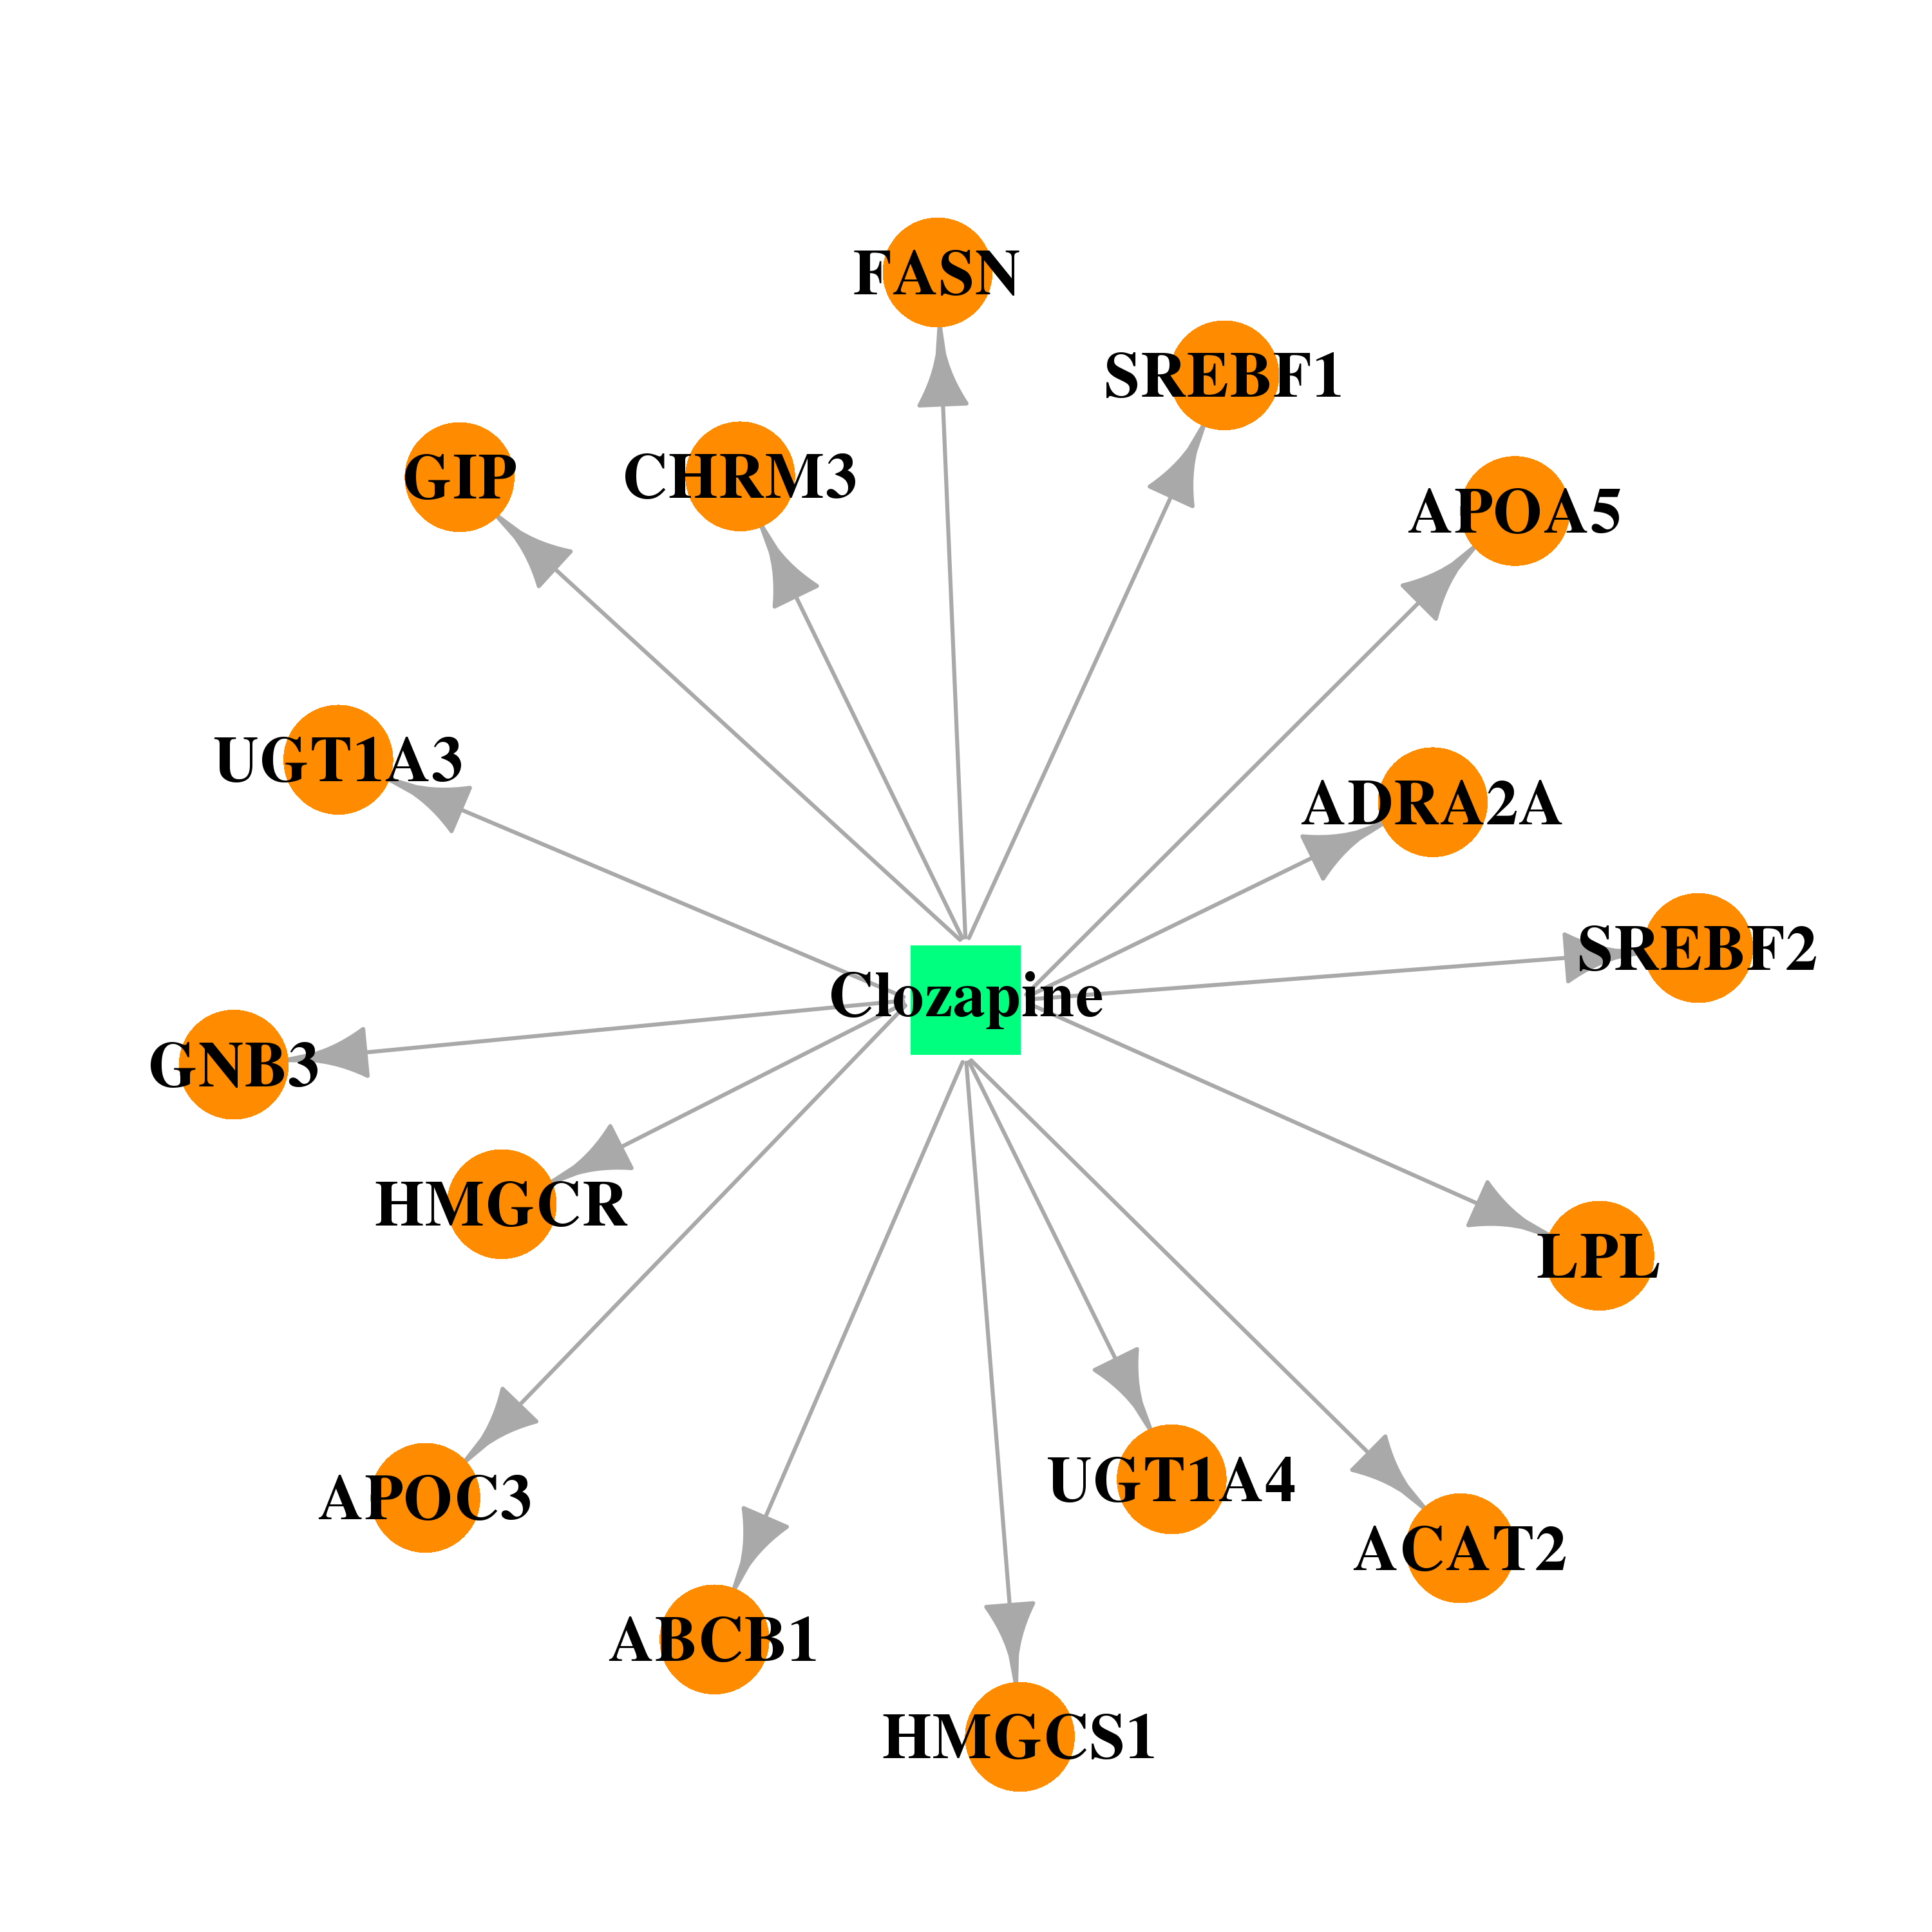 |  |
| DB00540 | guanine nucleotide binding protein (G protein), beta polypeptide 3 | approved | Nortriptyline | 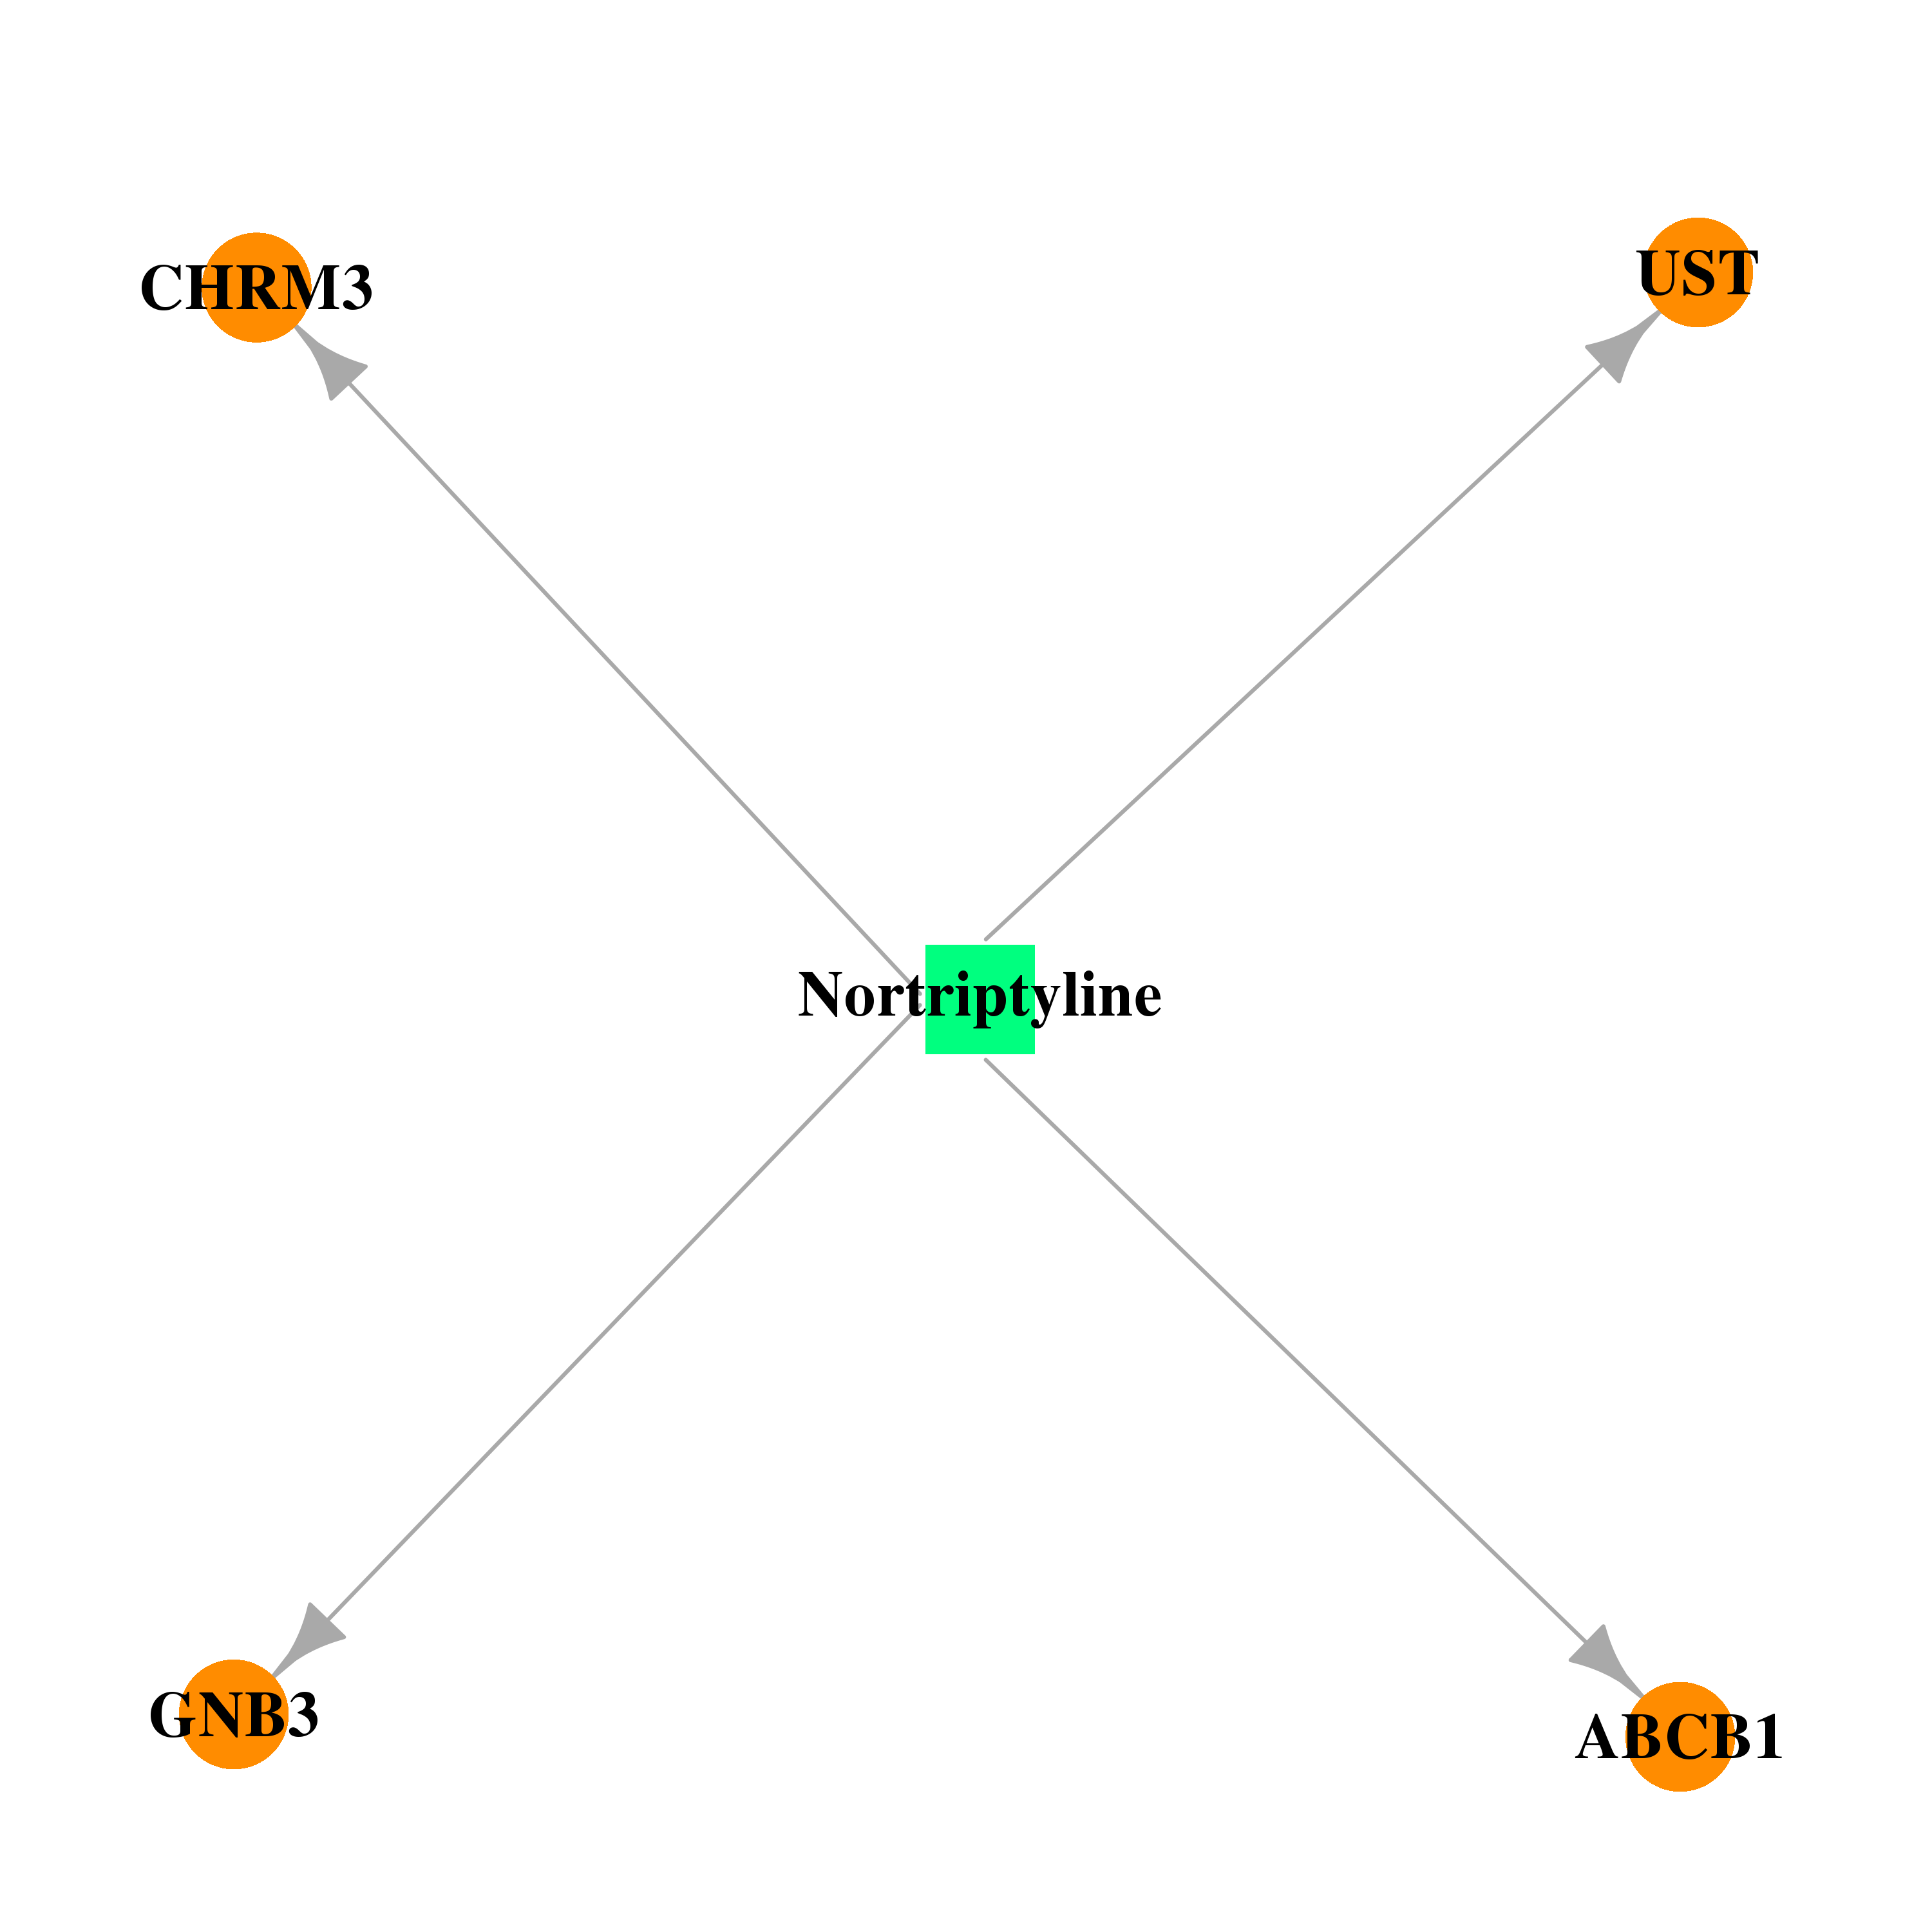 |  |
| DB00918 | guanine nucleotide binding protein (G protein), beta polypeptide 3 | approved; investigational | Almotriptan | 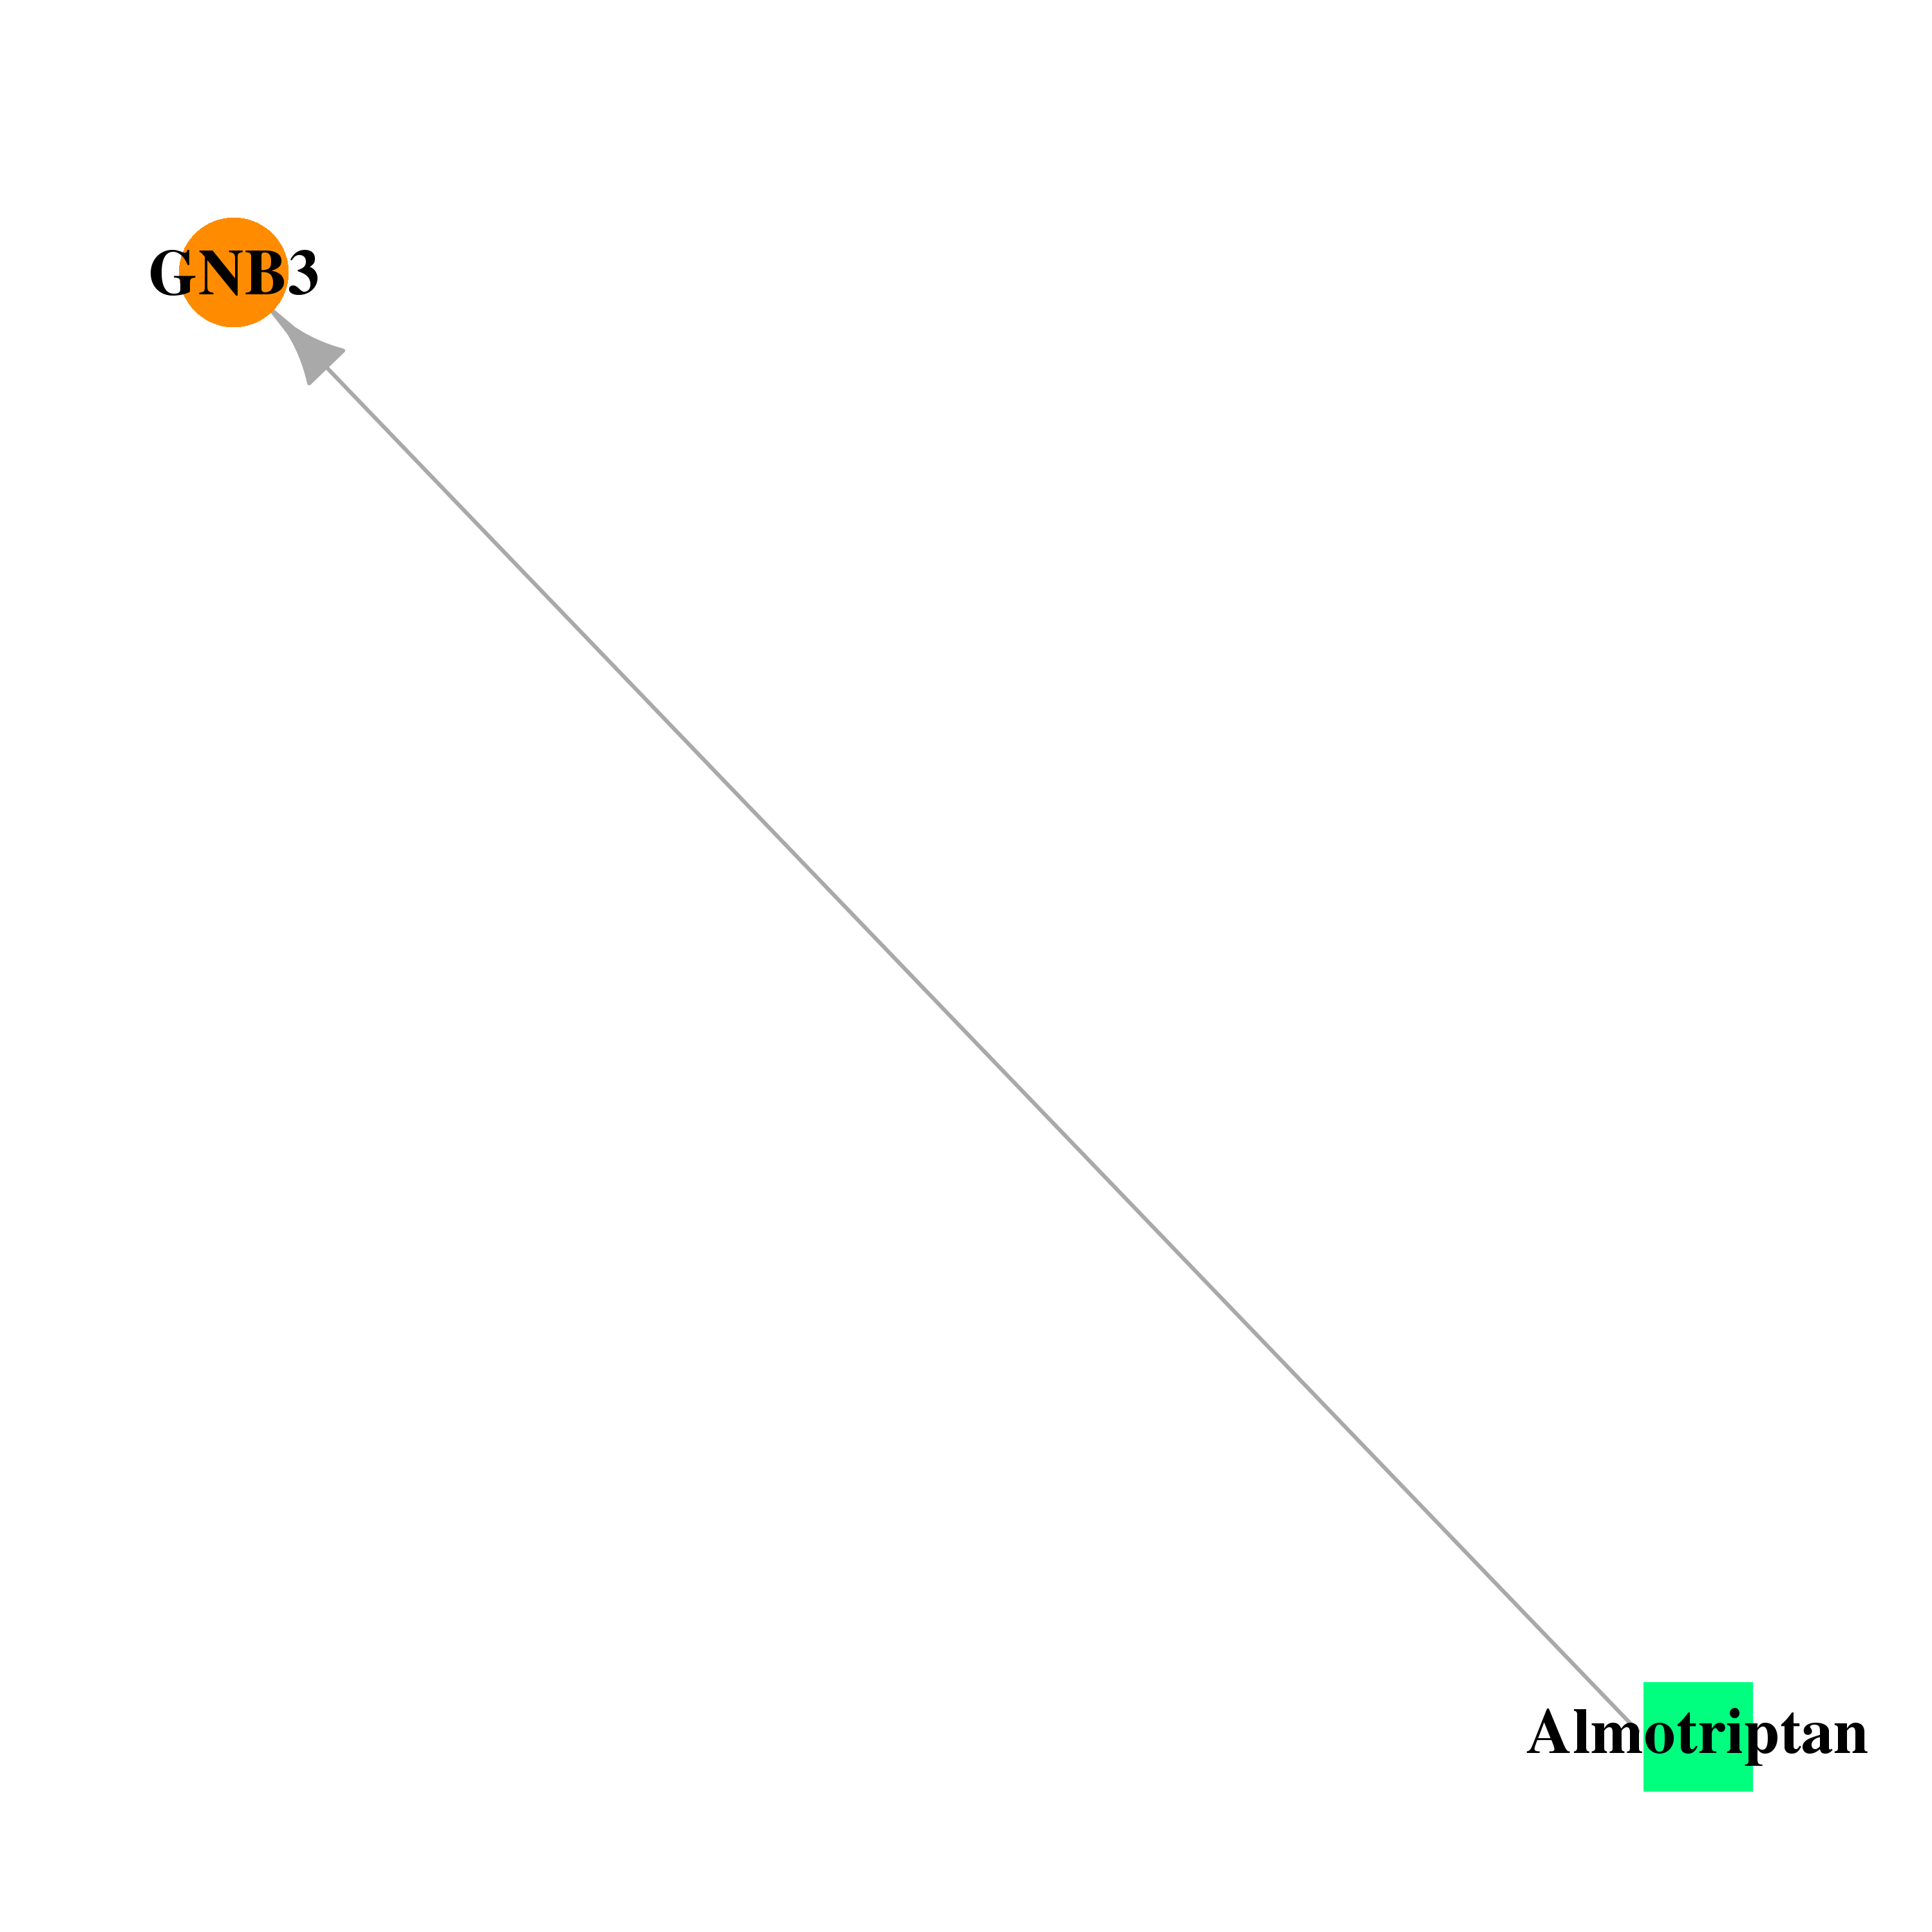 |  |
| DB00334 | guanine nucleotide binding protein (G protein), beta polypeptide 3 | approved; investigational | Olanzapine | 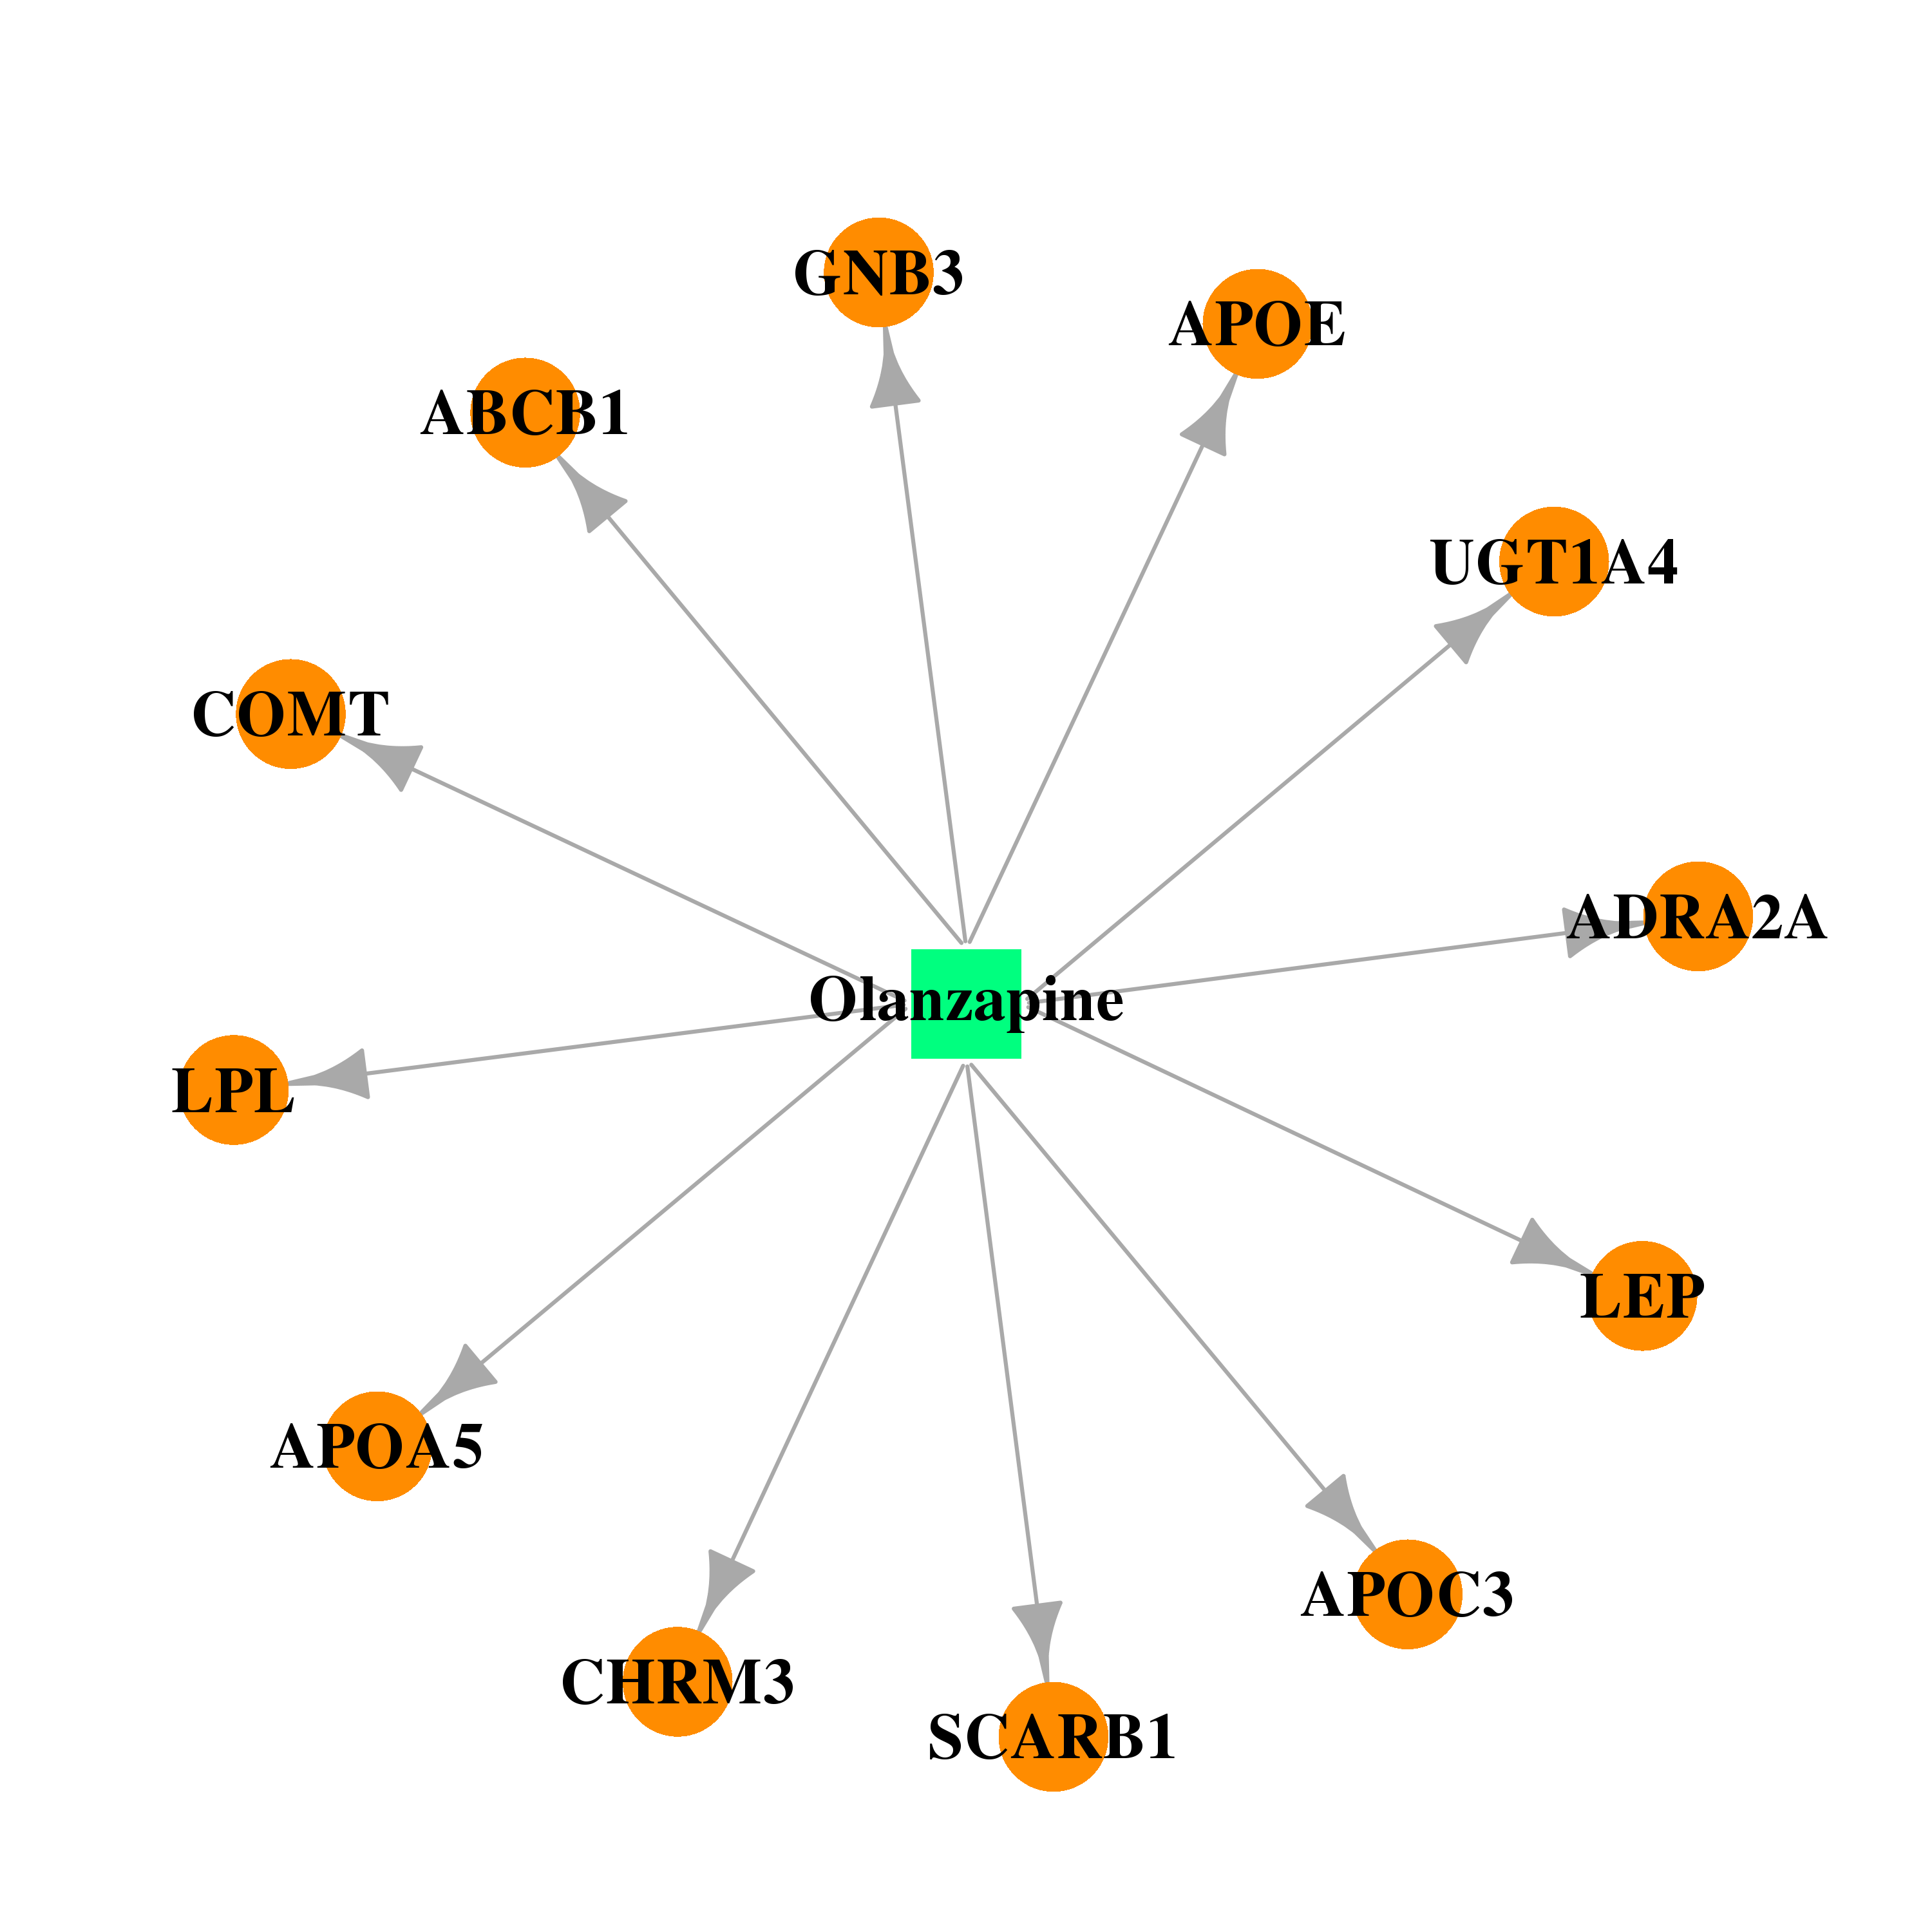 | 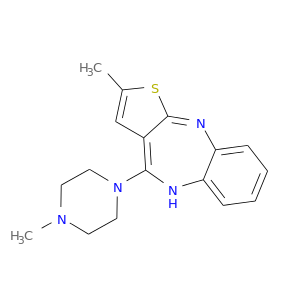 |
| DB00216 | guanine nucleotide binding protein (G protein), beta polypeptide 3 | approved; investigational | Eletriptan |  | 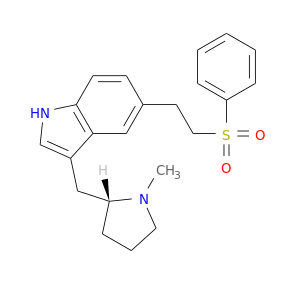 |
| DB00952 | guanine nucleotide binding protein (G protein), beta polypeptide 3 | approved; investigational | Naratriptan | 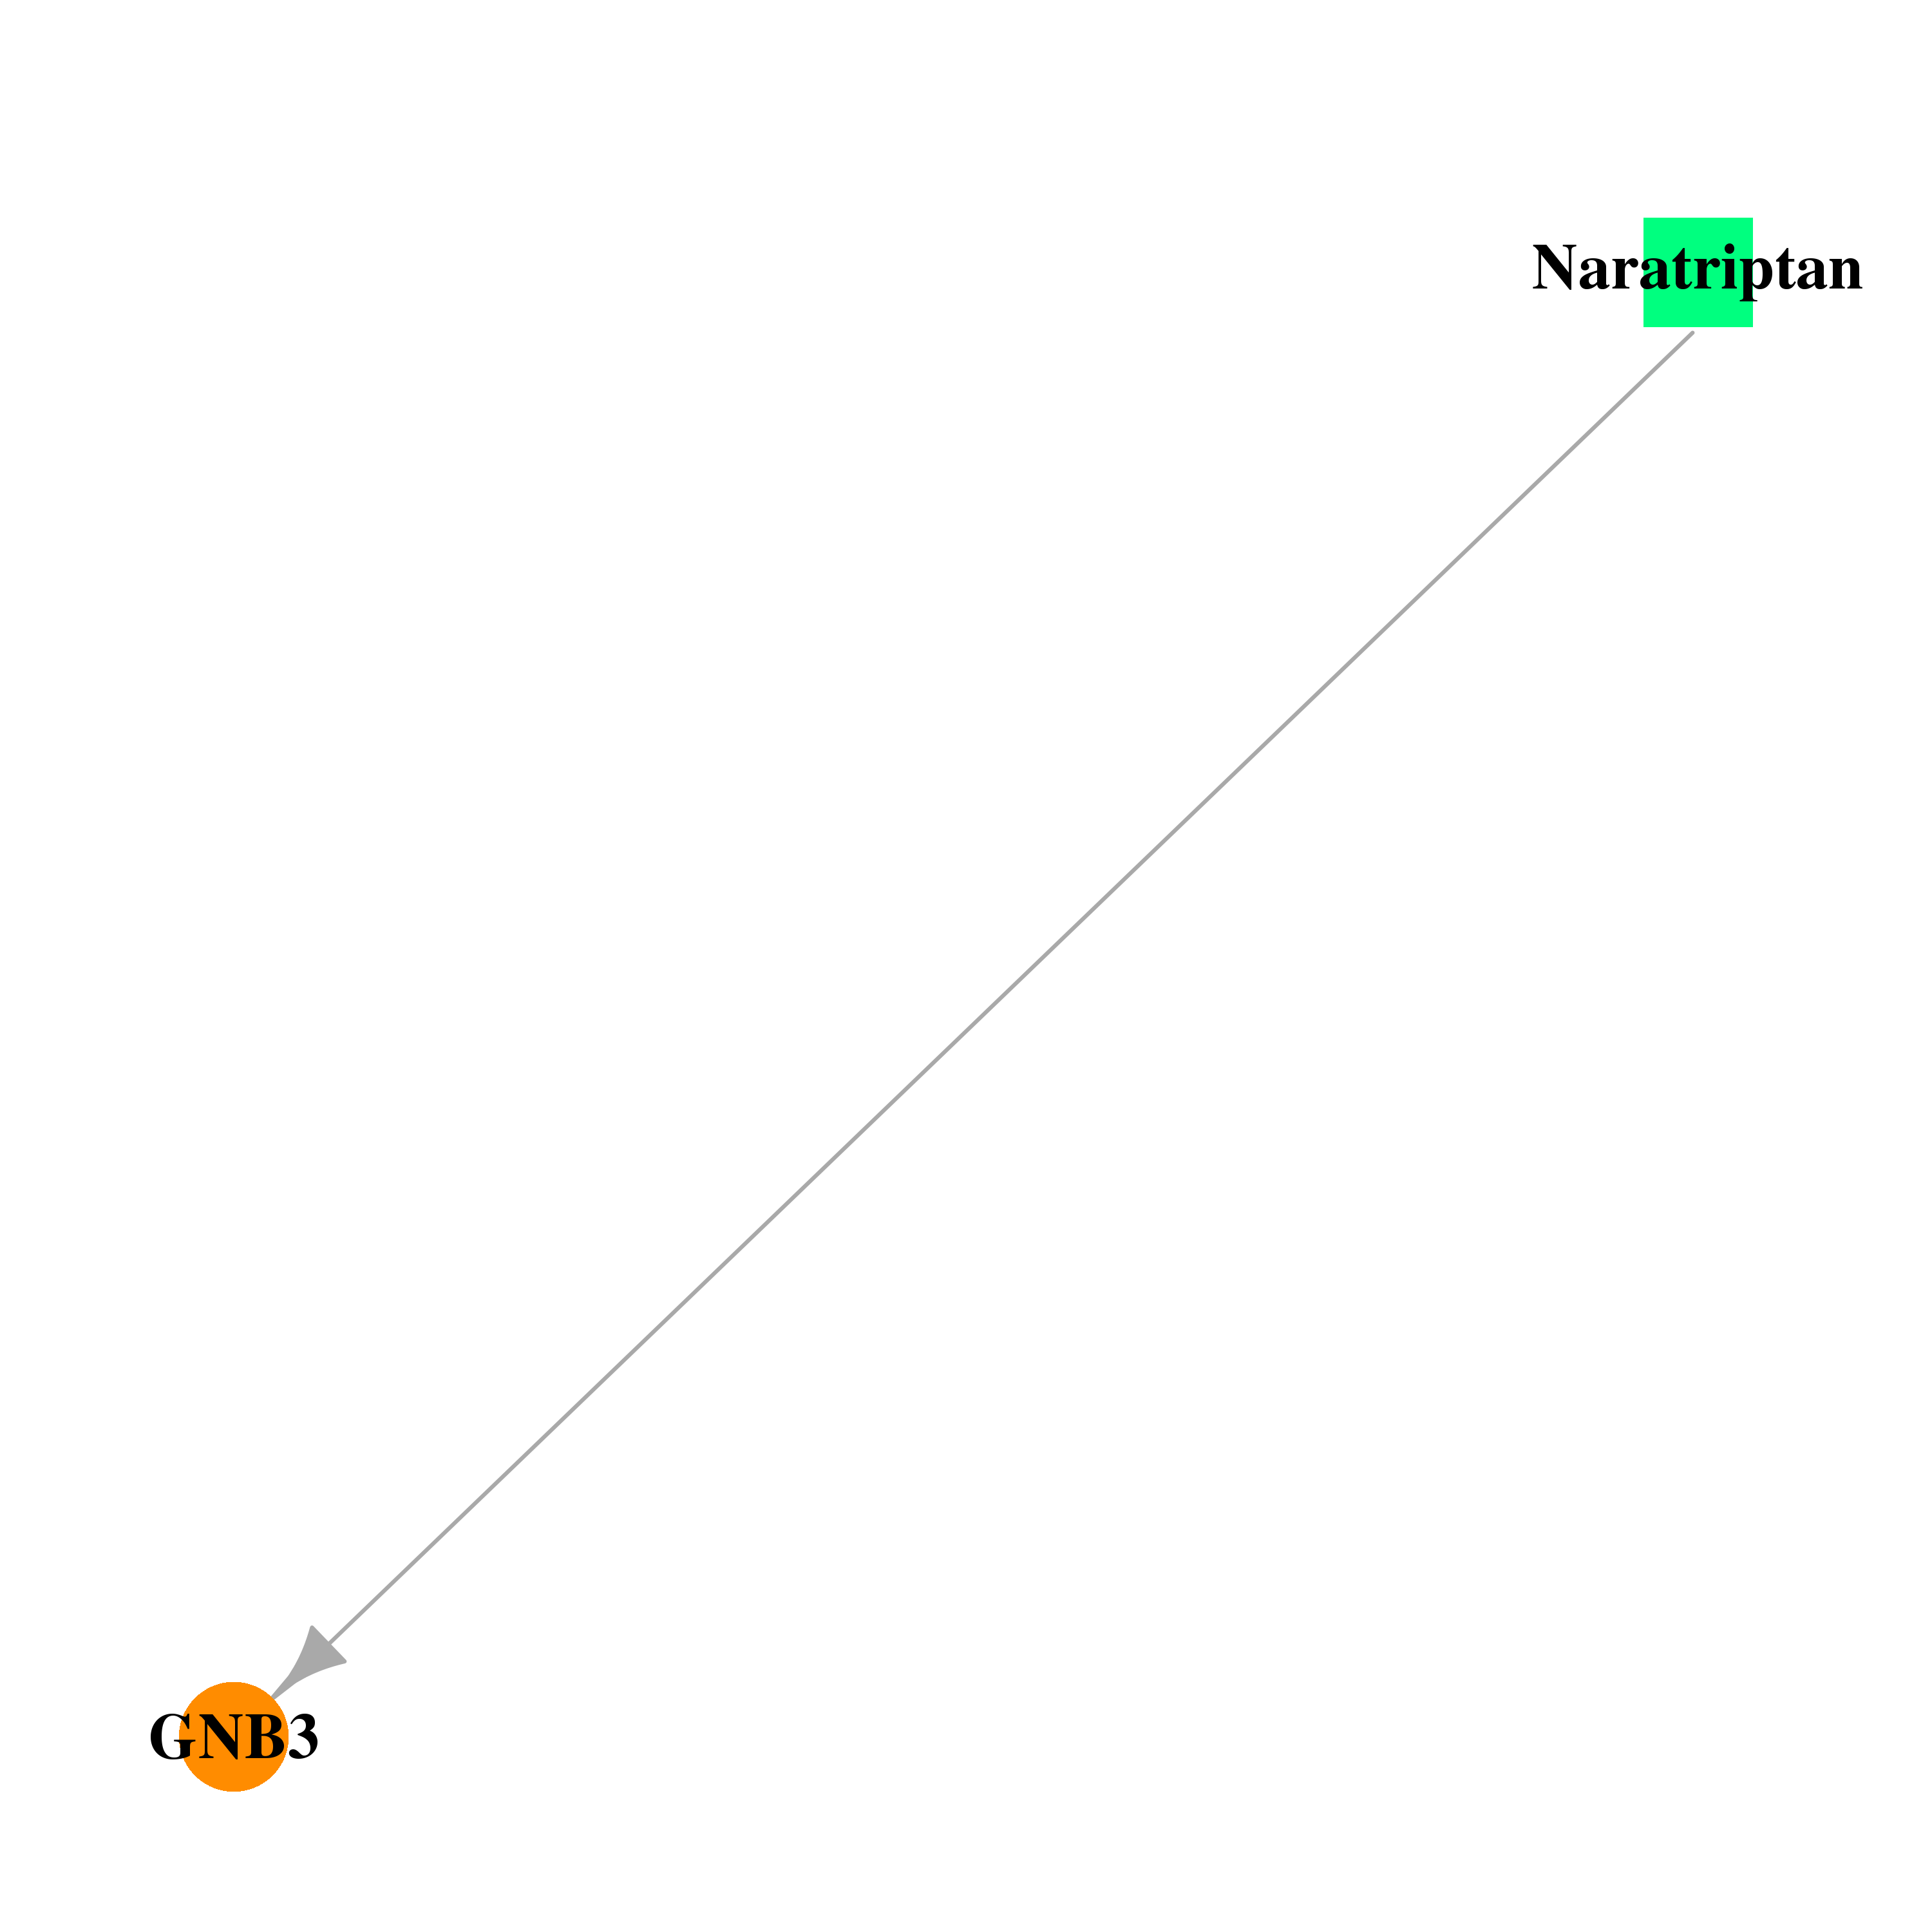 |  |
| DB00953 | guanine nucleotide binding protein (G protein), beta polypeptide 3 | approved | Rizatriptan | 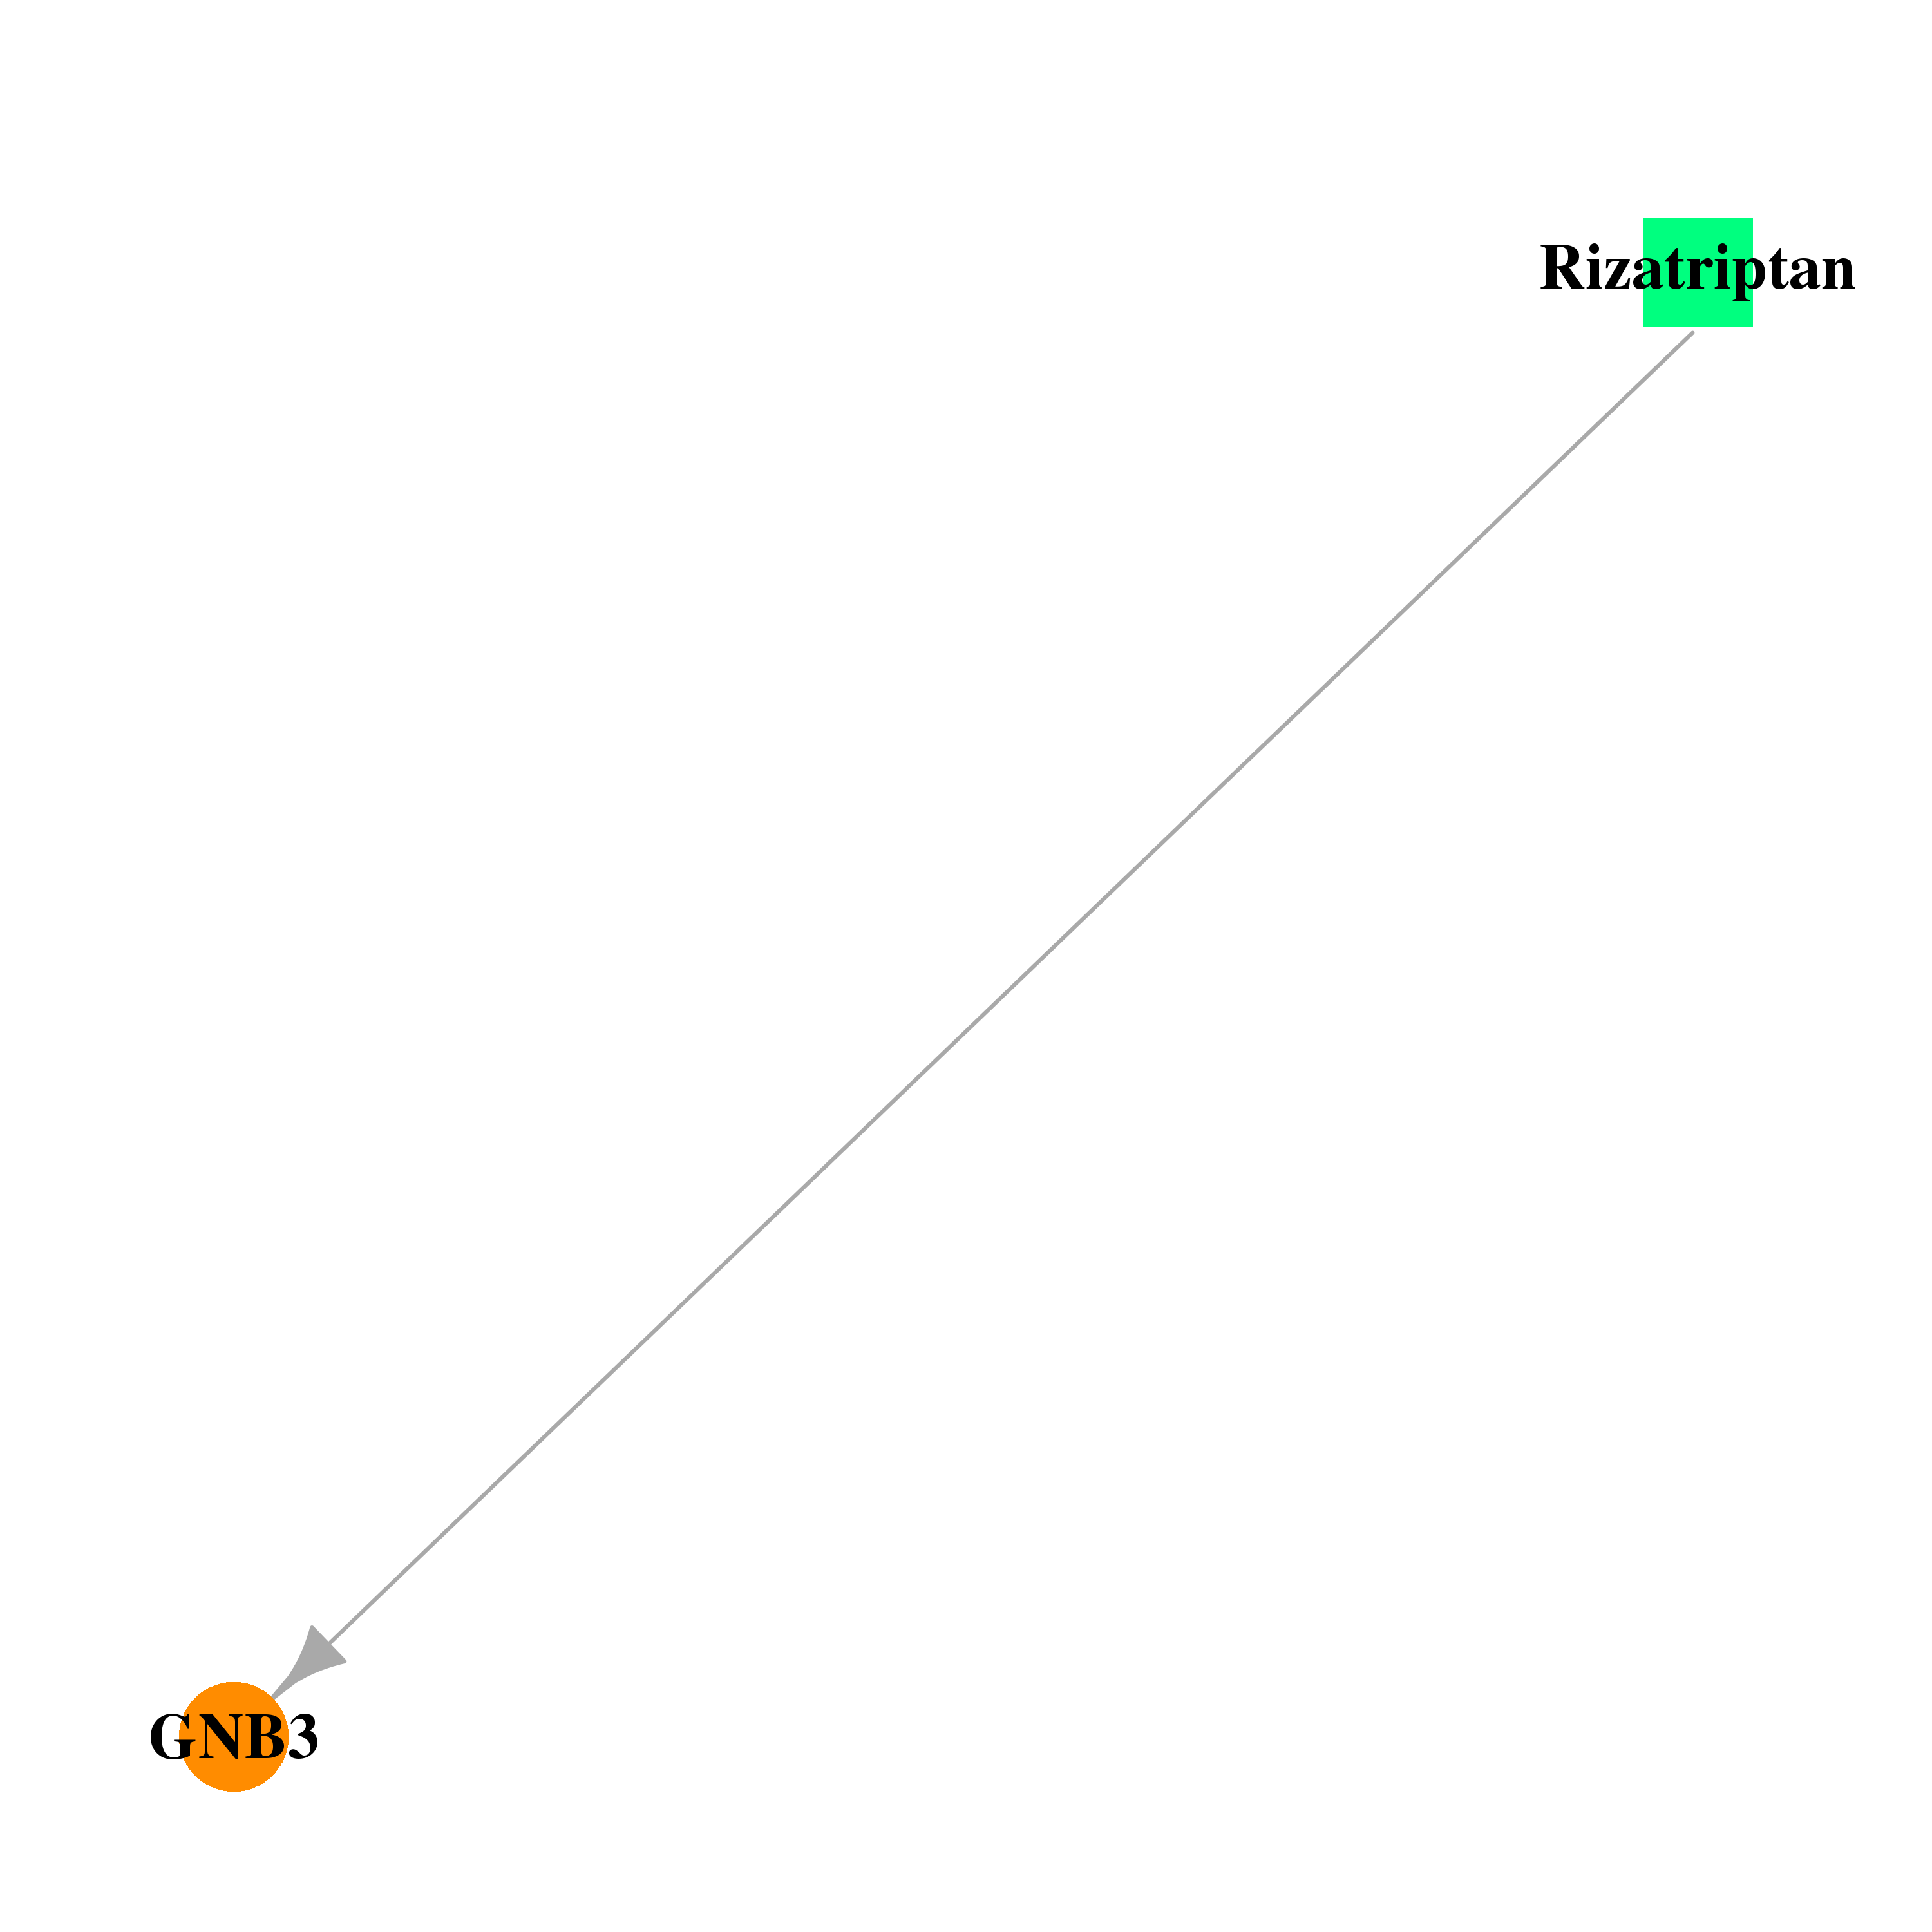 |  |
| DB00669 | guanine nucleotide binding protein (G protein), beta polypeptide 3 | approved; investigational | Sumatriptan | 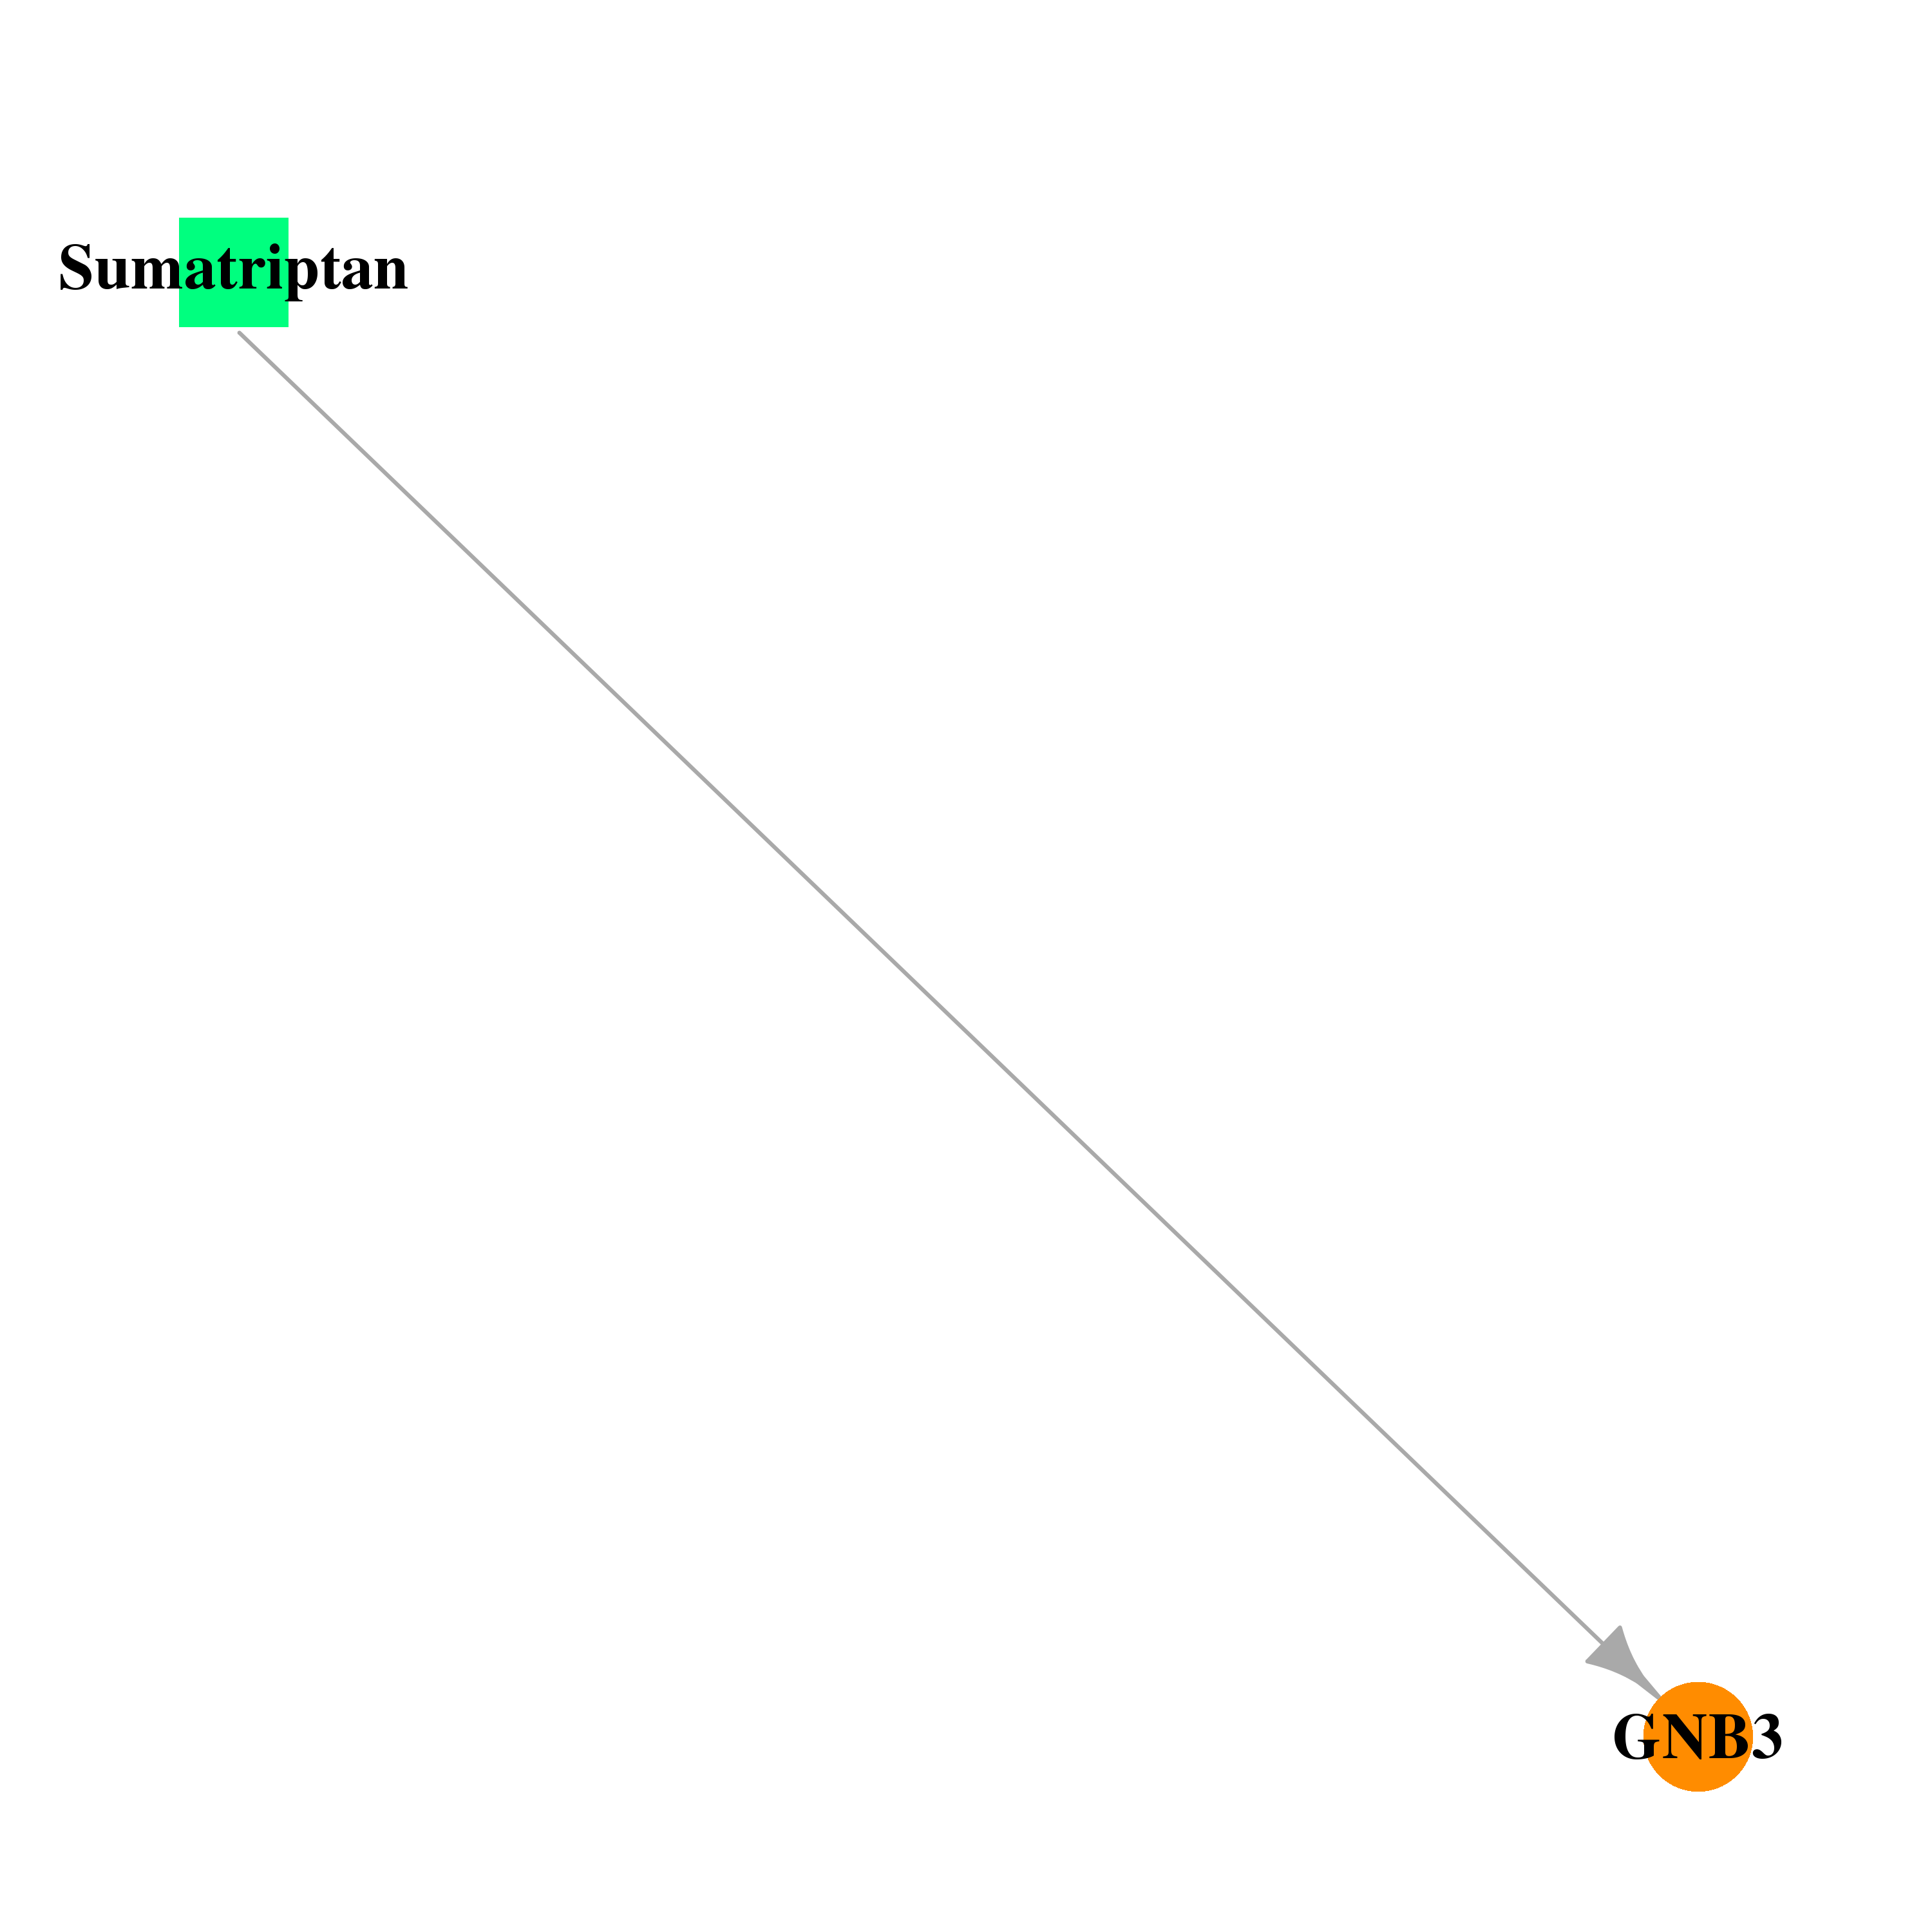 |  |
| DB00315 | guanine nucleotide binding protein (G protein), beta polypeptide 3 | approved; investigational | Zolmitriptan |  |  |
| DB00203 | guanine nucleotide binding protein (G protein), beta polypeptide 3 | approved; investigational | Sildenafil | 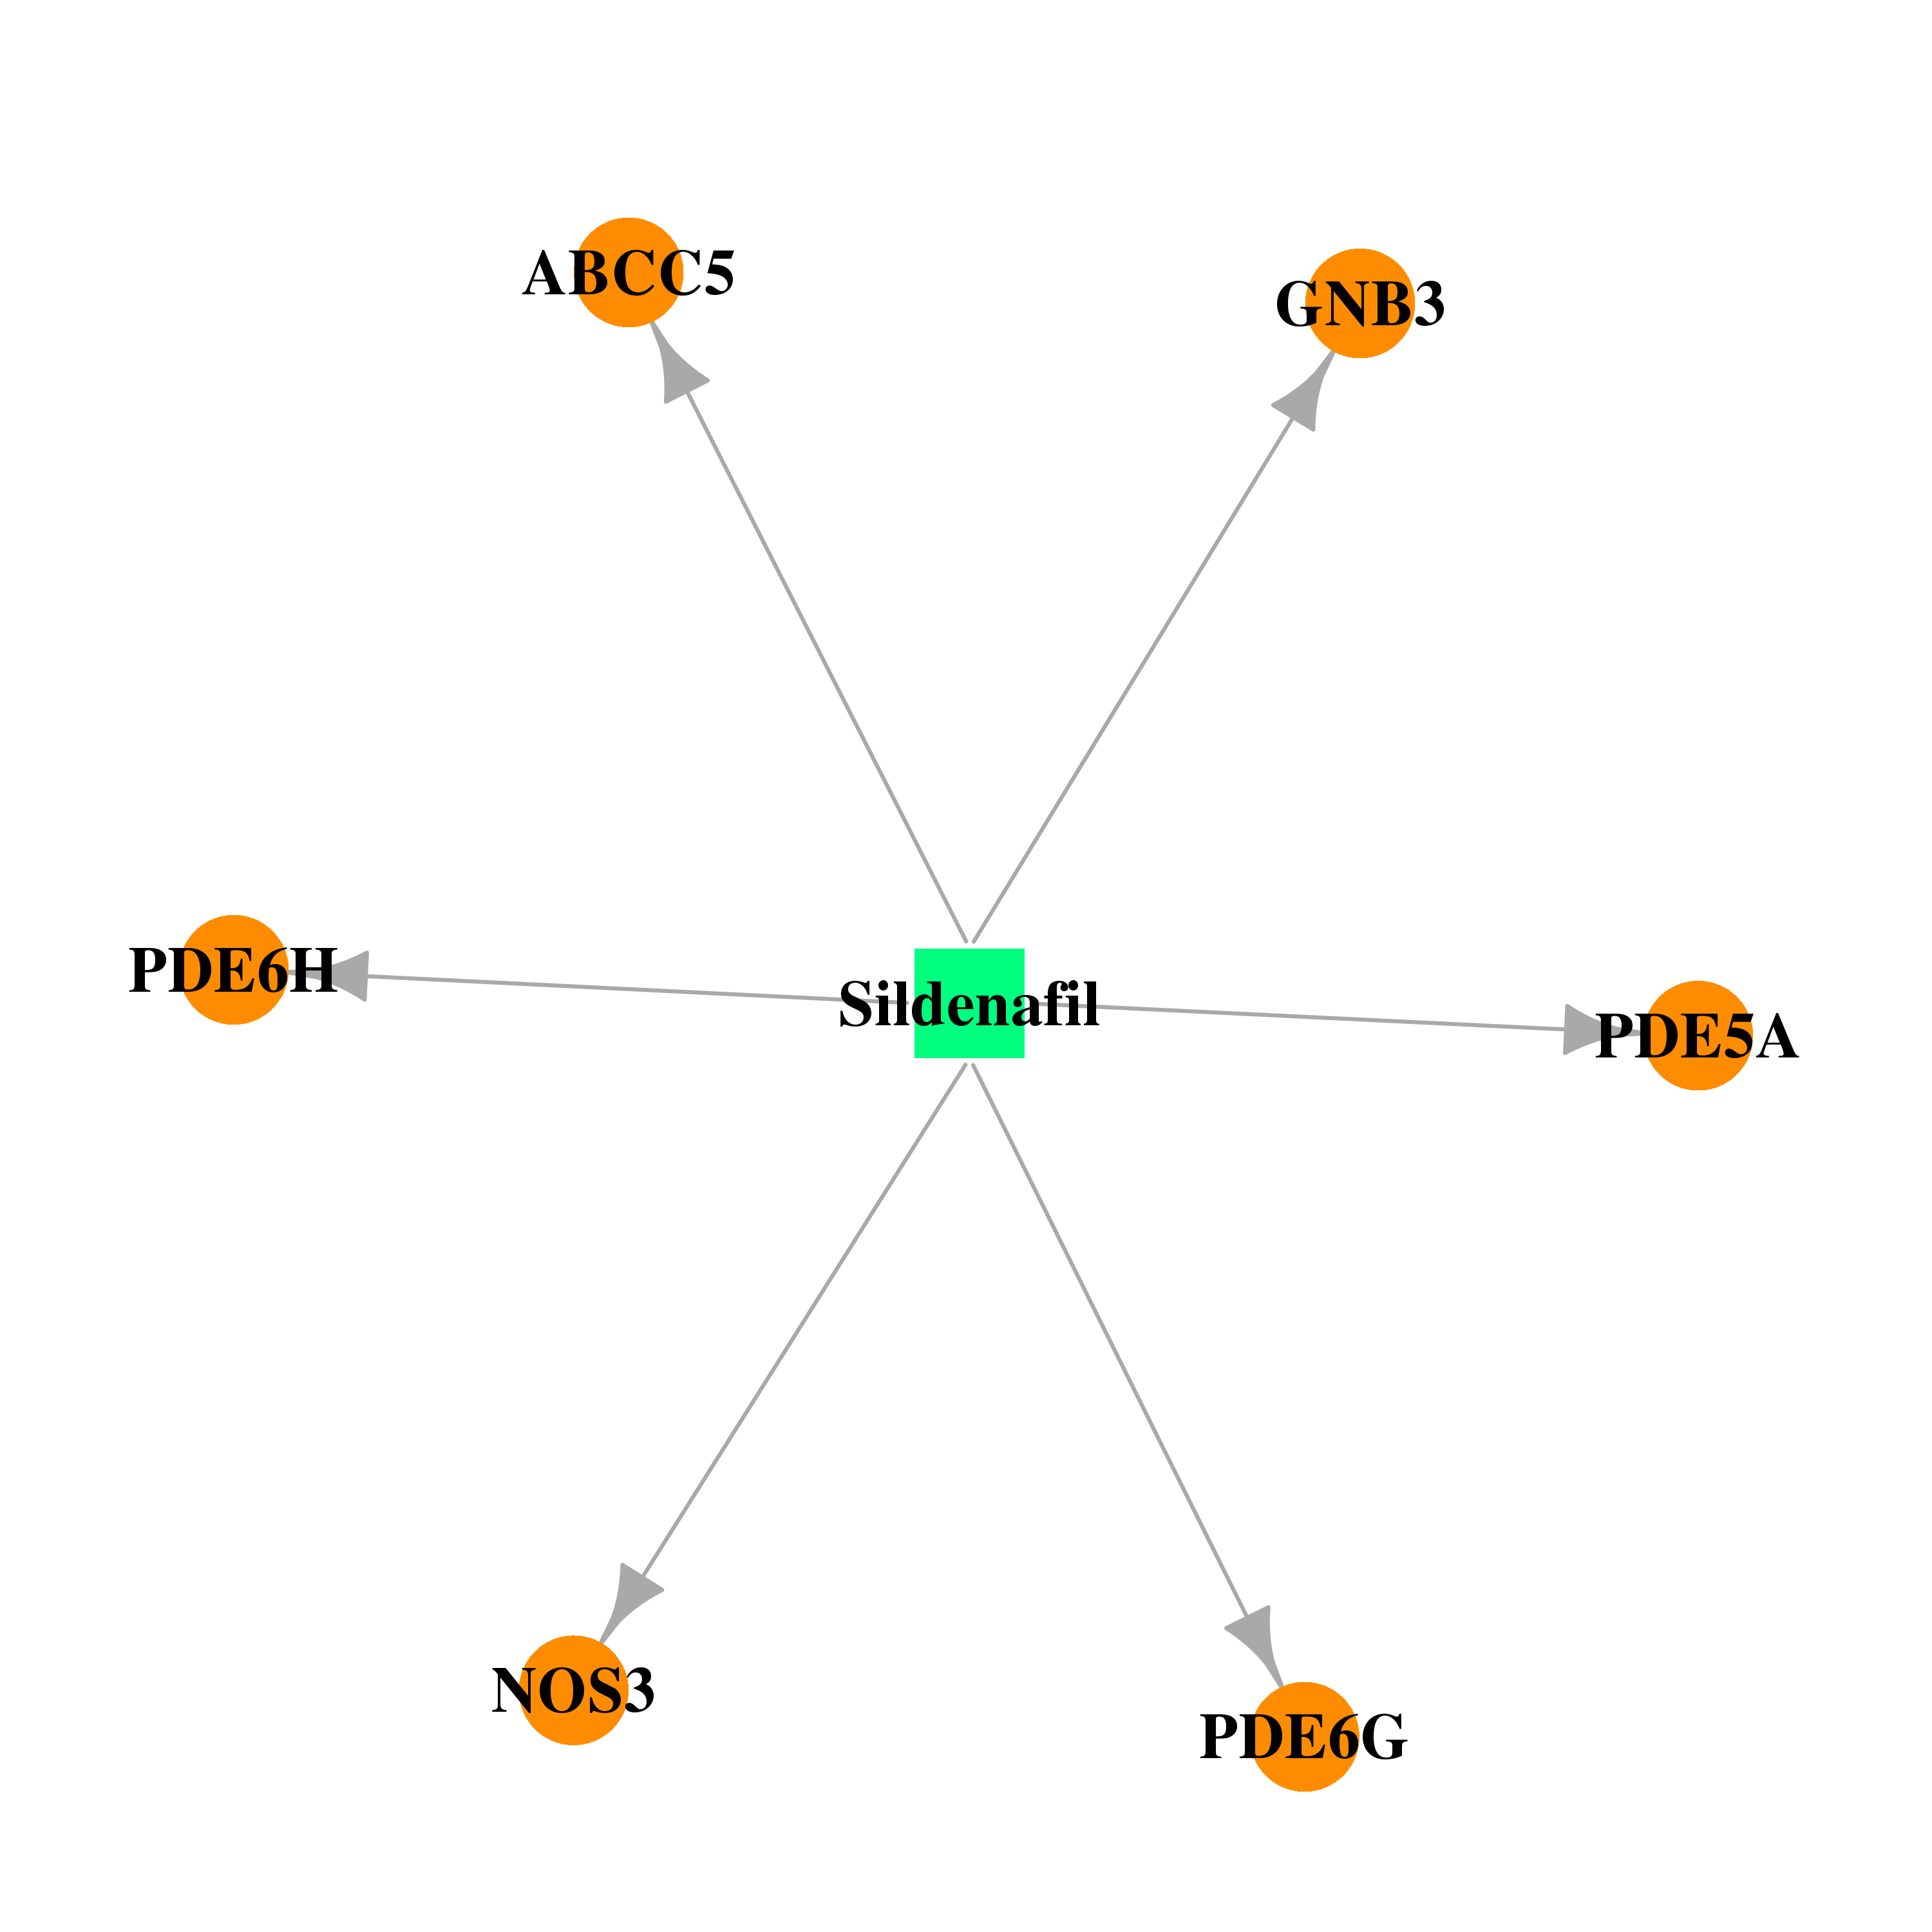 |  |
| DB01076 | guanine nucleotide binding protein (G protein), beta polypeptide 3 | approved | Atorvastatin | 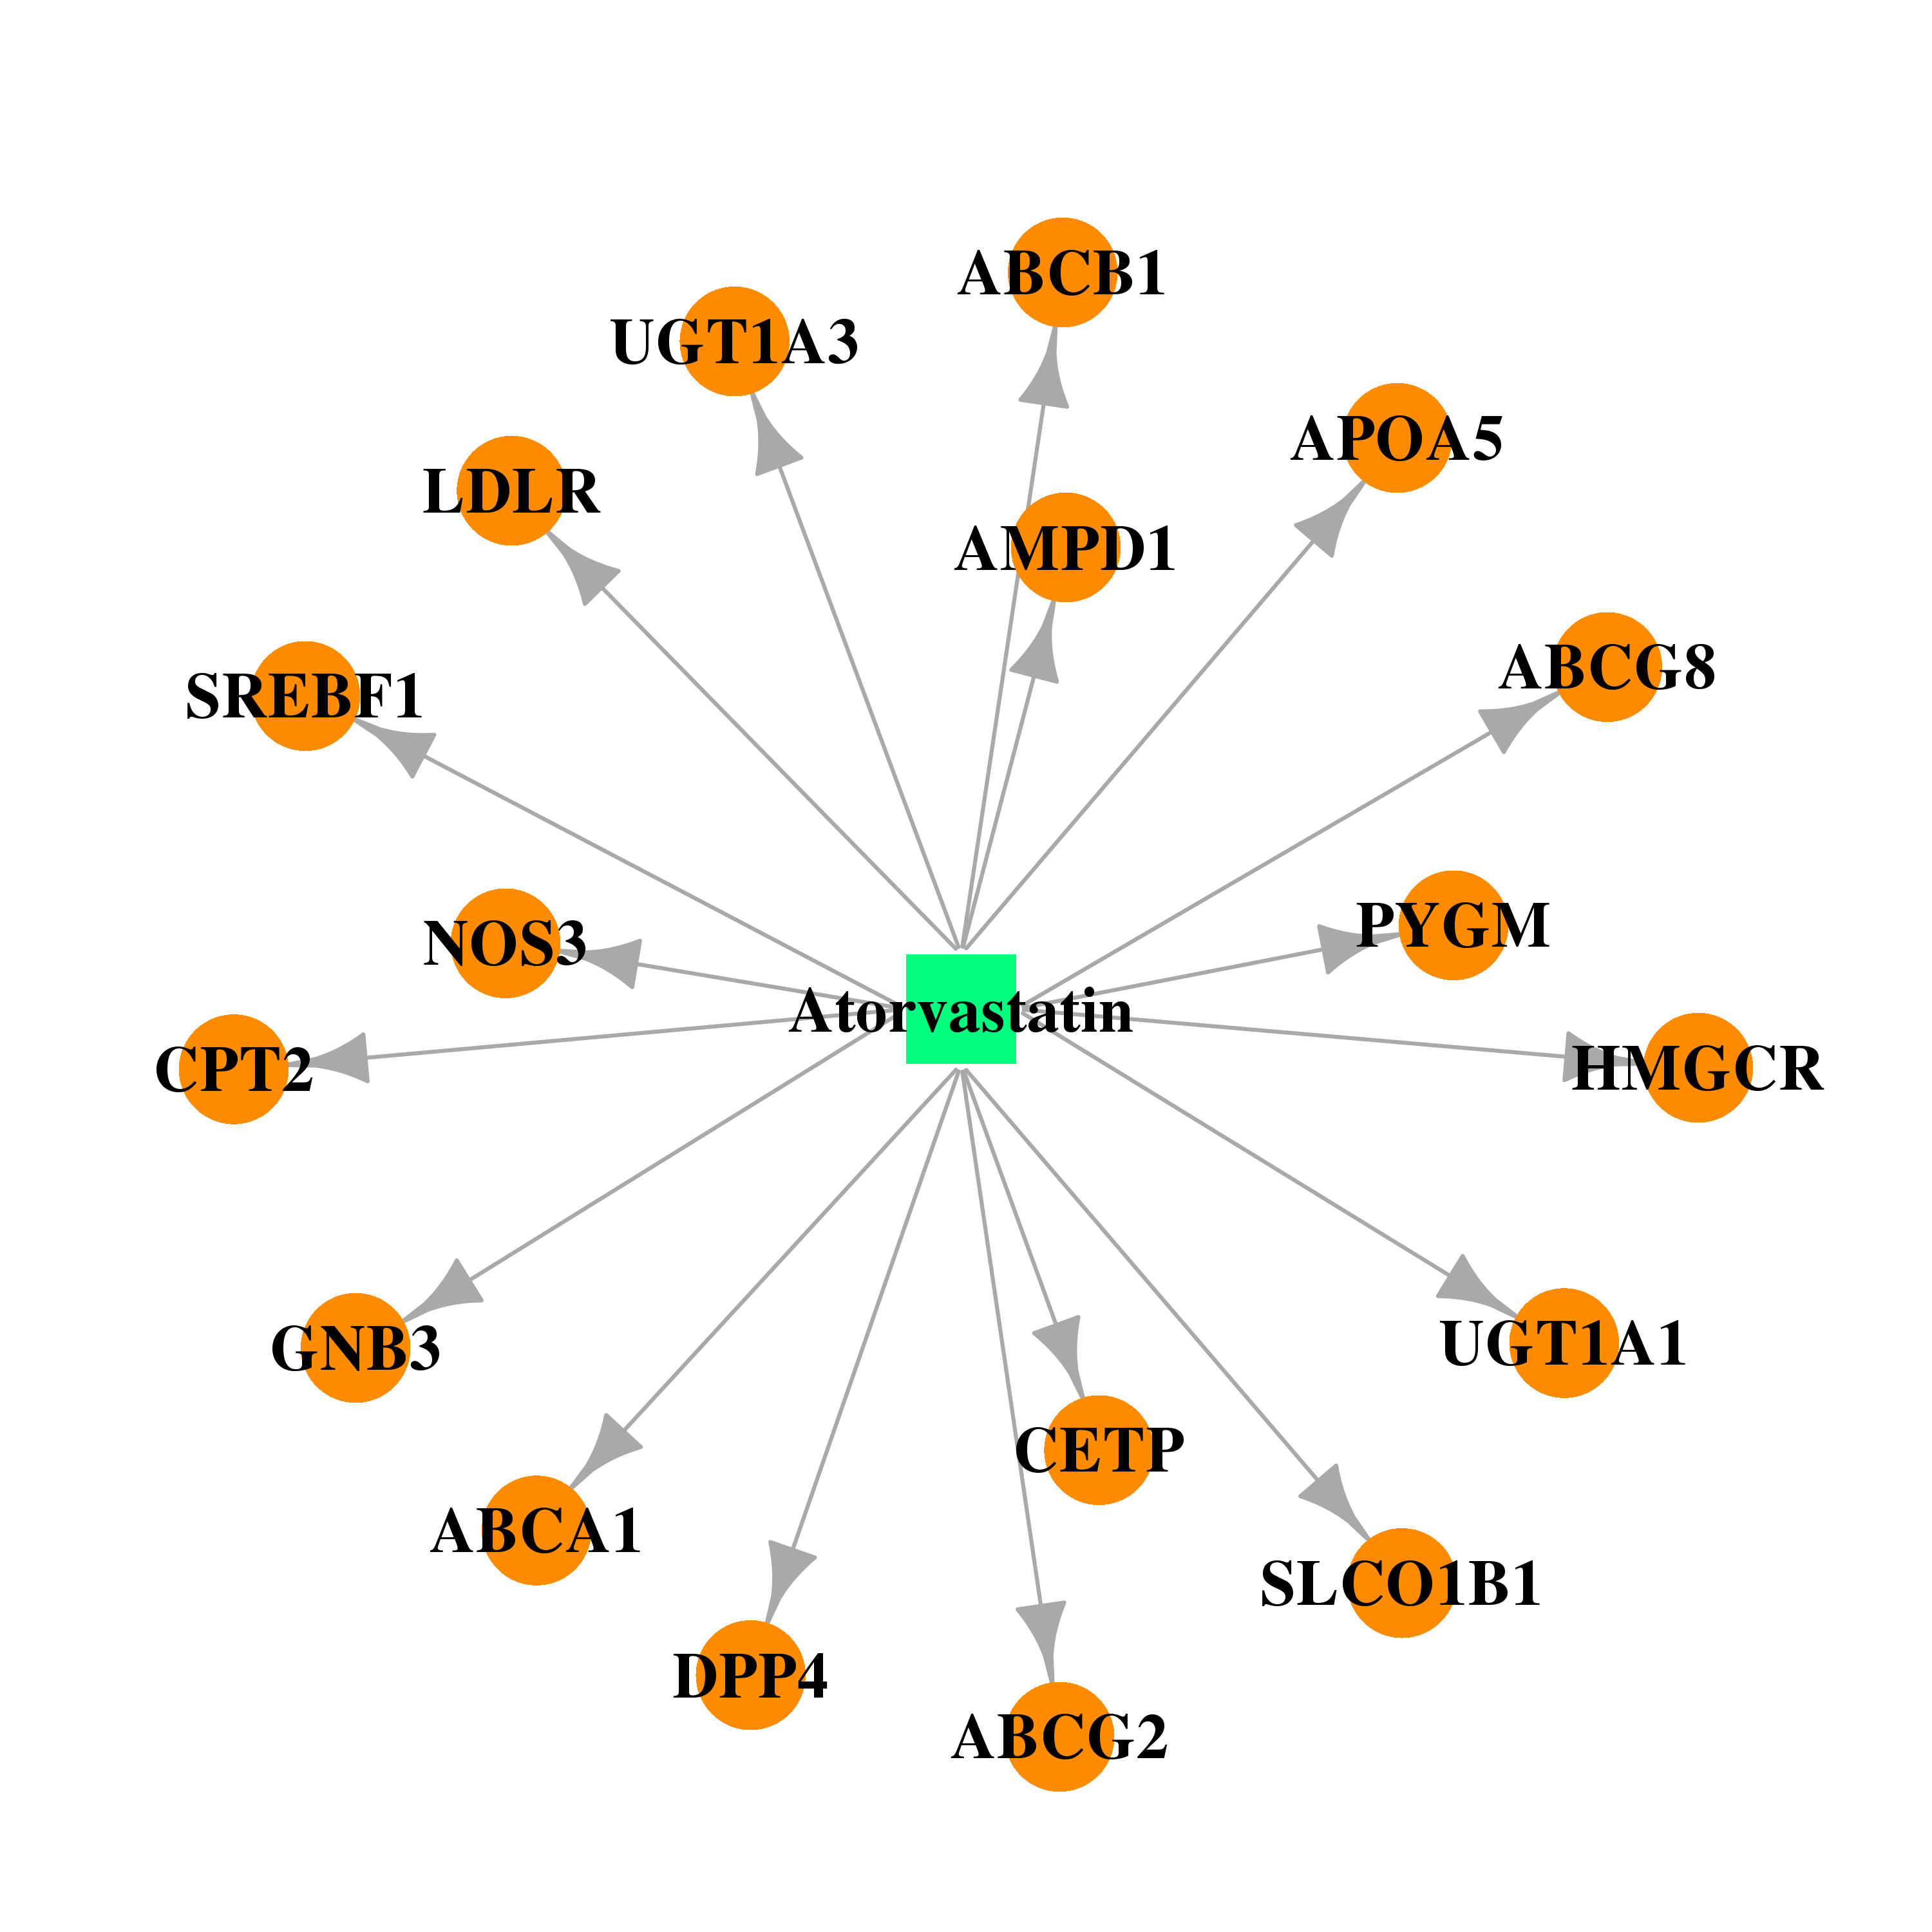 | 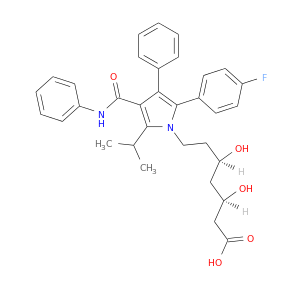 |
| DB01095 | guanine nucleotide binding protein (G protein), beta polypeptide 3 | approved | Fluvastatin | 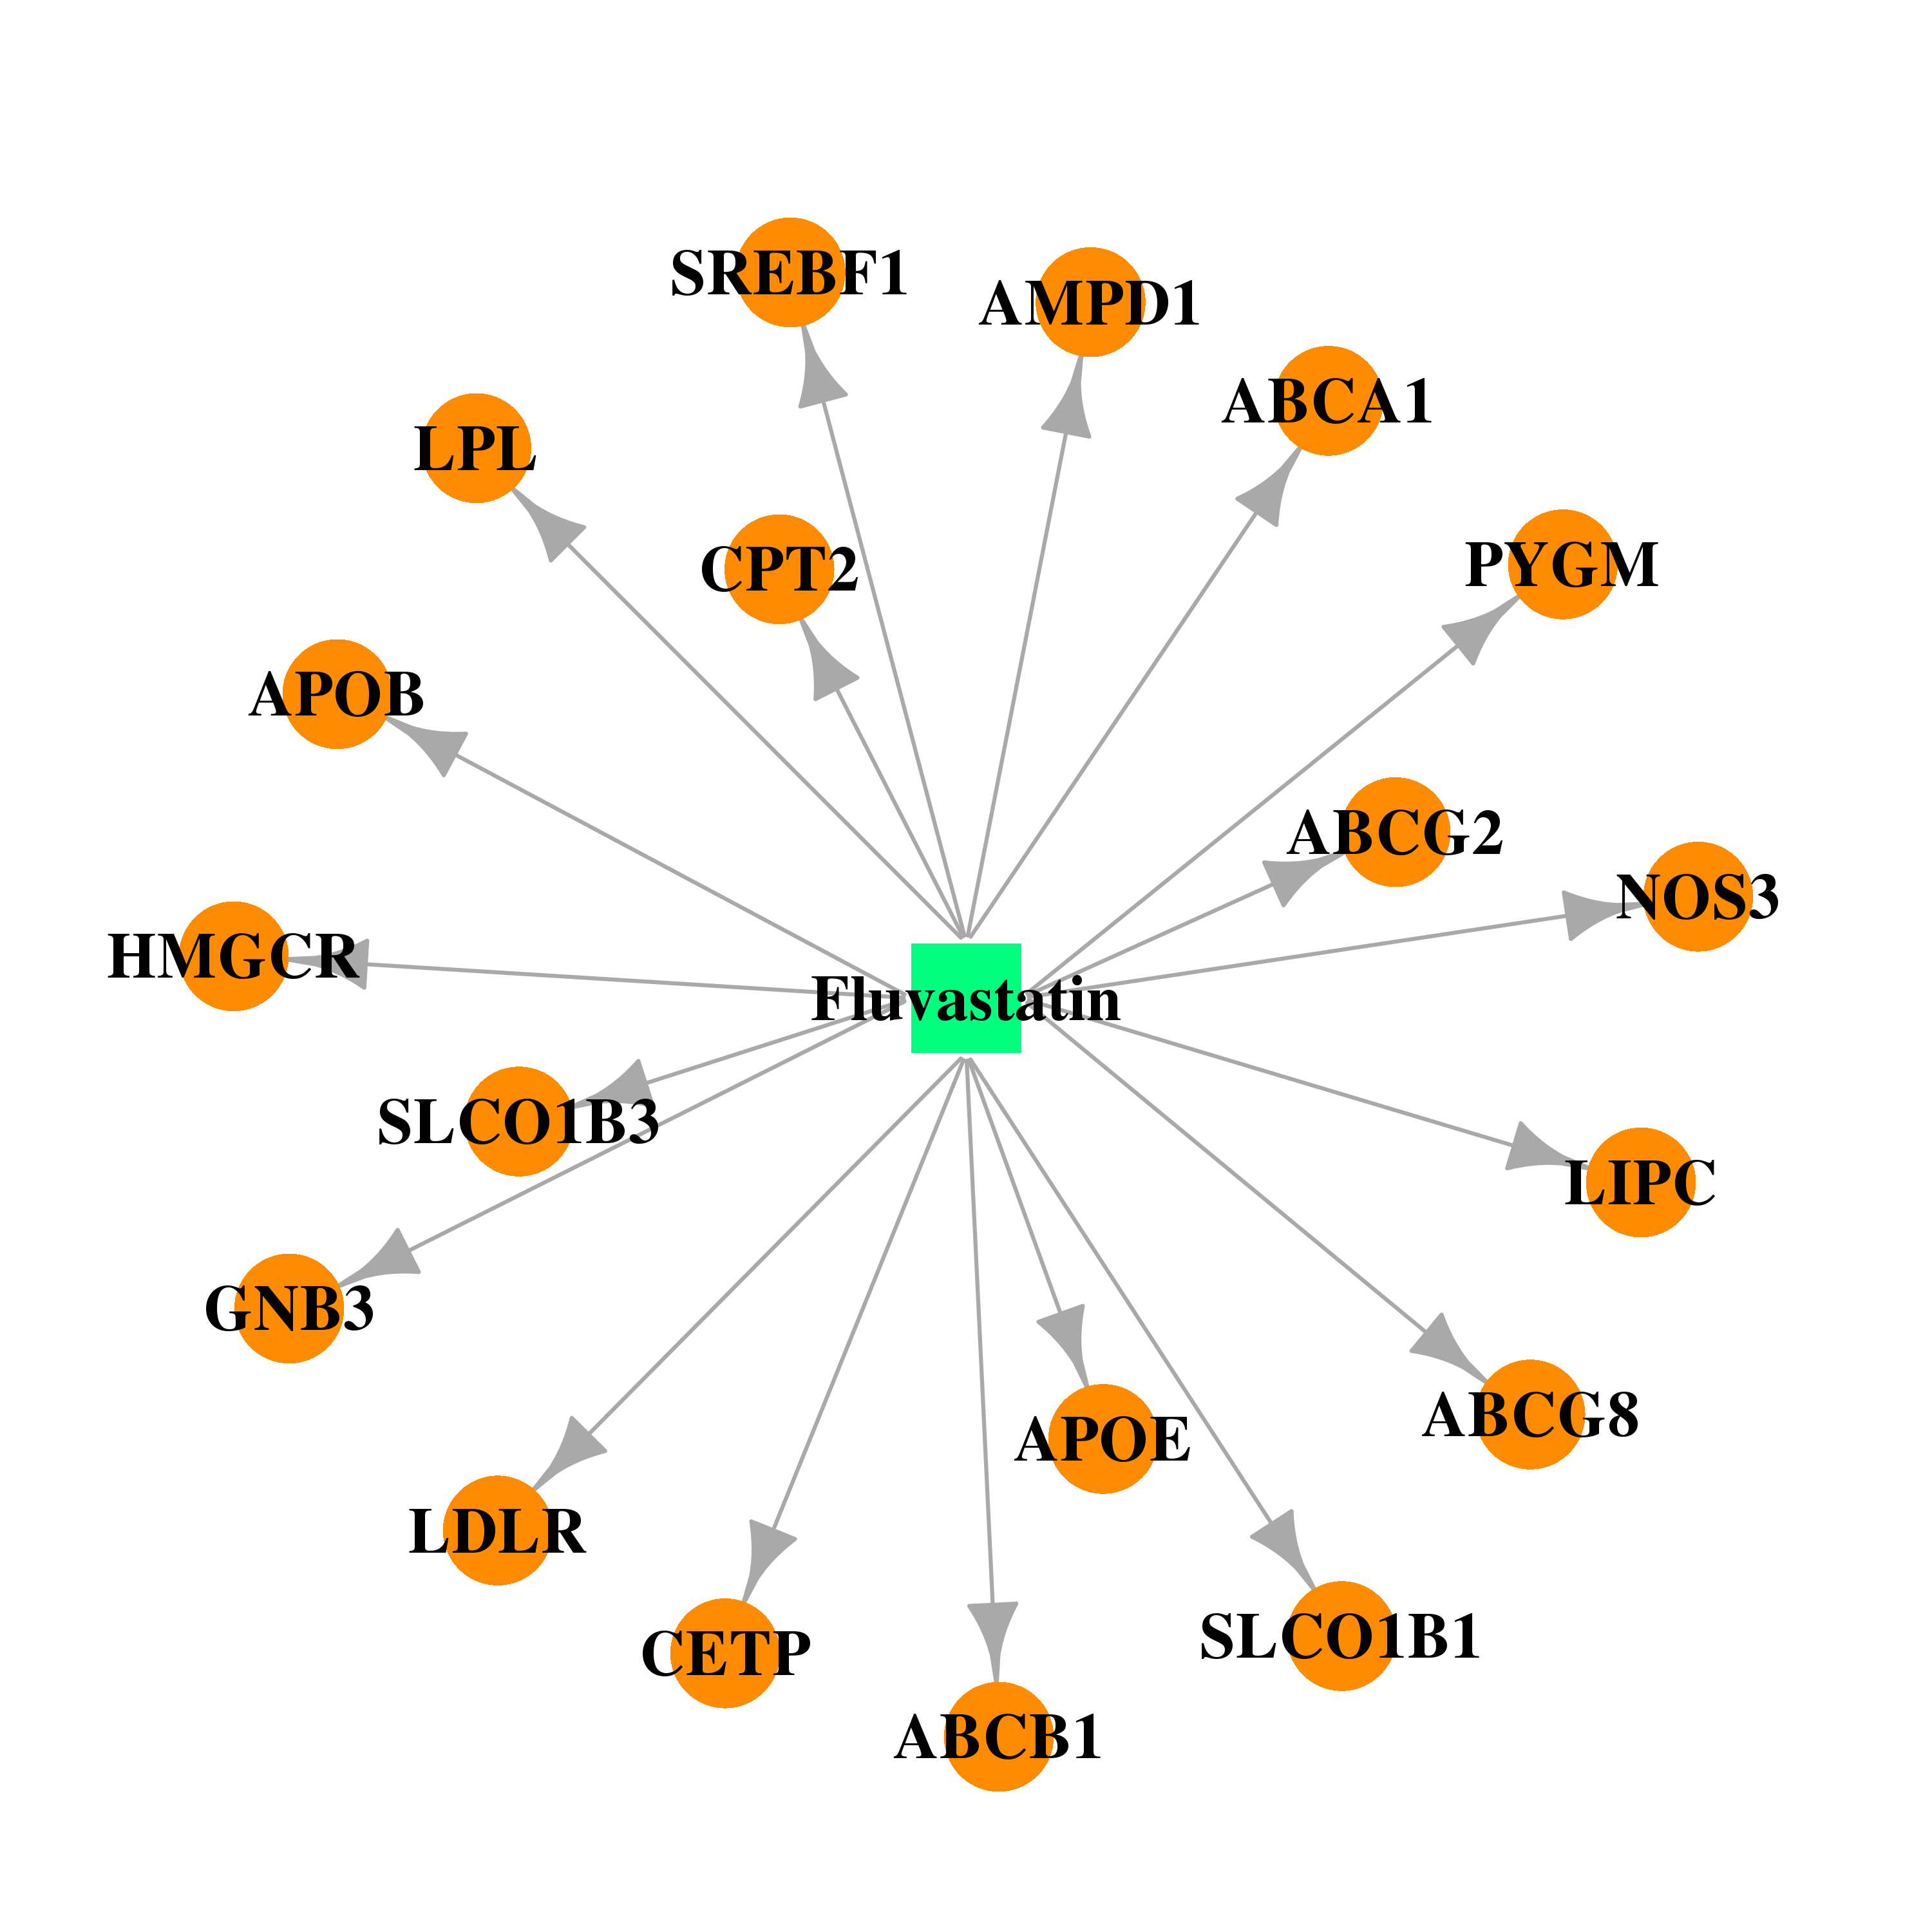 | 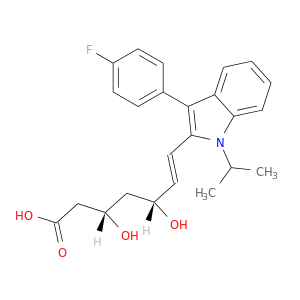 |
| DB00227 | guanine nucleotide binding protein (G protein), beta polypeptide 3 | approved; investigational | Lovastatin | 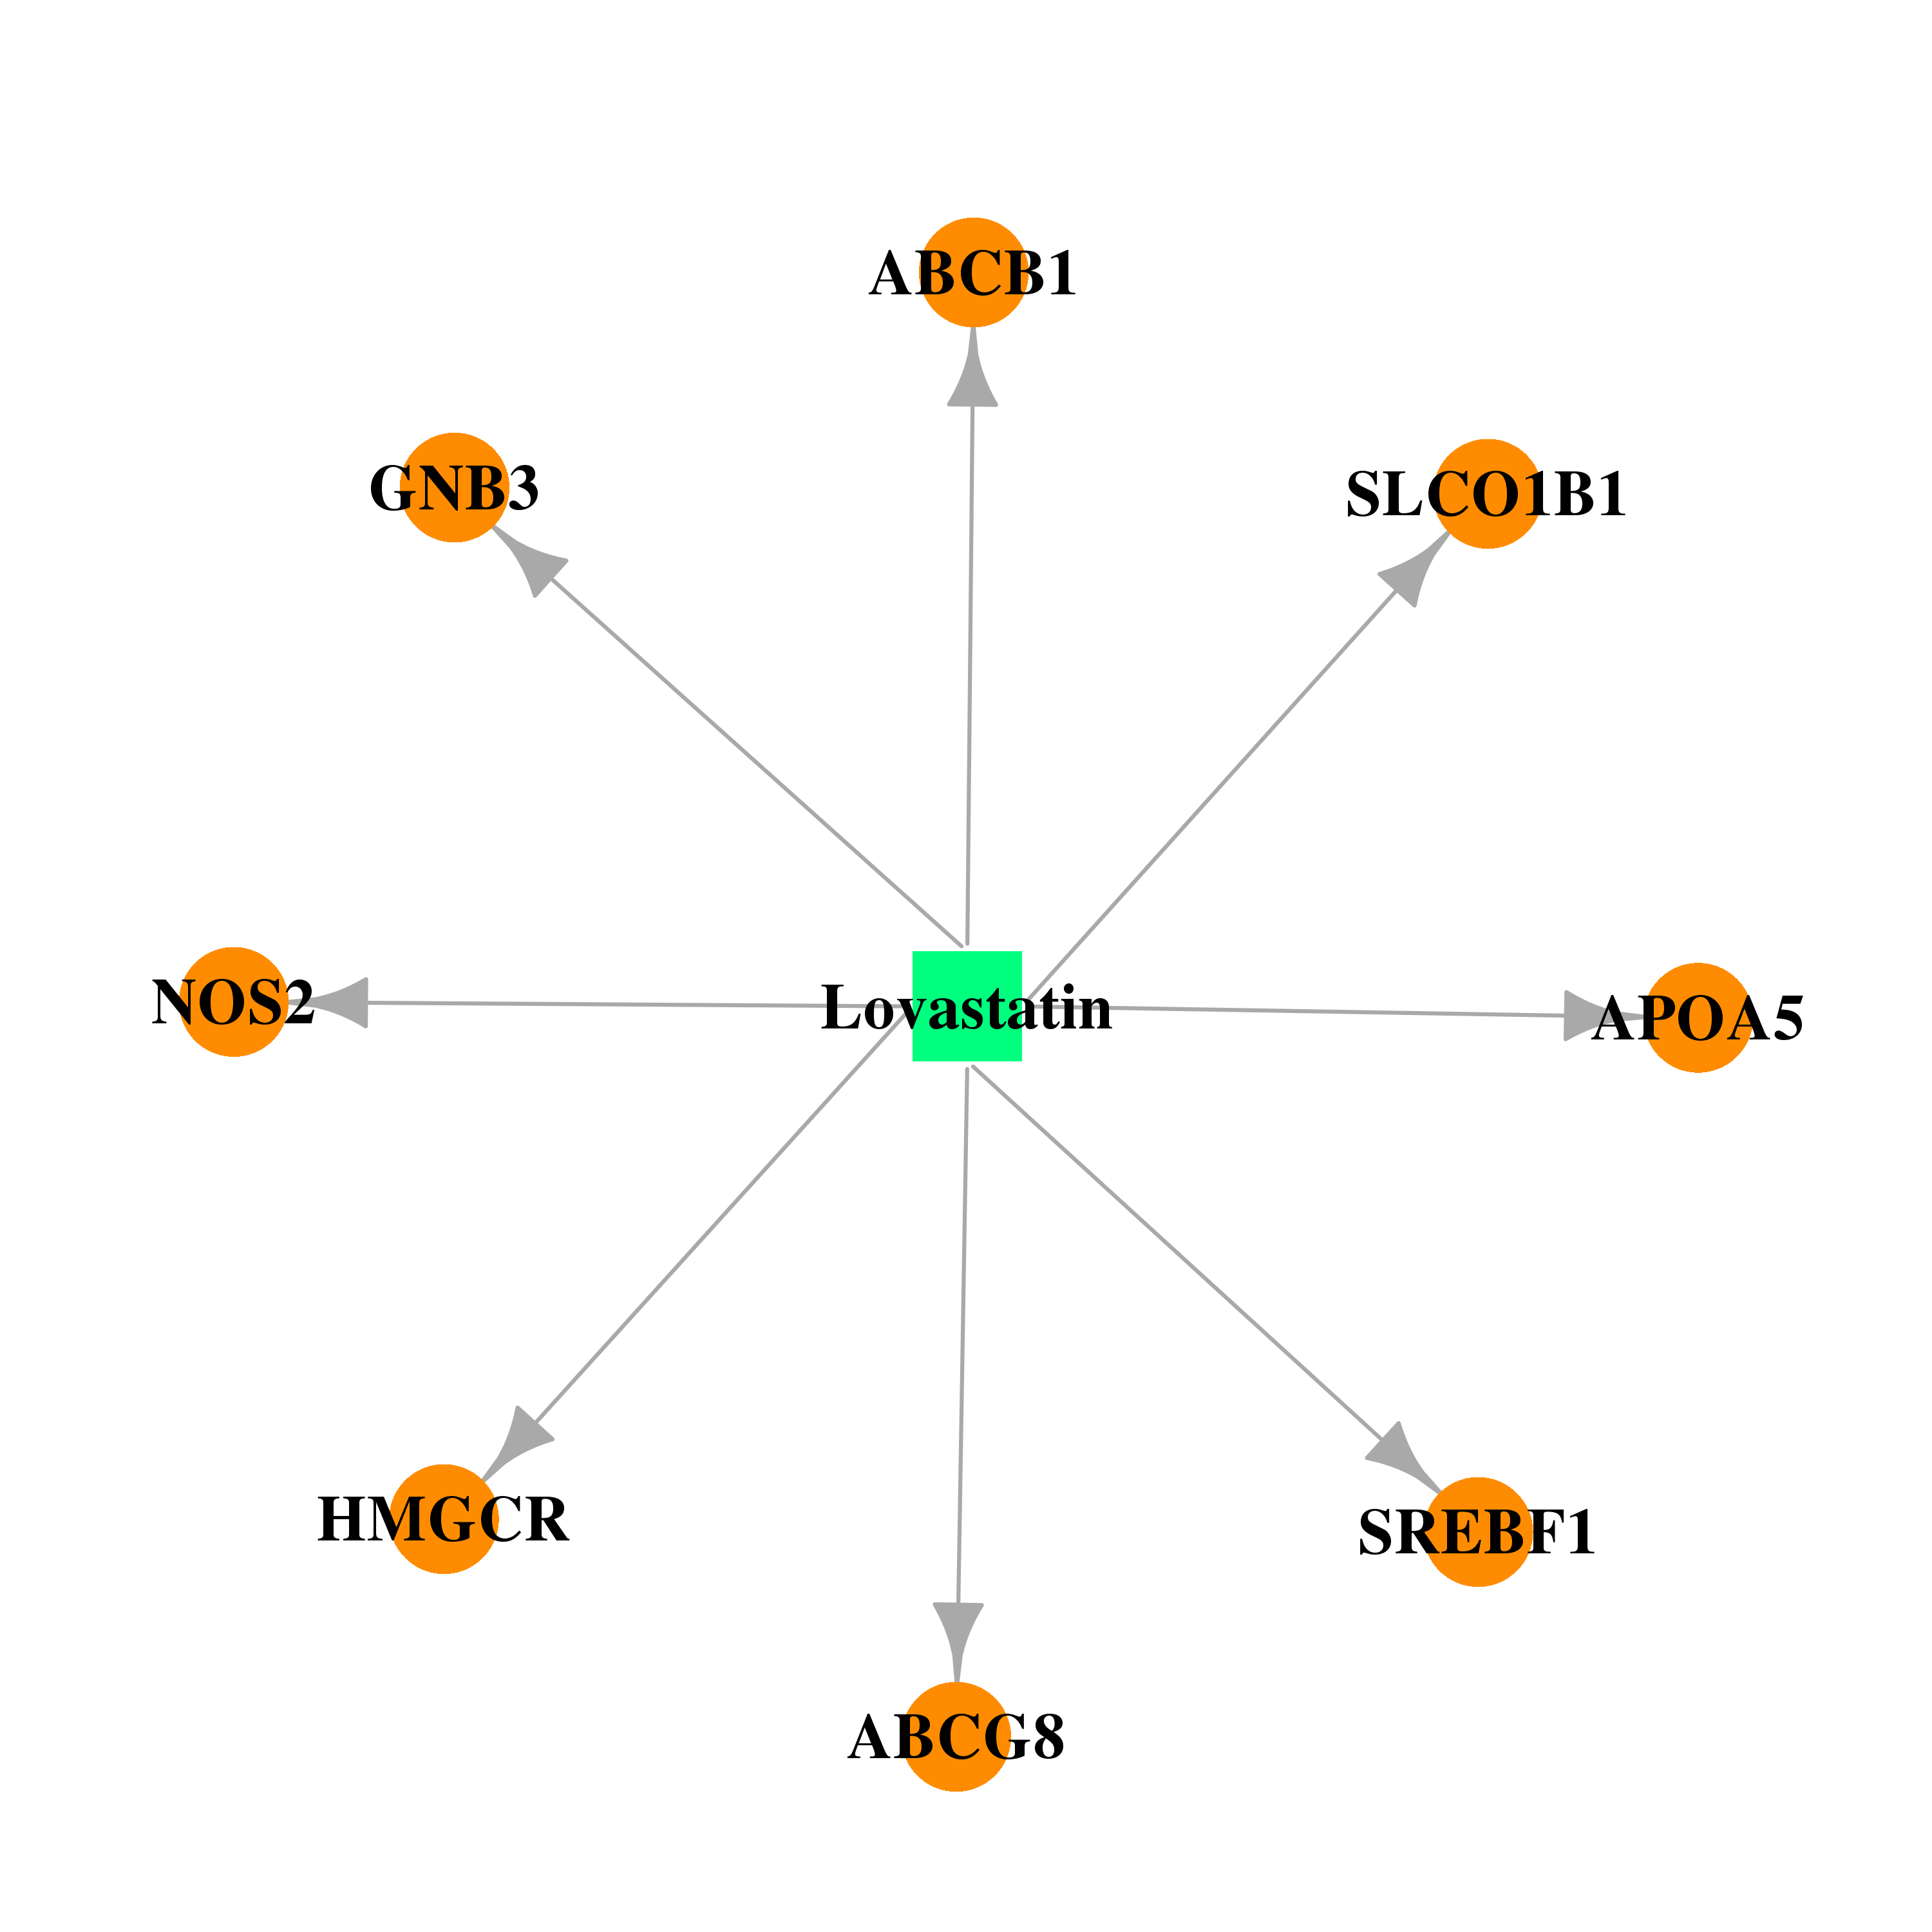 | 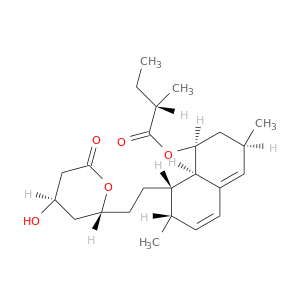 |
| DB00175 | guanine nucleotide binding protein (G protein), beta polypeptide 3 | approved | Pravastatin | 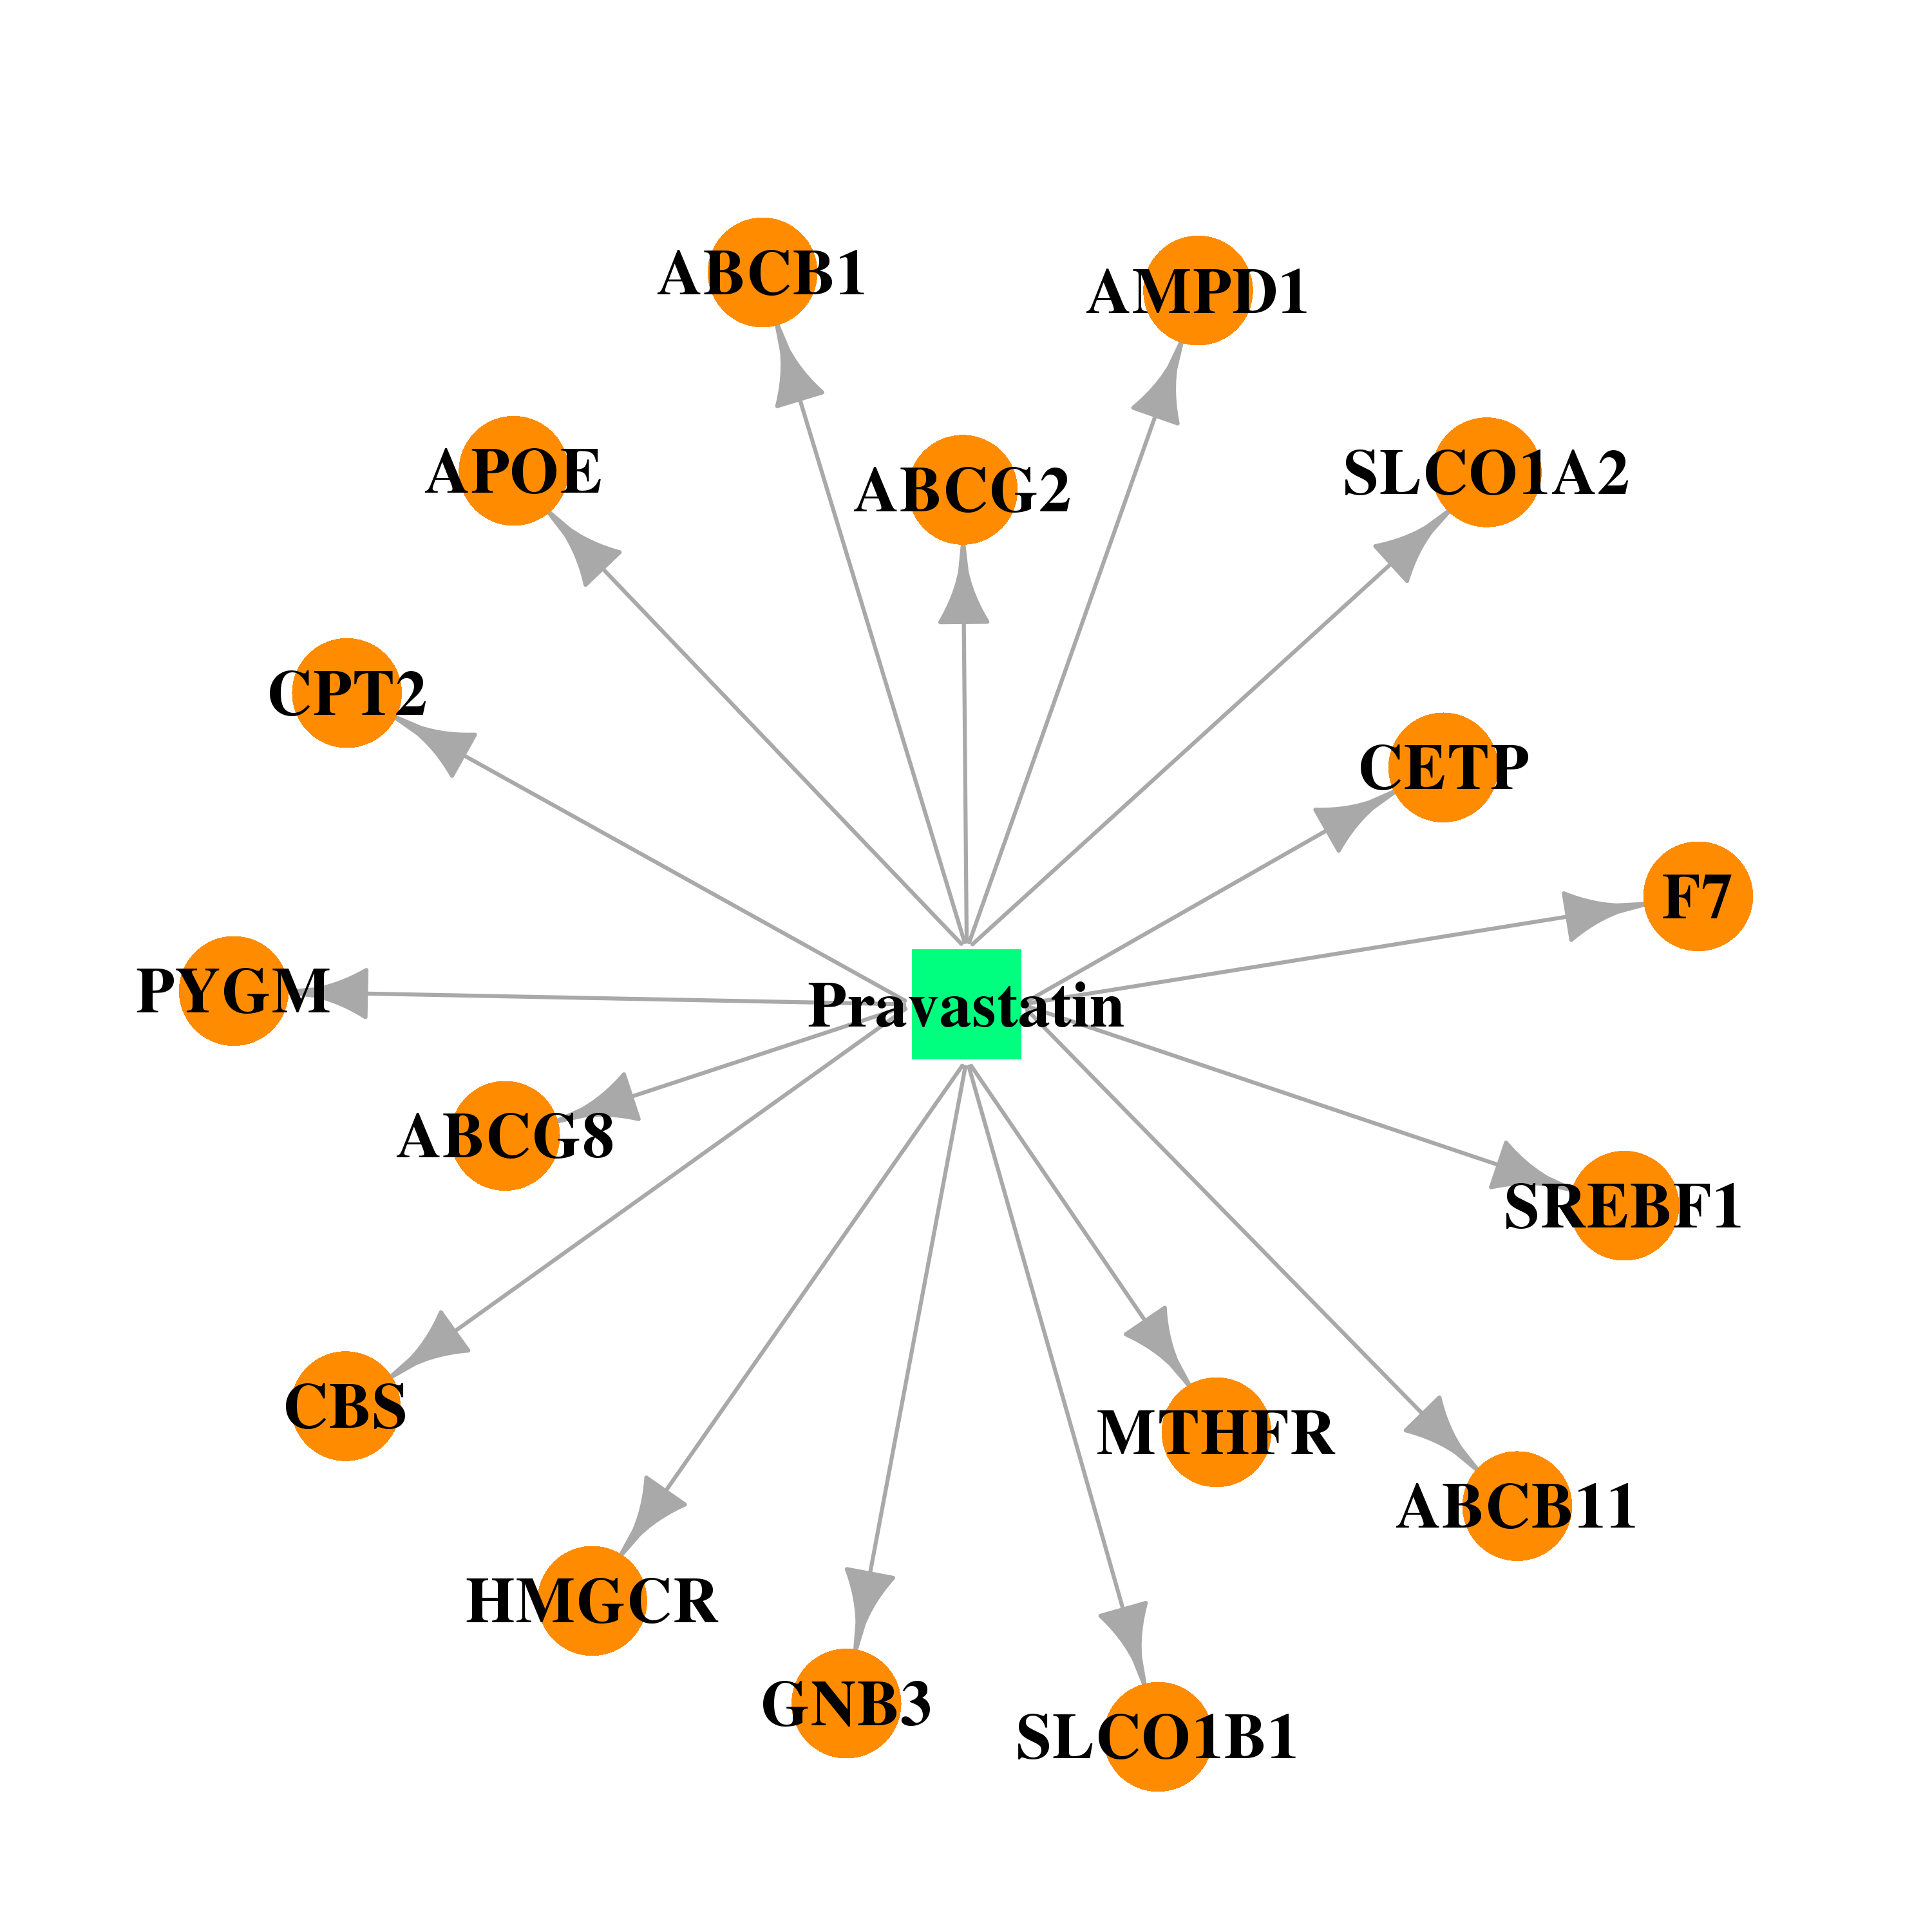 | 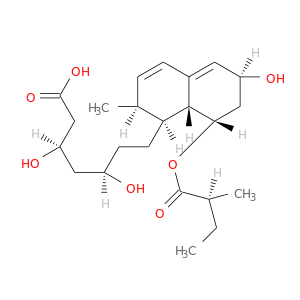 |
| DB01098 | guanine nucleotide binding protein (G protein), beta polypeptide 3 | approved | Rosuvastatin | 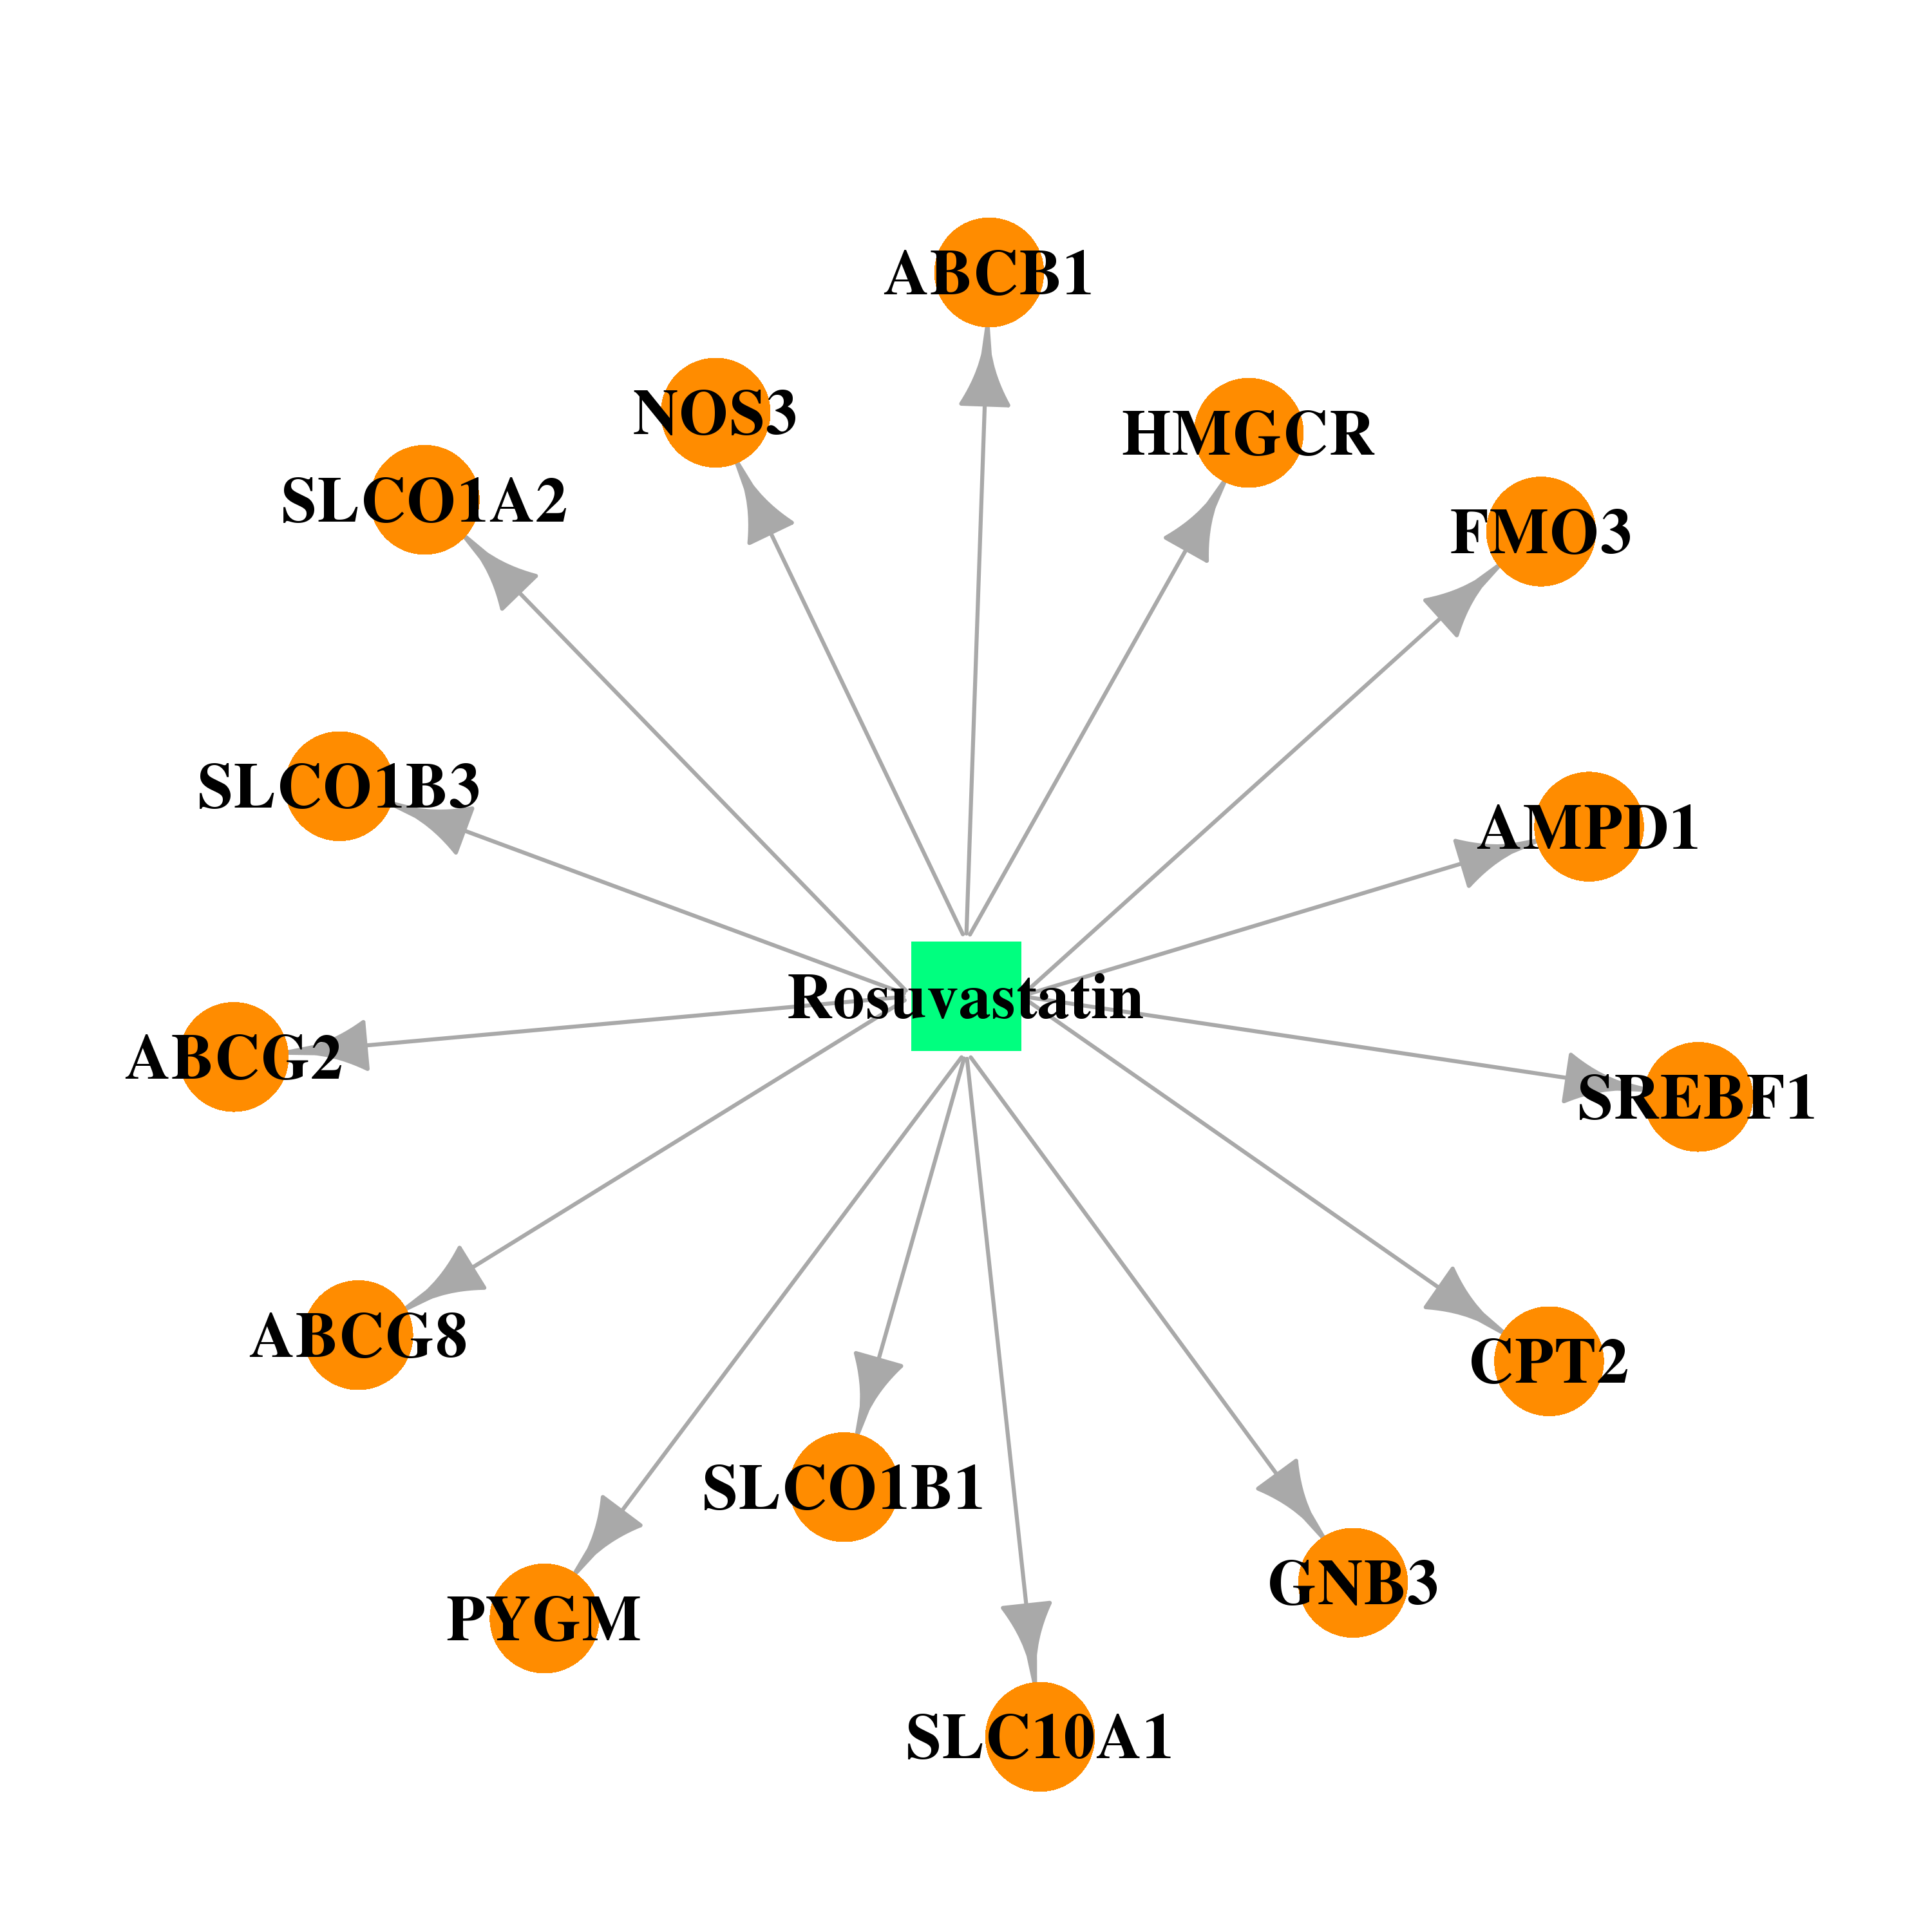 | 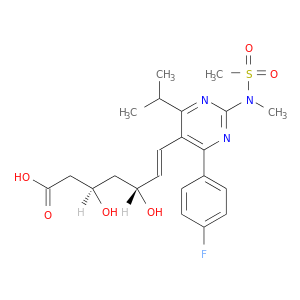 |
| DB00641 | guanine nucleotide binding protein (G protein), beta polypeptide 3 | approved | Simvastatin | 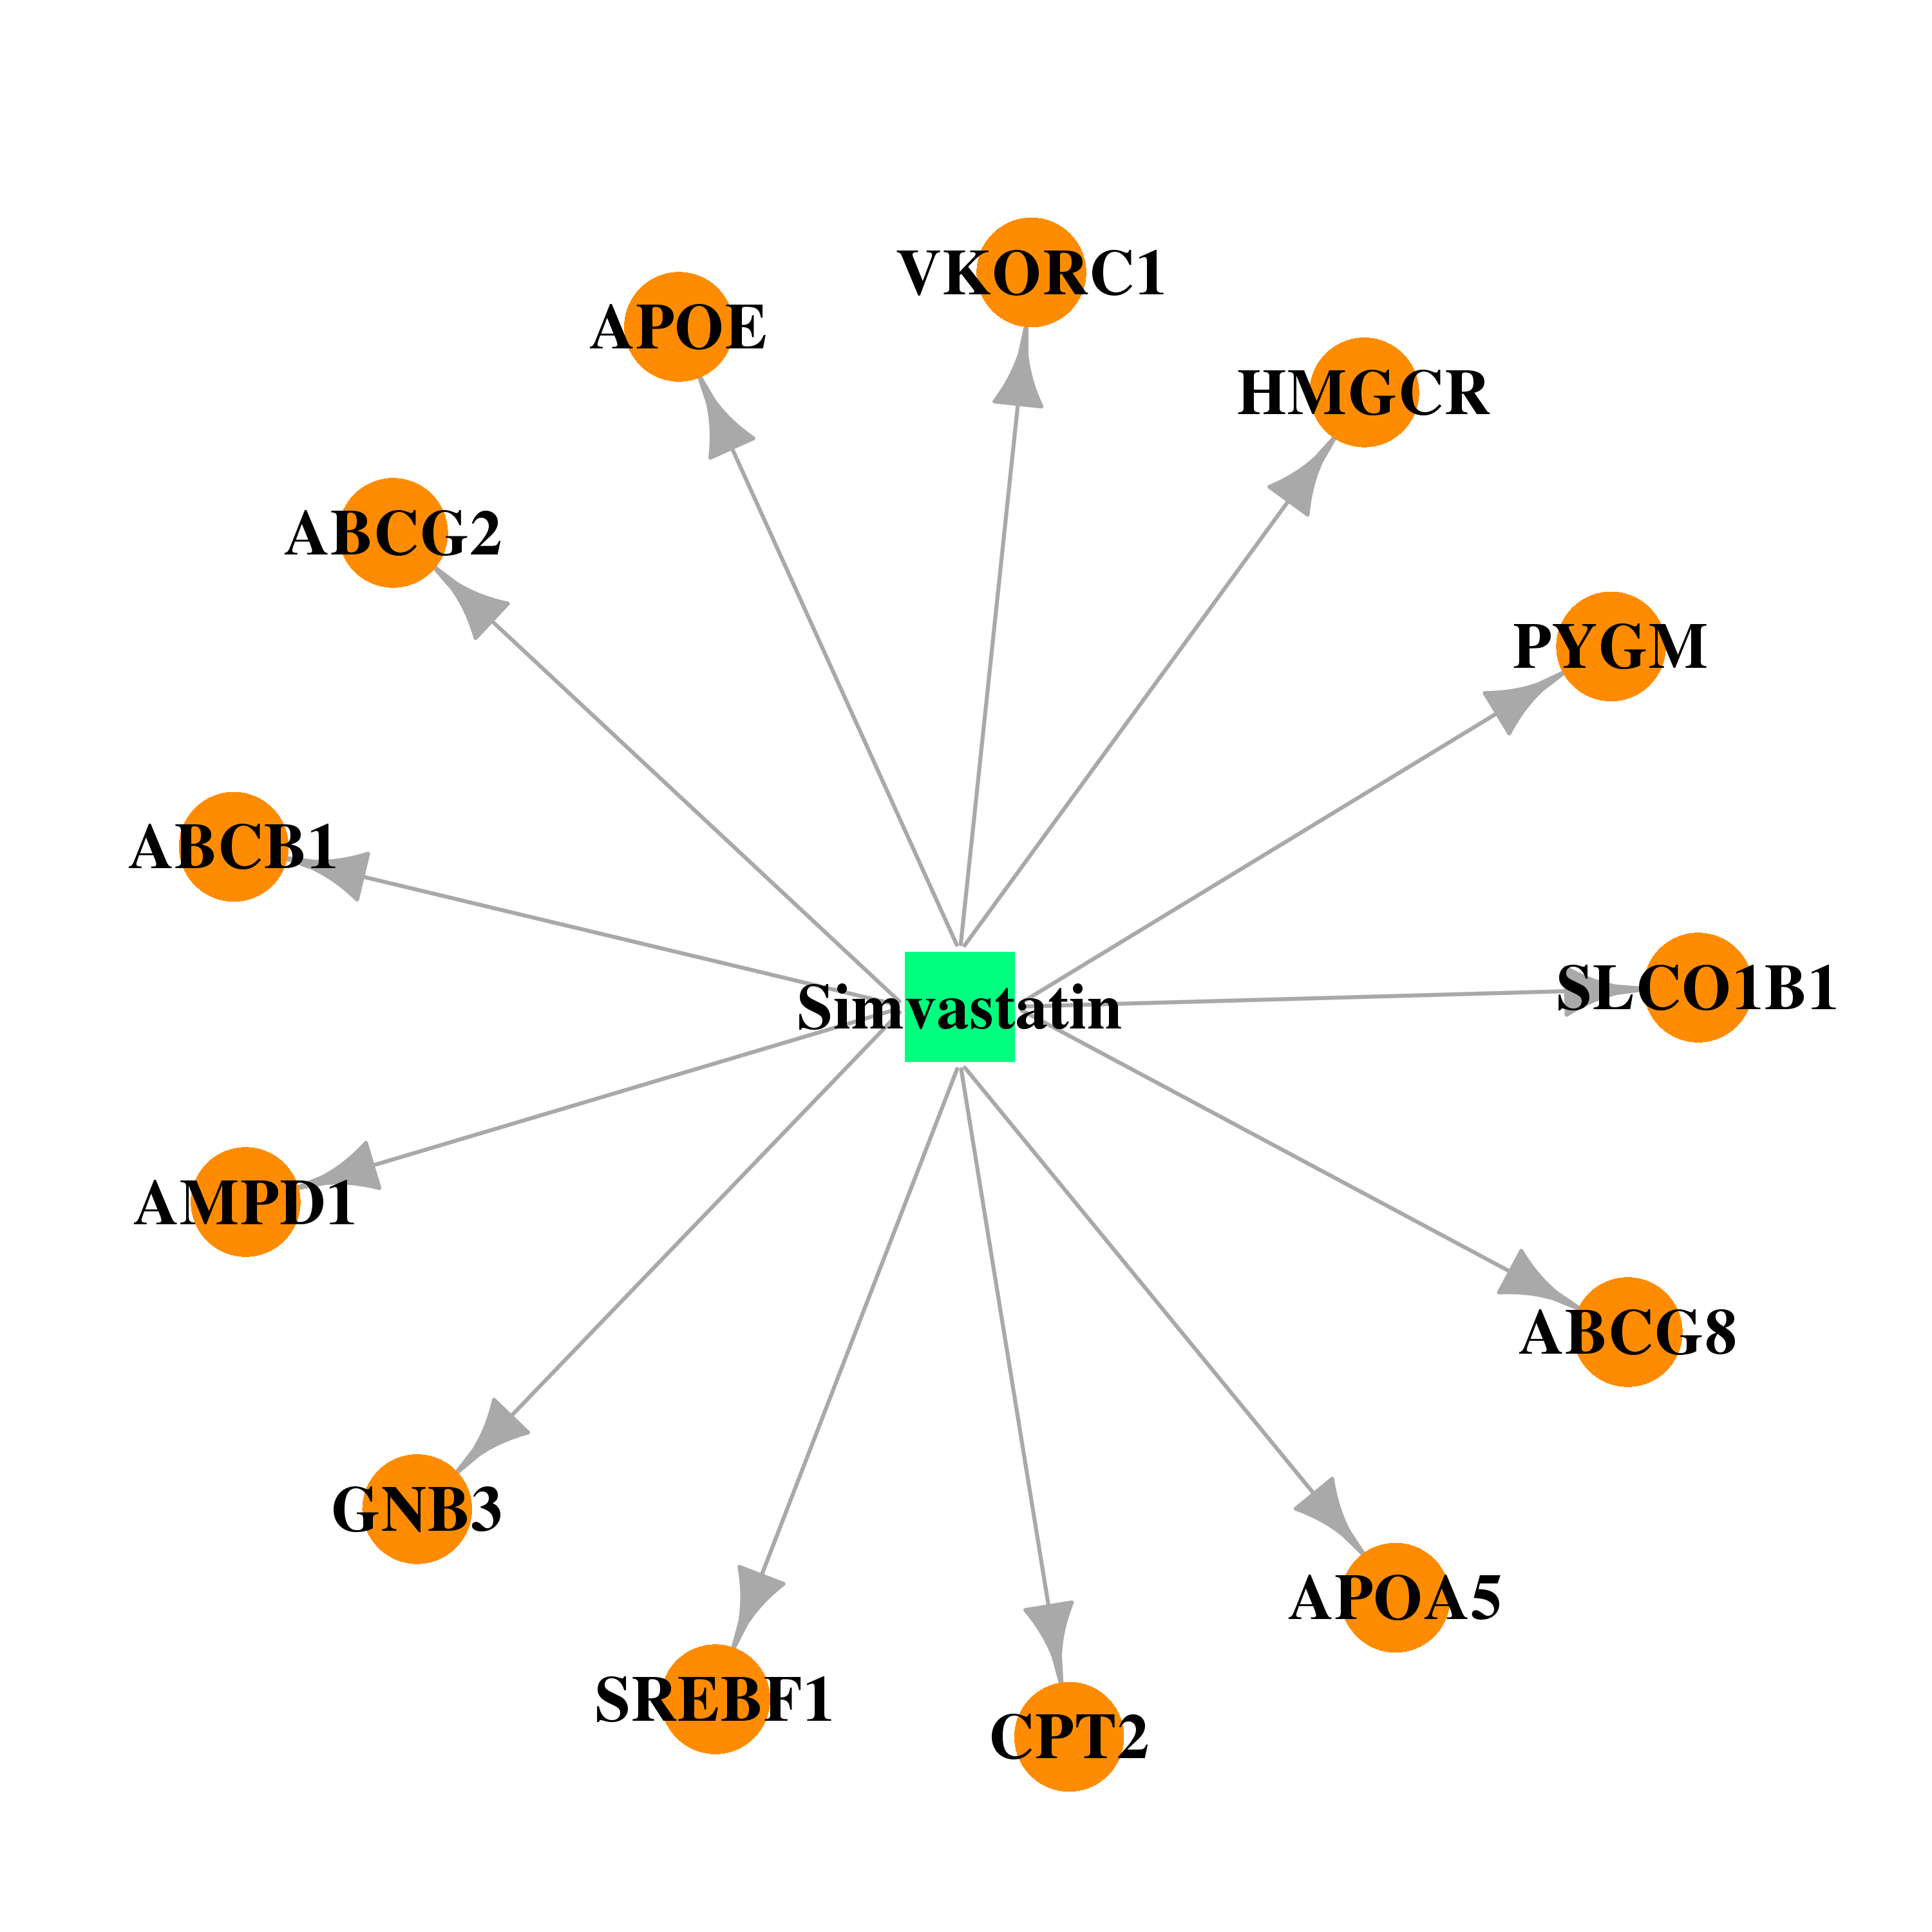 |  |
| DB00177 | guanine nucleotide binding protein (G protein), beta polypeptide 3 | approved; investigational | Valsartan |  |  |
| DB01392 | guanine nucleotide binding protein (G protein), beta polypeptide 3 | approved | Yohimbine |  | 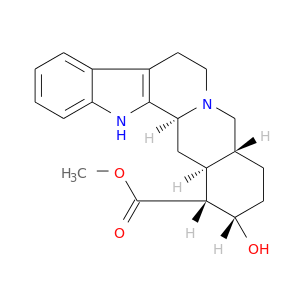 |
| DB01105 | guanine nucleotide binding protein (G protein), beta polypeptide 3 | illicit; approved; withdrawn; investigational | Sibutramine |  |  |
| DB00999 | guanine nucleotide binding protein (G protein), beta polypeptide 3 | approved | Hydrochlorothiazide | 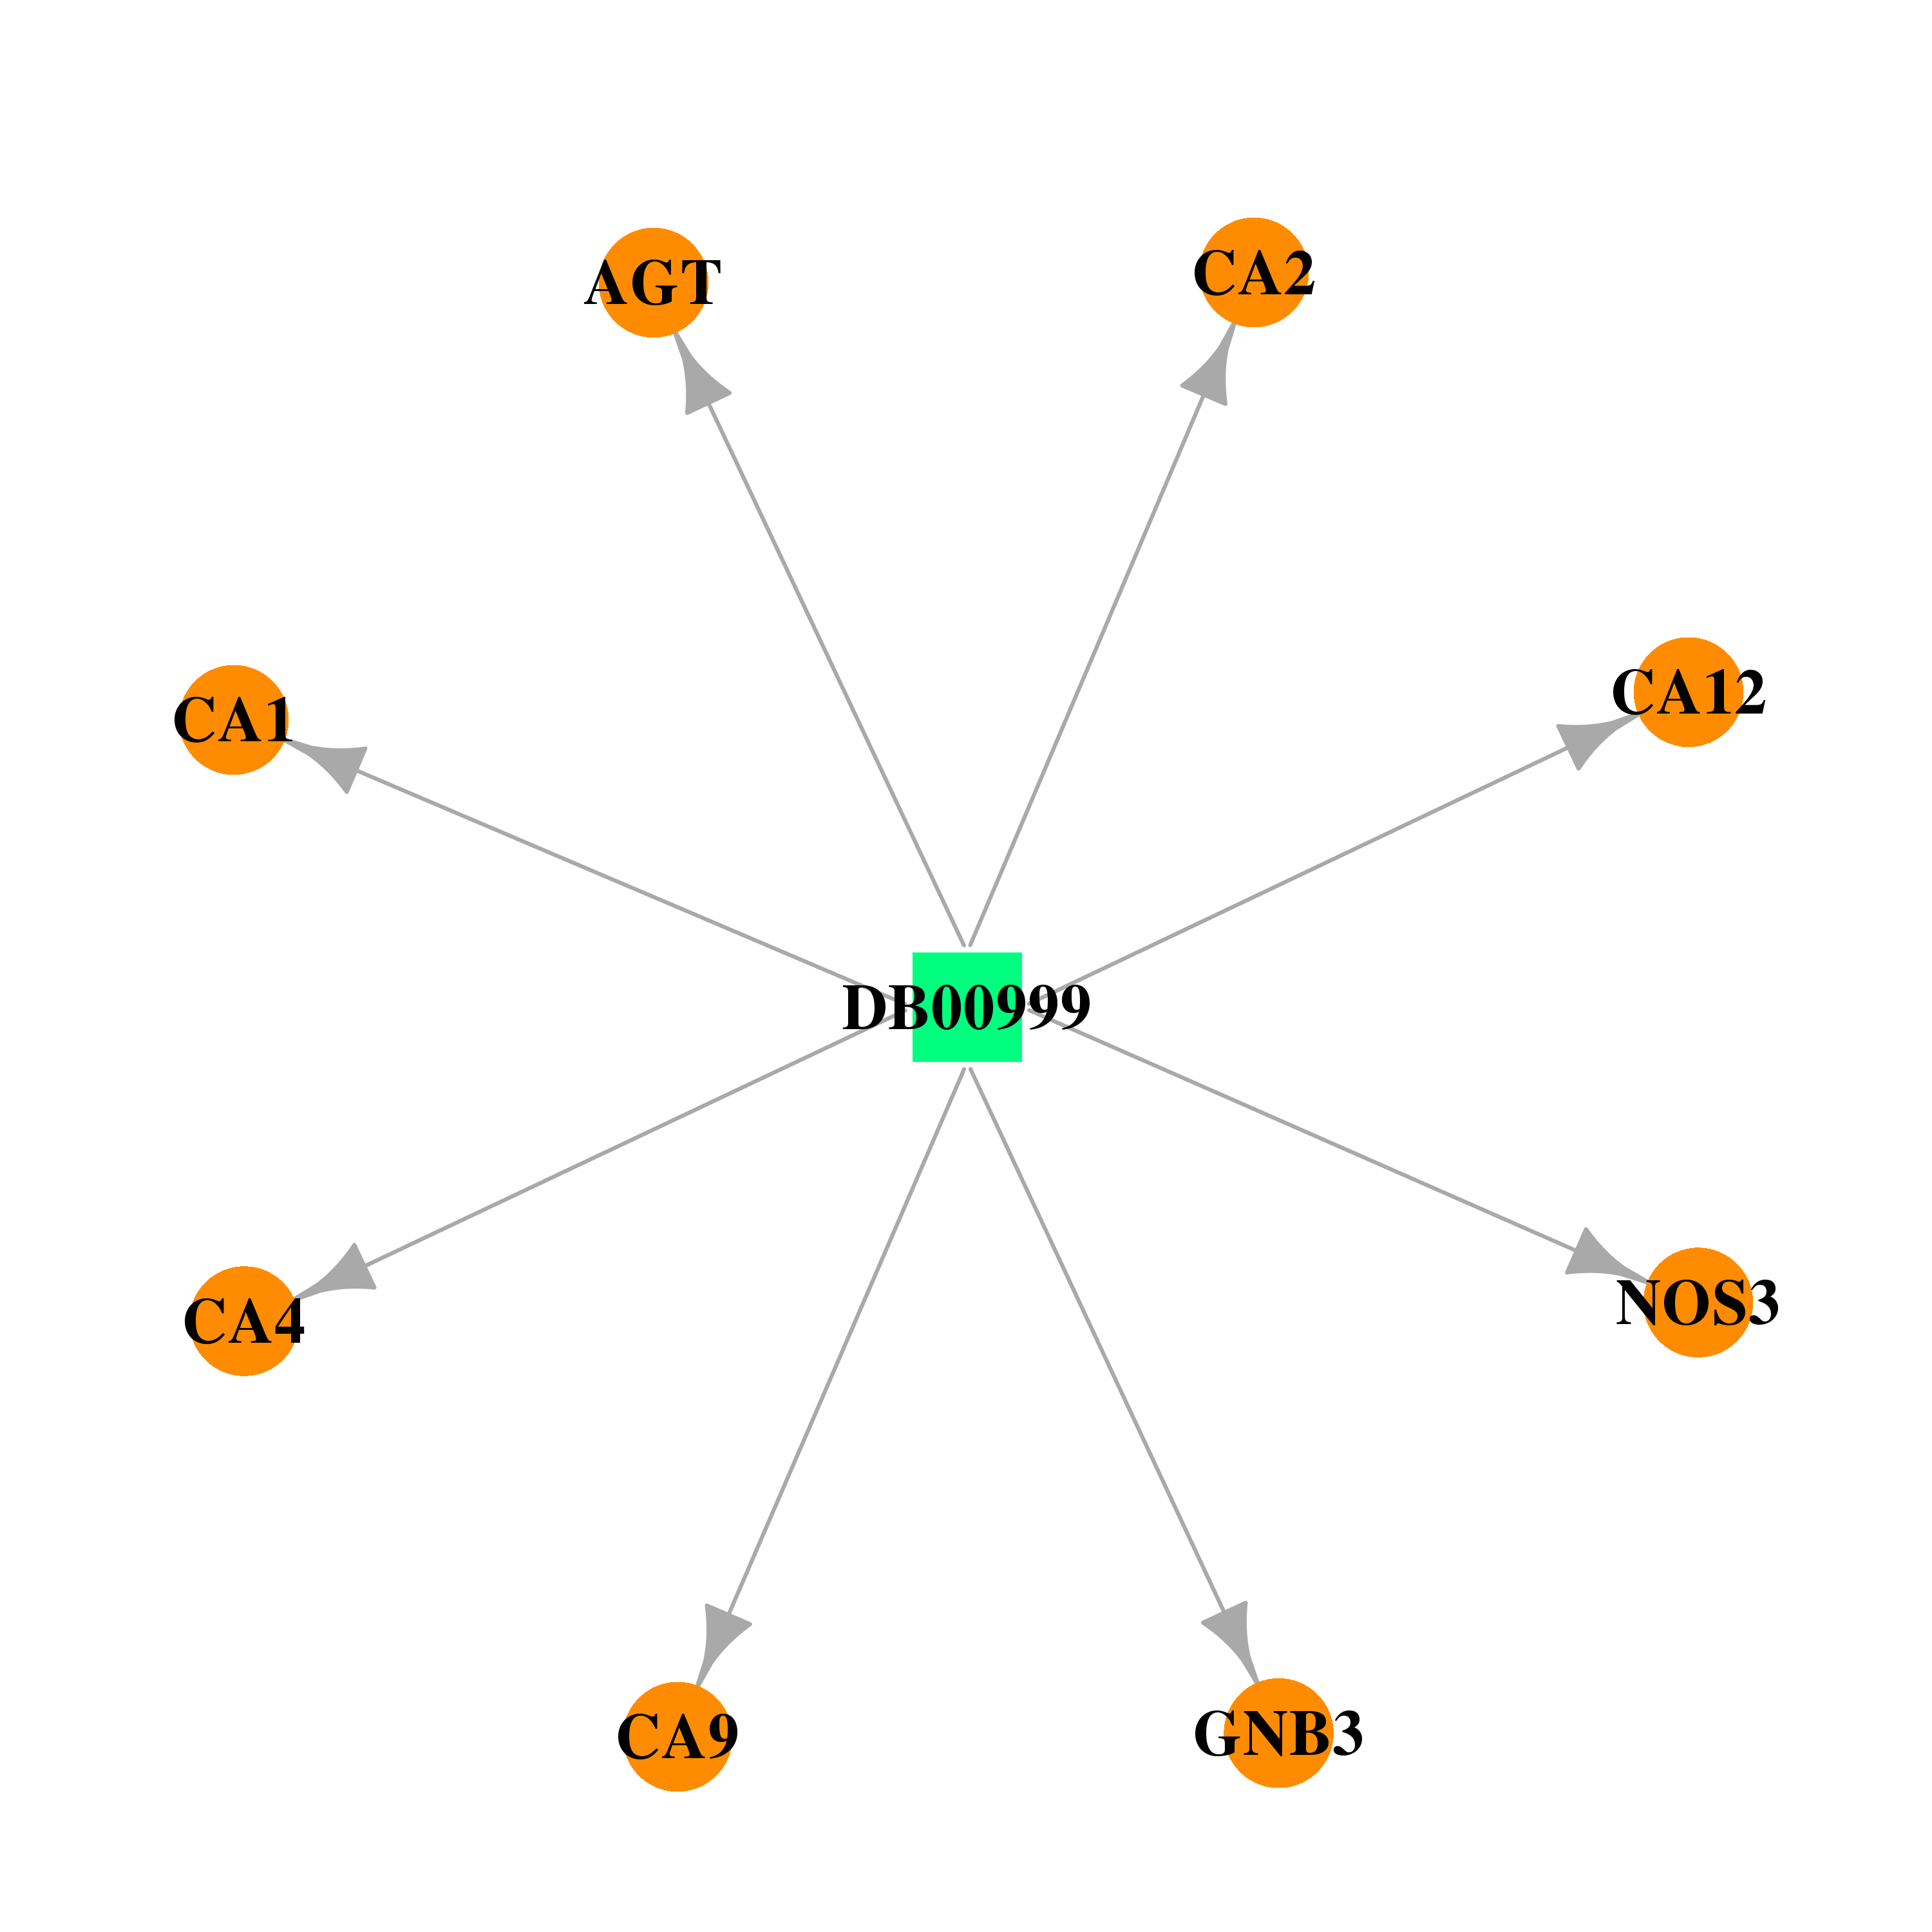 |  |
| DB00335 | guanine nucleotide binding protein (G protein), beta polypeptide 3 | approved | Atenolol | 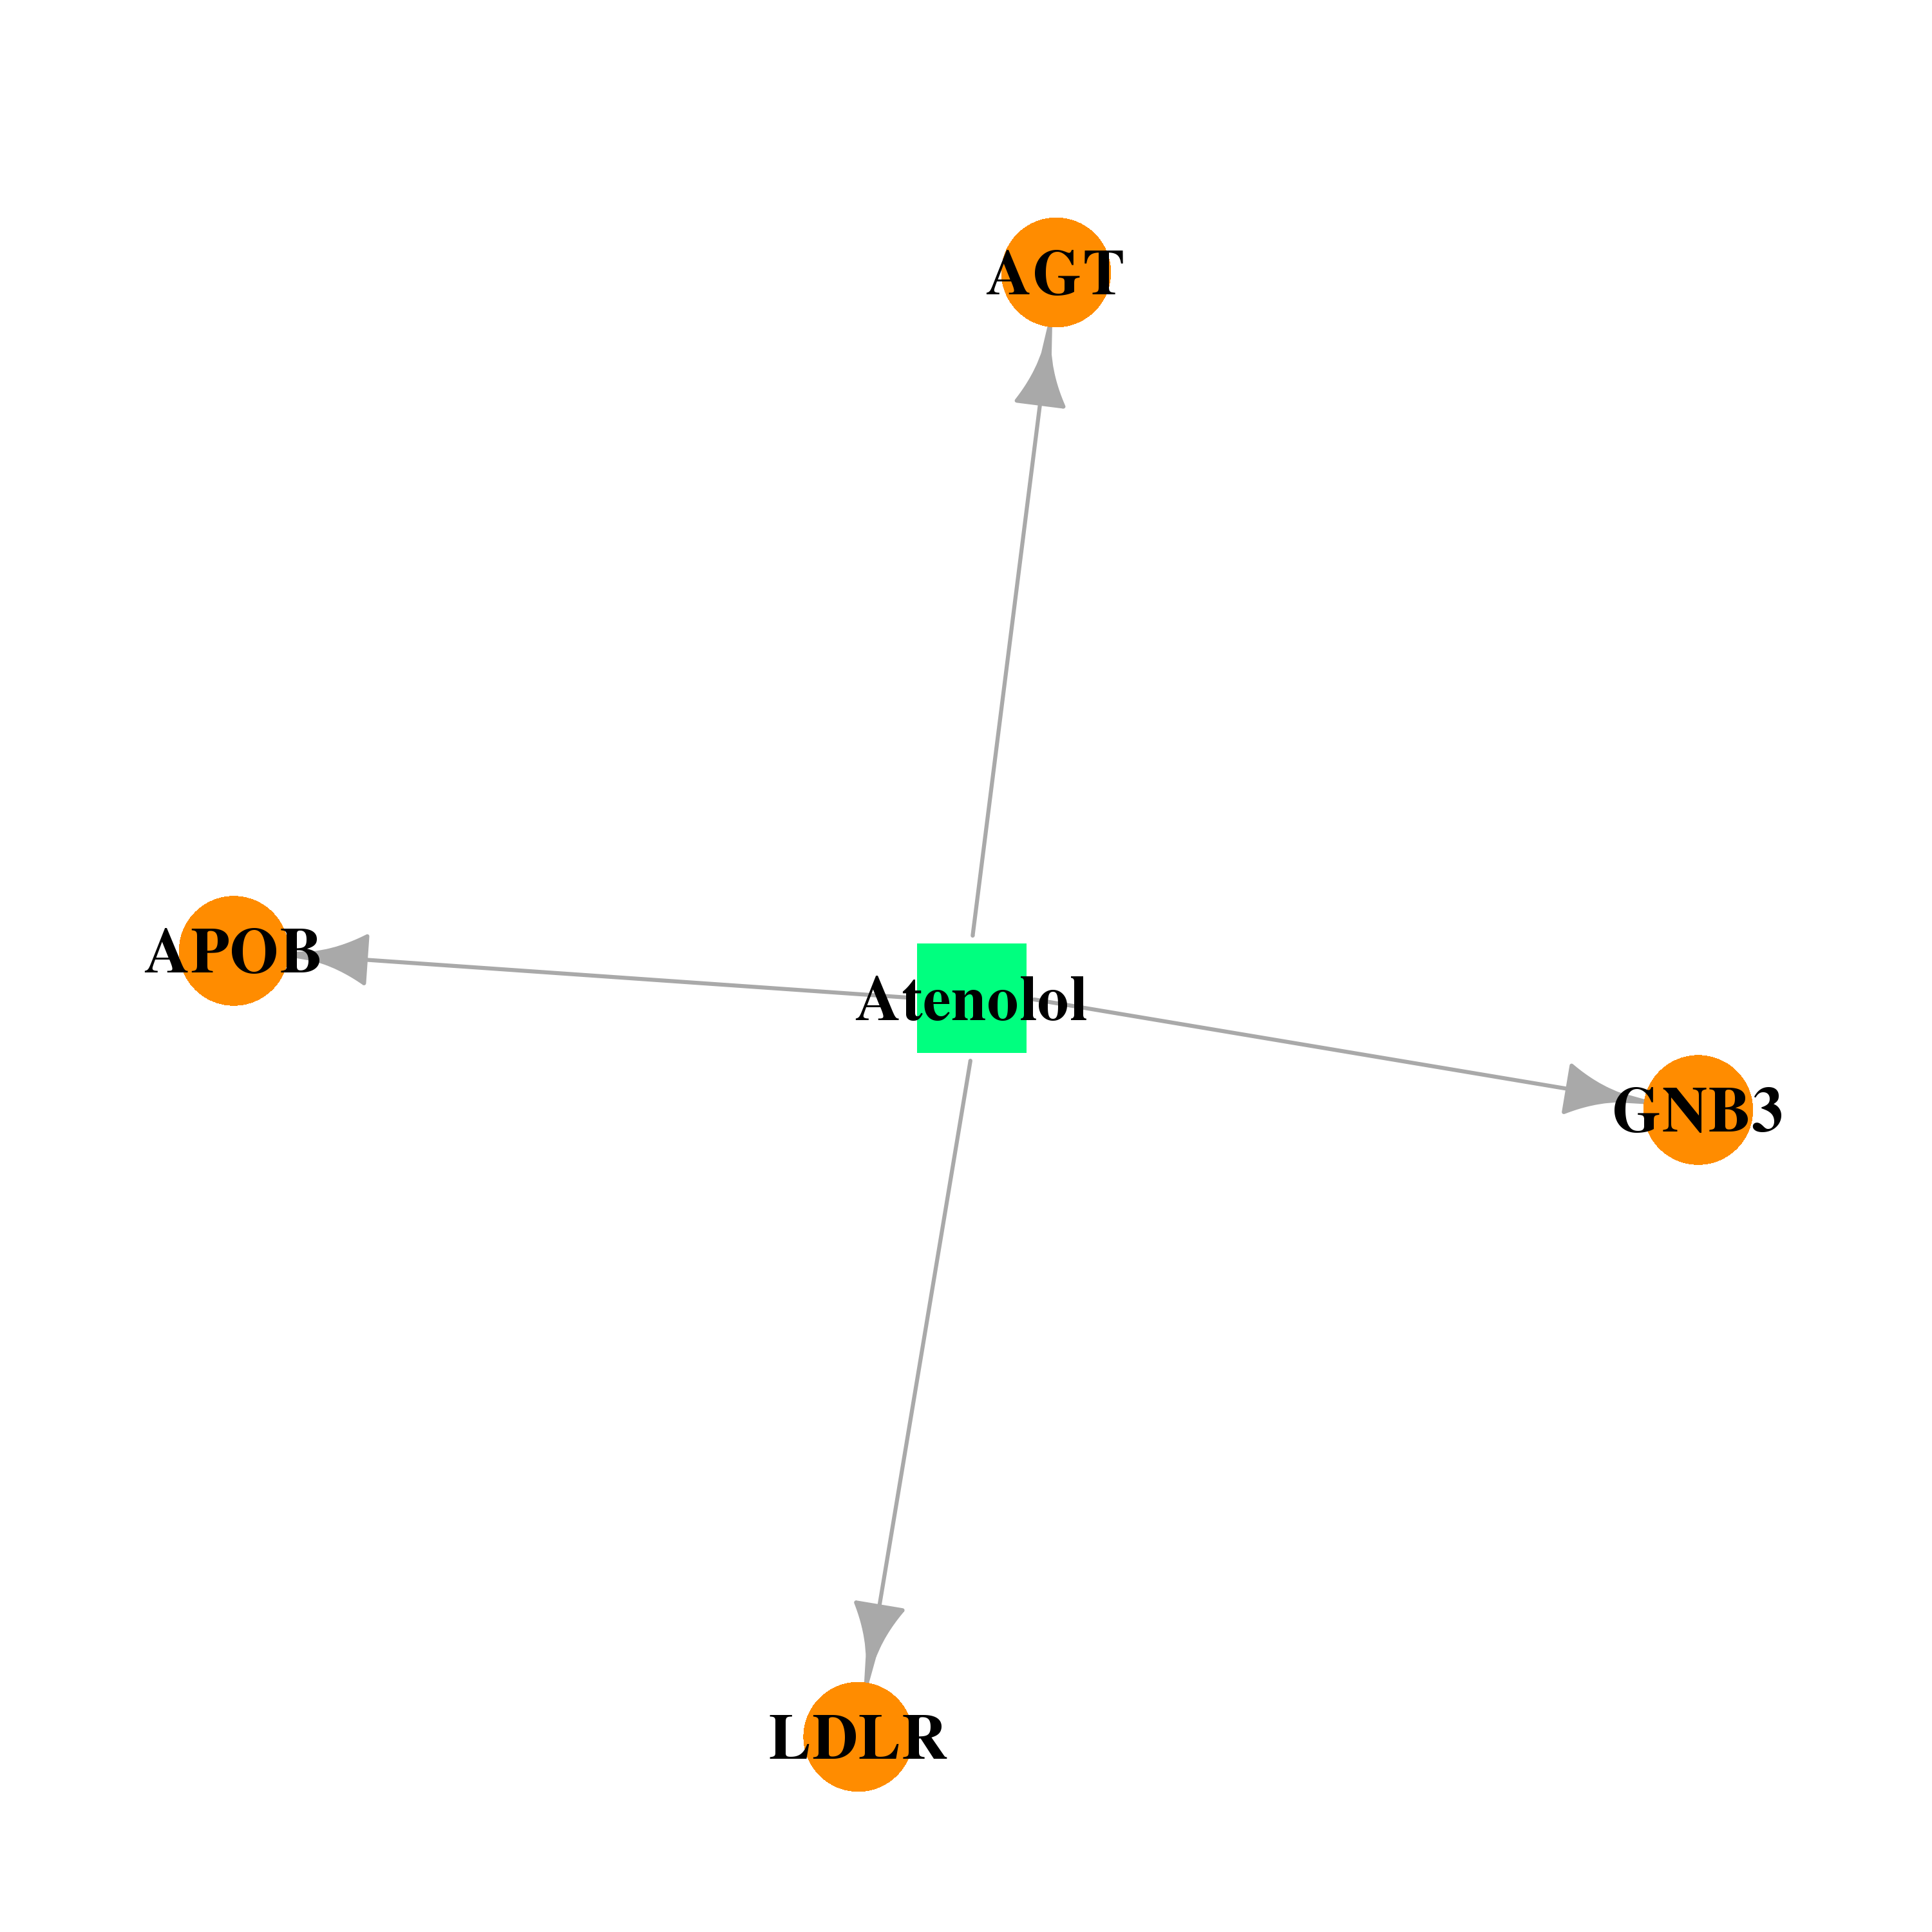 |  |
| Top |
| Cross referenced IDs for GNB3 |
| * We obtained these cross-references from Uniprot database. It covers 150 different DBs, 18 categories. http://www.uniprot.org/help/cross_references_section |
: Open all cross reference information
|
Copyright © 2016-Present - The Univsersity of Texas Health Science Center at Houston @ |