|
||||||||||||||||||||||||||||||||||||||||||||||||||||||||||||||||||||||||||||||||||||||||||||||||||||||||||||||||||||||||||||||||||||||||||||||||||||||||||||||||||||||||||||||||||||||||||||||||||||||||||||||||||||||||||||||||||||||||||||||||||||||||||||||||||||||||||||||||||||||||||||||||||||||||||||||||||||||||||
| |
| Phenotypic Information (metabolism pathway, cancer, disease, phenome) |
| |
| |
| Gene-Gene Network Information: Co-Expression Network, Interacting Genes & KEGG |
| |
|


| Gene Summary for GNG4 |
| Top |
| Phenotypic Information for GNG4(metabolism pathway, cancer, disease, phenome) |
| Cancer | CGAP: GNG4 |
| Familial Cancer Database: GNG4 | |
| * This gene is included in those cancer gene databases. |
|
|
|
|
|
| . | ||||||||||||||||||||||||||||||||||||||||||||||||||||||||||||||||||||||||||||||||||||||||||||||||||||||||||||||||||||||||||||||||||||||||||||||||||||||||||||||||||||||||||||||||||||||||||||||||||||||||||||||||||||||||||||||||||||||||||||||||||||||||||||||||||||||||||||||||||||||||||||||||||||||||||||||||||||
Oncogene 1 | Significant driver gene in | |||||||||||||||||||||||||||||||||||||||||||||||||||||||||||||||||||||||||||||||||||||||||||||||||||||||||||||||||||||||||||||||||||||||||||||||||||||||||||||||||||||||||||||||||||||||||||||||||||||||||||||||||||||||||||||||||||||||||||||||||||||||||||||||||||||||||||||||||||||||||||||||||||||||||||||||||||||||||
| cf) number; DB name 1 Oncogene; http://nar.oxfordjournals.org/content/35/suppl_1/D721.long, 2 Tumor Suppressor gene; https://bioinfo.uth.edu/TSGene/, 3 Cancer Gene Census; http://www.nature.com/nrc/journal/v4/n3/abs/nrc1299.html, 4 CancerGenes; http://nar.oxfordjournals.org/content/35/suppl_1/D721.long, 5 Network of Cancer Gene; http://ncg.kcl.ac.uk/index.php, 1Therapeutic Vulnerabilities in Cancer; http://cbio.mskcc.org/cancergenomics/statius/ |
| REACTOME_INTEGRATION_OF_ENERGY_METABOLISM | |
| OMIM | |
| Orphanet | |
| Disease | KEGG Disease: GNG4 |
| MedGen: GNG4 (Human Medical Genetics with Condition) | |
| ClinVar: GNG4 | |
| Phenotype | MGI: GNG4 (International Mouse Phenotyping Consortium) |
| PhenomicDB: GNG4 | |
| Mutations for GNG4 |
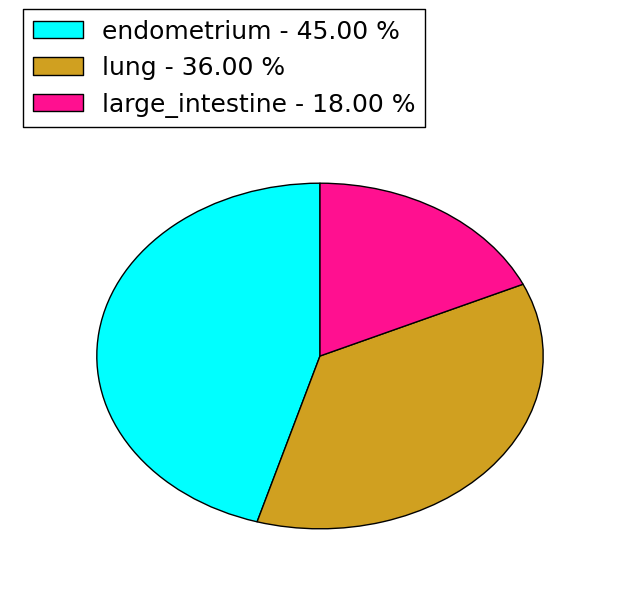
| * Under tables are showing count per each tissue to give us broad intuition about tissue specific mutation patterns.You can go to the detailed page for each mutation database's web site. |
| - Statistics for Tissue and Mutation type | Top |
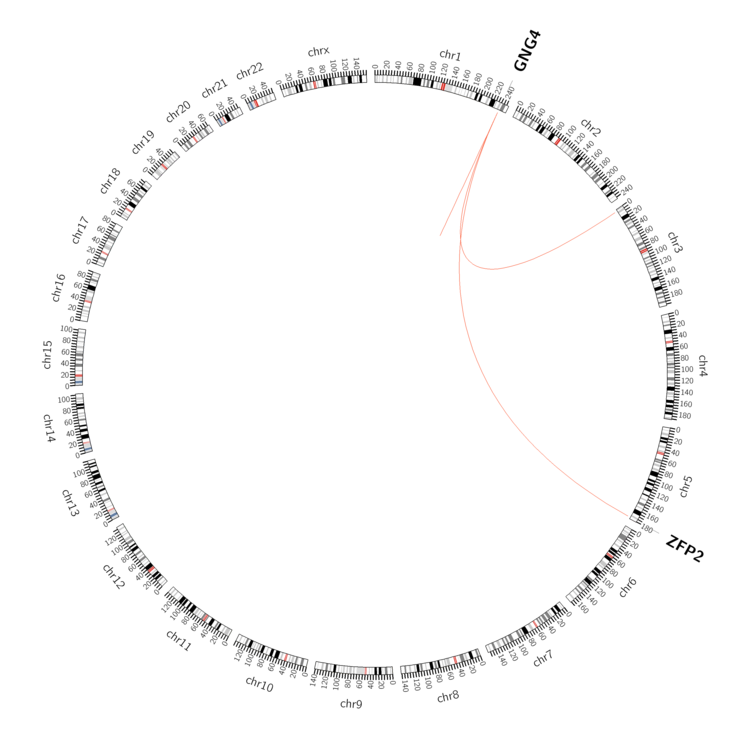 |
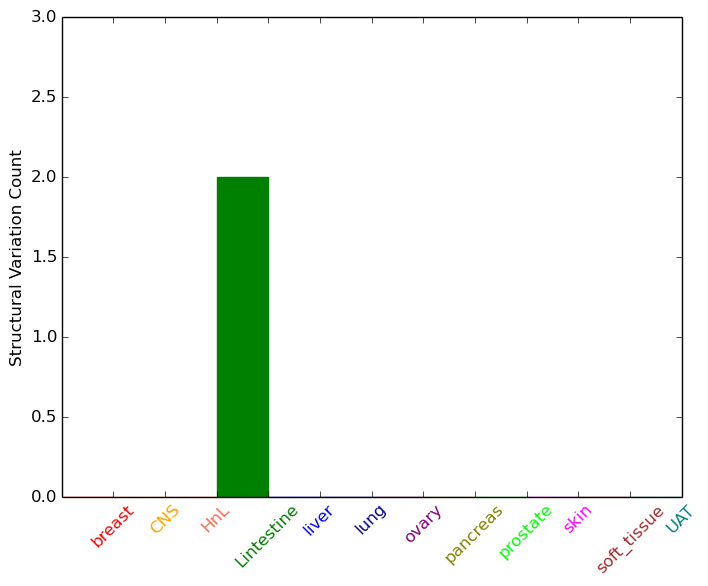
| - For Inter-chromosomal Variations |
| * Inter-chromosomal variantions includes 'interchromosomal amplicon to amplicon', 'interchromosomal amplicon to non-amplified dna', 'interchromosomal insertion', 'Interchromosomal unknown type'. |
 |
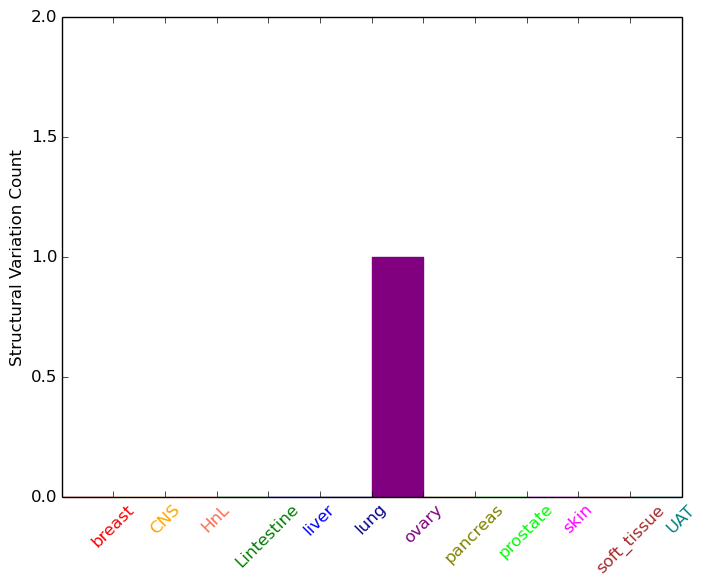
| - For Intra-chromosomal Variations |
| * Intra-chromosomal variantions includes 'intrachromosomal amplicon to amplicon', 'intrachromosomal amplicon to non-amplified dna', 'intrachromosomal deletion', 'intrachromosomal fold-back inversion', 'intrachromosomal inversion', 'intrachromosomal tandem duplication', 'Intrachromosomal unknown type', 'intrachromosomal with inverted orientation', 'intrachromosomal with non-inverted orientation'. |
 |
| Sample | Symbol_a | Chr_a | Start_a | End_a | Symbol_b | Chr_b | Start_b | End_b |
| large_intestine | GNG4 | chr1 | 235721067 | 235721067 | chr3 | 3298593 | 3298593 | |
| large_intestine | GNG4 | chr1 | 235796032 | 235796032 | ZFP2 | chr5 | 178346281 | 178346281 |
| ovary | GNG4 | chr1 | 235730555 | 235730575 | GNG4 | chr1 | 235730802 | 235730822 |
| cf) Tissue number; Tissue name (1;Breast, 2;Central_nervous_system, 3;Haematopoietic_and_lymphoid_tissue, 4;Large_intestine, 5;Liver, 6;Lung, 7;Ovary, 8;Pancreas, 9;Prostate, 10;Skin, 11;Soft_tissue, 12;Upper_aerodigestive_tract) |
| * From mRNA Sanger sequences, Chitars2.0 arranged chimeric transcripts. This table shows GNG4 related fusion information. |
| ID | Head Gene | Tail Gene | Accession | Gene_a | qStart_a | qEnd_a | Chromosome_a | tStart_a | tEnd_a | Gene_a | qStart_a | qEnd_a | Chromosome_a | tStart_a | tEnd_a |
| AW888605 | GNG4 | 14 | 71 | 1 | 235714929 | 235714990 | SORBS1 | 66 | 143 | 10 | 97072737 | 97072814 | |
| AW880094 | LOC100507412 | 11 | 48 | ? | 117701 | 117739 | GNG4 | 47 | 70 | 1 | 235806442 | 235806465 | |
| AV747616 | ATF6B | 1 | 85 | 6 | 3468011 | 3468095 | GNG4 | 86 | 411 | 1 | 235714207 | 235714533 | |
| AA743558 | GNG4 | 1 | 21 | 1 | 235801786 | 235801806 | PSMD10 | 13 | 335 | X | 107327444 | 107327765 | |
| Top |
| Mutation type/ Tissue ID | brca | cns | cerv | endome | haematopo | kidn | Lintest | liver | lung | ns | ovary | pancre | prost | skin | stoma | thyro | urina | |||
| Total # sample | 4 | 1 | ||||||||||||||||||
| GAIN (# sample) | 4 | 1 | ||||||||||||||||||
| LOSS (# sample) |
| cf) Tissue ID; Tissue type (1; Breast, 2; Central_nervous_system, 3; Cervix, 4; Endometrium, 5; Haematopoietic_and_lymphoid_tissue, 6; Kidney, 7; Large_intestine, 8; Liver, 9; Lung, 10; NS, 11; Ovary, 12; Pancreas, 13; Prostate, 14; Skin, 15; Stomach, 16; Thyroid, 17; Urinary_tract) |
| Top |
|
 |
| Top |
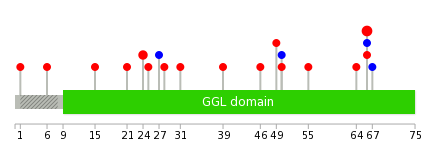
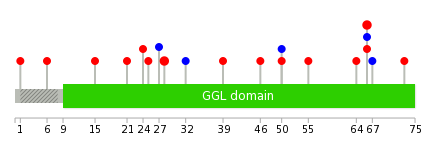
| Stat. for Non-Synonymous SNVs (# total SNVs=11) | (# total SNVs=3) |
 |  |
(# total SNVs=0) | (# total SNVs=0) |
| Top |
| * When you move the cursor on each content, you can see more deailed mutation information on the Tooltip. Those are primary_site,primary_histology,mutation(aa),pubmedID. |
| GRCh37 position | Mutation(aa) | Unique sampleID count |
| chr1:235715441-235715441 | p.R66C | 4 |
| chr1:235715489-235715489 | p.R50R | 2 |
| chr1:235747067-235747067 | p.K24N | 2 |
| chr1:235747123-235747123 | p.S6P | 1 |
| chr1:235715492-235715492 | p.V49L | 1 |
| chr1:235747136-235747136 | p.M1I | 1 |
| chr1:235715501-235715501 | p.E46K | 1 |
| chr1:235715522-235715522 | p.A39T | 1 |
| chr1:235747047-235747047 | p.R31K | 1 |
| chr1:235715436-235715436 | p.E67E | 1 |
| Top |
|
 |
| Point Mutation/ Tissue ID | 1 | 2 | 3 | 4 | 5 | 6 | 7 | 8 | 9 | 10 | 11 | 12 | 13 | 14 | 15 | 16 | 17 | 18 | 19 | 20 |
| # sample | 3 | 4 | 2 | 2 | 3 | 1 | 6 | |||||||||||||
| # mutation | 4 | 4 | 2 | 2 | 3 | 1 | 6 | |||||||||||||
| nonsynonymous SNV | 4 | 2 | 1 | 2 | 2 | 1 | 5 | |||||||||||||
| synonymous SNV | 2 | 1 | 1 | 1 |
| cf) Tissue ID; Tissue type (1; BLCA[Bladder Urothelial Carcinoma], 2; BRCA[Breast invasive carcinoma], 3; CESC[Cervical squamous cell carcinoma and endocervical adenocarcinoma], 4; COAD[Colon adenocarcinoma], 5; GBM[Glioblastoma multiforme], 6; Glioma Low Grade, 7; HNSC[Head and Neck squamous cell carcinoma], 8; KICH[Kidney Chromophobe], 9; KIRC[Kidney renal clear cell carcinoma], 10; KIRP[Kidney renal papillary cell carcinoma], 11; LAML[Acute Myeloid Leukemia], 12; LUAD[Lung adenocarcinoma], 13; LUSC[Lung squamous cell carcinoma], 14; OV[Ovarian serous cystadenocarcinoma ], 15; PAAD[Pancreatic adenocarcinoma], 16; PRAD[Prostate adenocarcinoma], 17; SKCM[Skin Cutaneous Melanoma], 18:STAD[Stomach adenocarcinoma], 19:THCA[Thyroid carcinoma], 20:UCEC[Uterine Corpus Endometrial Carcinoma]) |
| Top |
| * We represented just top 10 SNVs. When you move the cursor on each content, you can see more deailed mutation information on the Tooltip. Those are primary_site, primary_histology, mutation(aa), pubmedID. |
| Genomic Position | Mutation(aa) | Unique sampleID count |
| chr1:235715489 | p.C28F,GNG4 | 2 |
| chr1:235747056 | p.R66C,GNG4 | 2 |
| chr1:235715441 | p.R50R,GNG4 | 2 |
| chr1:235715474 | p.A27A,GNG4 | 1 |
| chr1:235747123 | p.M25I,GNG4 | 1 |
| chr1:235747136 | p.K24N,GNG4 | 1 |
| chr1:235715501 | p.E21K,GNG4 | 1 |
| chr1:235715522 | p.Q15R,GNG4 | 1 |
| chr1:235747043 | p.T73A,GNG4 | 1 |
| chr1:235715420 | p.S6P,GNG4 | 1 |
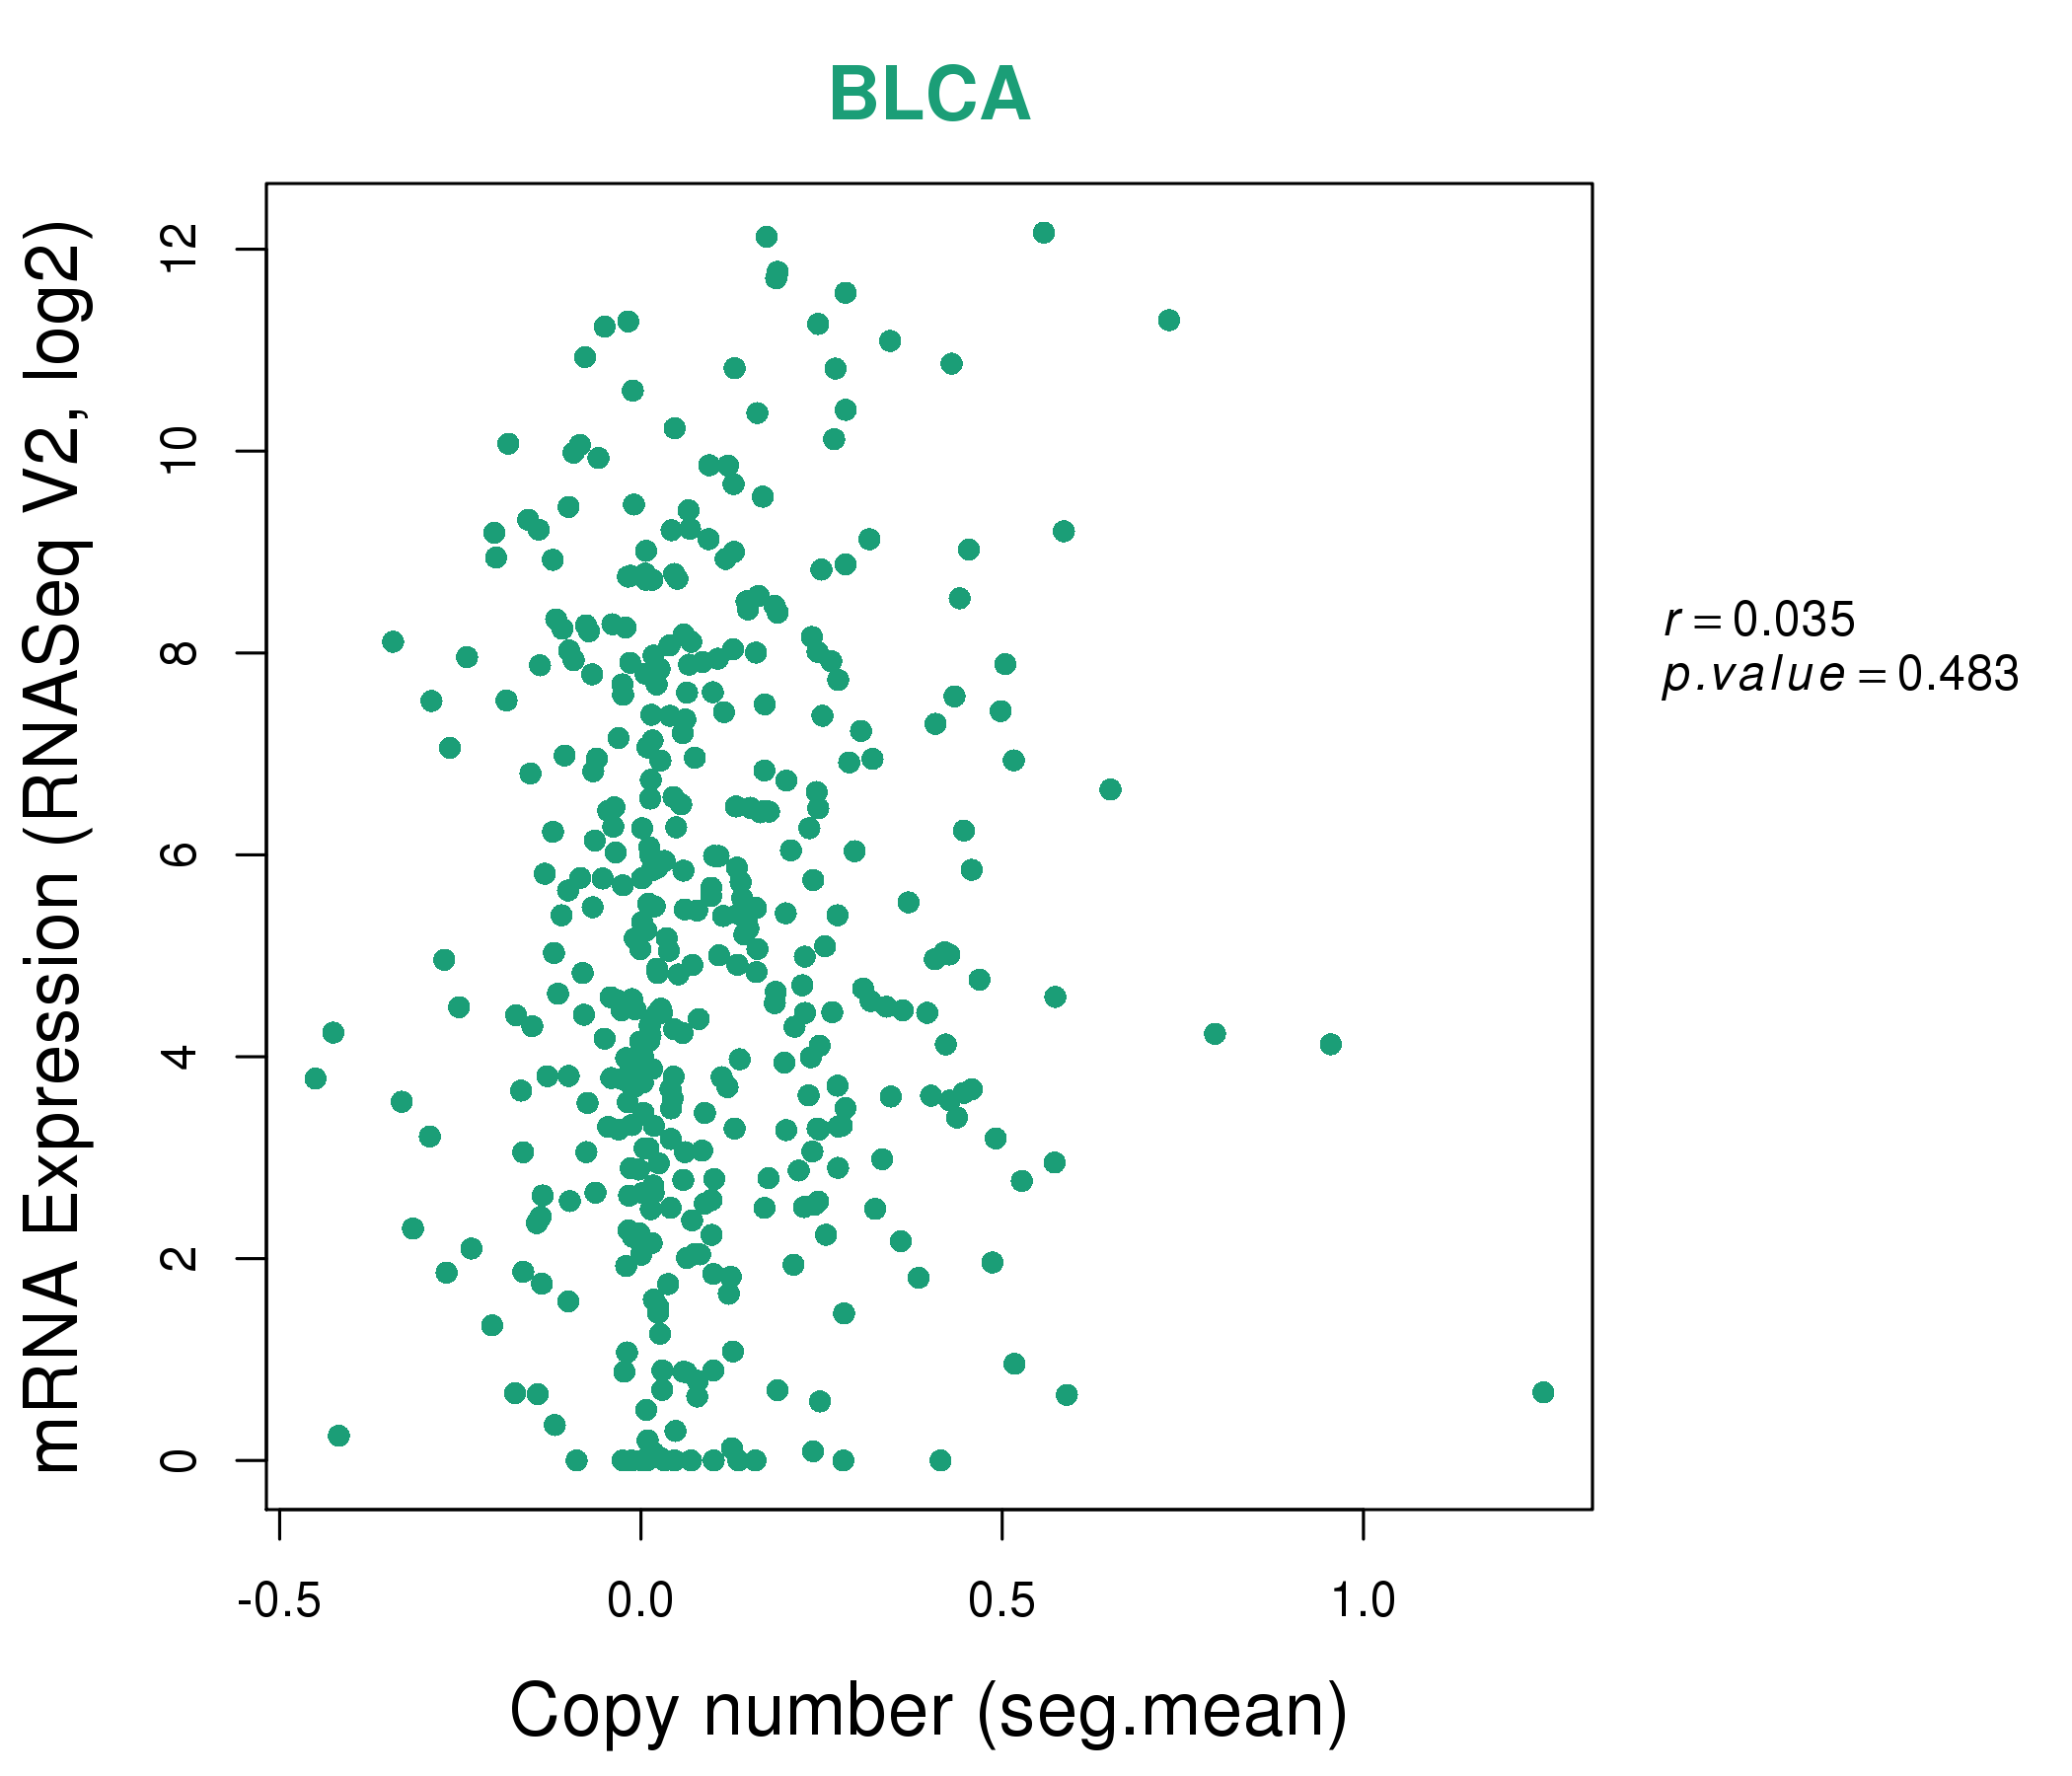
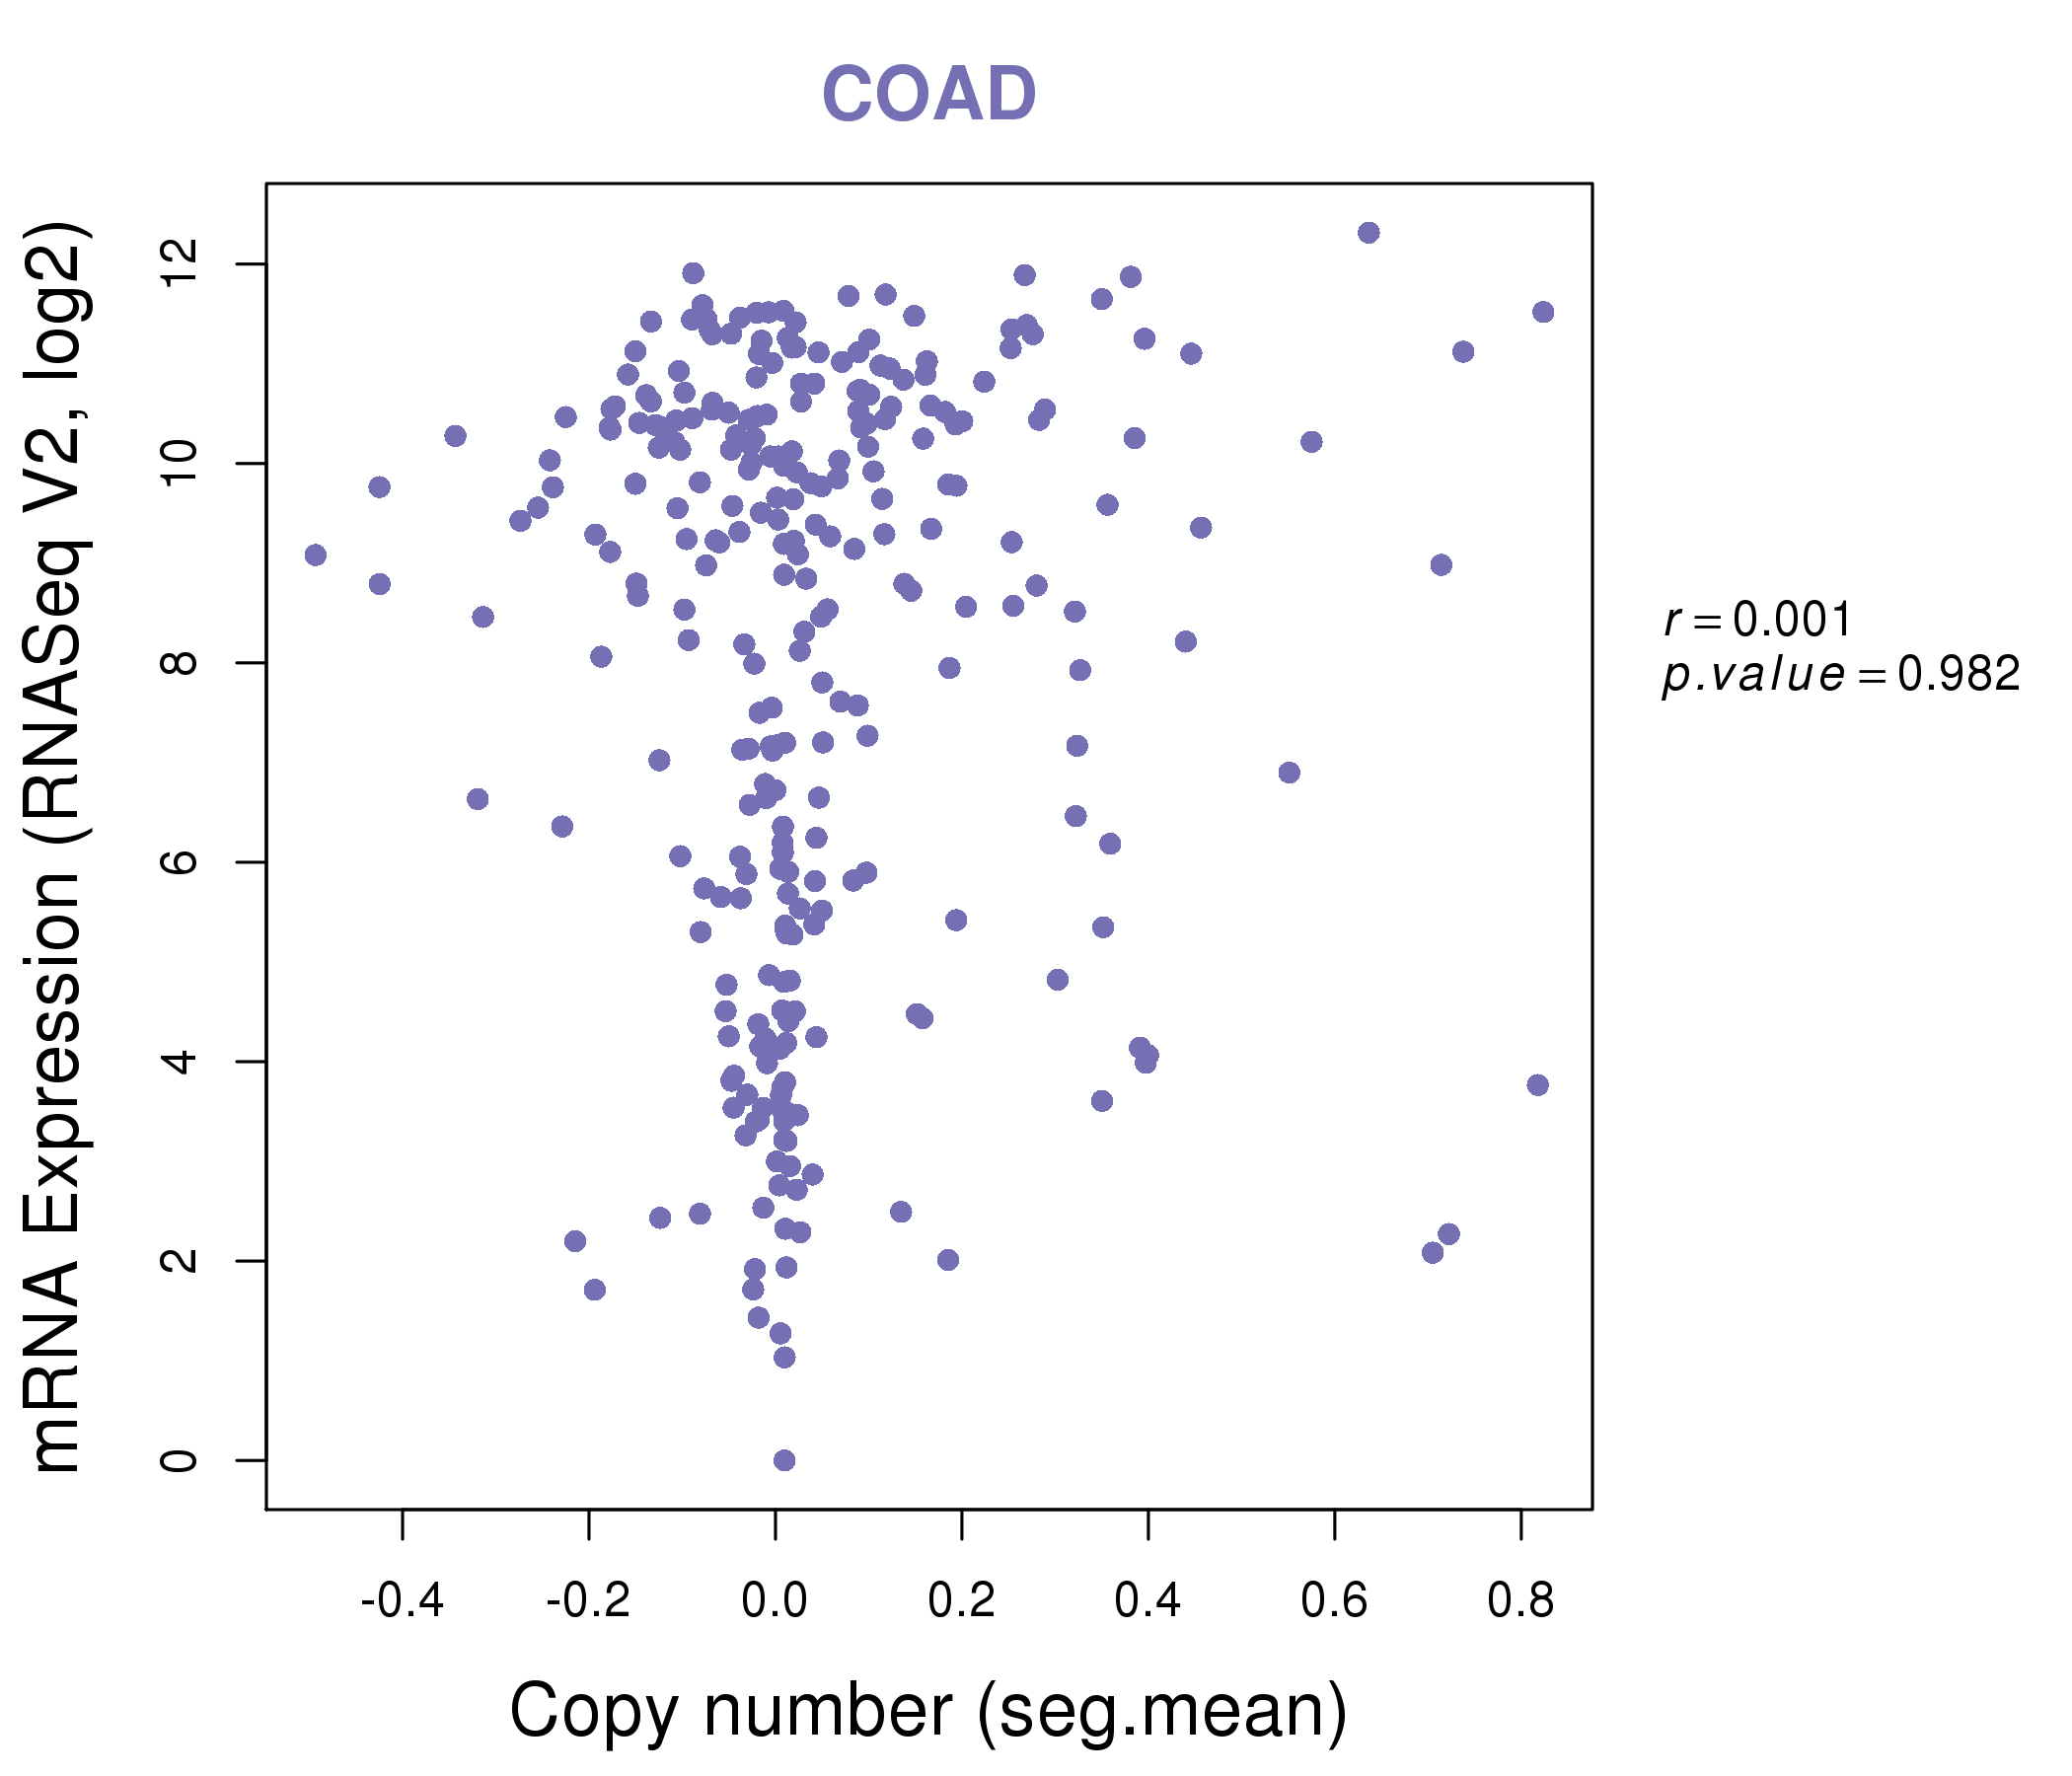
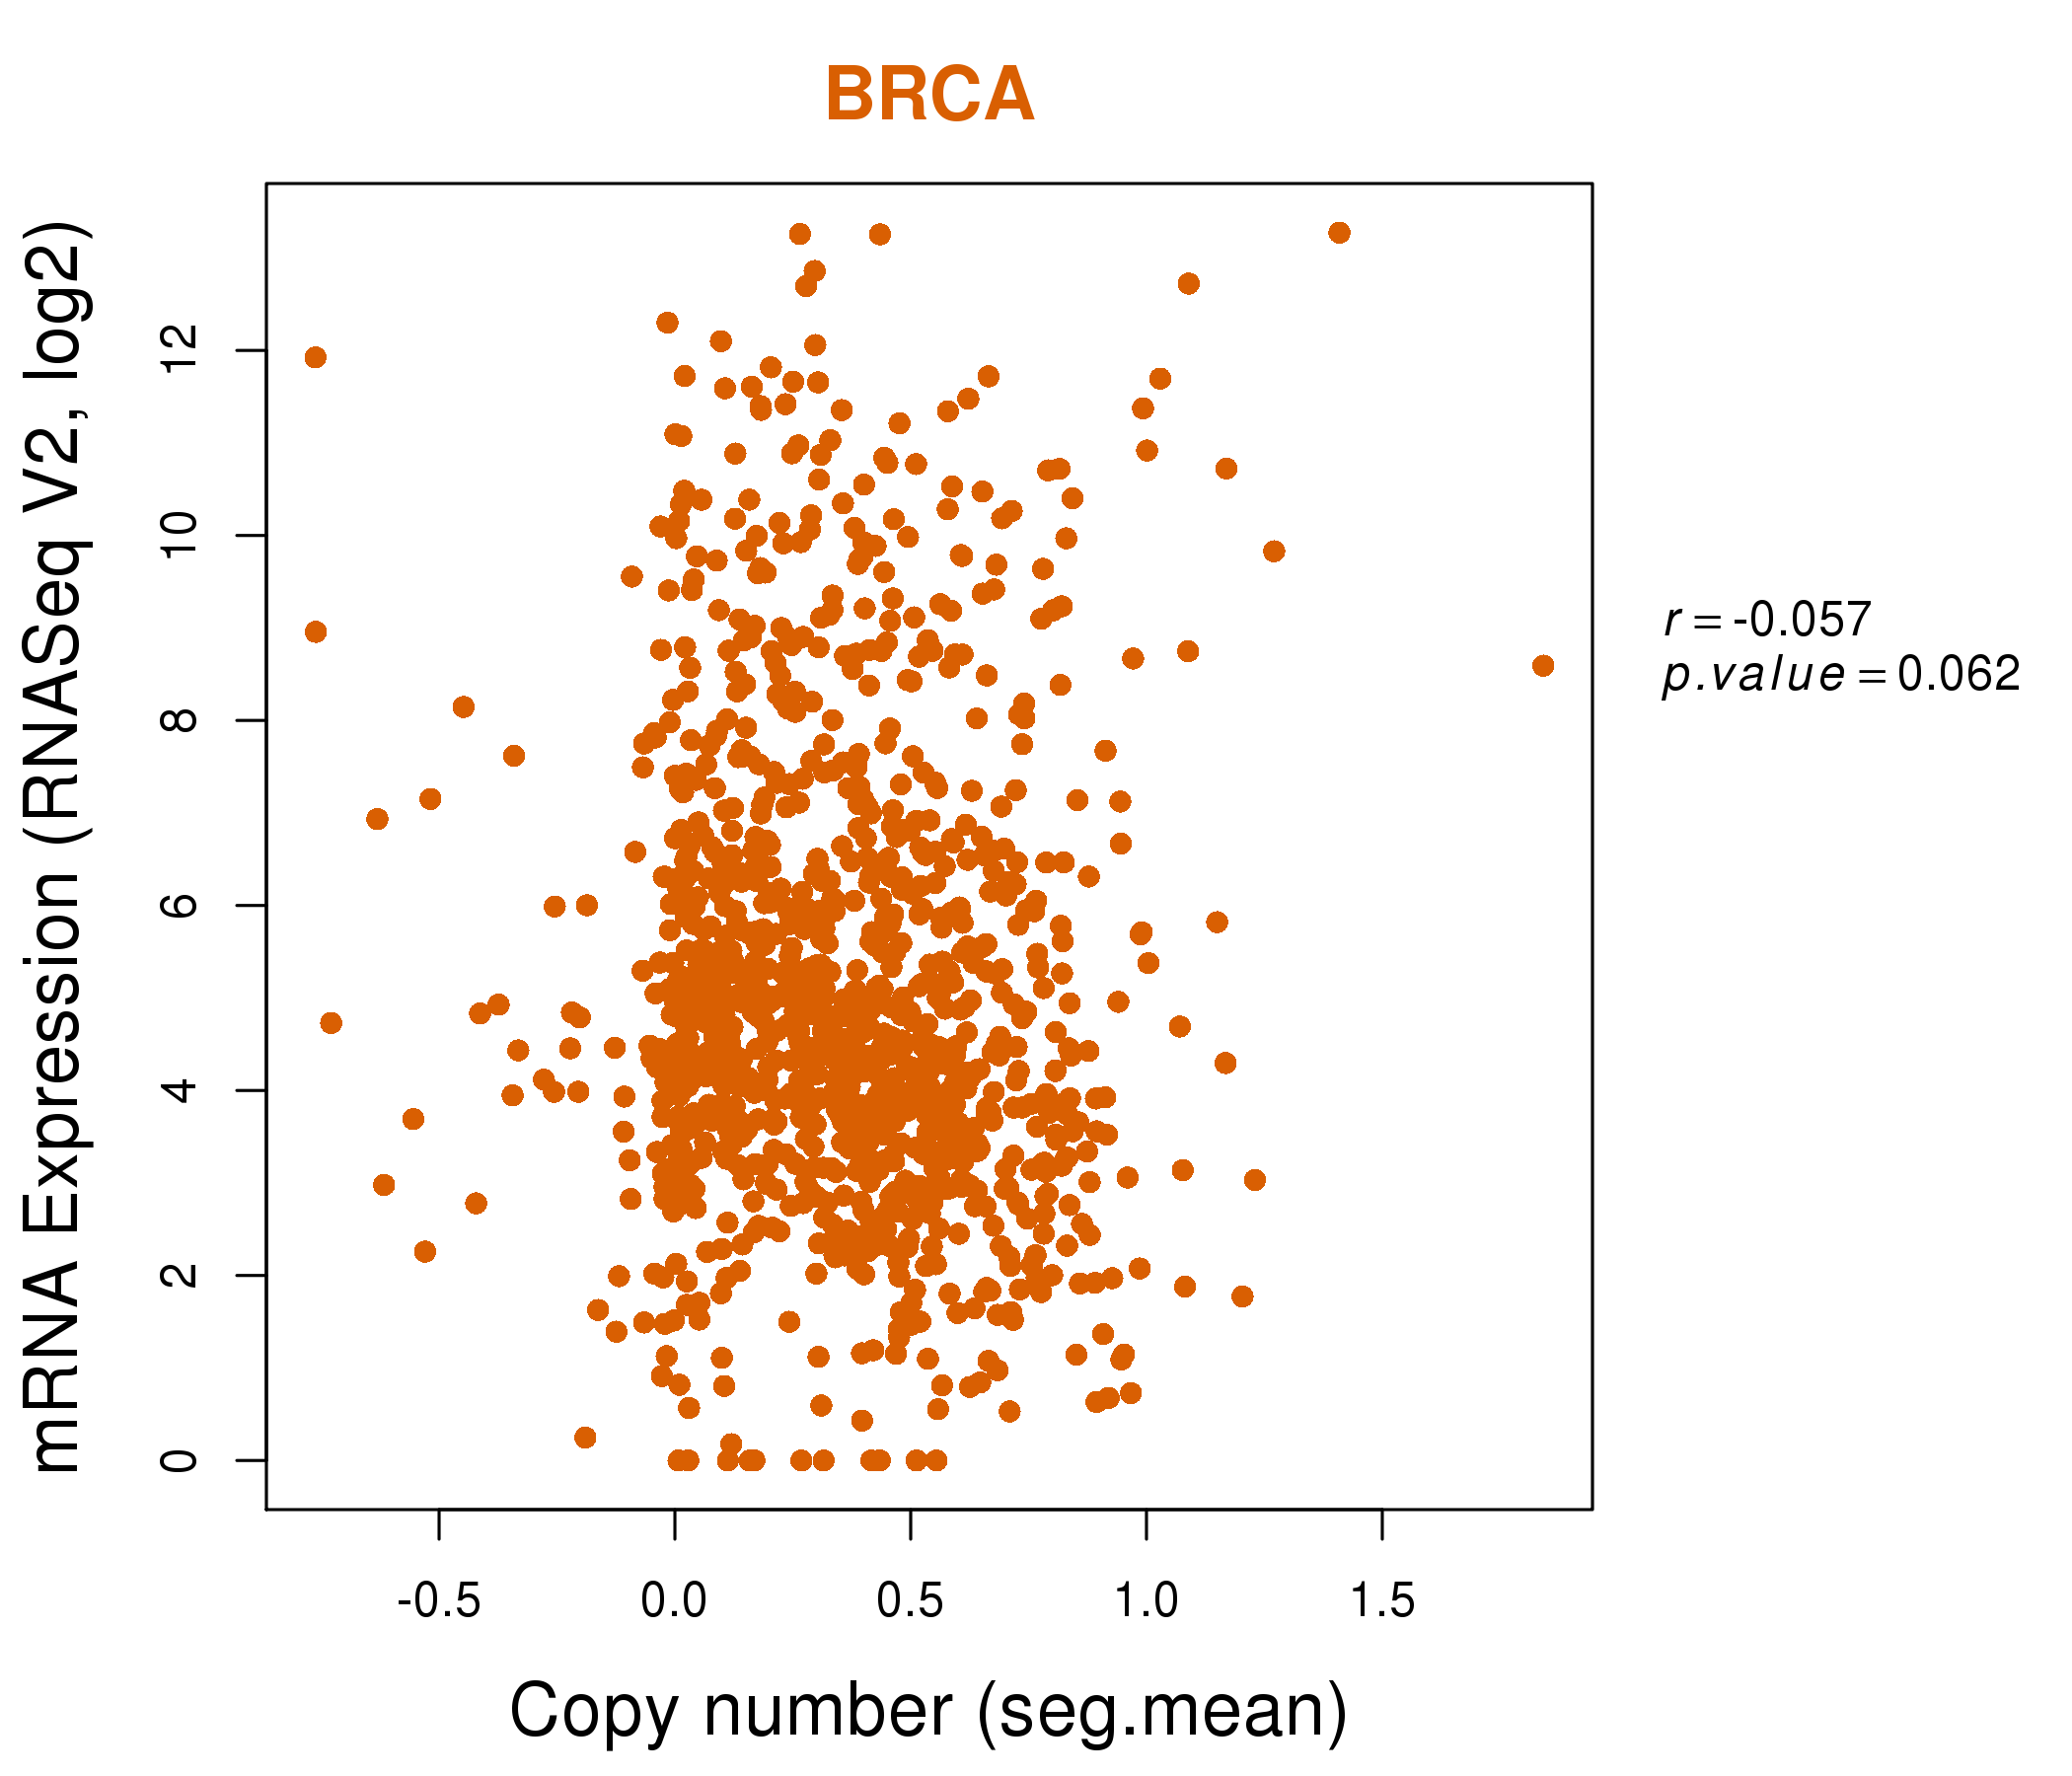
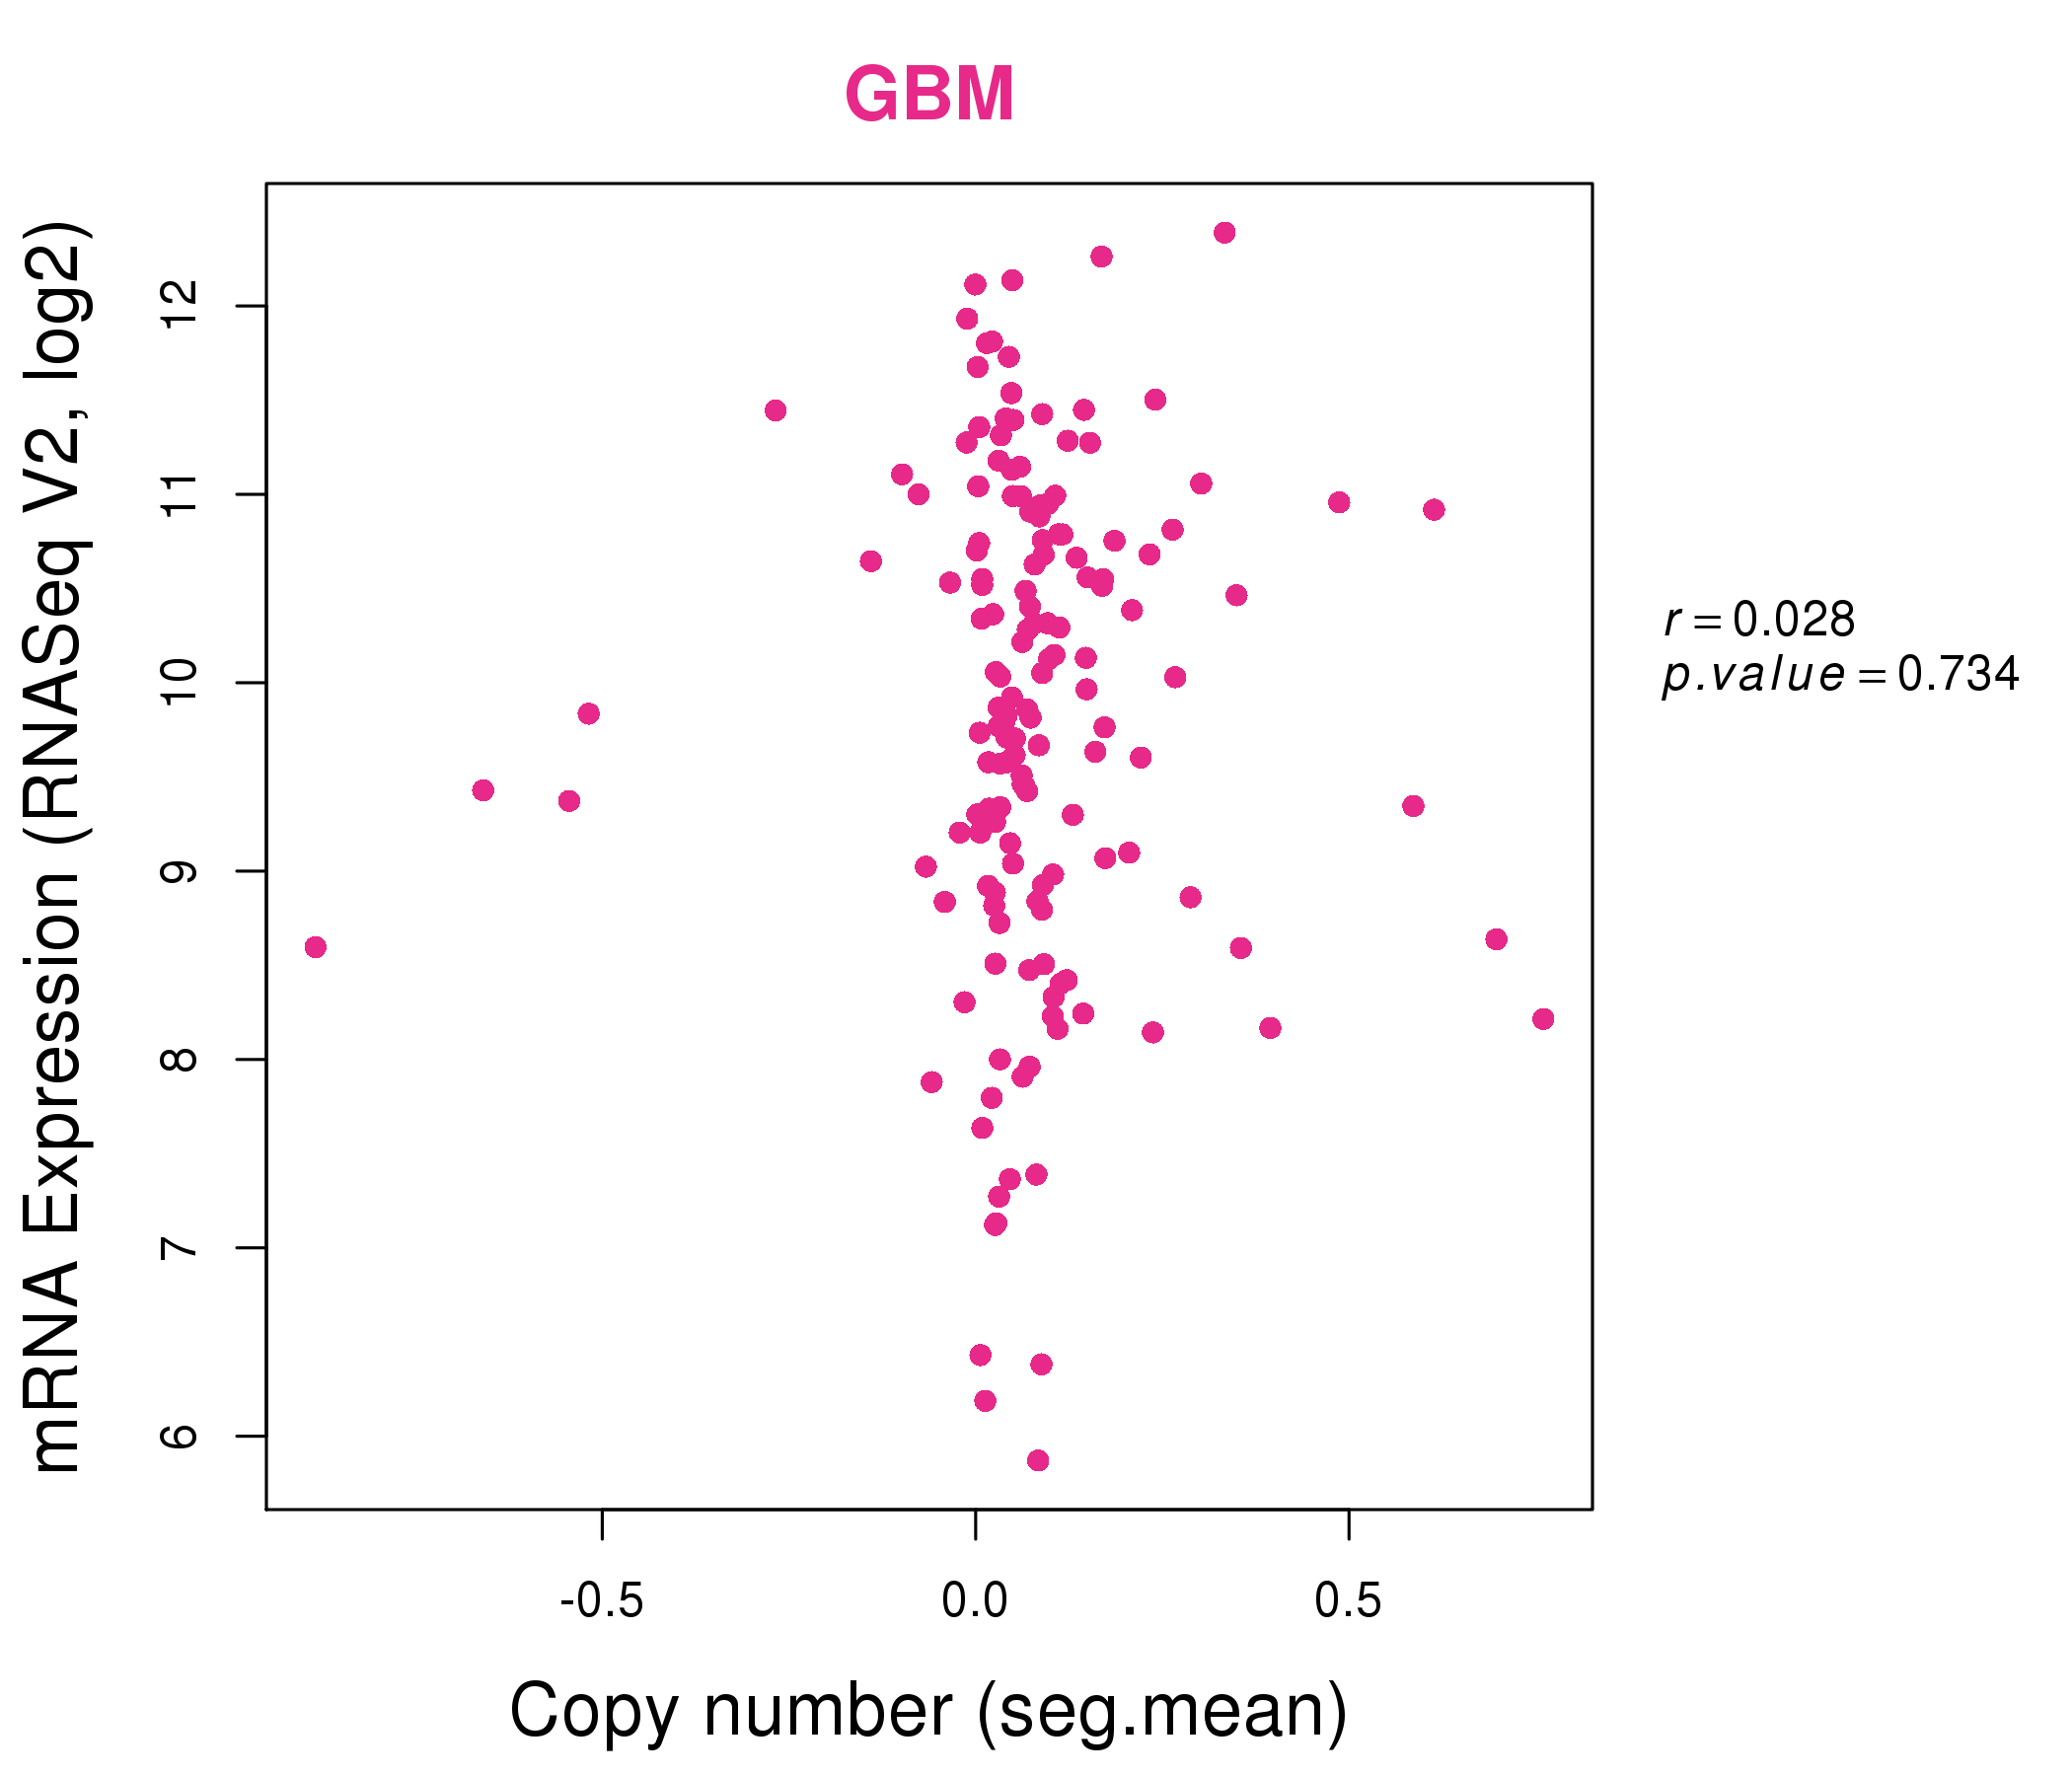
| * Copy number data were extracted from TCGA using R package TCGA-Assembler. The URLs of all public data files on TCGA DCC data server were gathered on Jan-05-2015. Function ProcessCNAData in TCGA-Assembler package was used to obtain gene-level copy number value which is calculated as the average copy number of the genomic region of a gene. |
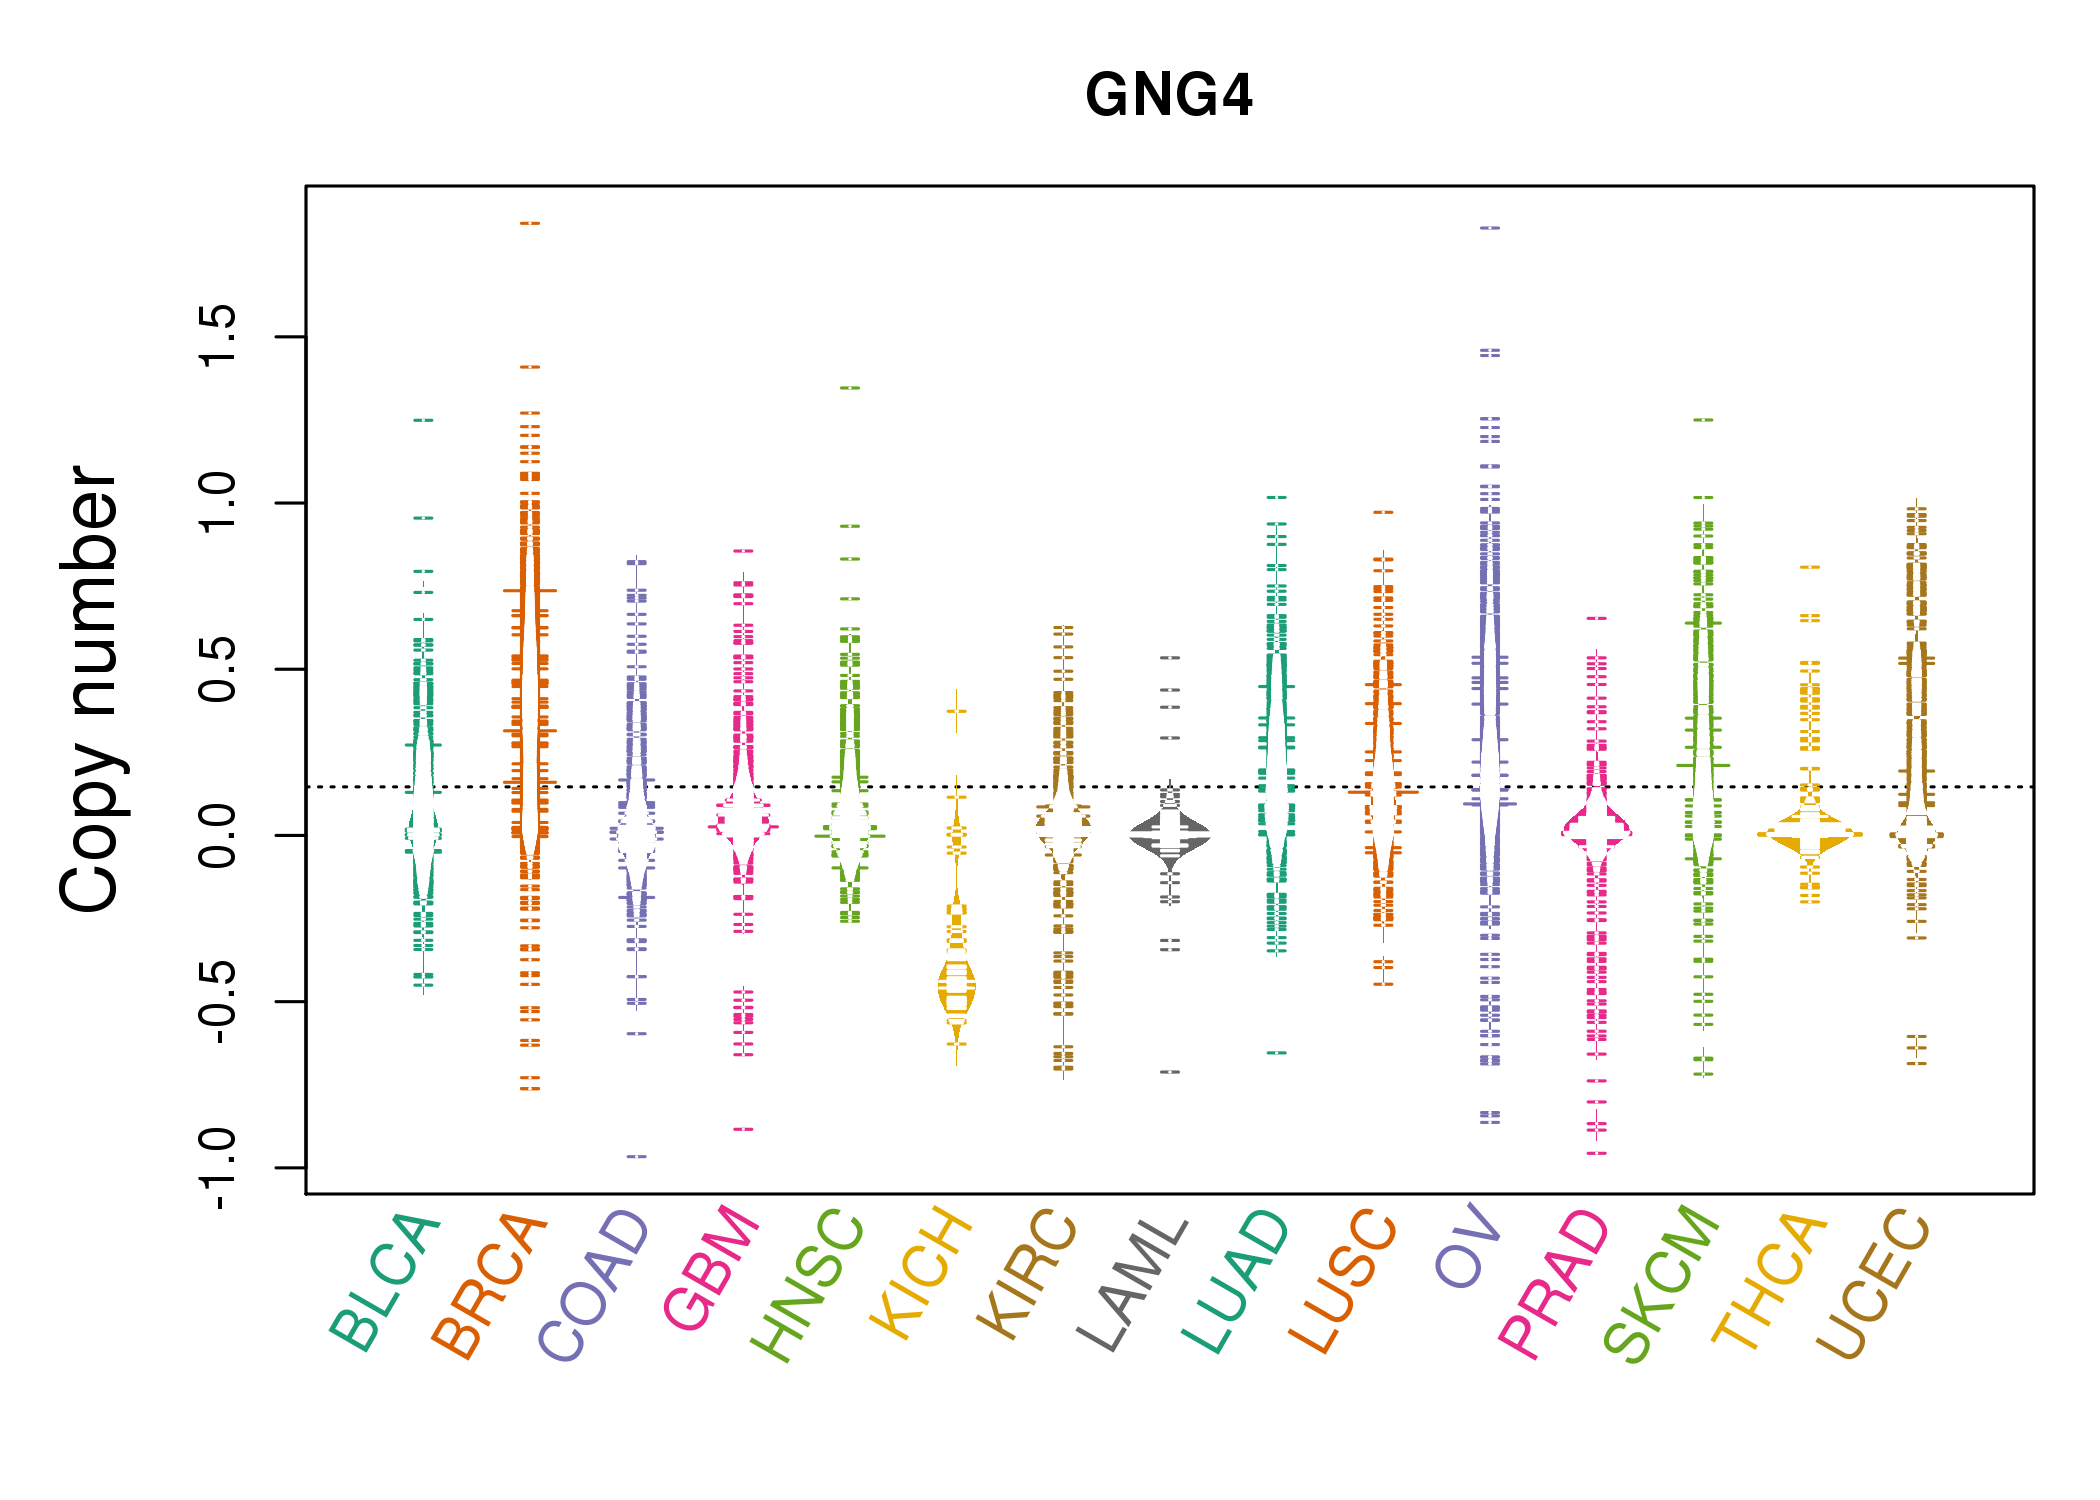 |
| cf) Tissue ID[Tissue type]: BLCA[Bladder Urothelial Carcinoma], BRCA[Breast invasive carcinoma], CESC[Cervical squamous cell carcinoma and endocervical adenocarcinoma], COAD[Colon adenocarcinoma], GBM[Glioblastoma multiforme], Glioma Low Grade, HNSC[Head and Neck squamous cell carcinoma], KICH[Kidney Chromophobe], KIRC[Kidney renal clear cell carcinoma], KIRP[Kidney renal papillary cell carcinoma], LAML[Acute Myeloid Leukemia], LUAD[Lung adenocarcinoma], LUSC[Lung squamous cell carcinoma], OV[Ovarian serous cystadenocarcinoma ], PAAD[Pancreatic adenocarcinoma], PRAD[Prostate adenocarcinoma], SKCM[Skin Cutaneous Melanoma], STAD[Stomach adenocarcinoma], THCA[Thyroid carcinoma], UCEC[Uterine Corpus Endometrial Carcinoma] |
| Top |
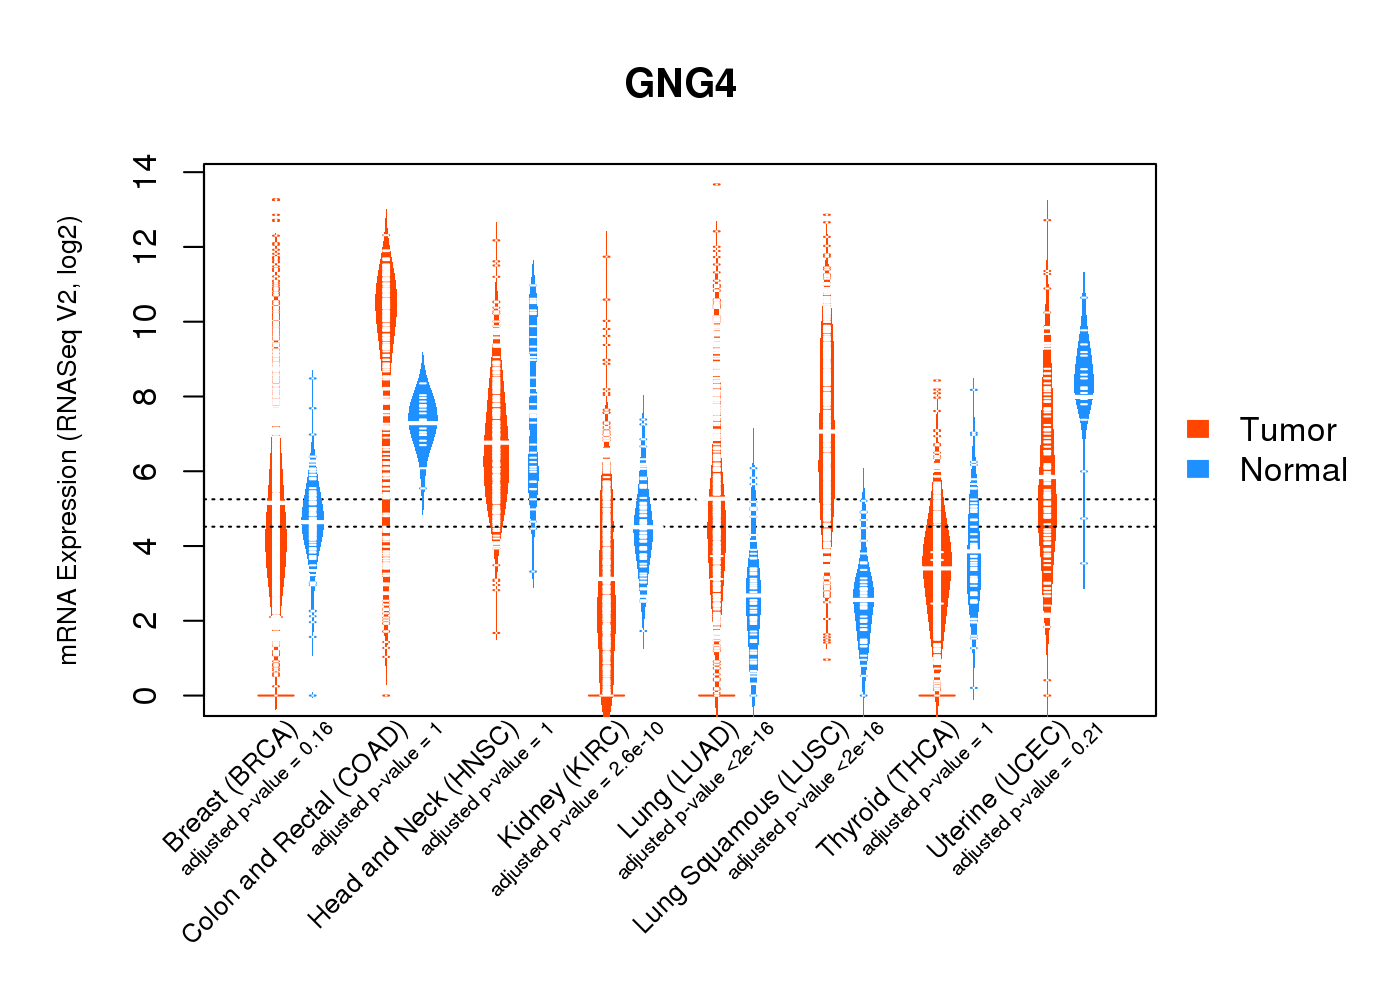
| Gene Expression for GNG4 |
| * CCLE gene expression data were extracted from CCLE_Expression_Entrez_2012-10-18.res: Gene-centric RMA-normalized mRNA expression data. |
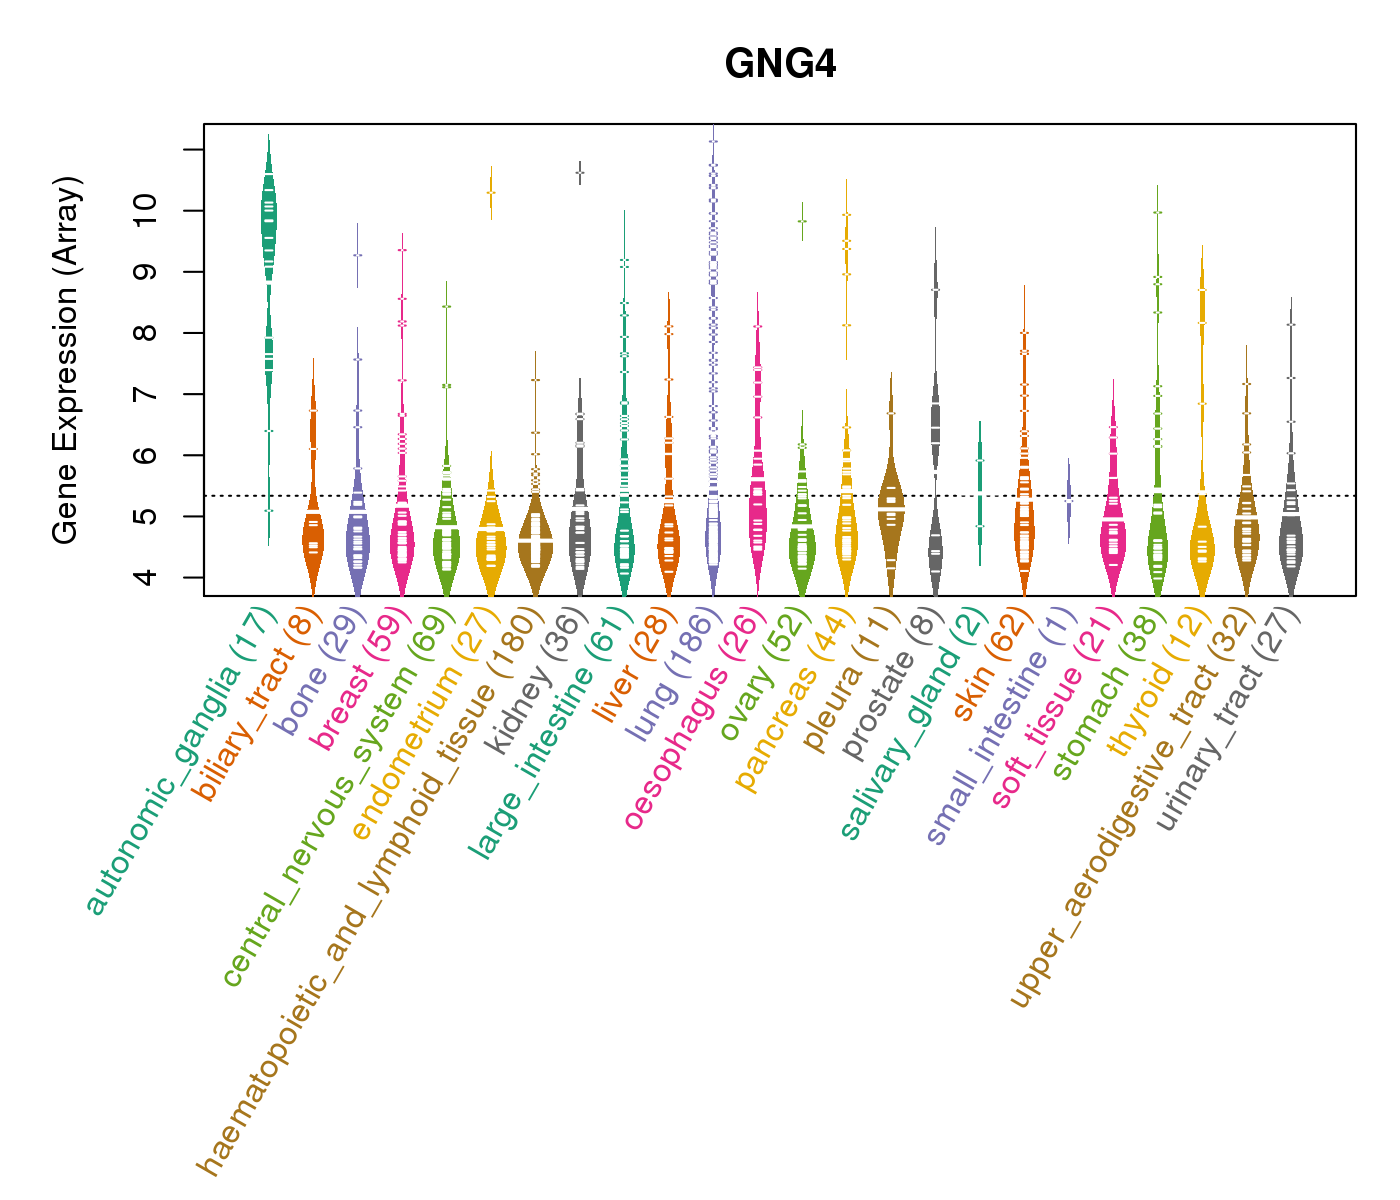 |
| * Normalized gene expression data of RNASeqV2 was extracted from TCGA using R package TCGA-Assembler. The URLs of all public data files on TCGA DCC data server were gathered at Jan-05-2015. Only eight cancer types have enough normal control samples for differential expression analysis. (t test, adjusted p<0.05 (using Benjamini-Hochberg FDR)) |
 |
| Top |
| * This plots show the correlation between CNV and gene expression. |
: Open all plots for all cancer types
 |
|
 |
|
| Top |
| Gene-Gene Network Information |
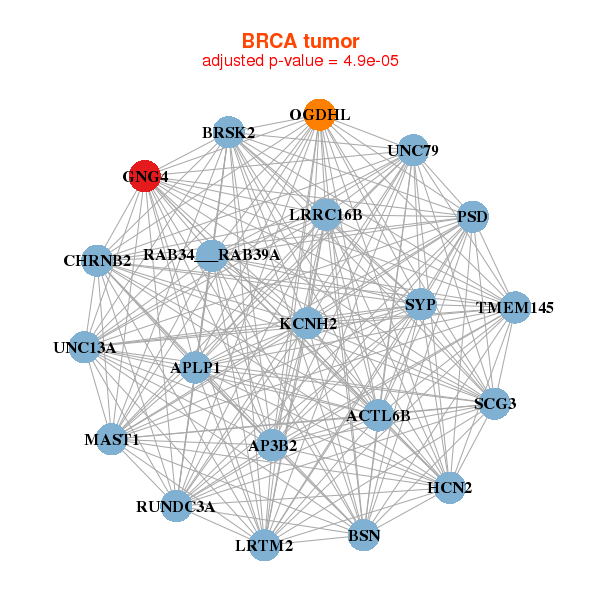
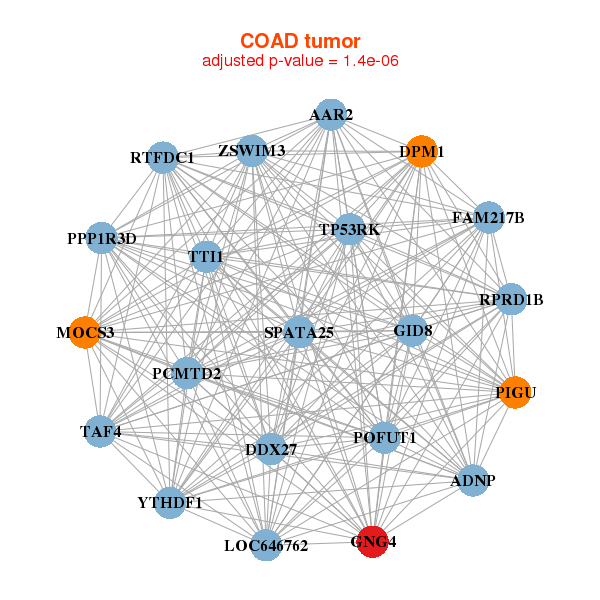
| * Co-Expression network figures were drawn using R package igraph. Only the top 20 genes with the highest correlations were shown. Red circle: input gene, orange circle: cell metabolism gene, sky circle: other gene |
: Open all plots for all cancer types
 |
|
| ACTL6B,AP3B2,APLP1,BRSK2,BSN,CHRNB2,GNG4, HCN2,KCNH2,UNC79,LRRC16B,LRTM2,MAST1,OGDHL, PSD,RAB34___RAB39A,RUNDC3A,SCG3,SYP,TMEM145,UNC13A | ASCL2,C11orf85,C2orf50,CPA6,FADS6,GATA5,GLYATL3, GNG4,KCNF1,KRTAP10-10,MCHR1,MYT1,NTSR1,PRSS1, PSCA,SPANXA2,SPANXC,SPANXD,ABHD11-AS1,WNT3A,ZNF716 |
 |
|
| ADNP,GID8,SPATA25,FAM217B,AAR2,RTFDC1,DDX27, DPM1,GNG4,TTI1,LOC646762,MOCS3,PCMTD2,PIGU, POFUT1,PPP1R3D,RPRD1B,TAF4,TP53RK,YTHDF1,ZSWIM3 | APOD,ATOH8,BCAM,CCDC184,CCDC3,CGNL1,CRABP1, CSRP2,CYP4B1,EFHD1,TMEM255A,GALNT15,GNG4,GPX3, IRX6,LOC148824,MYOC,NPTX2,PTH1R,RERGL,RHOBTB1 |
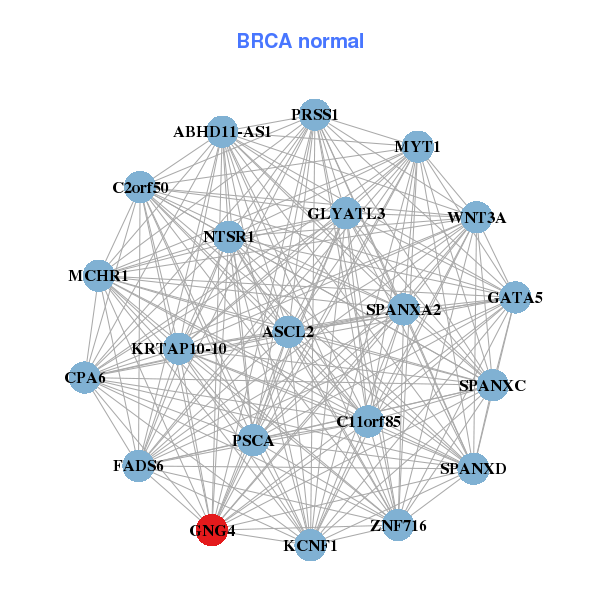
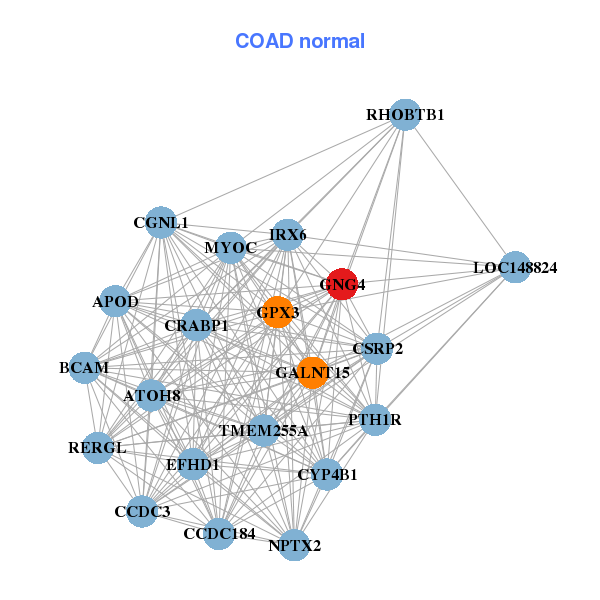
| * Co-Expression network figures were drawn using R package igraph. Only the top 20 genes with the highest correlations were shown. Red circle: input gene, orange circle: cell metabolism gene, sky circle: other gene |
: Open all plots for all cancer types
| Top |
: Open all interacting genes' information including KEGG pathway for all interacting genes from DAVID
| Top |
| Pharmacological Information for GNG4 |
| There's no related Drug. |
| Top |
| Cross referenced IDs for GNG4 |
| * We obtained these cross-references from Uniprot database. It covers 150 different DBs, 18 categories. http://www.uniprot.org/help/cross_references_section |
: Open all cross reference information
|
Copyright © 2016-Present - The Univsersity of Texas Health Science Center at Houston @ |