|
||||||||||||||||||||||||||||||||||||||||||||||||||||||||||||||||||||||||||||||||||||||||||||||||||||||||||||||||||||||||||||||||||||||||||||||||||||||||||||||||||||||||||||||||||||||||||||||||||||||||||||||||||||||||||||||||||||||||||||||||||||||||||||||||||||||||||||||||||||||||||||||||||||||||||||||||||||||||||
| |
| Phenotypic Information (metabolism pathway, cancer, disease, phenome) |
| |
| |
| Gene-Gene Network Information: Co-Expression Network, Interacting Genes & KEGG |
| |
|


| Gene Summary for GNS |
| Basic gene info. | Gene symbol | GNS |
| Gene name | glucosamine (N-acetyl)-6-sulfatase | |
| Synonyms | G6S | |
| Cytomap | UCSC genome browser: 12q14 | |
| Genomic location | chr12 :65107221-65153226 | |
| Type of gene | protein-coding | |
| RefGenes | NM_002076.3, | |
| Ensembl id | ENSG00000135677 | |
| Description | N-acetylglucosamine-6-sulfataseglucosamine-6-sulfatase | |
| Modification date | 20141207 | |
| dbXrefs | MIM : 607664 | |
| HGNC : HGNC | ||
| Ensembl : ENSG00000135677 | ||
| HPRD : 09637 | ||
| Vega : OTTHUMG00000168819 | ||
| Protein | UniProt: go to UniProt's Cross Reference DB Table | |
| Expression | CleanEX: HS_GNS | |
| BioGPS: 2799 | ||
| Gene Expression Atlas: ENSG00000135677 | ||
| The Human Protein Atlas: ENSG00000135677 | ||
| Pathway | NCI Pathway Interaction Database: GNS | |
| KEGG: GNS | ||
| REACTOME: GNS | ||
| ConsensusPathDB | ||
| Pathway Commons: GNS | ||
| Metabolism | MetaCyc: GNS | |
| HUMANCyc: GNS | ||
| Regulation | Ensembl's Regulation: ENSG00000135677 | |
| miRBase: chr12 :65,107,221-65,153,226 | ||
| TargetScan: NM_002076 | ||
| cisRED: ENSG00000135677 | ||
| Context | iHOP: GNS | |
| cancer metabolism search in PubMed: GNS | ||
| UCL Cancer Institute: GNS | ||
| Assigned class in ccmGDB | C | |
| Top |
| Phenotypic Information for GNS(metabolism pathway, cancer, disease, phenome) |
| Cancer | CGAP: GNS |
| Familial Cancer Database: GNS | |
| * This gene is included in those cancer gene databases. |
|
|
|
|
|
| . | ||||||||||||||||||||||||||||||||||||||||||||||||||||||||||||||||||||||||||||||||||||||||||||||||||||||||||||||||||||||||||||||||||||||||||||||||||||||||||||||||||||||||||||||||||||||||||||||||||||||||||||||||||||||||||||||||||||||||||||||||||||||||||||||||||||||||||||||||||||||||||||||||||||||||||||||||||||
Oncogene 1 | Significant driver gene in | |||||||||||||||||||||||||||||||||||||||||||||||||||||||||||||||||||||||||||||||||||||||||||||||||||||||||||||||||||||||||||||||||||||||||||||||||||||||||||||||||||||||||||||||||||||||||||||||||||||||||||||||||||||||||||||||||||||||||||||||||||||||||||||||||||||||||||||||||||||||||||||||||||||||||||||||||||||||||
| cf) number; DB name 1 Oncogene; http://nar.oxfordjournals.org/content/35/suppl_1/D721.long, 2 Tumor Suppressor gene; https://bioinfo.uth.edu/TSGene/, 3 Cancer Gene Census; http://www.nature.com/nrc/journal/v4/n3/abs/nrc1299.html, 4 CancerGenes; http://nar.oxfordjournals.org/content/35/suppl_1/D721.long, 5 Network of Cancer Gene; http://ncg.kcl.ac.uk/index.php, 1Therapeutic Vulnerabilities in Cancer; http://cbio.mskcc.org/cancergenomics/statius/ |
| REACTOME_METABOLISM_OF_CARBOHYDRATES | |
| OMIM | |
| Orphanet | |
| Disease | KEGG Disease: GNS |
| MedGen: GNS (Human Medical Genetics with Condition) | |
| ClinVar: GNS | |
| Phenotype | MGI: GNS (International Mouse Phenotyping Consortium) |
| PhenomicDB: GNS | |
| Mutations for GNS |
| * Under tables are showing count per each tissue to give us broad intuition about tissue specific mutation patterns.You can go to the detailed page for each mutation database's web site. |
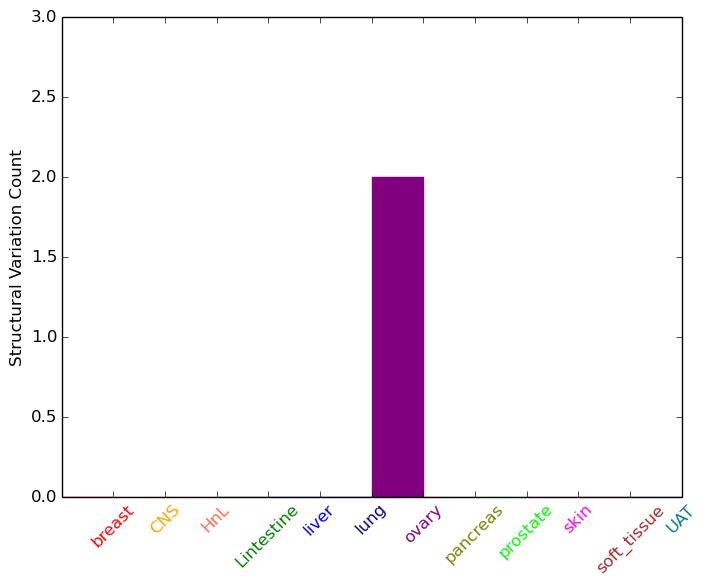
| - Statistics for Tissue and Mutation type | Top |
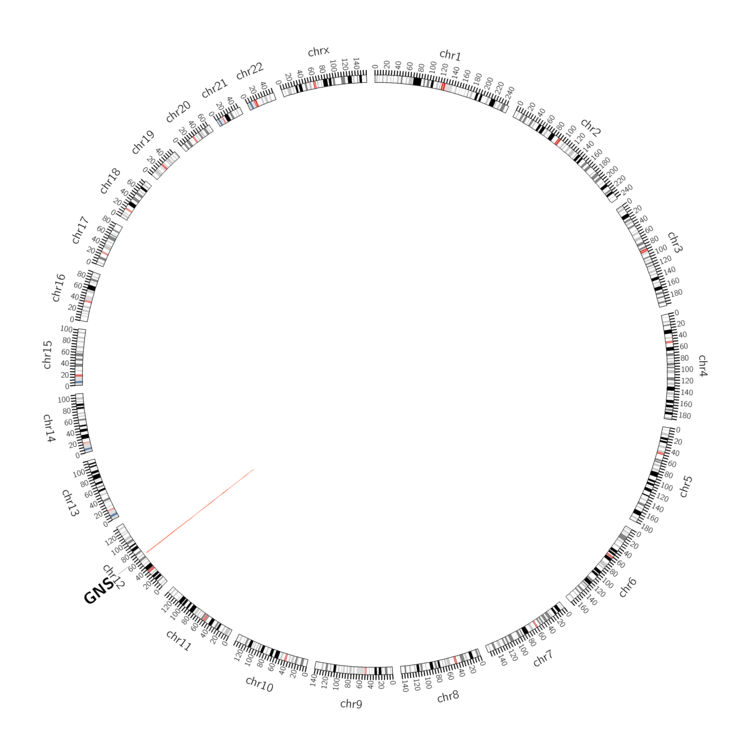 |
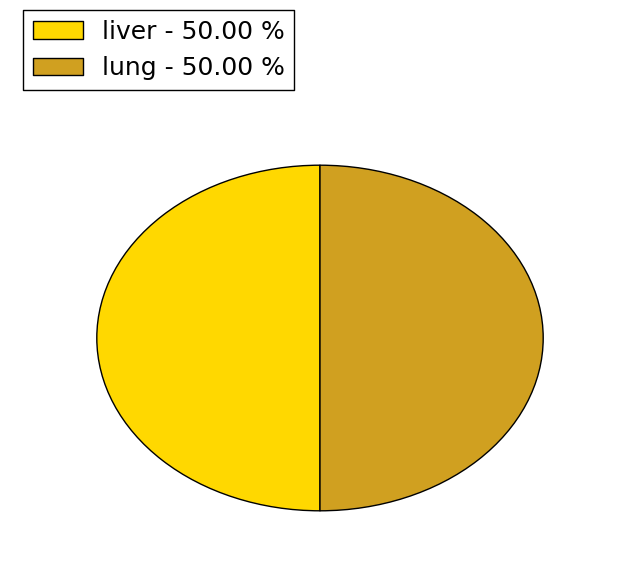
| - For Inter-chromosomal Variations |
| There's no inter-chromosomal structural variation. |
| - For Intra-chromosomal Variations |
| * Intra-chromosomal variantions includes 'intrachromosomal amplicon to amplicon', 'intrachromosomal amplicon to non-amplified dna', 'intrachromosomal deletion', 'intrachromosomal fold-back inversion', 'intrachromosomal inversion', 'intrachromosomal tandem duplication', 'Intrachromosomal unknown type', 'intrachromosomal with inverted orientation', 'intrachromosomal with non-inverted orientation'. |
 |
| Sample | Symbol_a | Chr_a | Start_a | End_a | Symbol_b | Chr_b | Start_b | End_b |
| ovary | GNS | chr12 | 65127061 | 65127081 | chr12 | 64625672 | 64625692 |
| cf) Tissue number; Tissue name (1;Breast, 2;Central_nervous_system, 3;Haematopoietic_and_lymphoid_tissue, 4;Large_intestine, 5;Liver, 6;Lung, 7;Ovary, 8;Pancreas, 9;Prostate, 10;Skin, 11;Soft_tissue, 12;Upper_aerodigestive_tract) |
| * From mRNA Sanger sequences, Chitars2.0 arranged chimeric transcripts. This table shows GNS related fusion information. |
| ID | Head Gene | Tail Gene | Accession | Gene_a | qStart_a | qEnd_a | Chromosome_a | tStart_a | tEnd_a | Gene_a | qStart_a | qEnd_a | Chromosome_a | tStart_a | tEnd_a |
| CR741239 | NPHP3-ACAD11 | 1 | 188 | 3 | 132400417 | 132400604 | GNS | 184 | 494 | 12 | 65108727 | 65109037 | |
| AI701812 | AKAP9 | 1 | 186 | 7 | 91719457 | 91719642 | GNS | 186 | 416 | 12 | 65107421 | 65107650 | |
| N40382 | OPTN | 1 | 95 | 10 | 13160997 | 13164435 | GNS | 94 | 439 | 12 | 65108698 | 65109037 | |
| BQ434418 | CAND1 | 18 | 312 | 12 | 67696101 | 67696395 | GNS | 311 | 529 | 12 | 65115383 | 65116895 | |
| DB469756 | ZNF691 | 1 | 373 | 1 | 43312254 | 43316740 | GNS | 368 | 453 | 12 | 65108835 | 65108920 | |
| CA449339 | GNS | 18 | 453 | 12 | 65107229 | 65107664 | NCAM2 | 448 | 732 | 21 | 22558984 | 22559273 | |
| BE708454 | GNS | 1 | 339 | 12 | 65138036 | 65138375 | ESRP1 | 331 | 496 | 8 | 95718809 | 95718977 | |
| Top |
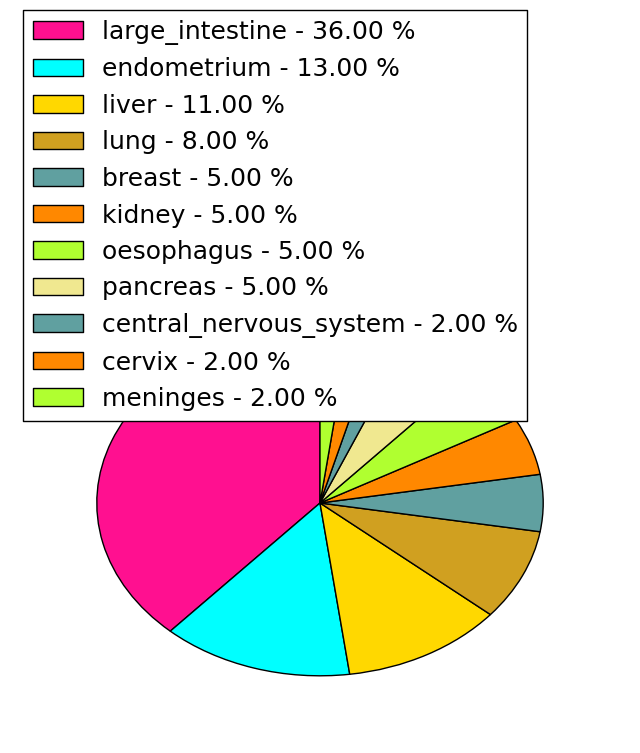
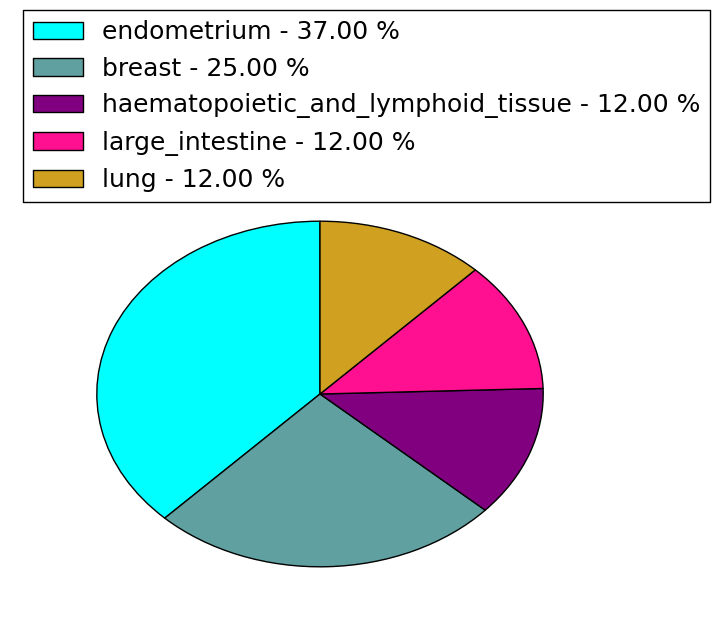
| Mutation type/ Tissue ID | brca | cns | cerv | endome | haematopo | kidn | Lintest | liver | lung | ns | ovary | pancre | prost | skin | stoma | thyro | urina | |||
| Total # sample | 1 | 1 | 1 | 3 | 1 | 1 | ||||||||||||||
| GAIN (# sample) | 1 | 1 | 1 | 3 | 1 | 1 | ||||||||||||||
| LOSS (# sample) |
| cf) Tissue ID; Tissue type (1; Breast, 2; Central_nervous_system, 3; Cervix, 4; Endometrium, 5; Haematopoietic_and_lymphoid_tissue, 6; Kidney, 7; Large_intestine, 8; Liver, 9; Lung, 10; NS, 11; Ovary, 12; Pancreas, 13; Prostate, 14; Skin, 15; Stomach, 16; Thyroid, 17; Urinary_tract) |
| Top |
|
 |
| Top |
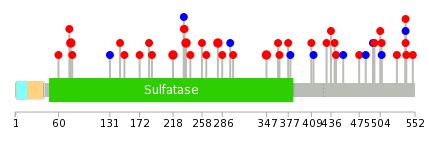
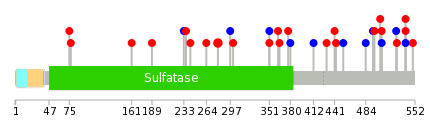
| Stat. for Non-Synonymous SNVs (# total SNVs=36) | (# total SNVs=8) |
 |  |
(# total SNVs=2) | (# total SNVs=0) |
 |
| Top |
| * When you move the cursor on each content, you can see more deailed mutation information on the Tooltip. Those are primary_site,primary_histology,mutation(aa),pubmedID. |
| GRCh37 position | Mutation(aa) | Unique sampleID count |
| chr12:65137060-65137060 | p.Y218C | 2 |
| chr12:65134422-65134422 | p.S280Y | 2 |
| chr12:65137006-65137006 | p.S236L | 2 |
| chr12:65115486-65115486 | p.? | 2 |
| chr12:65146499-65146499 | p.M77I | 2 |
| chr12:65130842-65130842 | p.D347V | 2 |
| chr12:65113864-65113864 | p.R506R | 1 |
| chr12:65137015-65137015 | p.A233V | 1 |
| chr12:65116787-65116787 | p.S436F | 1 |
| chr12:65146506-65146506 | p.G75E | 1 |
| Top |
|
 |
| Point Mutation/ Tissue ID | 1 | 2 | 3 | 4 | 5 | 6 | 7 | 8 | 9 | 10 | 11 | 12 | 13 | 14 | 15 | 16 | 17 | 18 | 19 | 20 |
| # sample | 3 | 2 | 1 | 6 | 2 | 1 | 1 | 2 | 2 | 4 | 8 | |||||||||
| # mutation | 3 | 2 | 1 | 8 | 2 | 1 | 1 | 2 | 2 | 4 | 8 | |||||||||
| nonsynonymous SNV | 2 | 1 | 7 | 1 | 1 | 1 | 2 | 3 | 5 | |||||||||||
| synonymous SNV | 1 | 2 | 1 | 1 | 1 | 1 | 1 | 3 |
| cf) Tissue ID; Tissue type (1; BLCA[Bladder Urothelial Carcinoma], 2; BRCA[Breast invasive carcinoma], 3; CESC[Cervical squamous cell carcinoma and endocervical adenocarcinoma], 4; COAD[Colon adenocarcinoma], 5; GBM[Glioblastoma multiforme], 6; Glioma Low Grade, 7; HNSC[Head and Neck squamous cell carcinoma], 8; KICH[Kidney Chromophobe], 9; KIRC[Kidney renal clear cell carcinoma], 10; KIRP[Kidney renal papillary cell carcinoma], 11; LAML[Acute Myeloid Leukemia], 12; LUAD[Lung adenocarcinoma], 13; LUSC[Lung squamous cell carcinoma], 14; OV[Ovarian serous cystadenocarcinoma ], 15; PAAD[Pancreatic adenocarcinoma], 16; PRAD[Prostate adenocarcinoma], 17; SKCM[Skin Cutaneous Melanoma], 18:STAD[Stomach adenocarcinoma], 19:THCA[Thyroid carcinoma], 20:UCEC[Uterine Corpus Endometrial Carcinoma]) |
| Top |
| * We represented just top 10 SNVs. When you move the cursor on each content, you can see more deailed mutation information on the Tooltip. Those are primary_site, primary_histology, mutation(aa), pubmedID. |
| Genomic Position | Mutation(aa) | Unique sampleID count |
| chr12:65134422 | p.S280Y | 2 |
| chr12:65113864 | p.R539H | 1 |
| chr12:65122796 | p.T377I | 1 |
| chr12:65137006 | p.R539C | 1 |
| chr12:65113866 | p.S365R | 1 |
| chr12:65122806 | p.G527R | 1 |
| chr12:65137014 | p.Q363E | 1 |
| chr12:65113872 | p.P526P | 1 |
| chr12:65130789 | p.P351P | 1 |
| chr12:65138647 | p.R506R | 1 |
| * Copy number data were extracted from TCGA using R package TCGA-Assembler. The URLs of all public data files on TCGA DCC data server were gathered on Jan-05-2015. Function ProcessCNAData in TCGA-Assembler package was used to obtain gene-level copy number value which is calculated as the average copy number of the genomic region of a gene. |
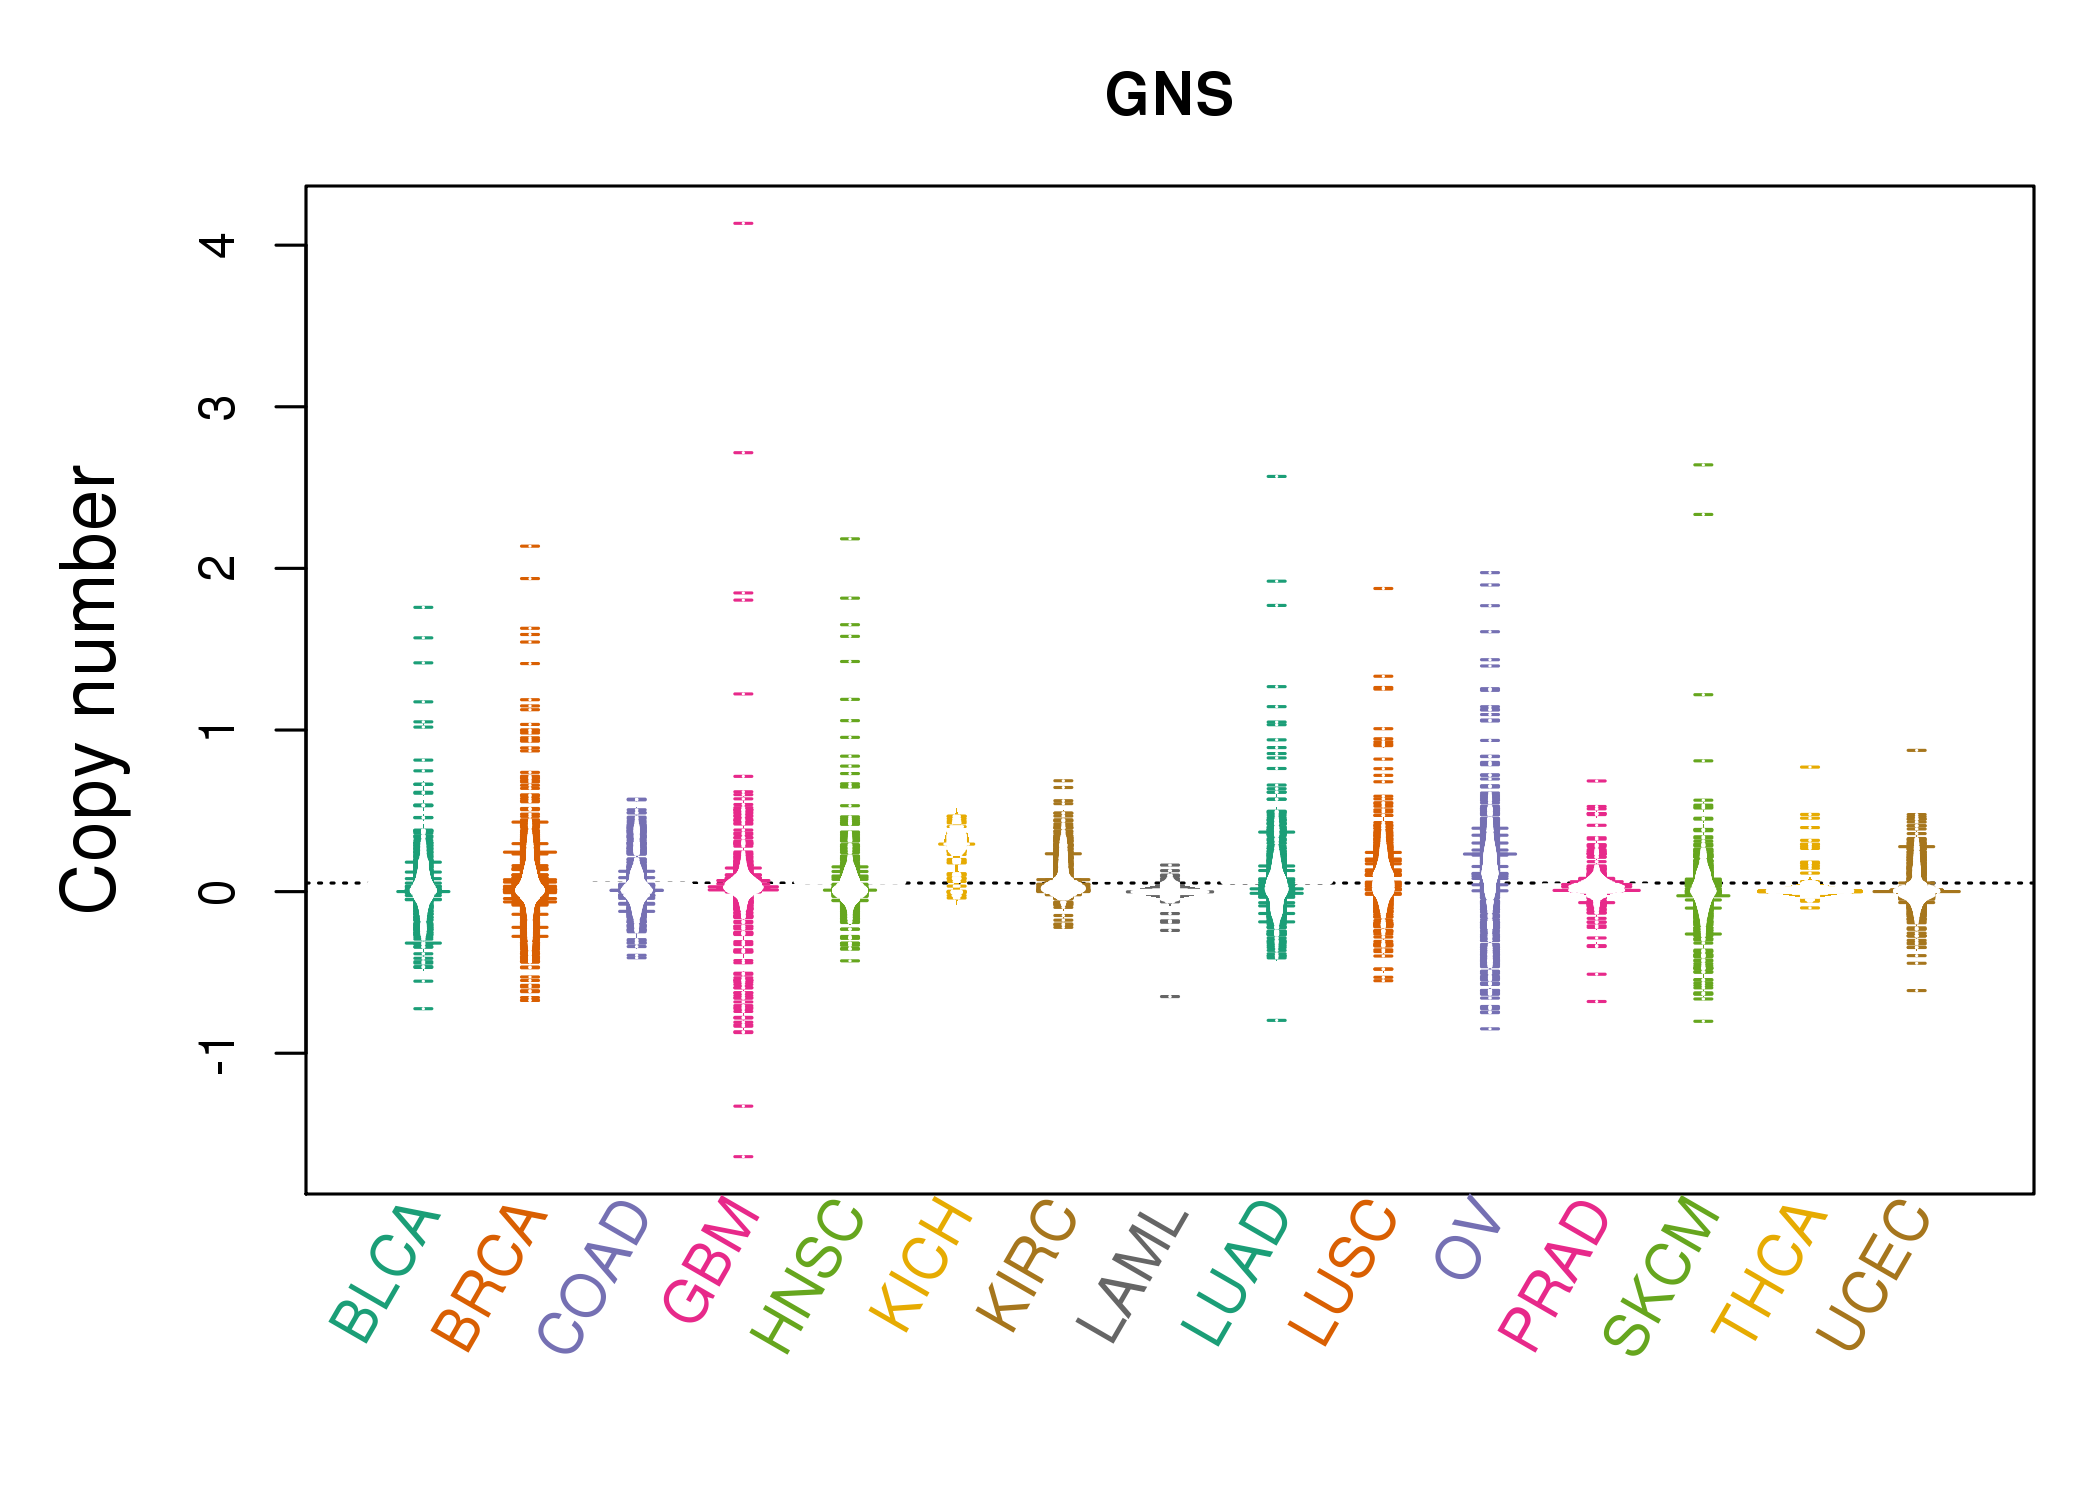 |
| cf) Tissue ID[Tissue type]: BLCA[Bladder Urothelial Carcinoma], BRCA[Breast invasive carcinoma], CESC[Cervical squamous cell carcinoma and endocervical adenocarcinoma], COAD[Colon adenocarcinoma], GBM[Glioblastoma multiforme], Glioma Low Grade, HNSC[Head and Neck squamous cell carcinoma], KICH[Kidney Chromophobe], KIRC[Kidney renal clear cell carcinoma], KIRP[Kidney renal papillary cell carcinoma], LAML[Acute Myeloid Leukemia], LUAD[Lung adenocarcinoma], LUSC[Lung squamous cell carcinoma], OV[Ovarian serous cystadenocarcinoma ], PAAD[Pancreatic adenocarcinoma], PRAD[Prostate adenocarcinoma], SKCM[Skin Cutaneous Melanoma], STAD[Stomach adenocarcinoma], THCA[Thyroid carcinoma], UCEC[Uterine Corpus Endometrial Carcinoma] |
| Top |
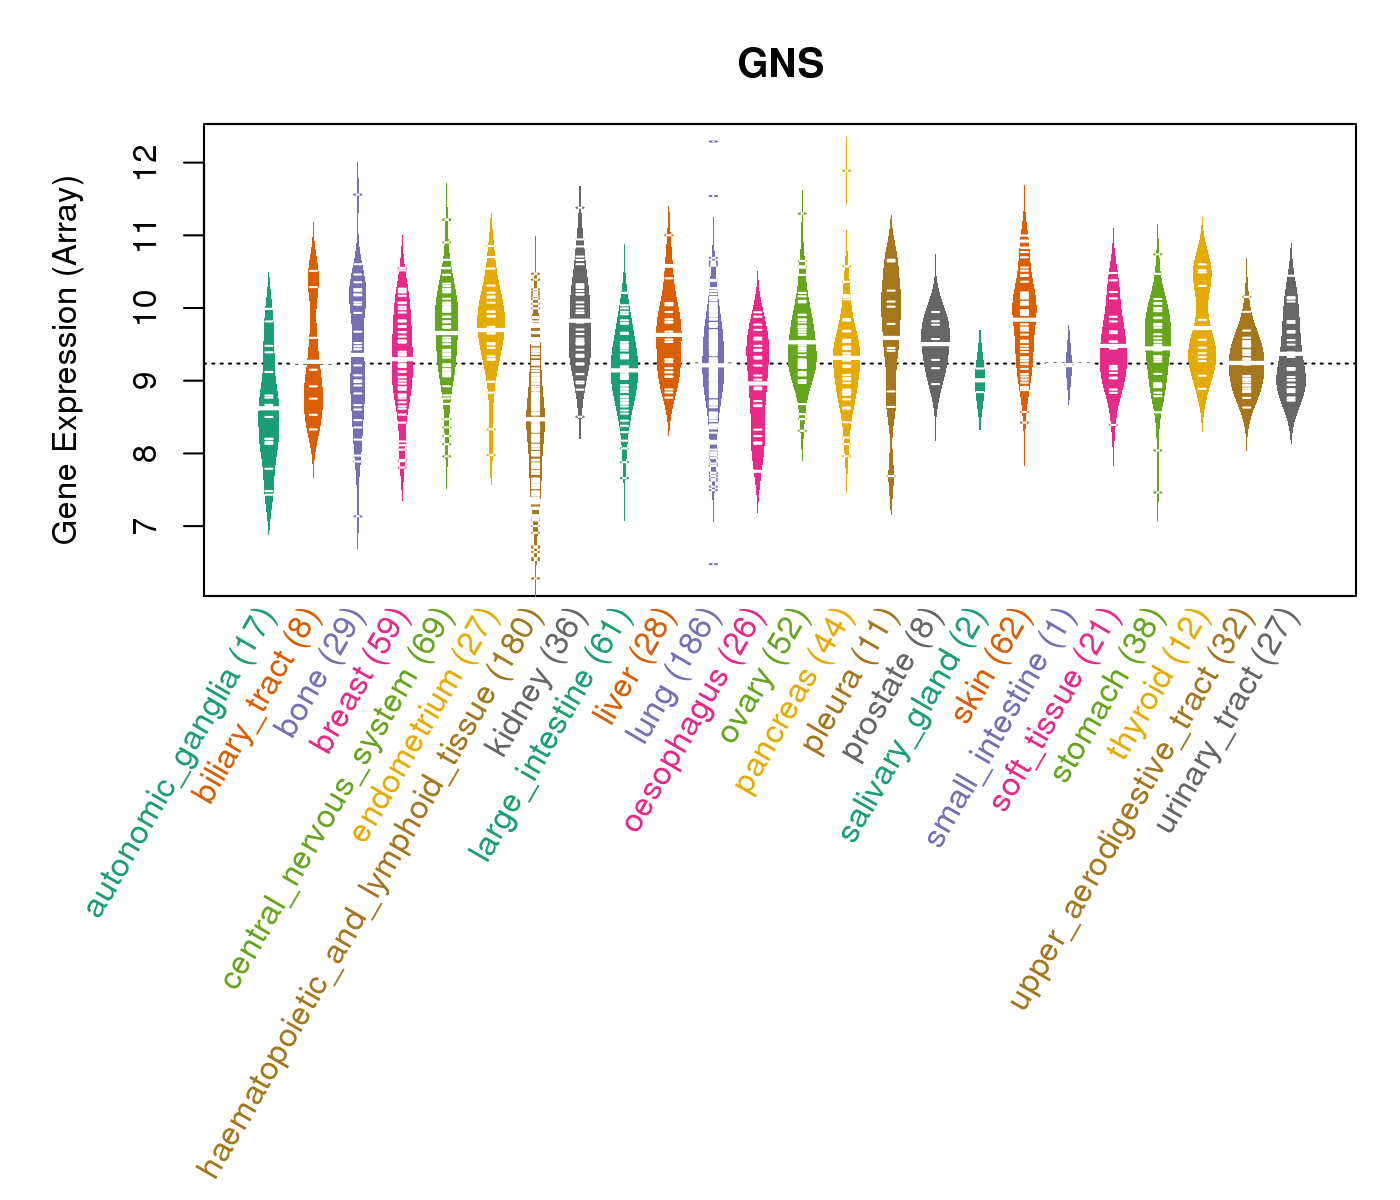
| Gene Expression for GNS |
| * CCLE gene expression data were extracted from CCLE_Expression_Entrez_2012-10-18.res: Gene-centric RMA-normalized mRNA expression data. |
 |
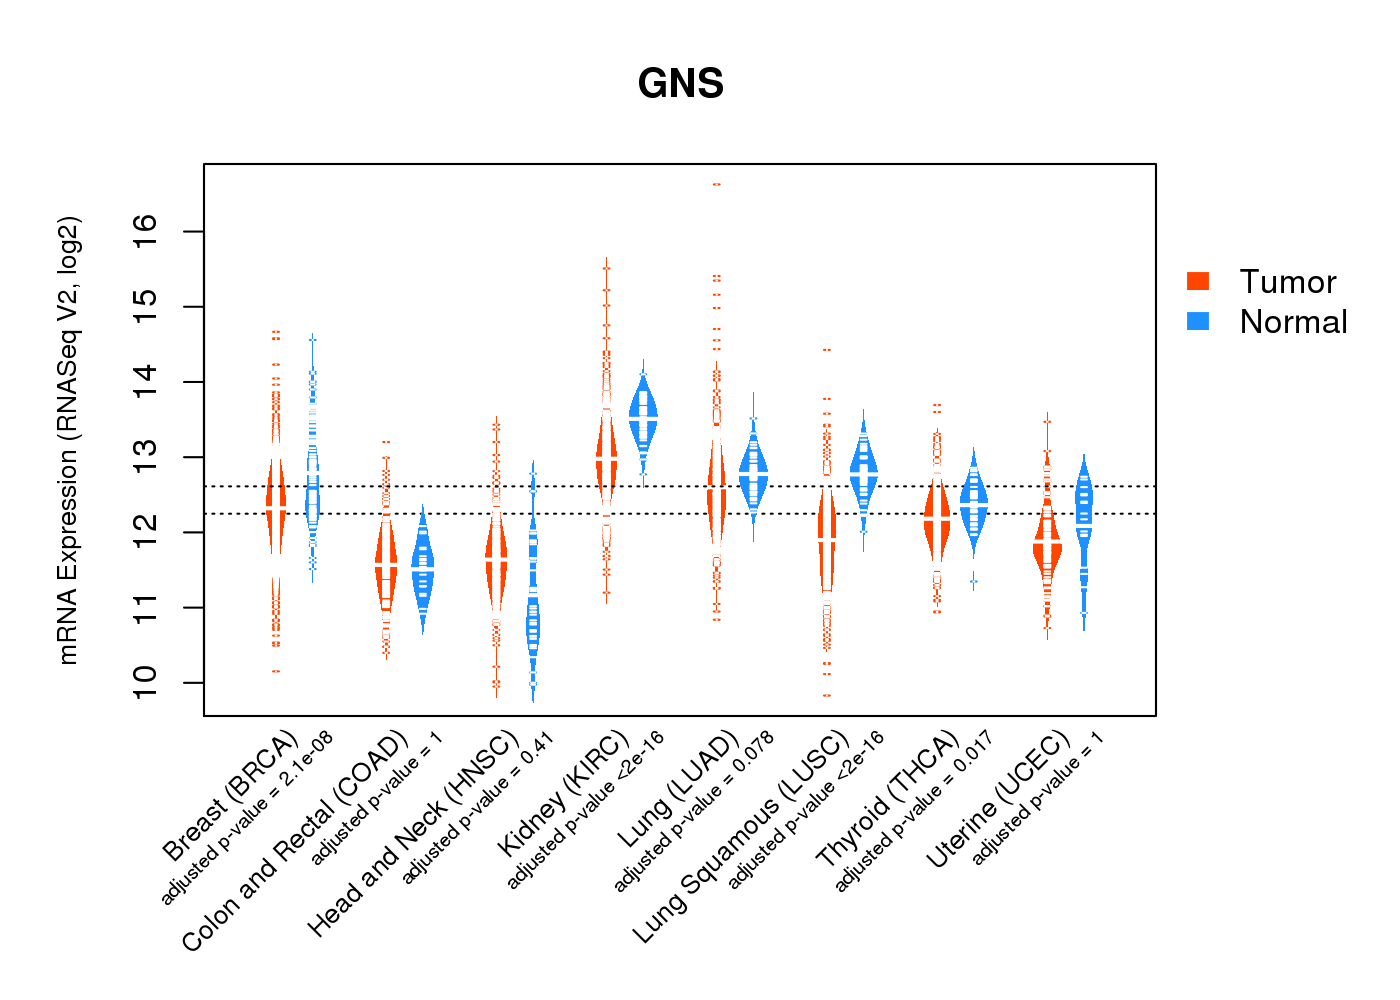
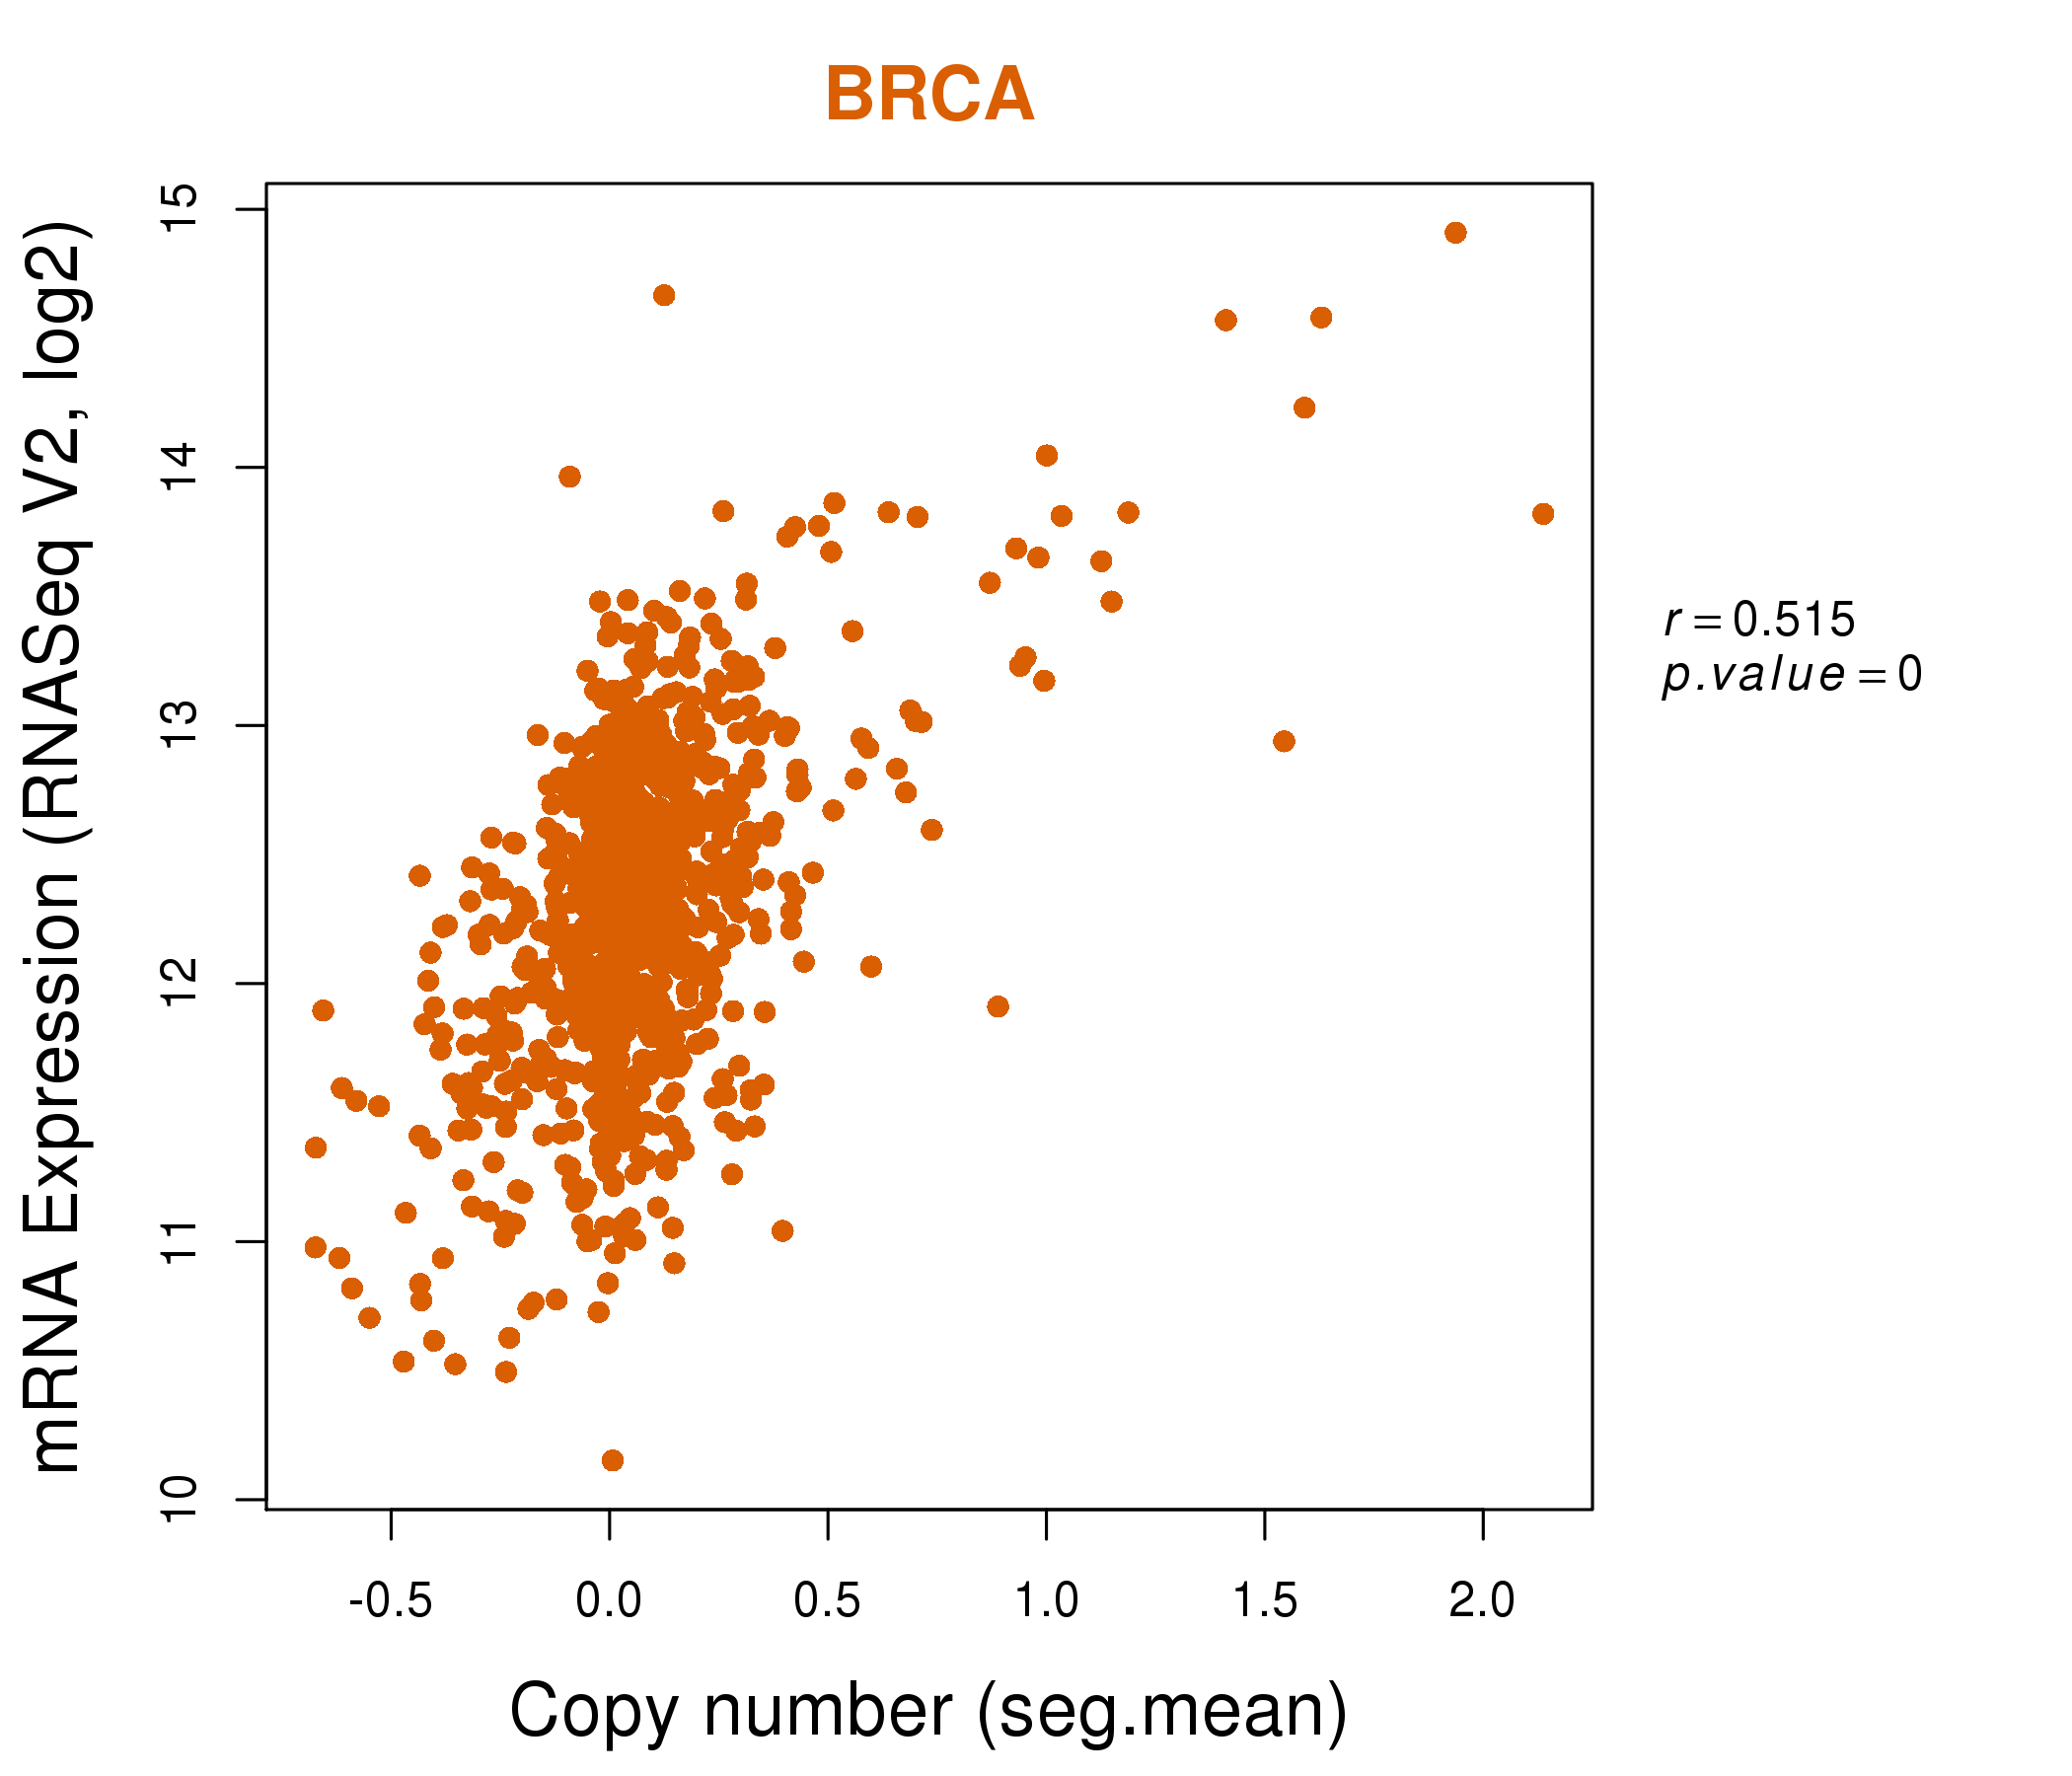
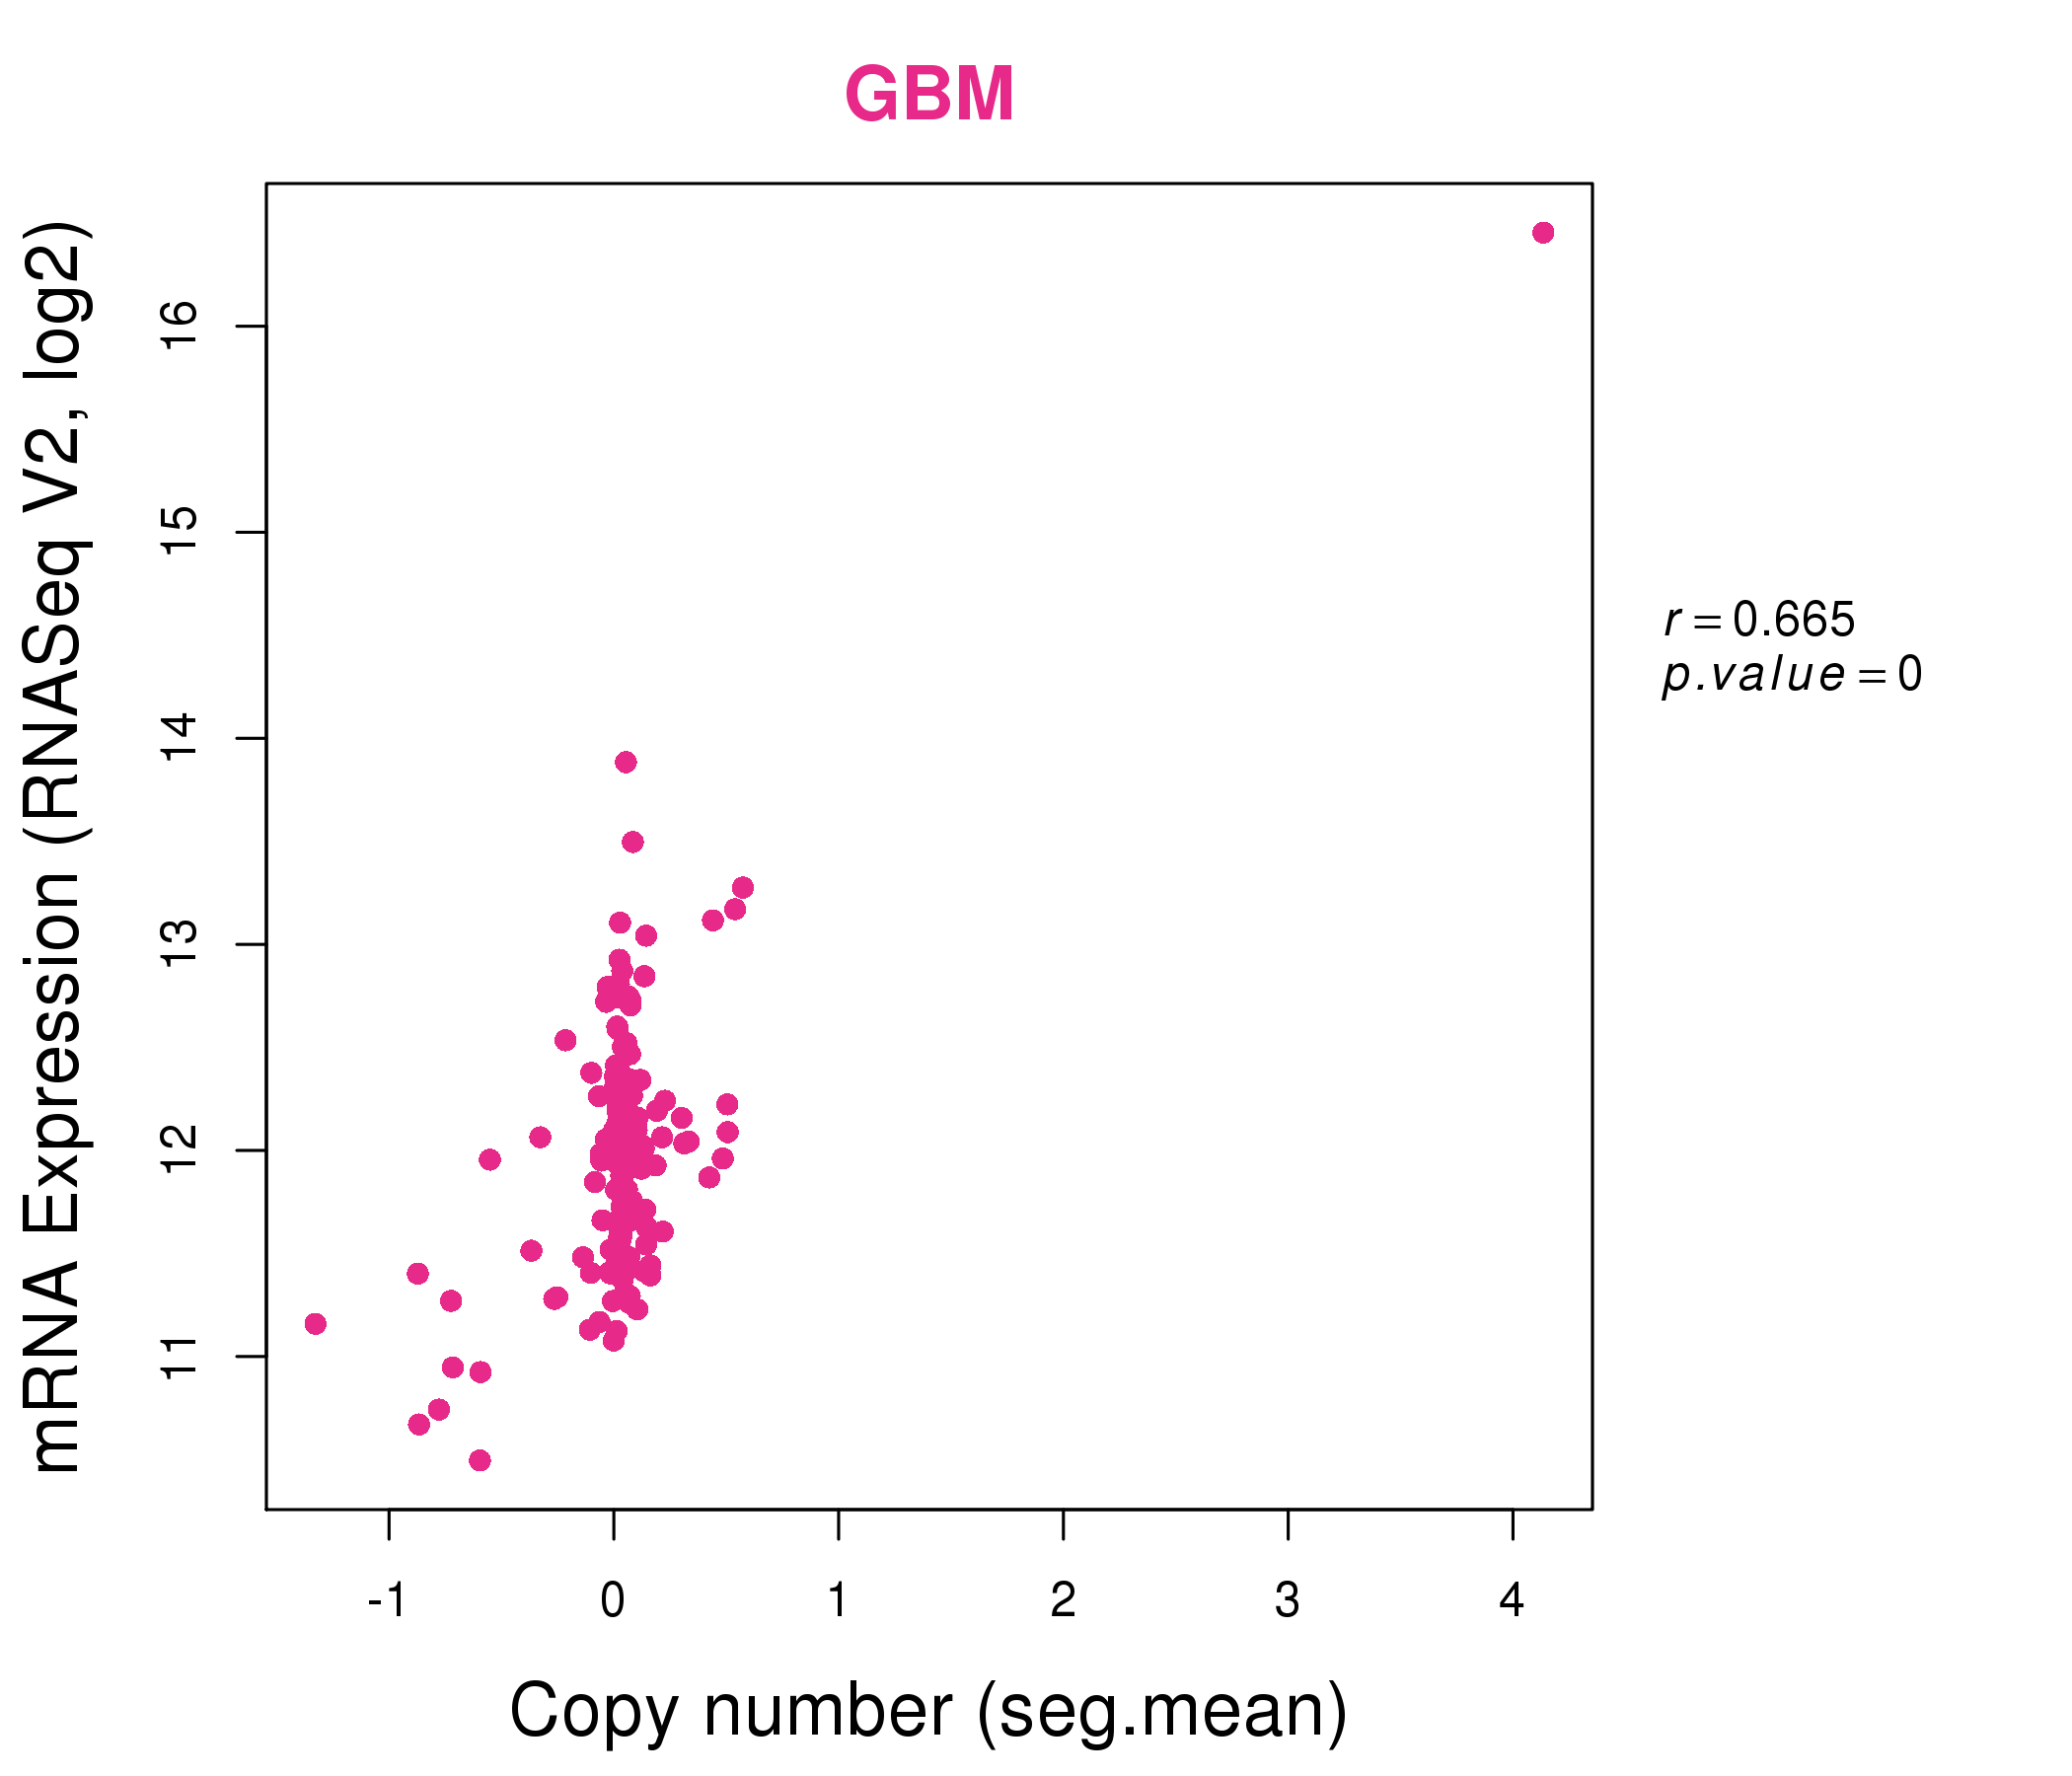
| * Normalized gene expression data of RNASeqV2 was extracted from TCGA using R package TCGA-Assembler. The URLs of all public data files on TCGA DCC data server were gathered at Jan-05-2015. Only eight cancer types have enough normal control samples for differential expression analysis. (t test, adjusted p<0.05 (using Benjamini-Hochberg FDR)) |
 |
| Top |
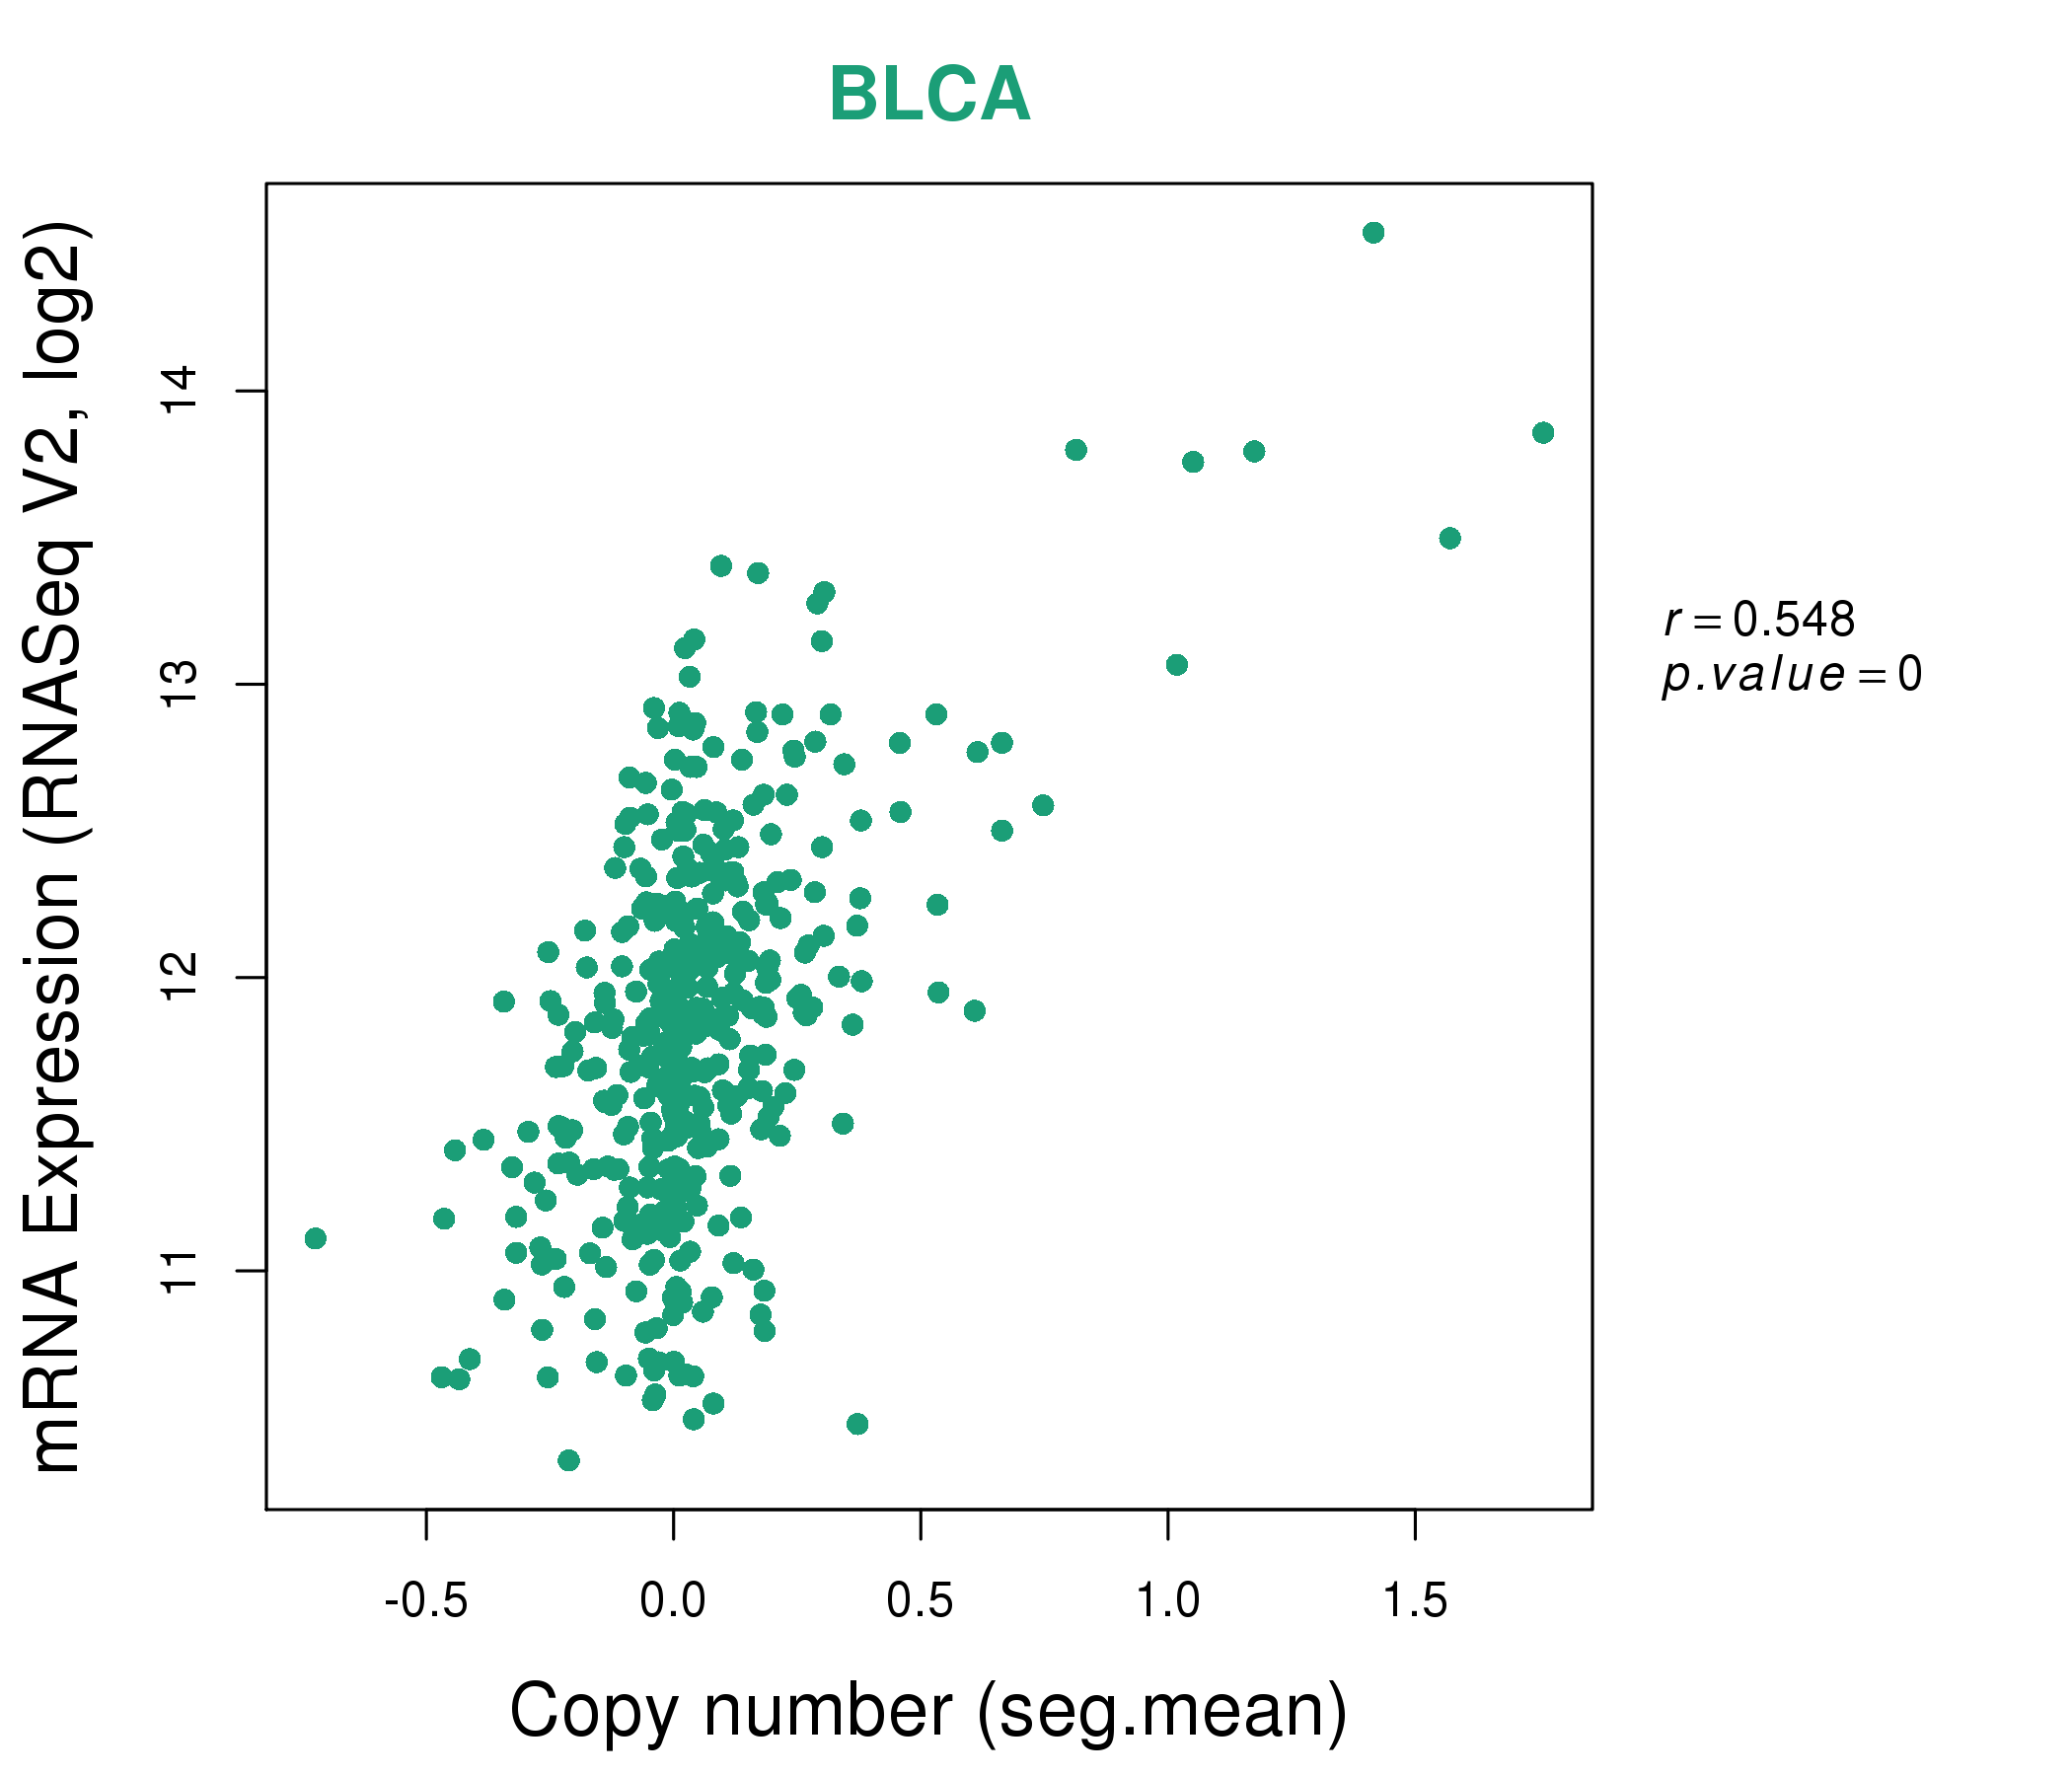
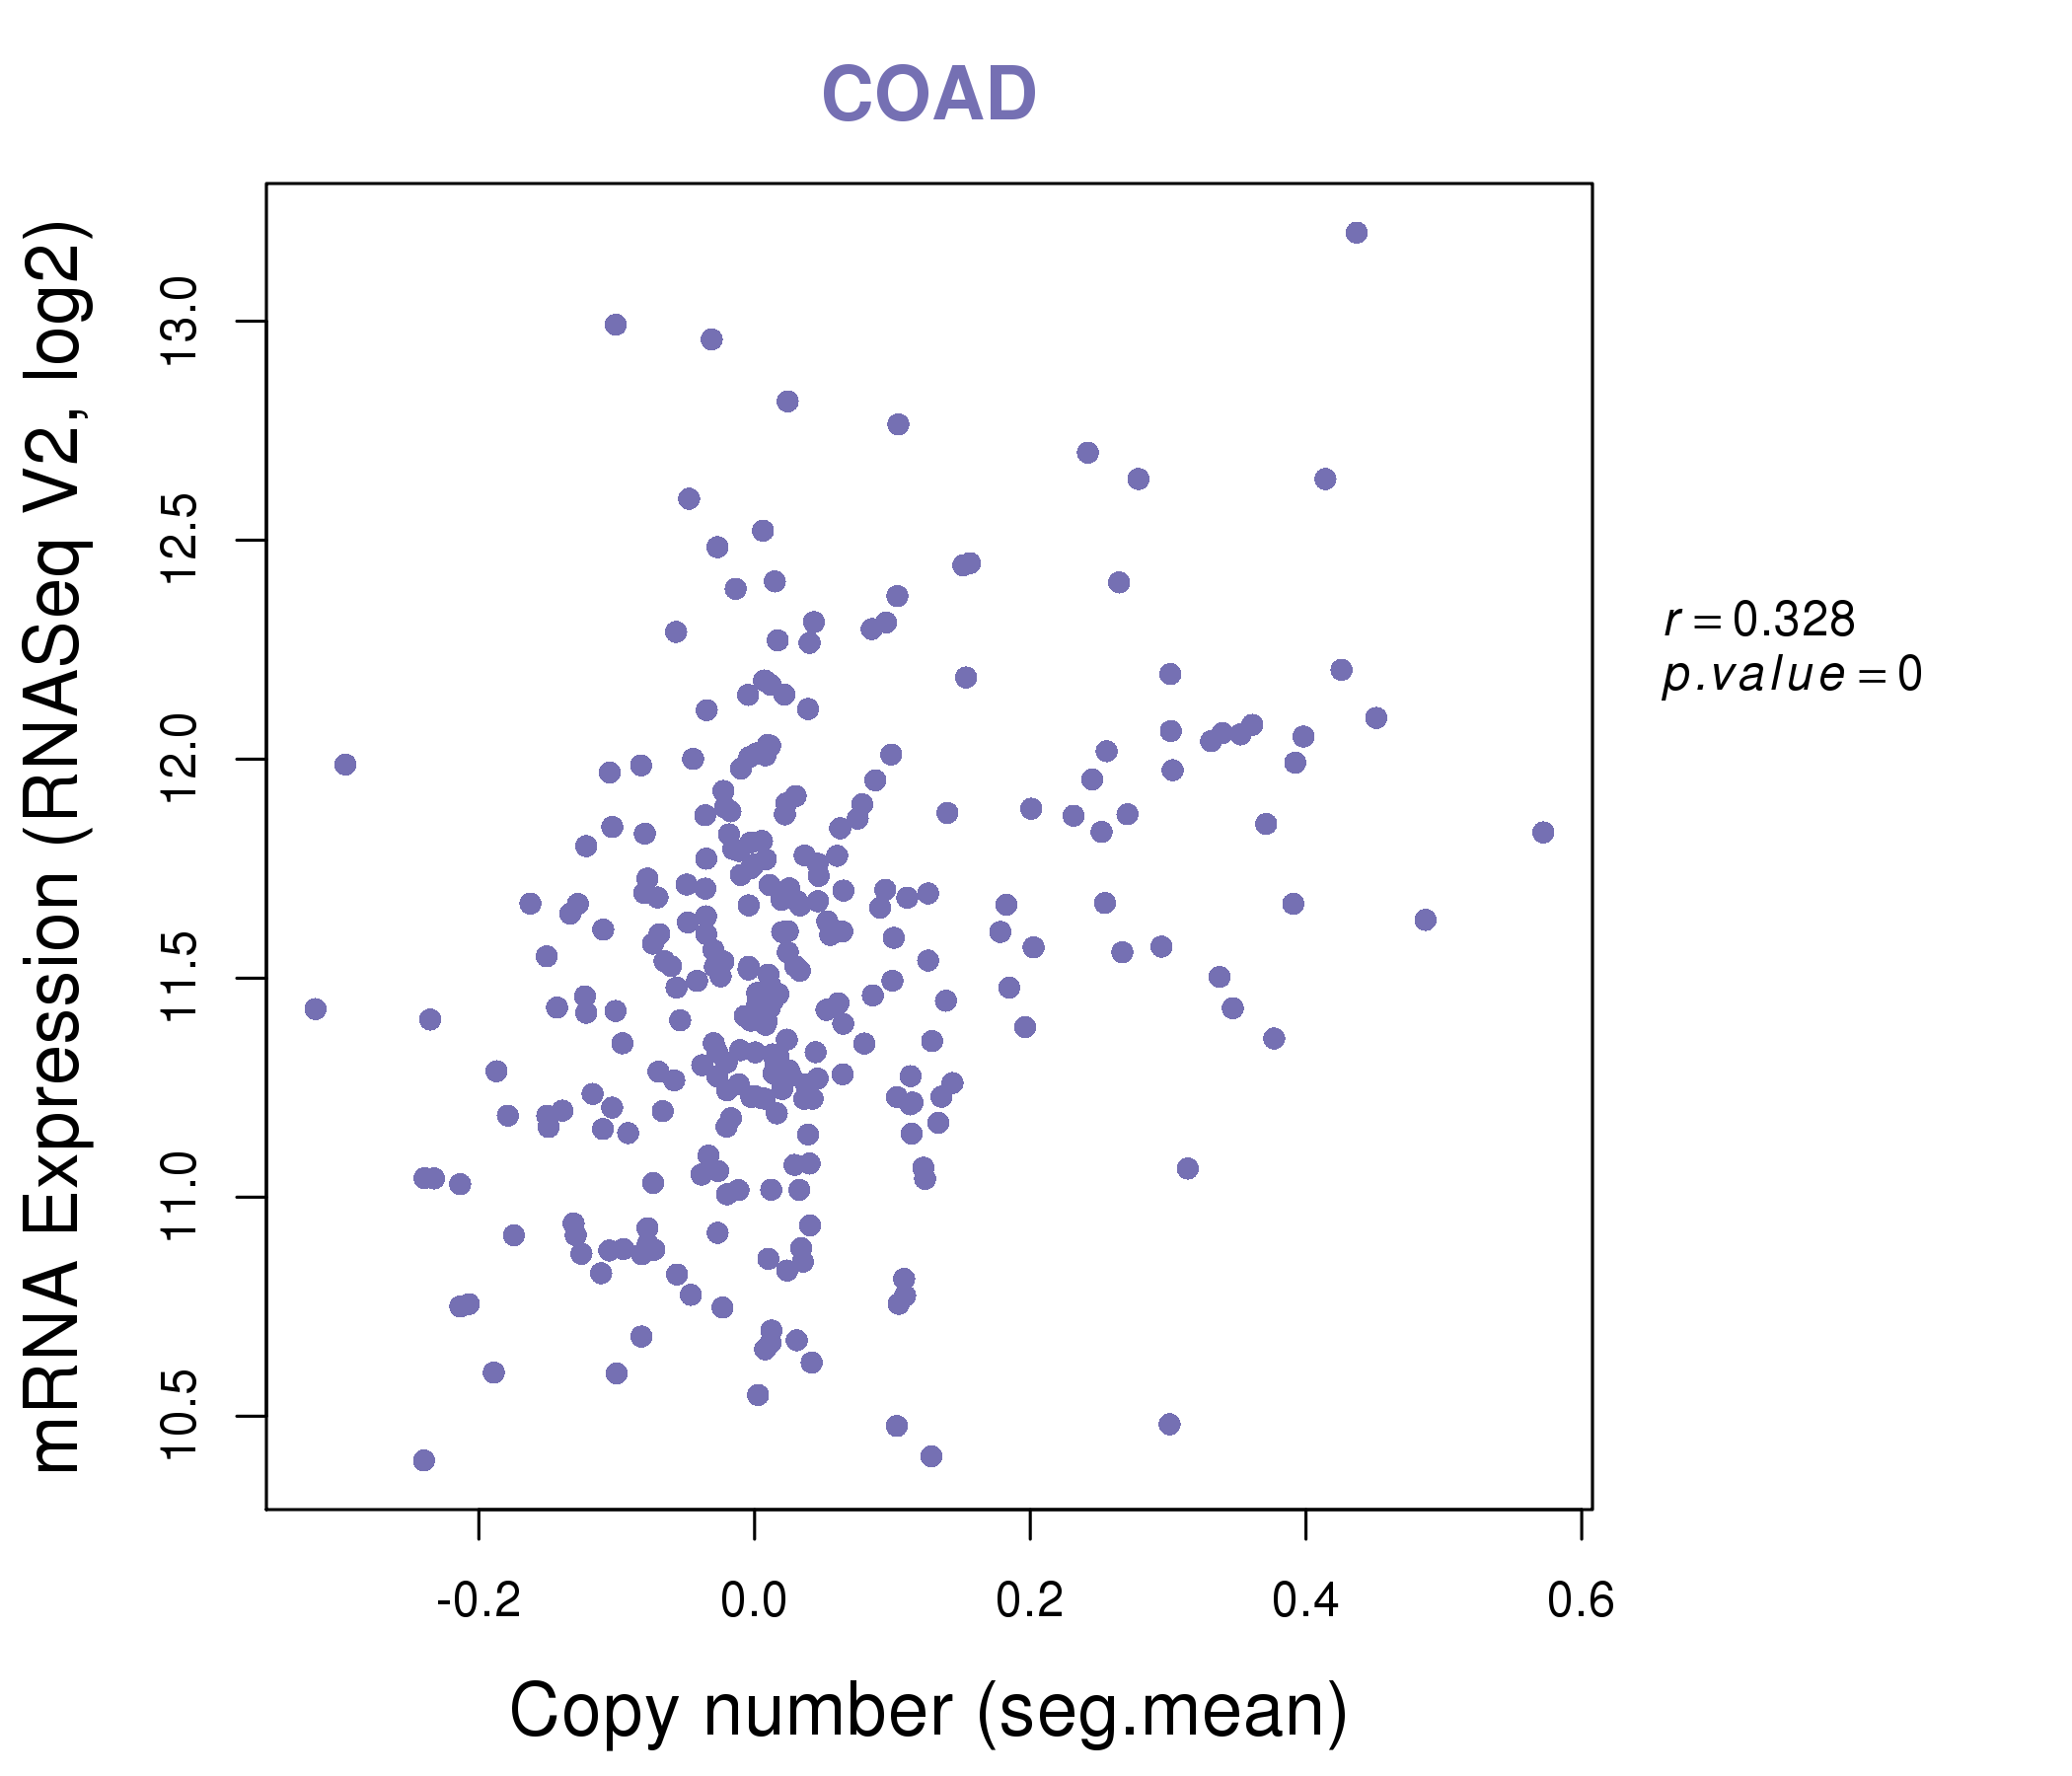
| * This plots show the correlation between CNV and gene expression. |
: Open all plots for all cancer types
 |
|
 |
|
| Top |
| Gene-Gene Network Information |
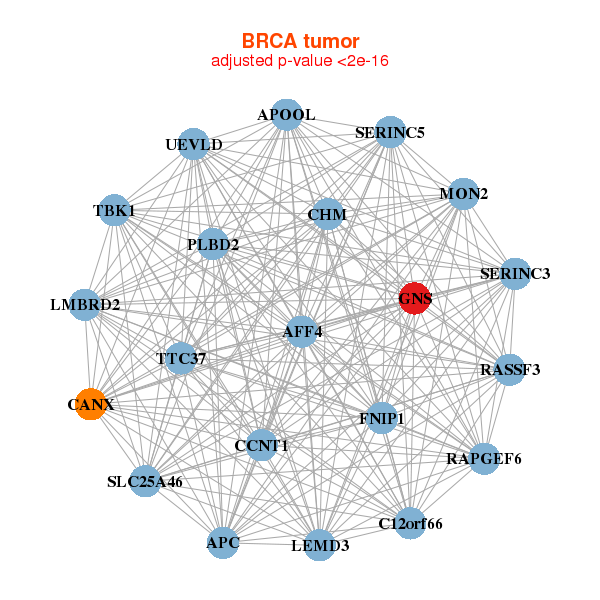
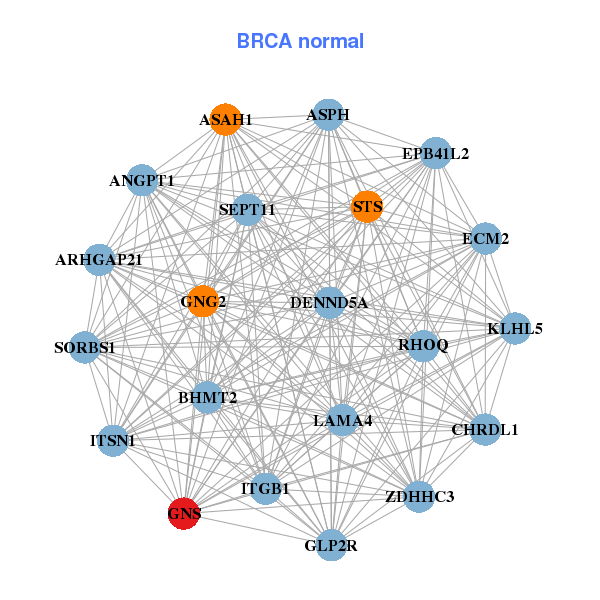
| * Co-Expression network figures were drawn using R package igraph. Only the top 20 genes with the highest correlations were shown. Red circle: input gene, orange circle: cell metabolism gene, sky circle: other gene |
: Open all plots for all cancer types
 |
|
| AFF4,APC,APOOL,C12orf66,CANX,CCNT1,CHM, FNIP1,GNS,LEMD3,LMBRD2,MON2,PLBD2,RAPGEF6, RASSF3,SERINC3,SERINC5,SLC25A46,TBK1,TTC37,UEVLD | ANGPT1,ARHGAP21,ASAH1,ASPH,BHMT2,CHRDL1,DENND5A, ECM2,EPB41L2,GLP2R,GNG2,GNS,ITGB1,ITSN1, KLHL5,LAMA4,RHOQ,SEPT11,SORBS1,STS,ZDHHC3 |
 |
|
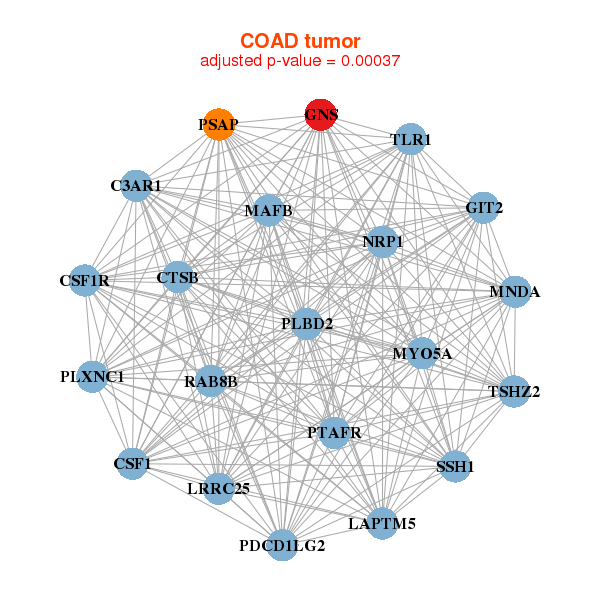
| C3AR1,CSF1,CSF1R,CTSB,GIT2,GNS,LAPTM5, LRRC25,MAFB,MNDA,MYO5A,NRP1,PDCD1LG2,PLBD2, PLXNC1,PSAP,PTAFR,RAB8B,SSH1,TLR1,TSHZ2 | ABCD1,AHCYL1,APC,ATRN,CREB3L2,EXOC6B,GNS, LONP2,MAOB,NBAS,NUCB1,OSR2,PI4K2A,PLOD1, SEC31A,SIRPA,SLC9A6,SMC3,TMEM25,TPP1,UBE2R2 |
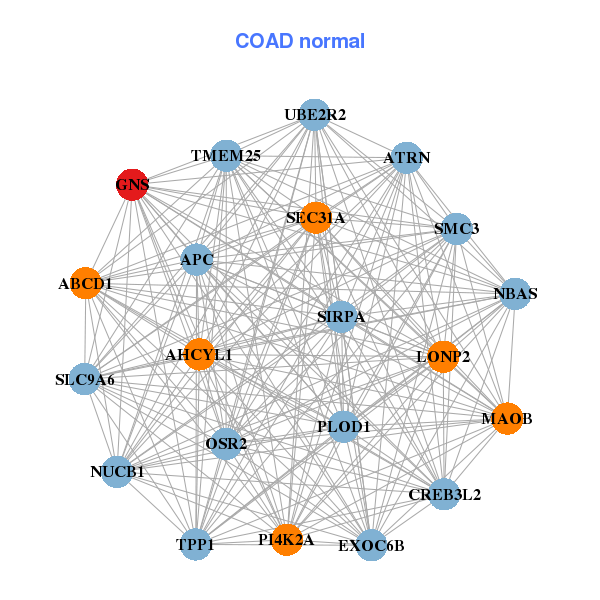
| * Co-Expression network figures were drawn using R package igraph. Only the top 20 genes with the highest correlations were shown. Red circle: input gene, orange circle: cell metabolism gene, sky circle: other gene |
: Open all plots for all cancer types
| Top |
: Open all interacting genes' information including KEGG pathway for all interacting genes from DAVID
| Top |
| Pharmacological Information for GNS |
| There's no related Drug. |
| Top |
| Cross referenced IDs for GNS |
| * We obtained these cross-references from Uniprot database. It covers 150 different DBs, 18 categories. http://www.uniprot.org/help/cross_references_section |
: Open all cross reference information
|
Copyright © 2016-Present - The Univsersity of Texas Health Science Center at Houston @ |